Abstract
This study addresses the issues of the reduced strength and increased brittleness of non-autoclaved aerated concrete by introducing an ionic modifying additive (MIA) derived from lignin-rich softwood sawdust. The additive is intended to reduce internal stresses during hydration and enhance the stability of the pore structure. Concrete samples containing 10%, 20%, and 30% additive are tested for compressive strength, wear resistance, water absorption, frost resistance, thermal conductivity, and mineral composition. Optimising the MIA content to 20% increases compressive strength by 19%, improves wear resistance by 15%, reduces water absorption by 22%, and achieves a frost resistance class of F50 versus F30 for the control sample. An X-ray diffraction analysis shows a reduction in the portlandite content from 52% to 31%, as well as increased calcite and hatrurite formation. These results confirm that the MIA optimises hydration, enhances microstructural homogeneity, and significantly extends the service life of non-autoclaved aerated concrete under cyclic freeze–thaw conditions.
1. Introduction
Currently, the construction sector of Kazakhstan faces the challenge of reducing energy consumption in both the production of building materials and structures and in the operational phase of buildings. Kazakhstan is actively developing innovative technologies, promoting industrial diversification and value-added growth in both the raw materials sector and knowledge-intensive production [1]. One of the most effective materials for achieving these goals is aerated concrete. Based on curing conditions, aerated concrete is categorised into autoclaved and non-autoclaved types. Autoclave technology, developed in 1924 at the Technical College of Stockholm, is more advanced, has extensive production experience, and ensures high-quality, durable products [2]. Using autoclaved aerated concrete for building envelope structures can significantly reduce the energy demand for space heating and cooling by 38% and 27%, respectively [3]. Additionally, the usage of cellular concrete mixes has been found to result in a lower annual energy demand and significantly reduce emissions associated with the energy consumption of a small house (55.8 m2) [4].
Cellular concretes, including aerated concretes, have a low thermal conductivity coefficient and are produced from inexpensive raw materials. When producing aerated concrete products, autoclaved aerated concrete is commonly preferred, as it yields products with sufficiently high strength; however, this method is also characterised by high energy consumption [5]. Due to the relatively low shrinkage rate of products, around 1.0–1.5 mm/m, and the lower economic costs of production, interest in non-autoclaved cellular concrete products is growing [6,7]. Non-autoclaved aerated concrete is now a common material used in building and structural construction. One of its main advantages over autoclaved aerated concrete is that it is easier to produce, and it does not contain air binders, which contribute to the hydration of aerated concrete when it absorbs moisture. This provides a dry climate in the building while the material is in use.
Structure formation is one of the core processes in cellular concrete technology. Controlling this process is essential for producing aerated concrete with the desired properties. One effective method of managing structure formation in cellular concrete to increase strength involves treating the freshly prepared mixture with a variable electric field. A notable feature of these new technologies is their ability to influence the formation of the material’s structure at all stages of production [8]. One disadvantage of non-autoclaved aerated concrete is its constant strength gain and high internal stress in the cell walls, which leads to increased brittleness of the material. This is due to the large amount of Portland cement and the presence of alkali, which is used for the vapour-forming effect and saponification of aluminium powder. When producing non-autoclaved aerated concrete, it is important to create conditions that allow for the stable formation of tobermorite gel [9]. The disadvantages of aerated concrete also include high water absorption and low resistance to freezing and thawing cycles due to its porous structure. Introducing a polymer component into the material’s composition ensures the hydrophobicity of the cell walls and reduces the space in the communicating porous structure, increasing resistance to freezing and thawing by 53% [10]. In this context, methods of intensifying the hydration process and improving the structure of the cementitious substance in non-autoclaved aerated concrete are of practical interest, as they will provide sufficient strength at a reduced average density.
During the production of aerated concrete products in various technological lines, a pressing issue has emerged regarding the spalling of aerated concrete over its service life. This phenomenon is attributed to the presence of lime within the structure, forming a partially hydrated cementitious system containing hydration crystals that are primarily composed of calcium hydroaluminates. The formation of Ca(OH)2 is accompanied by significant volumetric expansion, which causes internal stresses and deformations in concrete [11]. It has been established that calcium hydroaluminate formation in cement paste occurs rapidly [12,13,14,15]. Within the first ten minutes after mixing cement with water, the system accumulates new formations of the C3AH6 type at a colloidal dispersion level, creating a spatial coagulation structure. The addition of water to cement leads to the rapid dissolution of both gypsum and clinker minerals; the formation of Ca2+, OH−, and SO4− ions; and differences in ion concentrations in the liquid phase at different stages and the phenomenon of supersaturation necessary for the formation of the ettringite phase [12]. Over the next 30 min, there is a rapid increase in plastic strength, driven by interactions between the newly formed particles and the growth of calcium hydroaluminate crystals. In non-autoclave aerated concrete production, hardening process accelerators are used to minimise material shrinkage [13]. The intensification of the hydration process, in turn, leads to the excessive formation of Ca(OH)2 portlandite, which causes the formation of thin pore walls and the appearance of cracks on the surface of aerated concrete.
Various ionic additives are used to regulate the setting time of the mixture, stabilise the hydration process of cement systems, and improve the plasticity and mobility of the mixture. When using the aluminoferrite–gypsum hardening additive (AFCS), the porosity of cement stone decreases by 15–23% both during storage under normal conditions and in various aggressive solutions. Replacing part of the Portland cement with the AFCS additive leads to an increase in the strength and water resistance of concrete, resulting in fine-grained concrete without shrinkage [16]. The use of lithium chloride-based additives significantly reduces the setting time [17]. Additives based on natural ingredients, namely, prickly pear slime (nopal mucilage) and Ixtle fibre, increase the compressive and bending strength of concrete by more than 2 times. They also help reduce heat transfer and activate crystallisation by increasing the concentration of calcium (Ca) and potassium (K) ions [18]. In light of the positive experience of using ionic additives in non-autoclaved aerated concrete, a proposal was made for the composition and production method of a modifying ionic additive based on natural lignin.
This study is the first to investigate the causes of the decreased strength and increased brittleness of non-autoclaved aerated concrete. The authors developed an additive composition that reduces the internal stress of the cell walls of non-autoclaved aerated concrete during the hydration process.
The objectives of this study were to examine the physical and mechanical properties of non-autoclaved aerated concrete and determine the optimal concrete mixture proportions in order to solve engineering problems. To achieve these objectives, the following tasks were carried out:
- Production technology for and the composition of an ionic modifying additive obtained from wood processing industry waste were proposed.
- A composition was developed for achieving the optimum characteristics of aerated concrete using different amounts of the additive.
- Methods for determining the qualitative characteristics of aerated concrete were identified.
- The results of the conducted experiments were analysed.
The production of the non-autoclaved aerated concrete with the MIA additive was carried out at the production base of the L.N. Gumilyov Eurasian National University (ENU).
Laboratory tests of mixtures and samples of non-autoclaved aerated concrete were carried out at the “ENU-lab” Research and Production Center.
2. Materials and Methods
2.1. Materials
Leaching technology was used to produce a modifying ionic additive (MIA) from wood processing industry waste.
The main raw material used to produce the additive was wood processing waste in the form of sawdust from coniferous plants. Coniferous plants have the advantage of having a high lignin content between 25 and 50 per cent, whereas hardwoods have a lignin content between 15 and 25 per cent. The additive’s main component is the resulting lignin. To produce the MIA, softwood sawdust was placed in a reactor, and the leaching process began with heating to 90 °C for 8 h, after which the resulting concentrate was cooled naturally. Next, a maximum of 30% sulphuric acid was added to neutralise the obtained additive. After standing for 10 h, the additive was filtered to remove the solid sawdust and salt particles formed during neutralisation. Then, acrylic latex was added to the mixture at a concentration of 0.2% by weight of the mortar. This component promoted the bulk polymerisation of the cement stone, giving the aerated concrete hydrophobic properties. Figure 1 shows the additive production scheme.
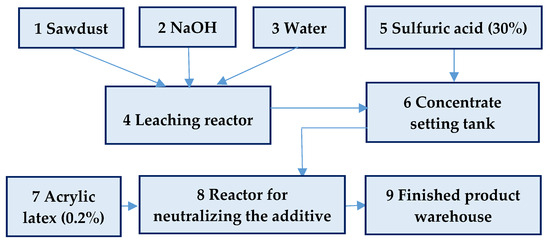
Figure 1.
Additive production scheme.
For the production of the modifying ionic additive in reactor (4), a concentrate of a lignin solution with a high alkaline medium was obtained by leaching sawdust (1), caustic sodium (2), and water (3). Next, the resulting concentrate was transferred to a container (6) for neutralisation with sulphuric acid (5), with a concentration not exceeding 30%. Next, the neutralised lignin solution was combined in reactor (8) with acrylic latex (7). The resulting additive was sent to a container for finished products (9).
The production of the additive required high precision of all components, as well as the constant control of hydrogen values (no more than 8), as this parameter determines the quality and effectiveness of the modifier. Table 1 shows the composition of the MIA.

Table 1.
Composition of the MIA.
In theory, adding a modifying ionic additive to an aerated concrete mixture should result in the hydrated cement grains becoming centres for the formation of hydration crystals. This would accelerate the structure formation and hardening processes of aerated concrete products. The polymer-containing component would also increase the hydrophobic properties of the concrete, thereby improving its operational suitability [7,10]. In the existing production process at the plant, the introduction of a plasticiser, specifically a modifying ionic additive (MIA), into the base mix with a target density of D700 was incorporated. The addition of sodium sulphonate to the dry mix was proposed as a structuring additive. An experiment was conducted to assess the impact of varying the quantity of the additive on the quality metrics of the aerated concrete. The experiment involved using additive quantities ranging from 10% to 30% of the cement mass, with the aim of achieving a density of D700 (RS—reference sample without the additive; AC10, AC20, and AC30—samples with the MIA additive). Production of the experimental non-autoclaved aerated concrete samples took place at the production base of L. N. Gumilyov Eurasian National University (ENU). All samples were moulded under plant conditions: the control mix RS and AC10 AC20, and AC30 with the MIA additive. The names of the aerated concrete mix compositions, along with the percentage of additive in each, are listed in the Table 2.

Table 2.
Compositions of aerated concrete mixes with modifying ionic additive.
The moulded products made of cellular concrete were cut into cube samples with a side of 10 cm.
2.2. Methods
Tests were carried out in an accredited laboratory using certified equipment and the standard methods described in the regulations.
To determine the optimal composition for the use of aerated concrete, the following characteristics were assessed: strength (Figure 2a), wear resistance (Figure 2b), water absorption (Figure 2c), frost resistance (Figure 2d), and thermal conductivity (Figure 2e). To study the characteristics of structure formation, an X-ray diffraction analysis was conducted on the material with the optimal and control compositions.
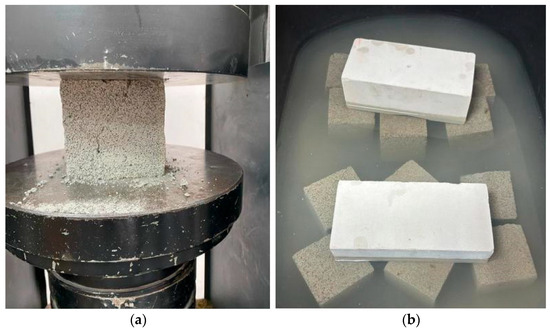
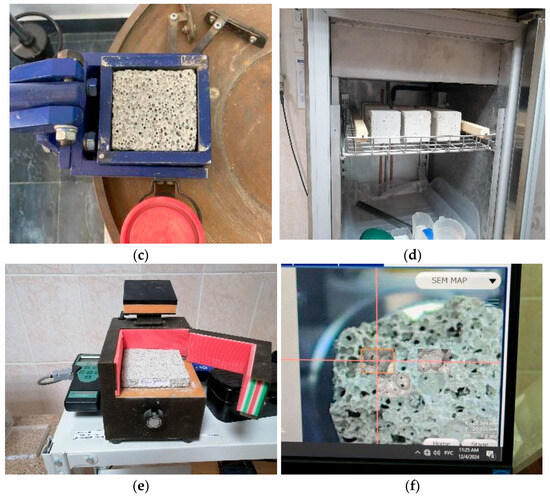
Figure 2.
Laboratory testing complex: (a) compressive strength; (b) water absorption; (c) wear resistance; (d) frost resistance; (e) thermal resistance and conductivity; (f) X-ray diffraction analysis.
Specialised equipment was used to test the mechanical properties: a PGM-500MG4 hydraulic press (Controls S.p.A., Milan, Italy), an LKI wear resistance circle (NPO Stroymash, Saint Petersburg, Russia), a CTF freezing chamber (Termotron, Bryansk, Russia), and an ITP MG4 thermal conductivity device (LLC Izmeritel, Kazan, Russia) (Figure 2a–e). An X-ray structural analysis of cellular concrete samples was performed on a DRON-3 automatic diffractometer (Burevestnik, Saint Petersburg, Russia) (Figure 2f). The equipment used has calibration certificates, and it allows for accurate measurements of the mechanical properties of cellular concrete, which is crucial for assessing its performance properties and durability in construction.
Strength was determined in accordance with GOST 10180-2012 [19]. Samples were taken from products made with the AC1, AC2, AC3, and AC4 compositions, measuring 300 × 250 × 600 mm. From these samples, cubes measuring 100 × 100 × 100 mm were cut from the upper, middle, and lower parts of the product. During the compression test, load was applied to the sample at a constant rate of (0.6 ± 0.2) MPa/s until failure occurred.
Wear resistance was determined in accordance with the methodology outlined in GOST 13087-2018 [20]. After placing the sample and applying an abrasive to the wear disk, the drive of the disk was activated, and abrasion was conducted. The samples were installed in special sockets on the abrasion circle. After installation, the free movement of the samples in the vertical plane was checked. After four testing cycles, the samples were removed from their slots, wiped with a dry cloth, measured for height, and weighed. Water-saturated samples were placed in water for 30 min, then wiped with a damp cloth, and weighed.
Water absorption tests were carried out in accordance with GOST 12730.3 [21]. The tests were performed on cube-shaped specimens with dimensions of 100 × 100 × 100 mm. The water absorption capacity was evaluated by immersing the samples in water until full saturation was achieved. Full water saturation was determined by stabilising the mass of the saturated sample: a mass change of no more than 1% after 24 h of water immersion was considered as the saturation criterion.
Frost resistance tests were conducted according to Interstate Standard (GOST) 10060-2020 [22]. The basic method of cyclic freezing and thawing of water-saturated samples was used. Freezing was carried out at a temperature of −18 ± 2 °C, and thawing was carried out at +20 ± 2 °C. The freezing duration was at least 2.5 h, and thawing lasted for at least 2 ± 0.5 h. After completing the specified number of freeze–thaw cycles, the samples were assessed for mass loss and residual compressive strength. The specimens used in these tests were cube-shaped and had the same dimensions as those used in the compressive strength tests.
Thermal conductivity tests were performed in accordance with GOST 7076 [23]. The ITP MG4 device is characterised by high accuracy and measurement stability, making it suitable for investigating the thermal insulation properties of aerated concrete. Prior to testing, an ITP MG4 device was calibrated using a reference calibration sample with a thermal conductivity value of λ = (±0.006 W/(m·K)). The samples were prepared in accordance with the requirements to ensure uniform contact with the heating and cooling elements of the device. The test specimens were prepared in the form of rectangular parallelepipeds, with the largest (front) faces shaped as squares measuring 100 × 100 mm with a thickness of 2 mm.
The operating principle of the device is based on the creation of a steady-state heat flow passing through a flat specimen and directed perpendicularly to its front surfaces. The measurement involves determining the specimen’s thickness, the heat flux density, and the temperatures of the opposing front faces.
An X-ray diffraction analysis was conducted on an automated diffractometer DRON-3 using CuKα radiation with a β-filter. The conditions for collecting diffractograms were as follows: U = 35 kV; I = 20 mA; a scanning mode of θ-2θ; and a detector speed of 2 degrees/min. An X-ray phase analysis was performed on a semi-quantitative basis using diffractograms of powder samples, employing the equal weights method and artificial mixtures. The quantitative ratios of crystalline phases were determined. The interpretation of the diffractograms was carried out using data from the ICDD database: Powder Diffraction File (PDF 2) Release 2022 and HighScorePlus software (version 5.2).
As the subject of this study was non-autoclaved aerated concrete, the vertical inhomogeneity of the material (along its height) played a significant role. This variation is associated with the formation process of gas and its release from pores closer to the surface of the fresh mix. Given that the additive promotes improved pore structuring due to the activity of its ions, all tests were conducted in three vertically distinct locations within the samples to assess structural uniformity (see Figure 3).
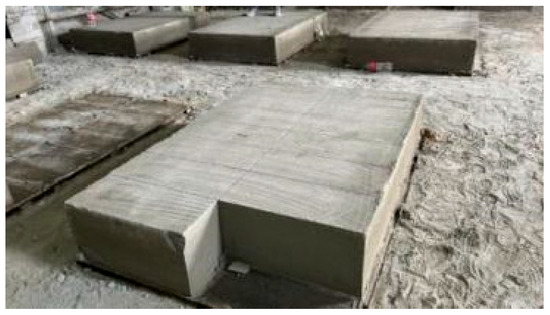
Figure 3.
Obtaining samples of non-autoclaved aerated concrete for testing.
To ensure the reliability of the statistical data, all tests were conducted on 10 specimens of each compared type.
Generative Artificial Intelligence (GenAI) tools were not used in this study.
3. Results
3.1. Compressive Strength
The results of the compression strength tests on the aerated concrete samples with varying amounts of the MIA are presented in Figure 4.
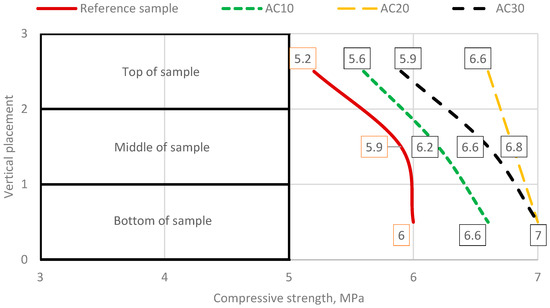
Figure 4.
Results of compression strength testing.
The strengths of the RS specimens range from 5.2 to 6.0 MPa, with an average of 5.7 MPa. The same values for the AC10 specimens range from 5.6 to 6.6 MPa, with an average of 6.1 MPa. For the AC20 specimens, the strengths range from 6.6 to 7.0 MPa, with an average of 6.8, and, for the AC30 specimens, they range from 5.9 to 7.0 MPa, with an average of 6.5 MPa. The average strengths of the AC20 specimens have the highest values, exceeding the RS values by 19.3%, the AC10 values by 10.9%, and the AC30 values by 4.6%. The coefficients of variation of the compared specimens are not identical: those of the RS samples vary between 4.18 and 4.62%, those of the AC10 samples vary between 3.45 and 3.96%, those of the AC20 samples vary between 3.08 and 3.41%, and those of the AC30 samples vary between 2.97 and 3.52%. Thus, with the inclusion of the additive, an improvement in the volumetric stability of the porous structure of the material is observed, both in terms of the strength values and with respect to the reduction in the variation of datapoints, which favours the improvement of the porous structure of the samples. Based on the conducted strength studies, it can be concluded that the AC20 sample is the most optimal, exhibiting the highest average compressive strength and a small variation in the upper, middle, and lower parts of the product. This indicates the stability of the pore formation process, the stability of the product’s structure, and its strength. The obtained data confirm the results presented in the works of H. Jin, G. Zhang, D.S. Dyussembinov, J. Chen, and others, which describe the influence of active ions on the mineralogical composition [24,25,26,27,28]. The principal feature and advantage of the proposed MIA additive is the use of sawdust to produce a natural polymer that promotes the formation of a denser and more homogeneous tobermarite gel.
3.2. Wear Resistance
The results of the wear resistance tests on the aerated concrete samples are presented in Figure 5.
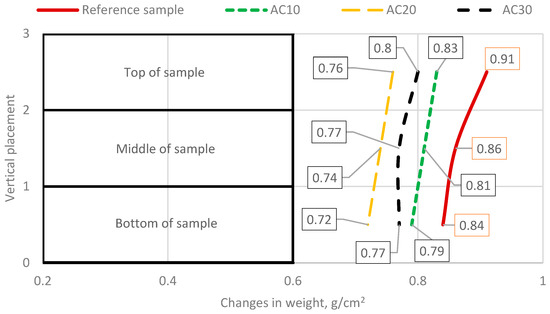
Figure 5.
Results of wear resistance testing.
The results of the conducted wear resistance studies confirm the influence of certain quantities of the modifying ionic additive (MIA) on the product’s resistance to spalling during operation and storage. Among the results obtained, the lowest wear resistance values are observed for RC, with the datapoints of the RS ranging from 0.84 to 0.91 g/cm2. The same indices for the AC10 samples range from 0.79 to 0.83 g/cm2, those for the AC20 samples range from 0.72 to 0.76 g/cm2, and those for the AC30 samples range from 0.77 to 0.80 g/cm2. The greatest variation in datapoints is observed for the RS specimens, which indicates the heterogeneity of the material in the vertical direction, in contrast to the AC20 specimens, where the smallest variation of datapoints is observed. In terms of wear resistance, the RC samples correspond to wear resistance class G2–G3, the AC20 samples correspond to wear resistance class G2–G3, and the AC20 and AC30 samples correspond to wear resistance class G1.
The best wear resistance was observed in the AC20 sample, exceeding that of the RC samples by 15% and that of the AC10 and AC30 samples by 9 and 5%, respectively. No notable differences were observed in the coefficients of variation with respect to the compared specimen types. The coefficients of variation did not exceed 5.8% in any of the test series, which suggests a close relationship, as well as indicating that the results obtained have a high degree of reliability.
Based on the strength and abrasion resistance data obtained from the tested specimens, the optimal composition with the additive was selected. The selected parameters confirm that using a modifying ionic additive reduces the internal stress of concrete caused by an alkaline environment when caustic soda is added to the aerated concrete mortar composition. The interaction between portlandite and caustic soda increases the alkalinity of the mortar, accelerating the hydration processes accompanied by interactions with aluminium oxides. As a result, internal stresses arise in the aerated concrete structure [11,12]. Compared with the samples in these studies, the MIA supplement effectively compensates for the negative effects of excess portlandite. When used alongside acrylic latex, lignosulfonate encourages the development of stronger pore walls.
3.3. Water Absorption
Figure 6 shows the water absorption results of the samples.
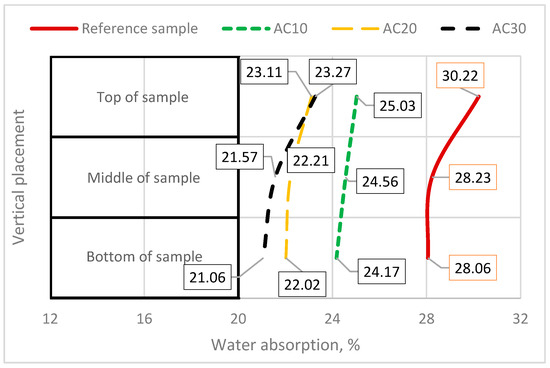
Figure 6.
Water absorption results.
In the water absorption results, the maximum values were observed in the RS samples depending on the location, ranging from 28.06 to 30.22%, with an average of 28.84%. The minimum values were logically observed in the samples with the maximum content of the hydrophobising additive, that is, the AC30 samples, ranging from 21.06 to 23.27%, with an average value of 21.97%. It should be noted that the effectiveness of the additive decreased with an increase in its content in the aerated concrete composition, as the water absorption values of the AC20 samples did not differ much from those of the AC30 samples, ranging from 22.02 to 23.11%, with an average of 22.44%. The maximum effect (but not the maximum value) of the hydrophobising additive was observed at the initial introduction of the additive in the AC10 samples, ranging from 24.17 to 25.03%, with an average of 24.59%.
While the reduction in water absorption was 22% at the initial introduction of the additive (difference between RS and AC10), when the additive concentration was subsequently increased, the reduction was only 2% (difference between AC30 and AC20).
The obtained results are comparable to those in [9,12], where the hydrophobisation effect achieved by adding a plasticising component to the concrete composition led to a 2.1-fold increase in water absorption.
3.4. Frost Resistance
Figure 7 and Figure 8 show the frost resistance results of the samples, i.e., the indices of their strengths after cyclic freezing and thawing. Figure 7 shows the frost resistance results obtained in the lower locations of the compared specimen types, and Figure 8 and Figure 9 show those obtained in the middle and upper locations, respectively. Figure 10 shows the average strength loss of the specimens (regardless of location) as a percentage of the original strength.
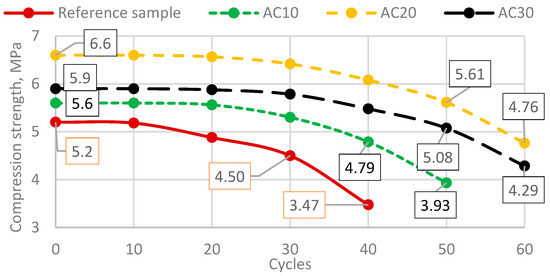
Figure 7.
Frost resistance results obtained at the bottom of the samples.
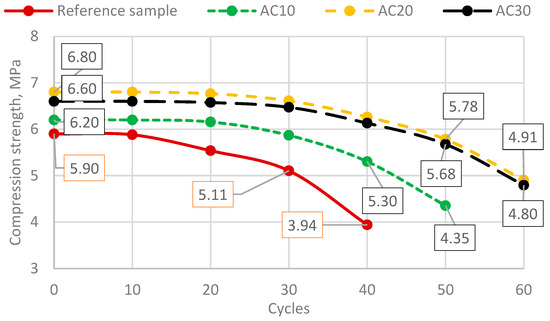
Figure 8.
Frost resistance results obtained in the middle of the samples.
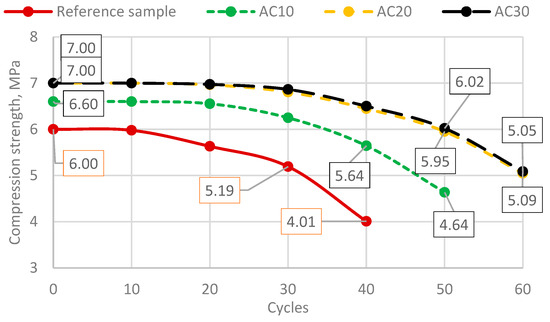
Figure 9.
Frost resistance results obtained at the top of the samples.
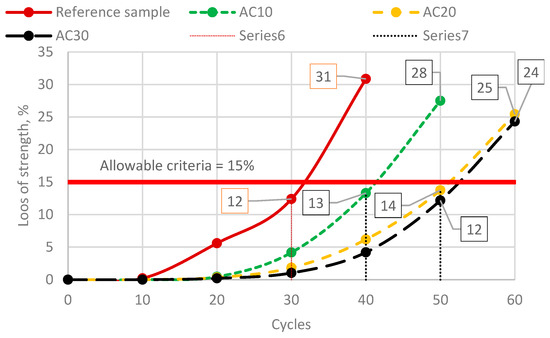
Figure 10.
Loss of strength.
The results of the frost resistance tests showed that the RS specimens had the lowest resistance to cyclic temperature loading. The maximum number of freezing and thawing cycles, at which the limit of strength loss in the lower locations of the specimens (15% of the initial strength) was reached, was 40 cycles. Consequently, the residual strength at the permissible number of cycles (30 cycles) was 4.50 MPa. For the AC10 specimens, the residual strength was 4.79%, and the maximum number of allowable cycles was 40 cycles. For the AC20 and 30 samples, the permissible number of cycles was 50 cycles, corresponding to residual strengths of 5.61 and 5.08 MPa. In the middle and upper locations of the specimens, the number of allowable cycles was similar to that in the lower location as follows: RC, 30 cycles; AC10, 40 cycles; and AC20 and AC30, 50 cycles. The residual strength of the specimens in the middle location was as follows: RC, 5.11 MPa; AC10, 5.30 MPa; AC20, 5.68 MPa; and AC30, 5.78 MPa. The residual strength of the specimens in the upper location was as follows: RC, 5.19 MPa; AC10, 5.64 MPa; AC20, 5.95 MPa; and AC30, 6.02 MPa. Thus, the RC samples were classified as F30, the AC10 samples were classified as F40, and the AC20 and AC30 samples were classified as F50. The coefficients of variation increased with an increasing number of freezing and thawing cycles: in the initial cycles (up to 20 cycles), they did not exceed 10%, and in the final cycles, they exceeded 20%. Nevertheless, the maximum variation in the data of the final cycles was observed in the RC samples, with a coefficient of variation of 32%, and the minimum variation was observed in the AC30 samples, with a coefficient of variation of 21%.
It is logical that the specimens with the maximum admixture content had the greatest frost resistance because frost resistance depends on the degree of water saturation of the specimens. In other words, the more hydrophobic the concrete, the less damaging the effect of cyclic freezing and thawing. Therefore, polymerisation of the concrete structure with acrylic latex improves the performance characteristics of aerated concrete. The obtained results are comparable to those in [7,8,10], where the hydrophobisation effect achieved by adding an active component to the concrete composition led to a 1.8-fold increase in frost resistance. Compared with the samples in [7,8], the MIA additive demonstrates higher indicators of frost resistance. The frost resistance results are comparable to those of the aerated concrete samples in [10] due to the action of the polymer and emulsified components of the additives under consideration.
3.5. Thermal Resistance and Conductivity
Table 3 shows the thermal resistance and conductivity results of the samples.

Table 3.
Thermal resistance and conductivity results.
In the obtained results, a large scatter of values is logically observed for the RS samples, which is primarily due to their pore heterogeneity in the vertical direction. The thermal resistance values, depending on the location, deviate (increase) from the average by 14%, and the thermal conductivity values deviate by 24%. For the AC10 samples, these deviations decrease to 11% (thermal resistance) and 18% (thermal conductivity), and, for the AC20 samples, they decrease to 10% and 17%. The average thermal resistance and thermal conductivity values indicate that the maximum efficiency is achieved at a 20% concentration, as this is when the maximum increase in thermal resistance (6.4% for RS) and thermal conductivity (2.3% for RS) is achieved.
3.6. Regression Analysis of Physical and Mechanical Characteristics Data
Table 4 shows a summary of the results of the laboratory tests of the samples with varying contents of the modifying additive (0, 10, 20, and 30%).

Table 4.
Summary of results of physical and mechanical characteristics.
For the regression analysis, the independent variables in Table 4 were adjusted according to the principle of moving from the least to the most in order to enable the function to recognise an improvement in a particular quality. In other words, for some indicators (independent variables), the lowest value is best, while for others, the highest value is best. In our case, the independent variables were adjusted according to the principle that a higher value is better. For example, when assessing frost resistance by weight loss and residual strength (the required values according to GOST), the lowest mass loss is best, whereas for the loss of residual strength, the opposite is true. Therefore, the mass loss indicator was adjusted for the residual mass. Thus, a greater residual strength and residual mass are preferable. To make the figures easier to understand, all independent variables were taken from the reference sample indicator unit. This also makes it easier to understand the effect of the additive on a specific indicator. In other words, all the independent variables of the reference sample were equated to one, and the independent variables of the samples with a variable addition were recalculated relative to the reference sample unit. The latter also characterises the percentage improvement of a particular indicator. A summary of the data for the regression analysis is presented in Table 5.

Table 5.
Summary of data for regression analysis.
To process the results, the obtained values are entered into an Excel spreadsheet provided in the Supplementary Materials. When entering the obtained data into the Excel spreadsheet, a coefficient of determination of r2 = 1 is obtained; therefore, in this data sample, there is an ideal correlation and a high level of model quality. In our case, a high correlation indicator is associated with a reduction in the reference sample values to 1, as well as the conversion of independent variables based on the principle of from less to more. The “Y-intersection” indicator is −80, which indicates the influence of the MIA on the quality indicators of the samples. In our case, a negative value means that, when other factors (independent variables) decrease to 0, the MIA concentration decreases significantly. Therefore, when choosing a criterion, the higher the value of the independent variable, the greater the effect of the additive, and there is a noticeable effect of the additive on improving the physical and mechanical properties of the concrete.
3.7. X-Ray Diffraction Analysis
To determine the reasons for the increased strength and stability of the aerated concrete product, the mineralogical compositions of the crystalline phases of the control sample (Figure 11 and Table 6) and the most optimal sample AC3 (Figure 12 and Table 7) were analysed.
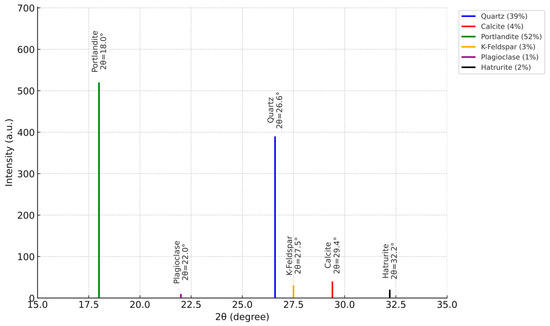
Figure 11.
XRD pattern and phase composition of the AC1 sample.

Table 6.
Results of the semi-quantitative analysis of the crystalline phases of the AC1 sample.
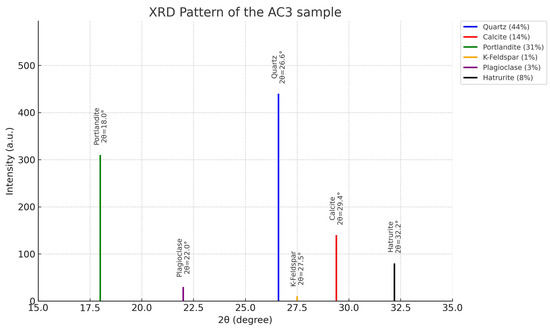
Figure 12.
XRD pattern and phase composition of the AC3 sample.

Table 7.
Results of the semi-quantitative analysis of the crystalline phases of the AC3 sample.
For the primary phases, the content was calculated. Possible impurities that could not be definitely identified due to low concentrations and the presence of only 1–2 diffraction reflections or poor crystallinity are indicated in Table 6.
This study shows that adding a modifying ionic additive to the aerated concrete composition decreases the amount of portlandite and increases the percentage of calcite and haturrite. This confirms the theory that portlandite influences the spalling of the product’s surface [29].
4. Discussion
In terms of energy efficiency, non-autoclaved aerated concrete is one of the most popular materials in the construction industry. However, due to the specific nature of the technology and composition selection in the production of aerated concrete, many questions remain regarding the performance characteristics of the resulting material. It is well known that, during hydration, portlandite is the main component that promotes ion movement in concrete under moisture adsorption conditions.
The primary strength gain during the cement stone curing process is provided by aluminium oxide, which increases the concrete’s stress, creating a strong yet brittle structure. Additionally, aluminium only becomes active in an ionic state when an alkaline environment and an elevated temperature, caused by a chemical reaction, are present. Therefore, when the alkalinity of the cement stone increases, its strength increases rapidly due to the high aluminium ion content. However, this process increases not only the stress but also the intensity of salt migration in the cement stone structure, consequently leading to the corrosion of the material. In the production of non-autoclaved aerated concrete, internal stress in the interstitial partitions leads to crack formation on the product’s surface.
Thus, having analysed the results of this study, we can conclude that using a modifying ionic additive reduces the amount of portlandite in the structure. This effect is evident throughout the research process: the strength index of the aerated concrete specimen containing the MIA additive is due to the reduction in portlandite activity during hydration. Lignosulfonate ions react with free calcium, reducing its excess in the solution and blocking the growth of large, disordered crystals. This forms a denser gel phase. Due to the partial polymerisation of the walls of the communicating cells, their brittleness is reduced, thereby increasing the material’s overall wear resistance. The formation of a denser cement matrix reduces the water absorption of the aerated concrete, thereby increasing its frost resistance.
The main principle of action of the ionic additive modifier is the activity of sulphur bound in a chemical compound with a weak, unstable base. During the migration of portlandite through the cement stone structure, sulphur transitions to a new state, forming gypsum particles. This neutralises the excessive activity of the alkaline medium and provides micro-reinforcement of the cement stone structure. Therefore, using a modifying ionic additive neutralises an increased alkaline environment and reduces internal stress by promoting the chemical reaction that forms gypsum particles, which strengthen the cement stone structure.
5. Conclusions
This article describes experiments conducted with the aim of identifying the causes of the decreased strength and increased brittleness of non-autoclaved aerated concrete.
As part of the study of the physico-mechanical and chemical properties of aerated concrete, it was determined that the main reason for the decrease in characteristics was internal stress in the concrete during hydration. To mitigate this issue, a modifying ionic additive was developed and investigated.
- Adding 20% modifying ionic additive (MIA) by cement mass yielded the highest compressive strength (19% higher than the reference value), improved wear resistance by 15%, and reduced water absorption by 22%. However, increasing the dosage to 30% yielded no significant benefits and, in some cases, slightly reduced performance.
- Applying the MIA increased the frost resistance of the modified samples from class F30 to F50, with the residual strength after freeze–thaw cycles reaching 86% of the initial value for the optimal mix.
- An X-ray diffraction analysis revealed a reduction in the portlandite content from 52% to 31%, as well as an increase in the calcite and hatrurite fractions. This indicates lower internal stresses and the formation of a denser, more homogeneous cement matrix.
Thus, the additive in optimal proportions not only contributes to increased plasticity of the cement binder but also affects the mineral formation process during hydration.
Supplementary Materials
The following supporting information can be downloaded at: https://www.mdpi.com/article/10.3390/eng6100249/s1, Analysis.
Author Contributions
Conceptualisation, Y.S. and N.B.; methodology, N.B. and R.L.; software, A.Z.; validation, Y.S.; formal analysis, N.B.; investigation, R.L.; resources, A.J.; data curation, R.L.; writing—original draft preparation, N.B.; writing—review and editing, A.Z.; visualisation, N.B.; supervision, Y.S.; project administration, A.J.; funding acquisition, A.J. All authors have read and agreed to the published version of the manuscript.
Funding
This research was funded by the Committee of Science of the Ministry of Science and Higher Education of the Republic of Kazakhstan (Grant No. BR21882278: “Establishment of a construction and technical engineering centre to provide a full cycle of accredited services to the construction, road-building sector of the Republic of Kazakhstan”).
Data Availability Statement
The original contributions presented in this study are included in the article. Further inquiries can be directed to the corresponding authors.
Acknowledgments
The authors would like to express their gratitude to the research and production centre “ENU-lab” in conducting laboratory tests of aerated concrete.
Conflicts of Interest
The authors declare no conflicts of interest.
References
- Issatayeva, F.M.; Aubakirova, G.M.; Maussymbayeva, A.D.; Togaibayeva, L.I.; Biryukov, V.V.; Vechkinzova, E. Fuel and Energy Complex of Kazakhstan: Geological and Economic Assessment of Enterprises in the Context of Digital Transformation. Energies 2023, 16, 6002. [Google Scholar] [CrossRef]
- Turki, S.K.; Ibrahim, S.I.; Almaamori, M.H.D. The impact of incorporating waste materials on the mechanical and physical characteristics of tile adhesive materials. Open Eng. 2024, 14, 20220580. [Google Scholar] [CrossRef]
- Artino, A.; Evola, G.; Margani, G.; Marino, E.M. Seismic and Energy Retrofit of Apartment Buildings through Autoclaved Aerated Concrete (AAC) Blocks Infill Walls. Sustainability 2019, 11, 3939. [Google Scholar] [CrossRef]
- Borbon-Almada, A.C.; Lucero-Alvarez, J.; Rodriguez-Muñoz, N.A.; Ramirez-Celaya, M.; Castro-Brockman, S.; Sau-Soto, N.; Najera-Trejo, M. Design and Application of Cellular Concrete on a Mexican Residential Building and Its Influence on Energy Savings in Hot Climates: Projections to 2050. Appl. Sci. 2020, 10, 8225. [Google Scholar] [CrossRef]
- Shams, T.; Schober, G.; Heinz, D.; Seifert, S. Rice husk ash as a silica source for the production of autoclaved aerated concrete–A chance to save energy and primary resources. J. Build. Eng. 2022, 57, 104810. [Google Scholar] [CrossRef]
- Mohamad, A.; Khadraoui, F.; Chateigner, D.; Boutouil, M. Influence of Porous Structure of Non-Autoclaved Bio-Based Foamed Concrete on Mechanical Strength. Buildings 2023, 13, 2261. [Google Scholar] [CrossRef]
- Stel’makh, S.A.; Shcherban’, E.M.; Beskopylny, A.N.; Mailyan, L.R.; Meskhi, B.; Beskopylny, N.; Dotsenko, N.; Kotenko, M. Influence of Recipe Factors on the Structure and Properties of Non-Autoclaved Aerated Concrete of Increased Strength. Appl. Sci. 2022, 12, 6984. [Google Scholar] [CrossRef]
- Shaumarov, S.; Kandakhorov, S.; Babaev, A.; Kodirov, B. Modeling development of optimal composition of non-autoclaved aerated concrete based on industrial waste. E3S Web Conf. 2023, 401, 03011. [Google Scholar] [CrossRef]
- Narayanan, N.; Ramamurthy, K. Structure and properties of aerated concrete: A review. Cem. Concr. Compos. 2000, 22, 321–329. [Google Scholar] [CrossRef]
- Sabitov, Y.; Dyussembinov, D.; Zhumagulova, A.; Bazarbayev, D.; Lukpanov, R. Composite non-autoclaved aerated concrete based on an emulsion. Mag. Civ. Eng. 2021, 106, 10605. [Google Scholar] [CrossRef]
- Courard, L.; Degée, H.; Darimont, A. Effects of the presence of free lime nodules into concrete: Experimentation and modelling. Cem. Concr. Res. 2014, 64, 73–88. [Google Scholar] [CrossRef]
- Lavagna, L.; Nisticò, R. An Insight into the Chemistry of Cement—A Review. Appl. Sci. 2023, 13, 203. [Google Scholar] [CrossRef]
- Kovler, K.; Zhutovsky, S. Overview and Future Trends of Shrinkage Research. Mater. Struct. 2006, 39, 827–847. [Google Scholar] [CrossRef]
- Yakovlev, G.; Polyanskikh, I.; Gordina, A.; Pudov, I.; Černý, V.; Gumenyuk, A.; Smirnova, O. Influence of Sulphate Attack on Properties of Modified Cement Composites. Appl. Sci. 2021, 11, 8509. [Google Scholar] [CrossRef]
- Yang, S.; Bieliatynskyi, A.; Trachevskyi, V.; Shao, M.; Ta, M. Research of Nano-modified Plain Cement Concrete Mixtures and Cement-Based Concrete. Int. J. Concr. Struct. Mater. 2023, 17, 50. [Google Scholar] [CrossRef]
- Samchenko, S.V.; Kozlova, I.V.; Korshunov, A.V. Optimization of the Composition of Cement Pastes Using Combined Additives of Alumoferrites and Gypsum in Order to Increase the Durability of Concrete. Buildings 2023, 13, 565. [Google Scholar] [CrossRef]
- Sereewatthanawut, I.; Prasittisopin, L. Effects of accelerating and retarding agents on nucleation and crystal growth of calcium aluminate cement. Open Ceram. 2022, 11, 100290. [Google Scholar] [CrossRef]
- Gallegos-Villela, R.R.; Larrea-Zambrano, F.D.; Goyes-Lopez, C.E.; Perez-Sanchez, J.F.; Suarez-Dominguez, E.J.; Palacio-Perez, A. Effect of natural additives on concrete mechanical properties. Cogent Eng. 2021, 8, 1870790. [Google Scholar] [CrossRef]
- GOST 10180-2012; Concrete. Methods for Determining Strength from Control Samples. PARAGRAPH Information System. Gost Standard Group: Moscow, Russia, 2012. Available online: https://online.zakon.kz/Document/?doc_id=31523682&pos=1;-16#pos=1;-16 (accessed on 20 November 2024).
- GOST 13087-2018; Concrete. Methods for Determining Abrasion Resistance. PARAGRAPH Information System. Gost Standard Group: Moscow, Russia, 2018. Available online: https://online.zakon.kz/Document/?doc_id=35921229 (accessed on 20 November 2024).
- GOST 12730.3-2020; Concretes. Method for Determining Water Absorption (with Amendment) [WWW Document], n.d. Information System PARAGRAPH. Gost Standard Group: Moscow, Russia, 2020. Available online: https://online.zakon.kz/Document/?doc_id=36059266 (accessed on 26 July 2025).
- GOST 10060-2012; Concrete. Methods for Determining Frost Resistance (Amendment) (Amend. 1) [WWW Document], n.d. Information System PARAGRAPH. Gost Standard Group: Moscow, Russia, 2012. Available online: https://online.zakon.kz/Document/?doc_id=31521910 (accessed on 20 March 2024).
- GOST 7076-99; Construction Materials and Products. Method for Determining Thermal Conductivity and Thermal Resistance Under Steady-State Thermal Conditions [WWW Document], n.d. PARAGRAPH Information System. Gost Standard Group: Moscow, Russia. Available online: https://online.zakon.kz/Document/?doc_id=1022471 (accessed on 15 May 2024).
- Jin, H.; Cheng, L.; Liu, J.; Zhong, S. Investigation of natural diffusion behavior in concrete using iodide replacing chloride ions: The impact of mineral admixtures types and dosages. J. Mater. Res. Technol. 2024, 29, 1834–1861. [Google Scholar] [CrossRef]
- Zhang, G.; Li, M.; Zhu, Z. Effect of Aluminium Substitution on Physical Adsorption of Chloride and Sulphate Ions in Cement-Based Materials. Materials 2023, 16, 6029. [Google Scholar] [CrossRef]
- Shakhmov, Z.; Kaliyeva, Z.; Bazarbayev, D.; Dyussembinov, D.; Awwad, T.; Sabitov, Y.; Zhumagulova, A. Self-compacting concrete with finely dispersed additives and superplasticizer. Mag. Civ. Eng. 2023, 123, 12306. [Google Scholar] [CrossRef]
- Chen, J.; Jia, J.; Zhu, M. Understanding the effect of alkali content on hydration, hardening, and perfor-mance of Portland cement-a comprehensive review. Mater. Today Commun. 2024, 40, 109728. [Google Scholar] [CrossRef]
- Lukpanov, R.; Dyussembinov, D.; Altynbekova, A.; Yenkebayev, S.; Zhumagulova, A. Investigation of Effect of Proposed Two-Stage Foam Injection Method and Modified Additive on Workability of Foam Concrete. Materials 2024, 17, 2024. [Google Scholar] [CrossRef]
- Shchukina, Y.V.; Baev, M.N. Peculiarities of Properties of Non-Autoclaved Gold-Containing Gas Concrete with Chemical Additives. Polzunov Bull. 2014, 220–225. Available online: https://cyberleninka.ru/article/n/osobennosti-svoystv-neavtoklavnogo-zolosoderzhaschego-gazobetona-s-himicheskimi-dobavkami (accessed on 15 May 2025).
Disclaimer/Publisher’s Note: The statements, opinions and data contained in all publications are solely those of the individual author(s) and contributor(s) and not of MDPI and/or the editor(s). MDPI and/or the editor(s) disclaim responsibility for any injury to people or property resulting from any ideas, methods, instructions or products referred to in the content. |
© 2025 by the authors. Licensee MDPI, Basel, Switzerland. This article is an open access article distributed under the terms and conditions of the Creative Commons Attribution (CC BY) license (https://creativecommons.org/licenses/by/4.0/).