Abstract
Phononic or acoustic bandgap materials have often been made using a polymer matrix with metal inclusions such as tin and steel, which have high densities compared to the matrix material. Acoustic bandgaps are observed when waves are not transmitted at certain frequencies. These have been applied in cavity resonators, acoustic waveguides, and more. This paper introduces a concept of using cement as the surrounding matrix and carbon nanotubes as the core inclusions to develop phononic materials. The exhibition of a bandgap makes it possible for the cementitious phononic material to be used as a sensor for cement cracking and defects in oil well bores. This paper discusses ways to optimize the characteristics of the carbon nanotube core to develop gaps in transmission spectra. It shows the behavior of the cementitious material with changing filling fraction, location of core cells, and surrounding defects, creating a pathway for paradigm-shifting non-destructive sensing technologies.
1. Introduction
Cementitious materials are the components or “glue” that hold concrete together. Cementitious materials such as fly ash, ground granulated blast furnace slag, limestone fines, and silica fume have been introduced into cement mix to reduce permeability and decrease the likelihood of corrosion. However, these materials exhibit a continuous change in their properties over time, especially due to cracks. As a result, it is essential that the changes in these materials are monitored regularly and accurately. Therefore, there exists a need for studying other physics-based approaches for cementitious materials to ensure the effectiveness of the materials as well as the safety of the structures in which they are used. The understanding of cement-based sensors capable of demonstrating wave isolation capabilities remains minimally explored. By engineering wave isolation, commonly known as bandgaps, it becomes possible to regulate the transmission of phonons [1,2]. Moreover, creating wave guiding capabilities in cement can open pathways to advanced monitoring and property modifications in cement. Guiding waves around crack initiation and crack growth can allow the data needed for repair materials to reach the target site in a science-led approach, saving millions of dollars and time. This advancement holds promise for applications in nondestructive testing and advanced structural health monitoring in cementitious materials. Recent work has shown that packed carbon nanotube inclusion material can create bandgaps in a cement matrix when compared to solid cement, which lacks such capabilities [3]. It was demonstrated that bandgaps can be experimentally observed in cement using carbon nanotubes that also improve the mechanical properties of cement paste and so would not affect the cement integrity. This can further extend into developing sensors that can be embedded in a homogeneous environment to enable its resistance to chemical weathering and remain unaffected by external weathering conditions. Yet, unresolved questions persist regarding the control of nanotube core designs, the facilitation of wave guiding, and the influence of surrounding cracks on the behavior of wave isolation and wave guiding. The investigation in this study shows that by controlling the core design and engineering the periodic arrangements, these properties in cement may be possible. Cement-based sensors that can exhibit acoustic stop bands and offer wave isolation abilities have been recognized only recently [3]. Engineering of ABGs in cementitious materials will offer the ability to control the propagation of phonons and can have direct applications in nondestructive testing and advanced structural health monitoring.
In this paper, we carry out computational studies for the behavior of cement as the matrix and multi-walled carbon nanotubes as the inclusion material in the periodic cell arrangement. By performing computational simulations for varying filling fractions, defects, and location of core materials, this paper demonstrates the study of the effect of filling fraction on the size and number of bandgaps and determines the optimal filling fraction. After determining this optimal design, we analyze the effect of topology on wave transmission. We demonstrate not only the effects on the bandgap but also demonstrate the concept of wave guiding by topology optimization. Lastly, we study the effects that defects in the surrounding matrix have on the bandgap. Our results show that a systematic design of phononic bandgap materials with cement is possible.
2. Parameters and Methods
Bandgap materials have elastic properties, density, and speed of sound consistently varying in a periodic manner. This is very similar to photonic materials, only that this bandgap is in a phononic or sound wave analogy. The contrast in properties of the materials causes waves to be completely reflected at certain frequencies. The lame coefficients (µ and λ) can be expressed as Young’s Modulus (E) as shown in Equations (1) and (2), where
is Poisson’s ratio. These coefficients are used to calculate the speed of sound, c, as shown in Equation (3) [4,5,6].
Bandgaps occur in materials engineered with a periodic arrangement of the inclusion material within a homogeneous surrounding matrix material, as shown in Figure 1. Bandgap analysis involves establishing a unit cell, which serves as a repetitive element within a periodic structure. Periodic structures can be fabricated using cylindrical inclusions with circular cross-sections in two-dimensional solid/solid acoustic bandgap materials. The filling fraction (FF), Equation (4), representing the portion of the host’s cross-sectional area occupied by the inclusion (radius ‘r’ if circular) within the unit cell (edge length ‘a’), is pivotal in generating and maximizing the bandgap [7]. It is assumed that wave propagation occurs in the plane perpendicular to the vertical axis of the cylindrical inclusions.

Figure 1.
(a) Multiple individual repetitive circular inclusions of radius ‘r’, inside the host matrix of edge length ‘a’, forming a periodic structure indicating the (b) unit cell indicated in the periodic structure in Figure 1a. Irreducible Brillouin zone indicating the wave vectors to be searched for the general two-dimensional case where the wave equation only has to be calculated for k-vector values along the path Γ→X, X→M and M→Γ. (c) Sketch of what represents s band structure indicating lowest eigenvalues for wave vectors along the line Γ→X, X→M and M→Γ indicating a bandgap region.
The elastic wave propagation within a periodic unit cell relies on the principles of Floquet–Bloch wave theory. This theory is implemented in COMSOL Multiphysics™ (version 5.1) using a periodic boundary condition known as ‘Floquet periodicity’. To tackle the intricate Eigenvalue problem for identifying Bloch waves, an eigenfrequency analysis is conducted. Additionally, a parametric study is undertaken by varying the parameter k, which facilitates sampling of the wave vector space along specific directions. This approach allows for the exploration of various vibration modes within the periodic unit cell given by Equation (5). Here, u represents the displacement vector relative to the destination (dst) and source (src), while r denotes the position vector relative to the destination and source. Additionally,
signifies the Floquet wave vector. Equation (6) describes the phase velocity of the Bloch wave in the direction of the wave vector
, where ω denotes the angular frequency. In the direction of Floquet wave factor
, the phase velocity of the Bloch wave is given by Equation (6) [3]. Though Equation (4) can be solved for any value of the wave vector, investigating the first Brillouin zone is sufficient because of the periodic nature. The investigation is limited to the triangle marked in the cell with boundaries Γ→X, X→M and M→Γ, where Γ, X and M are wave vectors, because of the square symmetry of the cell as shown in Figure 1 [3,7,8,9].
COMSOL Multiphysics was used to model 2D phononic crystals with cell arrangement. To perform bandgap analysis, the radius of the inclusions, their repetitiveness, and the distance between them are key geometrical parameters. Other key parameters include material properties of the matrix and inclusions. The propagation of waves in the periodic unit cell is based on the Floquet–Bloch theorem, which implies that wave propagation behavior of the entire phononic material can be studied by analyzing that of a single cell [5]. To apply this theorem in COMSOL, the boundary condition defined as “Floquet periodicity” is used. An Eigenfrequency analysis is performed to study wave propagation and analyze the bandgap. However, since there are infinitely many eigenvalue problems, a parametric study is conducted by sweeping through parameter k, allowing to specify a few selected wave vector directions in one analysis run [10]. The first Brillouin zone ends at the Floquet wave vector k1, which is given by Equation (7). Within this Brillouin zone, our analysis is constrained to the shaded triangular region along boundaries, and investigation is possible within these constraints because of the periodic nature of the material, as well as the square shape of the unit cell [9,10,11]. In Equation (8), u1 is the displacement amplitude at the output boundary and u2 is the displacement amplitude at the input boundary.
k1 = π/a
In this study, band structure analysis was conducted by a single unit cell with a matrix and core. The analysis was extended to transmission loss in specific conditions where 13 × 13 cells placed within a surrounding of cement as the outer matrix and carbon nanotubes as the inclusions in the cells were studied. When an array of the phononic structure is modeled, the average pressure at the outlet and at the inlet can be evaluated. The frequency response analysis was conducted by studying the response to various vibrations between 0 and 650 kHz, at intervals of 10 Hz. A pressure boundary condition was used at the incoming boundary (left) as shown in Figure 2. For a single unit cell, meshing size did not play a role in eigen modes and therefore, it was irrelevant. For the study involving vibrational analysis, an adaptive meshing was used. Mesh is automatically refined based on the solution’s error estimate, especially in areas of high stress concentration. A transmission spectrum was developed for each case studied from the incoming to the outgoing boundary. A logarithmic equation was used to represent transmission (T) as shown in Equation (8). The development of what is called “a band structure” was performed, which conveys the vibration modes and the characteristics of transmission where u1 and u2 are the displacement of the edge of excitation and the displacement of another boundary. From this calculation, vibration isolation modes were achieved for the 13 × 13 cells.
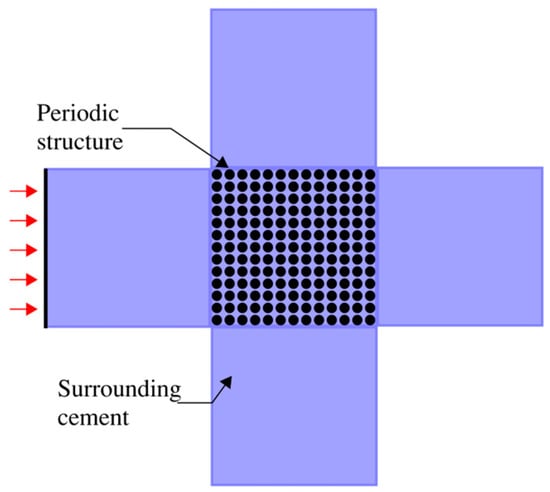
Figure 2.
Periodic structure used for frequency response analysis.
The black dots as shown in the figure represent the periodic structure made of 13 × 13 carbon nanotube inclusions, and the blue area represents the cement matrix. A periodic arrangement of elements is required because bandgap analysis is performed by first defining a unit cell, which is a repetitive element in a periodic structure. For a filling fraction of 0.45, which is attributed to an inclusion radius of 1.5 mm and unit cell edge length of 4 mm, thirteen individual repetitive unit cells with 4 mm periodicity were formed as a periodic structure to generate the desired bandgap frequency. The usage of carbon nanotubes is more beneficial than detrimental to cement. Past studies have shown carbon nanotubes to improve the compressive strength of cement up to 22% [12]. They help to improve the crack resistance of cement, which is brittle. Excess pressure surroundings can often become the reason for cracking of cement, and carbon nanotubes would be a great addition not only to be able to help develop sensing technologies but to also improve the properties of the cement. The material properties of the carbon nanotubes and cement used have been acquired from past work [3,13,14,15] and are listed in Table 1. The packed CNTs were assumed to create a locus of sphere as per its orientation as shown below, and therefore length of CNT = diameter of sphere. The Young’s modulus value of 90 GPa was input into the model considering this effect. A single CNT is as high as 1 TPa.

Table 1.
Material properties and Computational Matrix.
In this study, a test matrix to understand the interaction between these materials is curated, and band structures for (a) cement matrix with cement inclusion cores (low contrast 1), (b) carbon nanotube matrix with carbon nanotube inclusion cores (low contrast 2), and (c) cement matrix with carbon nanotube inclusion cores (high contrast) are obtained. Further, the study focuses on the effects of inclusion core size, filling fraction and core shape, location of inclusion cores, and surrounding defects on the bandgap formations.
3. Results and Discussion
Analysis was conducted for low contrast 1 with cement as matrix and cement as inclusion cores. No carbon nanotube was considered in this simulation so as to understand effects of homogeneous materials in a unit cell. Figure 3a shows the band structure for this case (a). It’s observed that eigenmodes are present across all frequencies in these homogeneous materials, which indicate complete propagation. Similarly, for low contrast 2 with carbon nanotubes as matrix and carbon nanotubes as inclusion cores, no cement was considered in this simulation to understand the effects of homogeneous materials in a unit cell. Figure 3b shows the same result as no propagation modes were observed and no bandgaps were created by the cell. Filling fraction in both cases was maintained as 20%. This observation evidently shows that combination of two low contrast materials to make up the periodic structure’s matrix and inclusion cores is not suitable for bandgap occurrence. However, maintaining the same filling fraction, in the high contrast case with cement as matrix and carbon nanotubes as inclusion cores, a partial bandgap was observed in the band structure as shown in Figure 3. With the evident result showing change in band structure and propagation modes only when material contrast is high between the cores and the cement, the further analysis of this study included further investigation into propagation modes and results obtained with different variations in the unit cell design. Note that this partial bandgap is seen to be in the vertical direction of the irreducible Brillouin zone indicating the path X→M [16].
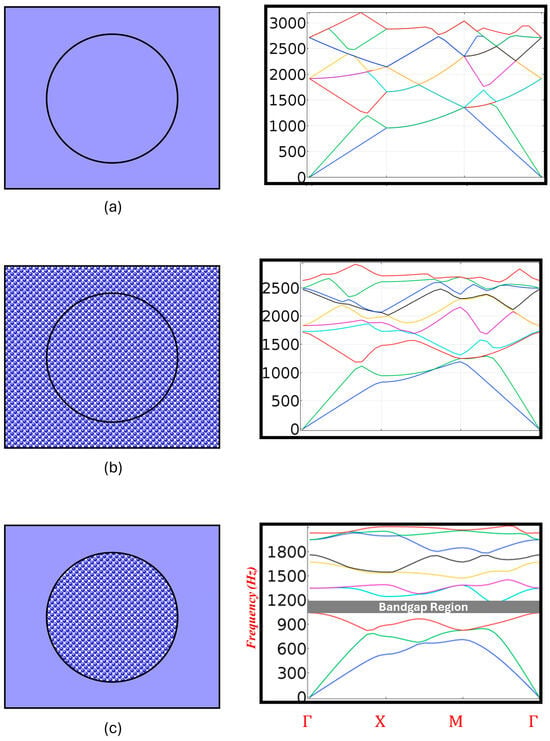
Figure 3.
Band structures for (a) Low contrast 1 and (b) low contrast 2 and (c) high contrast cases with filling fraction of 80%.
Throughout the remainder of the results and discussion, the effects of inclusion core size, filling fraction and core shape, location of inclusion cores, and surrounding defects on the bandgap formations are presented. The size of the bandgap and number of bandgaps in the high contrast cells is determined by filling fraction [7], which is the area of the core relative to the surrounding matrix [3]. The filling fraction is important for both creating and optimizing the bandgap. Along with 20% filling fraction (a = 4 mm, d = 2 mm), simulations for band structure of the high contrast materials were studied for filling fractions of 5% (a = 4 mm, d = 1 mm), and 45% (a = 4 mm, d = 3 mm). It is evident from the band structures of each of these cases in Figure 4 that propagation modes are different with each filling fraction. For filling fractions at 20% and 45%, bandgap size and number increased significantly. For filling fraction at 5%, which means the percentage of core material relative to surrounding matrix within a unit cell, eigenmodes are present across all frequencies, which indicate complete propagation. For unit cells where the core material is at 80% relative to the surrounding matrix material, there is a range of frequencies with no corresponding eigenmodes, i.e., there is a bandgap between the third and fourth bands (275 and 285 kHz). This means that no elastic waves with frequencies within the bandgap may propagate through the structure. The bandgap zone is indicated with a shaded grey region in the diagram. On a higher end, for unit cells where the core material is at 180% relative to the surrounding matrix material, there are several gaps observed, some partial and some full bandgaps (315 kHz and 360 kHz, 420 kHz to 465 kHz and 510 kHz and 575 kHz). The complete bandgaps are observed between bands three and four, five and six, seven and eight. The partial gaps are seen to be in horizontal and vertical directions along the paths Γ→X and X→M.
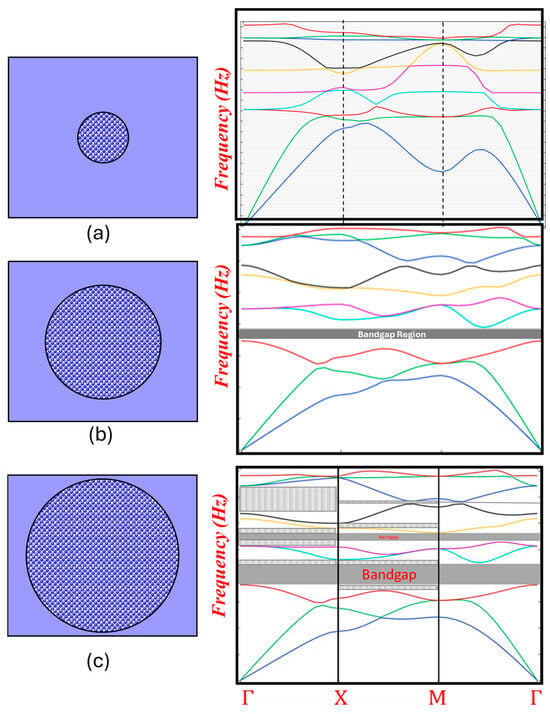
Figure 4.
Band structures for circular core sizes of carbon nanotube within cement matrix representing the high contrast cases of (a) filling fraction = 5% and (b) filling fraction = 20% and (c) filling fraction = 45%.
Vibration isolation results were observed for this band structure that has maximum filling fraction, demonstrating three full and partial bandgaps. The results highlight the responses from the 13 × 13 cells. Note that at frequencies outside of the bandgap, the periodic structure does not isolate the vibrations. These responses are depicted in Figure 5a,b. From the results, we can gather how effective the periodic structure is at isolating the rest of the structure from the applied vibrations shown in Figure 5c. The vibration isolation is still practically efficient, even if fewer periodic cells are used. These results highlight the effective engineering of these crystals with cement matrix surrounding a carbon nanotube core with high contrast in material properties that makes it possible to isolate vibration within a certain frequency range. Vibration within this selected frequency range is attenuated by a mechanism of wave interferences within the periodic system. Such behavior is similar to that of a more widely known nanostructure that is used in semiconductor applications: a photonic crystal. Some limited work is available if this is possible experimentally.
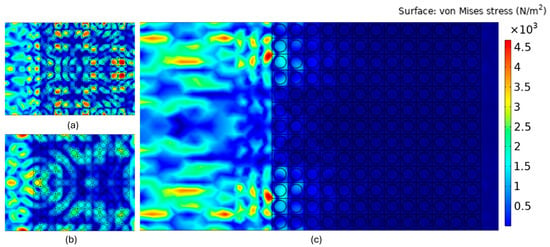
Figure 5.
Vibration isolation by periodic structure with 3 mm circular core of carbon nanotube within cement matrix at (a) 220 kHz (out of bandgap range), (b) 400 kHz (out of bandgap range), and (c) 440 kHz (in bandgap range).
Both phononic and photonic crystals operate on the concept that a structure made up of regularly spaced scatterers can significantly influence the movement of classical waves like acoustic or elastic waves. Phononic crystals are particularly concerned with the fundamental vibrations connected to the particle nature of wave vibrations, known as phonons. The frequencies achieved in this study are in the 103 Hz range, which is the higher limit of sonic frequency range and the lower limit of the ultrasonic range. Achieving smaller sizes of unit cells can push these frequency ranges to the mid and high ultrasonic ranges specific to suitable applications. However, achieving such small dimensions in cement can be challenging. The study adopted these dimensions based on experimental investigation of small specimens of 4 mm in past work to show that these bandgaps can be achieved physically through accurate specimen fabrication.
The next analysis was performed using the 13 × 13 periodic arrangement of matrix and cores by introducing an interference in the surrounding. A rectangular defect almost extending as long as the length of the periodic structure and as wide as one unit cell was interfered in the surrounding matrix on all sides of the structure as shown in white color in Figure 6b. To simulate a defect such as a crack where material does not exist, air medium was defined as the material property of this interference. Vibrational modes, were assessed with this interference and results were observed. Some vibrational modes particularly at 480 kHz, showed a change in vibration isolation from no isolation before interference to somewhat isolation after introduction of the interference. Figure 6 shows the vibrational modes at 480 kHz. As can be seen, the periodic structure effectively isolates the rest of the structure from the applied vibrations due to the interference of an air defect in its surroundings, even though 480 kHz is out of the bandgap range. This sheds light on the possibility of signature assessment of surrounding cements due to defects when the bandgap should be visible but gets perturbed due to a defect or vice versa where defect creates a bandgap.
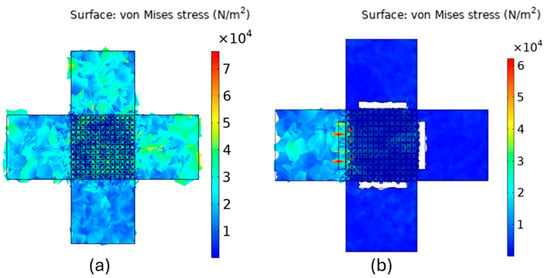
Figure 6.
Vibration isolation by periodic structure with 3 mm circular core of carbon nanotube within cement matrix at 480 kHz (a) without defect and (b) with defect.
In addition to factors like filling fraction and defects, the positioning of core cells or inclusions can significantly impact wave transmission. By strategically removing core cells at specific locations, it’s possible to enhance the response at particular boundaries, a phenomenon known as wave guiding. This involves directing waves along a defined path to a specific boundary point. The concept of wave guiding has been demonstrated in various technologies such as microwave ovens, photonic integrated circuits, and optical fiber communication [1,17,18]. While it has been shown to be achievable in phononic crystals, its feasibility in cement has yet to be demonstrated. To illustrate wave guiding, results with core cells removed from the middle three vertical rows up to halfway through the material, and two horizontal rows, extending halfway through the material are shown. Figure 7 shows the effect of this periodic cell reduction after multiple attempts and combinations. The vibration modes at 345 kHz where partial bandgap is seen in the band structure for the 3 mm core size are shown in Figure 7a. Before removal of inclusions, isolation response was seen at the boundary and there was minimal to no wave transmission to the other boundaries. After the removal of the specific core cells, the waves were guided to change the response at the lower boundary, demonstrating an effective wave guiding phenomenon.
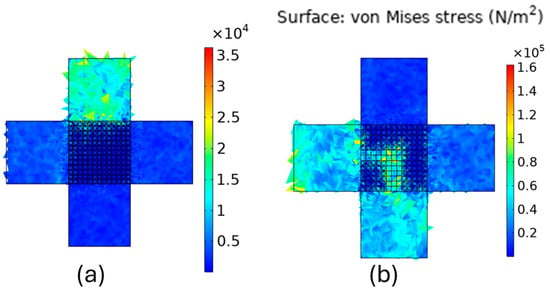
Figure 7.
Vibrational modes of periodic structure with 3 mm circular core of carbon nanotube within cement matrix at (a) 345 kHz in bandgap range, (b) at 345 kHz demonstrating wave guiding phenomenon.
Wave guiding in phononic crystals involves manipulating the propagation of acoustic or elastic waves through a structured medium. To be able to achieve this in cement means that the applications can be endless. By strategically designing the arrangement of scatterers within the crystal lattice, certain paths or channels can be created to direct the waves along desired routes. This can be achieved by selectively altering the properties of the crystal, such as the spacing between scatterers.
At 430 kHz also, a similar phenomenon was observed as shown in Figure 8. Before removal, there is minimal transmission of waves at this frequency. After removal, the waves are guided to give maximum response at the lower boundary. In both cases, waves are guided through the path created by the removal of the inclusion cells. This means that manipulation of the geometry or geometrical optimization can be performed strategically with a periodic structure with 3 mm circular core of carbon nanotube within cement matrix in order to guide waves to a certain boundary at a certain frequency. These illustrations show that the principle of wave guiding is possible in cement with carbon nanotubes.
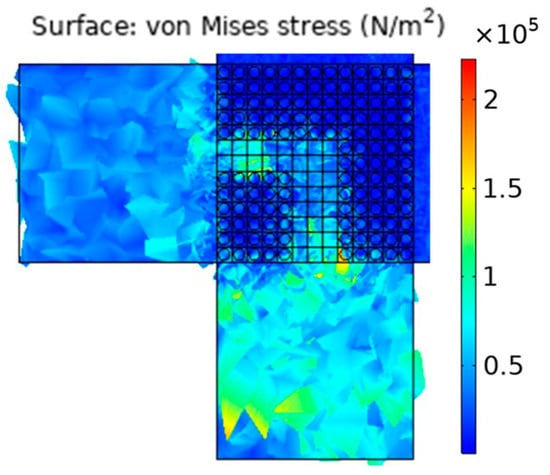
Figure 8.
Vibrational modes of periodic structure with 3 mm circular core of carbon nanotube within cement matrix at 430 kHz in bandgap range demonstrating wave guiding phenomenon.
4. Key Discussion
The results of this study can be used to understand the development of a new sensing technology in and with cement. Since the bandgap ranges can be engineered, any changes in this bandgap would be an indicator of possible defects in the cement [14,19]. For example, propagation modes for a frequency range that is expected to be in the bandgap, or lack of propagation for a frequency that is outside the bandgap. New ways of monitoring the health of the cement using a method that is non-destructive is in demand. For abandoned well bores, it is a pressing need. Currently, the use of satellites is one of the major methods being used and researched, especially by large oil companies. However, this method often only detects after significant damage has occurred, and hence there has already been substantial leakage of methane from abandoned well bores. Ultrasonic waves have also been used to determine the characteristics of cement in well bores. The attenuation results are used to detect the cracks in the cement, but this has not been a very effective method. If we can detect cracks in cement before they become larger and connected, it would greatly improve both the costs and environmental impacts because of the large amounts of methane released [20,21,22].
The importance of this study conducted can also extend into some novel extra-planetary applications. For example, in sensing Martian environments where local materials available are hydrated silicate mineral matrix that have similar properties such as cement. A cluster of Phononic crystals with a hydrated silicate mineral matrix integrated with nano cores of highly contrasting elastic constants can be designed to create an impedance mismatch creating gaps in elastic wave propagation. Implanted in a similar material matrix, this also creates homogeneity with hydrated minerals, maximizing chances of exploring and detecting Martian biosignatures. In addition, the origin of defects and propagation of micro pores and cracks will provide qualitative data on the characteristic behavior of the Martian habitat and land conditions. These results can potentially lead to embedded ultra-wide band phononic sensing systems for long-term Mars diagnostics. A networked suite of highly sensitive and high-resolution non-metallic Phononic crystals can be designed to have the material homogeneity with Martian hydrated silicate minerals that allow a robust long-term sensing system. This capability to be embedded in a homogeneous environment enables its resistance to chemical weathering and remain unaffected by external weathering conditions. Mineralogically diverse regions on Mars such as Nili Fosae region are extremely suitable to host such sensing systems. Even the landing site of NASA’s Mars rover mission, Jezero crater, is a feasible and probable hosting location for long-term characterization of physical and chemical processes. The presence of hydrated silica in the Northern and Western Jezero deltas further motivates the goal of the system establishment.
5. Conclusions
This paper presents band structure analysis and vibration isolation analysis with a 13 × 13 periodic structure made of circular core of carbon nanotube within cement matrix. The simulations highlight the need for high contrast materials to make the unit cell for a periodic structure. The analysis demonstrated that homogeneous unit cells cannot demonstrate bandgaps. The effects of core size were studied through band structures and showed bandgaps to occur beyond filling fractions of 20%. The results show multiple bandgaps in the range of 315 kHz and 360 kHz, 420 kHz to 465 kHz, and 510 kHz and 575 kHz using a filling fraction of 45%, which can be achieved through a 4 mm cell size and 3 mm circular core. By analyzing the effects of surrounding defects, it was understood that possible bandgap creation can be obtained due to surrounding defects. In addition, disturbance of bandgap can also occur where bandgap exists. This can serve as signatures for healthy vs. unhealthy cements. Subsequently in this paper, the possibility of achieving wave guiding in cement is shown by using the periodic elements. Strategic removal of cores and unit cells can direct the waves in specific directions, creating new pathways for paradigm-shifting non-destructive sensing technologies. The future goals are to understand how to model the cement-carbon nanotube phononic crystals to predict the structural health of the cement. External factors like temperature and pressure are warranted, taking note of the changes in wave transmission. These factors simultaneously affect cement in conditions such as well bores, affecting the structural integrity of the cement. It is important to understand how the interaction of these factors would affect the way the sensor works and make such novel sensing technologies available for infrastructure safety and integrity.
Author Contributions
N.E.K. performed the computational simulations and drafted the paper. S.V. curated, supervised the work, and contributed to revising the paper draft. All authors have read and agreed to the published version of the manuscript.
Funding
This research was funded by the Engineering Research Fellowship Scholarship at the University of Oklahoma.
Institutional Review Board Statement
Not applicable.
Informed Consent Statement
Not applicable.
Data Availability Statement
The datasets generated during and/or analyzed during the current study are available from the corresponding author on reasonable request.
Conflicts of Interest
The authors declare no conflicts of interest.
References
- El-Kady, I.; Olsson, R., III; Fleming, J. Phononic band-gap crystals for radio frequency communications. Appl. Phys. Lett. 2008, 92, 233504. [Google Scholar] [CrossRef]
- Kim, B.; Nguyen, J.; Reinke, C.; Ziaei-Moayyed, M.; El-Kady, I.; Goettler, D.; Su, M.; Leseman, Z.C.; Olsson, R.H. Nano/micro patterned phononic crystals. ECS Trans. 2013, 50, 449. [Google Scholar] [CrossRef]
- Vemuganti, S.; Stormont, J.C.; Pyrak-Nolte, L.J.; Dewers, T.; Taha, M.R. Cement sensors with acoustic bandgaps using carbon nanotubes. Smart Mater. Struct. 2021, 30, 035011. [Google Scholar] [CrossRef]
- Ammari, H.; Kang, H.; Lee, H. Asymptotic analysis of high-contrast phononic crystals and a criterion for the band-gap opening. Arch. Ration. Mech. Anal. 2009, 193, 679–714. [Google Scholar] [CrossRef]
- Hussein, M.I.; Leamy, M.J.; Ruzzene, M. Dynamics of Phononic Materials and Structures: Historical Origins, Recent Progress, and Future Outlook. Appl. Mech. Rev. 2014, 66, 040802. [Google Scholar] [CrossRef]
- Rietman, E.; Glynn, J. Band-gap engineering of phononic crystals: A computational survey of two-dimensional systems. arXiv 2007, arXiv:0708.3669. [Google Scholar]
- Vasseur, J.O.; Deymier, P.; Khelif, A.; Lambin, P.; Djafari-Rouhani, B.; Akjouj, A.; Dobrzynski, L.; Fettouhi, N.; Zemmouri, J. Phononic crystal with low filling fraction and absolute acoustic band gap in the audible frequency range: A theoretical and experimental study. Phys. Rev. E 2002, 65, 056608. [Google Scholar] [CrossRef] [PubMed]
- Schnalzer, R. Acoustic Bandgap Sensors for Hot-Spot Damage Monitoring. 2011. Available online: https://digitalrepository.unm.edu/ce_etds/50 (accessed on 13 May 2024).
- Sigmund, O.; Søndergaard Jensen, J. Systematic design of phononic band–gap materials and structures by topology optimization. Philos. Trans. R. Soc. London. Ser. A Math. Phys. Eng. Sci. 2003, 361, 1001–1019. [Google Scholar] [CrossRef] [PubMed]
- Maysenhölder, W. Bloch waves in an infinite periodically perforated sheet. In Proceedings of the COMSOL Conference, Munich, Germany, 12 October 2016; pp. 12–14. [Google Scholar]
- Shao, H.; He, H.; He, C.; Chen, G. Study on the band gap optimization and defect state of two-dimensional honeycomb phononic crystals. J. Mater. Res. 2020, 35, 3021–3030. [Google Scholar] [CrossRef]
- Xu, S.; Liu, J.; Li, Q. Mechanical properties and microstructure of multi-walled carbon nanotube-reinforced cement paste. Constr. Build. Mater. 2015, 76, 16–23. [Google Scholar] [CrossRef]
- Guner, D.; Ozturk, H.; Erkayaoglu, M. Investigation of the elastic material properties of Class G cement. Struct. Concr. 2017, 18, 84–91. [Google Scholar] [CrossRef]
- Konsta-Gdoutos, M.S.; Metaxa, Z.S.; Shah, S.P. Highly dispersed carbon nanotube reinforced cement based materials. Cem. Concr. Res. 2010, 40, 1052–1059. [Google Scholar] [CrossRef]
- Mazaheripour, H.; Faria, R.; Ye, G.; Schlangen, E.; Granja, J.; Azenha, M. Microstructure-based prediction of the elastic behaviour of hydrating cement pastes. Appl. Sci. 2018, 8, 442. [Google Scholar] [CrossRef]
- Huang, X.; Meng, F.; Zhou, S. Evolutionary topological design for phononic band gap crystals. Struct. Multidiscip. Optim. 2016, 54, 595–617. [Google Scholar]
- McLevige, W.V.; Itoh, T.; Mittra, R. New Waveguide Structures for Millimeter-Wave and Optical Integrated Circuits. IEEE Trans. Microw. Theory Tech. 1975, 23, 788–794. [Google Scholar] [CrossRef]
- Tong, L.; Gattass, R.R.; Ashcom, J.B.; He, S.; Lou, J.; Shen, M.; Maxwell, I.; Mazur, E. Subwavelength-diameter silica wires for low-loss optical wave guiding. Nature 2003, 426, 816–819. [Google Scholar] [CrossRef] [PubMed]
- Wu, Y.; Patel, H.; Salehi, S. Thermal considerations of cement integrity in geothermal wells. In Proceedings of the 45th Workshop on Geothermal Reservoir Engineering, Stanford, CA, USA, 10–12 February 2020. [Google Scholar]
- Mityagina, M.I.; Lavrova, O.Y. Oil pollution hotspots on the Caspian Sea surface identified using satellite remote sensing. In Proceedings of the Remote Sensing of the Ocean, Sea Ice, Coastal Waters, and Large Water Regions, Online, 21–25 September 2020; p. 115290L. [Google Scholar]
- Owino, J.O.; Jacobs, L.J. Attenuation measurements in cement-based materials using laser ultrasonics. J. Eng. Mech. 1999, 125, 637–647. [Google Scholar] [CrossRef]
- Ravi, K.; Bosma, M.; Gastebled, O. Improve the economics of oil and gas wells by reducing the risk of cement failure. In Proceedings of the IADC/SPE Drilling Conference, Dallas, TX, USA, 26–28 February 2002. [Google Scholar]
Disclaimer/Publisher’s Note: The statements, opinions and data contained in all publications are solely those of the individual author(s) and contributor(s) and not of MDPI and/or the editor(s). MDPI and/or the editor(s) disclaim responsibility for any injury to people or property resulting from any ideas, methods, instructions or products referred to in the content. |
© 2024 by the authors. Licensee MDPI, Basel, Switzerland. This article is an open access article distributed under the terms and conditions of the Creative Commons Attribution (CC BY) license (https://creativecommons.org/licenses/by/4.0/).