Abstract
Population growth, coupled with industrial and agricultural development, has resulted in increased demand for freshwater supply. For countries with scarce water resources, desalination constitutes the only viable solution to this problem. Reverse osmosis (RO) technology has become widely used as the membrane materials have been upgraded and the costs have been reduced. Nowadays, RO is the foremost technology for desalting different types of water such as seawater, brackish, and tap water. However, its design is critical since many parameters are involved in obtaining a good design. The high use of RO encourages the establishment of a procedure that facilitates the design process and helps in obtaining an optimum-performance RO desalination system. This paper presents a procedure divided into three parts: (1) classifying RO parameters; (2) choosing the parameters in a certain order and doing the calculation process through 12 steps; and (3) then inserting the selected parameters and the obtained values on RO System Analysis (ROSA) software. These points are then summarized by creating an algorithmic chart to follow during the design phase of the RO system using ROSA. An example on the proposed list is then taken to validate the procedure, and a comparison is conducted on choosing different values for the parameters. The results of this comparative study show that choosing different parameters affects the RO system productivity. Additionally, every design has a specific optimum set of parameters, which depends upon the design constraints set by the user.
1. Introduction
In many countries, water resource scarcity, coupled with agricultural and industrial development, has resulted in an increasing demand for freshwater [1,2], leading to focusing on advanced water treatment solutions wastewater treatment, water conservation, and smart irrigation systems [3,4]. Diverse methods have been developed to obtain efficient water desalination systems which provide high production with less cost [5].
Reverse osmosis (RO) is one of these technologies; it is a pressure-driven membrane-based desalination method [6,7]. Feedwater (FW) passes through the semi-permeable membrane, where part of the water comes out from the pores of the membrane as purified water called “permeate”, while the rest of the flow is rejected as a concentrated solution called “brine” [8,9]. On the other side, “retentate” is the concentrated solution that remains on the feed side of the membrane after filtration. Nowadays, RO is the leading desalination technology both on small and large scales with a high growth of market share [10], where recently, it has become the primary option for producing freshwater not just for drinking but for domestic use as well [11]. On a small scale, RO is being highly used in domestic water purification and water desalination powered by renewable energy [12,13], where clean energy resources are highly valuable. This high demand for RO has encouraged researchers to look for a good design [14,15] by either running the desalination on renewable energy, specifically Photovoltaic (PV) which provides agreeable results [16,17], or intensifying the performance of the desalination process by using developed materials such as nanoparticles [18,19]. With all the improvements and studies that are carried out to reach a good system, designing an optimum RO desalination system is still very critical, where an optimum design does not just deliver high production but aims for the required production with the least cost. Many software packages such as ROSA, Winflow, and IMS have been developed and implemented in designing RO systems to help the user. However, some steps should be followed to reach a good design where the software does just the calculation process and gives warnings about design errors, such as the feed pressure or recovery ratio exceeding a specific amount of the membrane’s limits, since different membranes have different effects on the water production [20,21]. So, the key point is in setting the parameters that satisfy the design constraints which are defined by the designer. These constraints should be chosen on specific criteria that will be presented in the following sections.
2. Research Objectives
The objective of this paper is to list the main steps for designing an optimized RO system that meets the users’ needs for a small RO plant. These steps are similar to the catalogue given by Dow Chemical Company and Desal Supplies [22]. However, they are summarized and presented here in an algorithmic organized form. This organization is mandatory for designers, making a clear roadmap unmissable for obtaining satisfying optimizations. For instance, an important need for this roadmap becomes evident with the fact that small changes in the designer’s choices at the beginning of the optimization procedure can lead to different optimal sets of parameters, and these optimums may not necessarily be the most suitable for the situation at hand.
To facilitate the selection process, parameters are classified into four main categories giving a certain priority for these parameters to be treated according to the roadmap. Then, a case study is provided following these steps to validate the proposed algorithmic chart. Furthermore, a comparison is made of the main parameters to study the impact of each parameter on the design. The novelty of this paper encompasses multiple dimensions:
- –
- Introduction of an algorithmic flowchart to assist in parameter selection, elaborated upon in Section 3.4.
- –
- Validation of both the technical report and proposed algorithm through an extensive case study employing ROSA software version 6.1.3. This validation fills a significant gap in the literature, as no published article has previously verified this procedure or presented parameter classification in such a simplified manner.
- –
- Conducting a comparative analysis of parameter variations, systematically isolating one parameter at a time while examining the influence of others. This approach sheds light on the intricate relationships between variables in the design process.
3. RO System Design
ROSA (Reverse Osmosis System Analysis) is a simulation software used to help in generating the operational parameters such as the feed pressure of the plants. ROSA is divided into six categories: Project information, Feedwater data, Scaling information, System configuration, Report, and Cost analysis.
Despite the comprehensive categories in the software, the design starts before using the ROSA software. Indeed, the design has a preliminary step called “design background”, in which the designer lists some of the available technologies in the market and sets some of his requirements. Afterwards, the main design tasks start with the aim to define the best values for all parameters which provide the required flow rate at a lower cost.
3.1. Design Background
This part contains steps that should be revised before starting the design to provide better performance and minimum cost [22,23].
- Listing up-to-date membrane models.
- Focusing on spiral-wound membranes per market developments.
- Setting a reasonable safety margin under the following considerations:
- –
- The recommended pressure of the pump should be higher than the feed pressure by 10% of the Net Driving Pressure (NDP), taking the entry losses into account.
- –
- A safety margin of about 10% is taken for system design for fouling rate prediction.
- –
- A 10% increase in the number of membrane elements is taken as a contingency procedure.
- –
- The feed pressure should be specified for the assumed flow with 90% of the calculated membrane elements.
- Permeate flow rate at the concentrate end is usually lower than the flow rate of the primary elements. Good design tends to balance the flow rate through the elements in all positions. This can be carried out by the following:
- –
- Boosting the feed pressure.
- –
- Hybridizing the system using different types of membranes (BW, SW, Nano… defined in Table 1) [24].
 Table 1. Design parameters of RO system.
 - –
- Using energy recovery devices (ERDs) to recover the lost pressure from the brine. ERDs are used to minimize specific energy consumption (SEC) [25].
- –
- Applying a permeate backpressure only to the first stage of a two-stage system.
This balancing can be set after the design has been analyzed with ROSA, but in the present stage, the designer is expected to set the level of his requirements in terms of balancing.
3.2. Classification of Design Parameters
A complete RO system design consists of setting a long list of parameters which are given in Table 1. Usually, setting these parameters is successful after several iterations. The large number of parameters together with the relatively complicated iteration procedure make the RO system design a hazardous task which can lead to completely different optimums just by slightly varying a parameter at the beginning of the procedure. This is why it is very important to have a clear roadmap before starting the design procedure. Thus, Table 1 presents the key terminologies used in designing an RO plant, along with their definitions, symbols, and units.
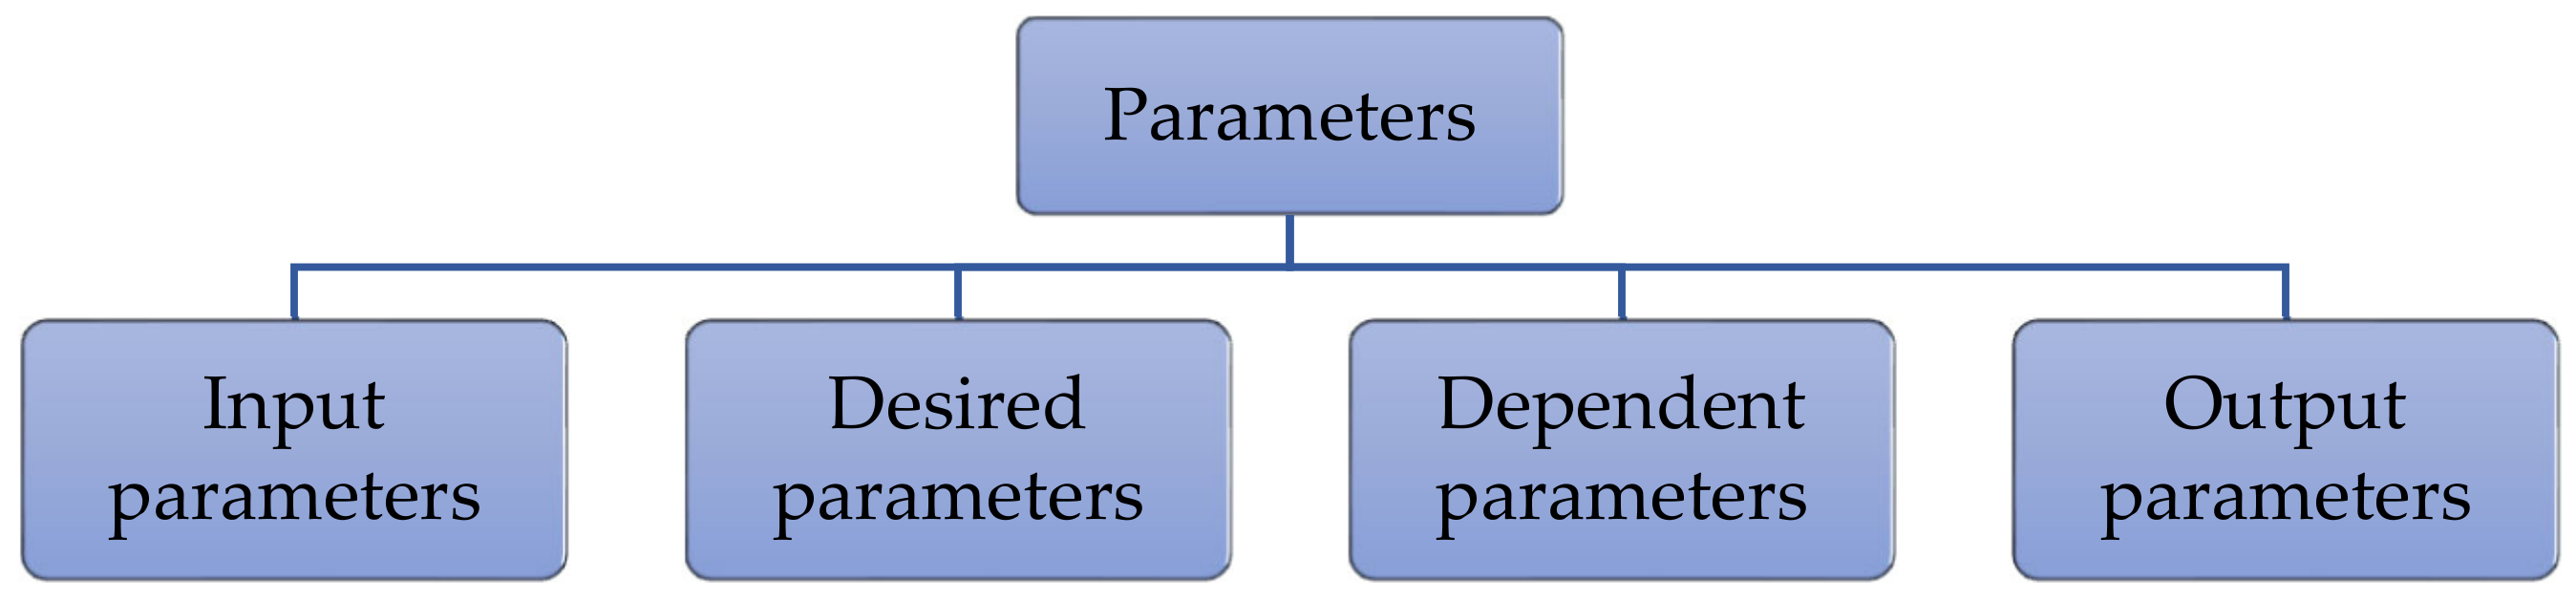
In this section, a method is given to help in managing the parameters of the RO desalination system to properly start the designing procedure. Thus, in the first step, the parameters are classified into four categories as shown in Figure 1, and they differ from one application to another:
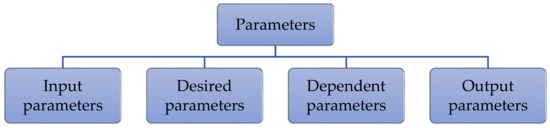
Figure 1.
Classification of RO parameters.
- –
- Input parameters: These parameters constitute the design; they are mainly design parameters such as feedwater type, TDS, T, pH, flow factor, and pump efficiency.
- –
- Desired parameters: These are defined according to the user’s interest such as permeate salinity, permeate output flow rate, or feed water pressure. Desired parameters are the first to be defined, and then, the other parameters are obtained.
- –
- Dependent parameters: Parameters that depend on the input and desired parameters such as membrane area and SR that depend on the chosen feed water type, recovery ratio, permeate flux that depends on both water type and membrane, and several elements that depend on the size of the RO plant. Similarly, the pressure vessels and number of stages depend on the number of elements.
- –
- Output parameters: These are the values obtained from the software such as feedwater pressure, permeate salinity, average flux, system recovery, and specific energy.
It is very important to understand that some parameters may change from one category to another according to the design. Nevertheless, these categories affect each other, for example, if the FW pressure is considered as an input/desired parameter, then permeate flow cannot be also an input/desired parameter; it should be calculated (output parameter) and vice versa. Similarly, for the permeate flux and feed flow, if one is input, the other cannot be also input. This kind of interaction of parameters makes the optimization task a little bit complicated, and a predefined roadmap is required to simplify the task.
3.3. Twelve Steps for a Good Design with a Case Study
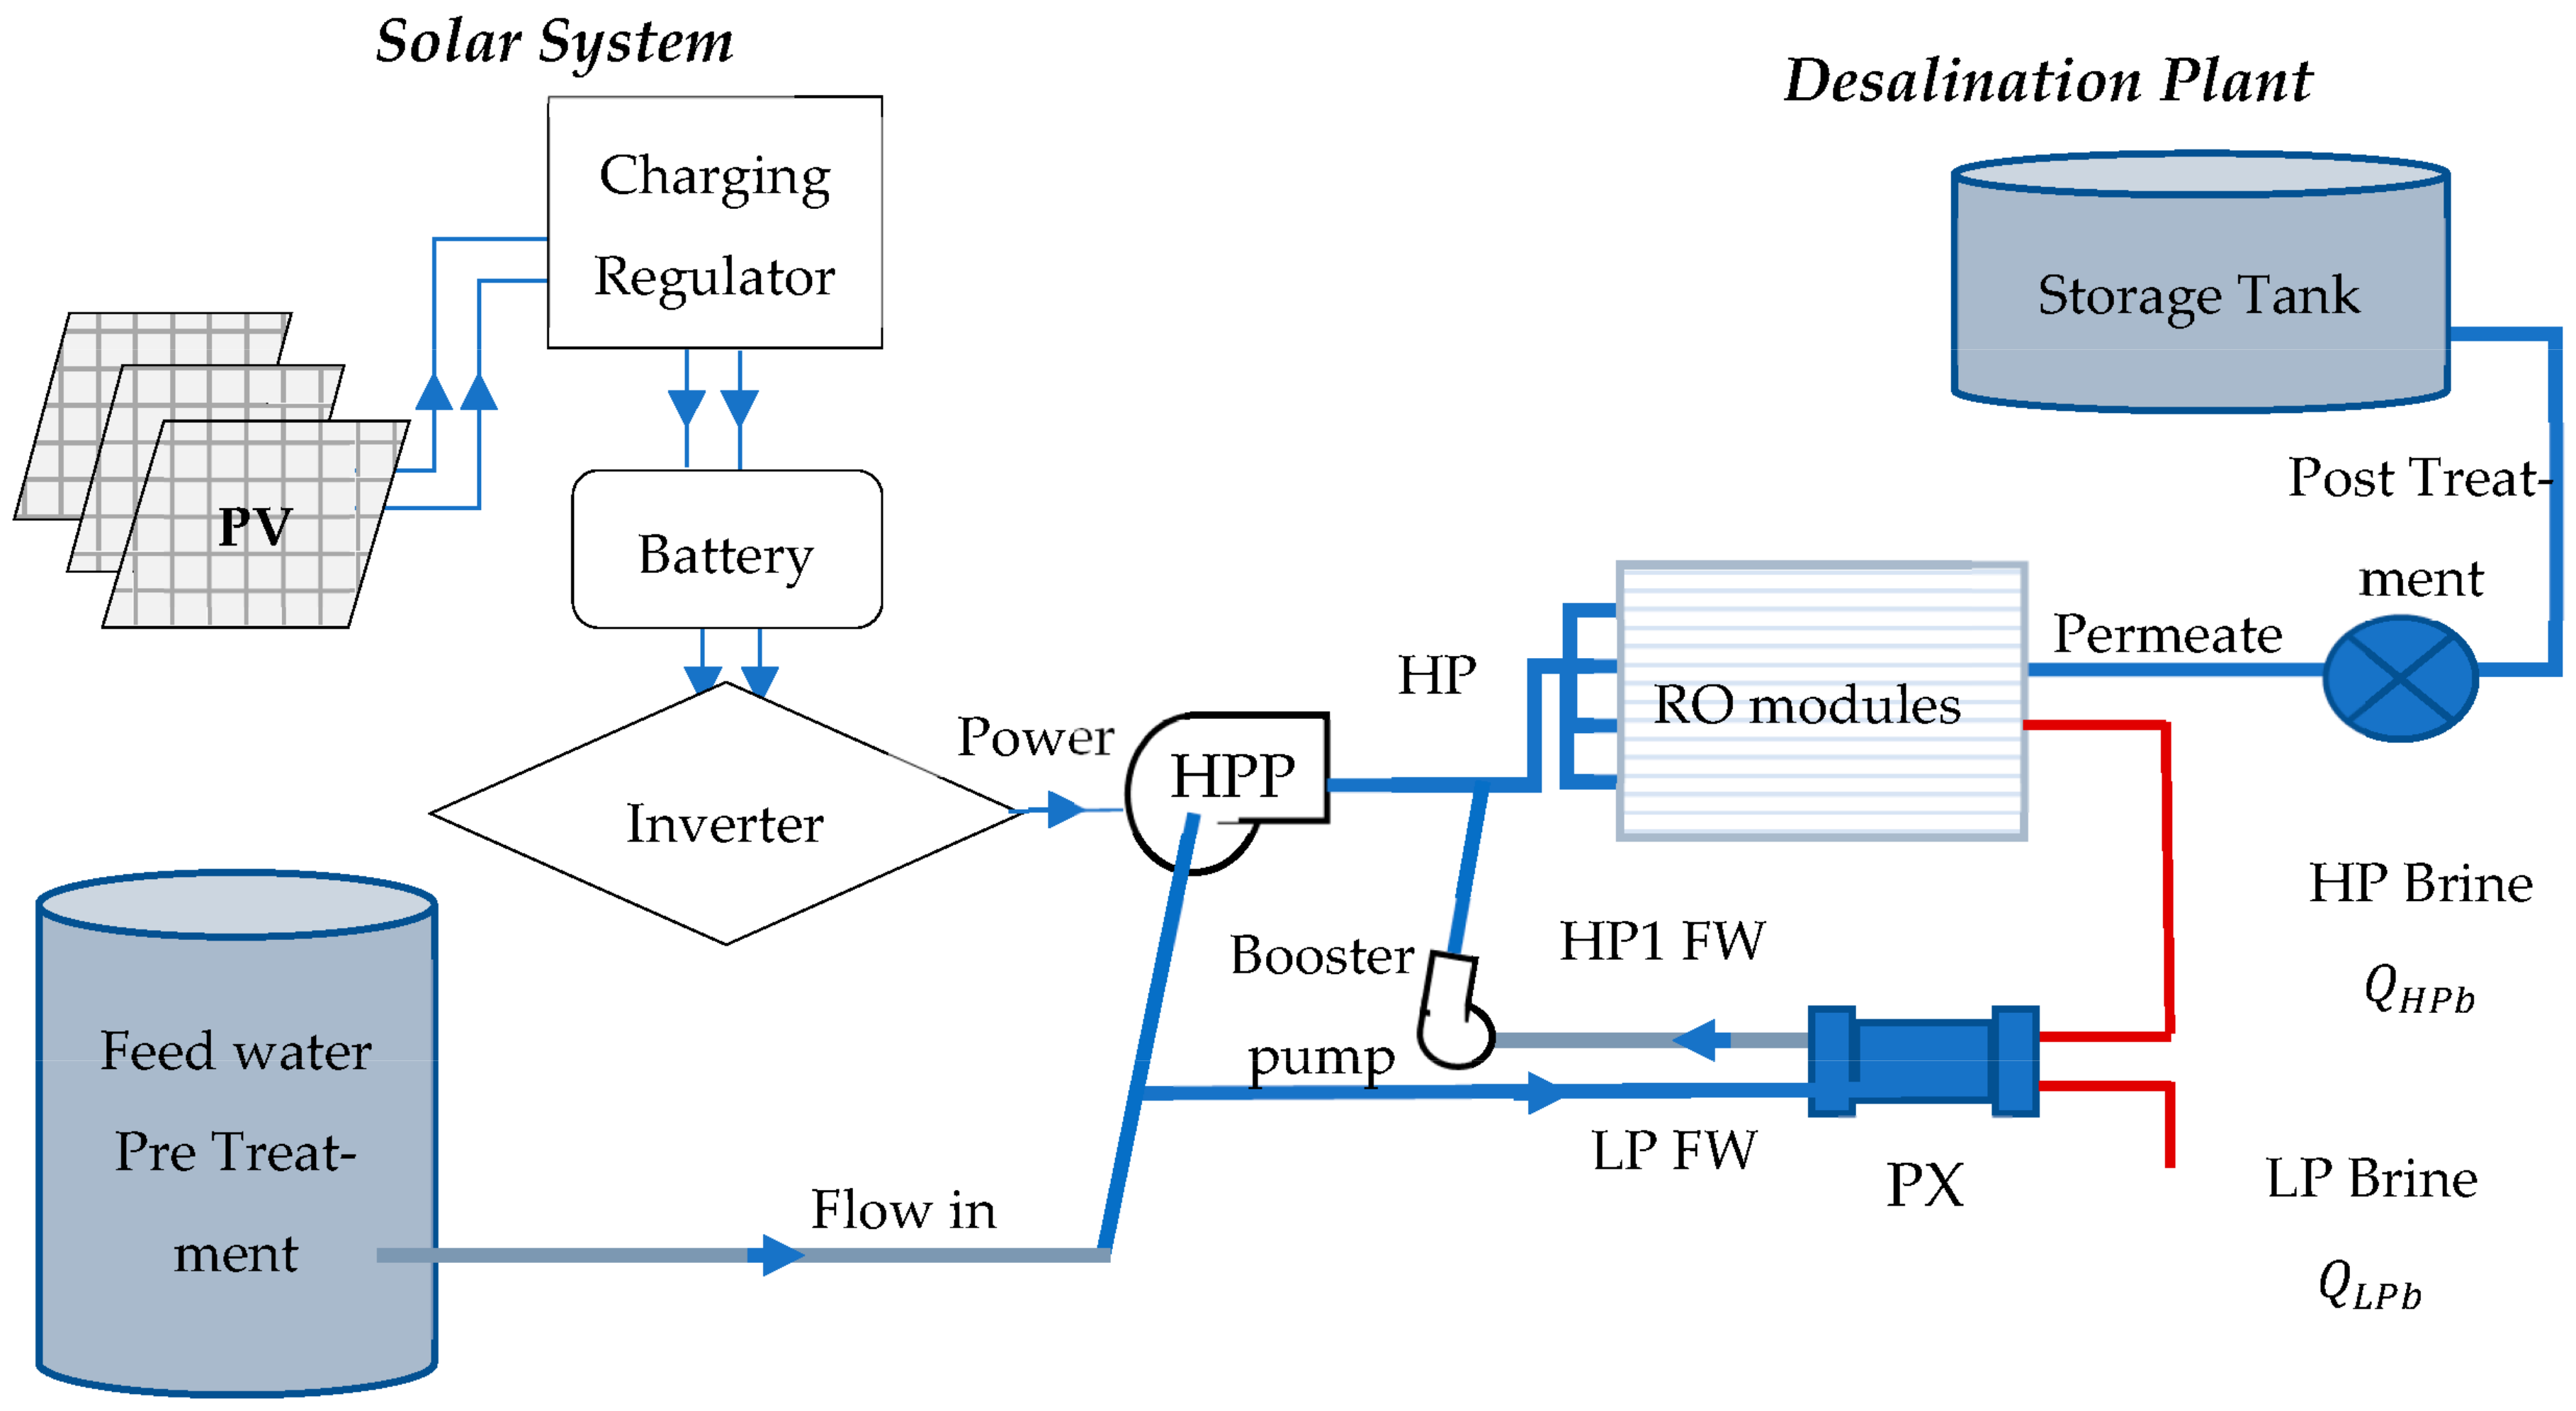
Now, after defining the parameters and before using the ROSA software, there should be some calculations that help in choosing the optimal design criteria. Due to the crucial need to shift towards cleaner energy processes [26,27,28] and the increasingly high energy demand [29,30,31,32], integrating renewable energy sources into a desalination plant has become essential. Figure 2 shows a schematic diagram of the case study that will be taken, which is a PVRO plant that consists of the following process units:

Figure 2.
Schematic diagram of the PVRO system.
- –
- An electrical source could be a solar PV system, wind, or other sources.
- –
- Seawater pretreatment system.
- –
- RO desalination plant.
- –
- Post-treatment plant, potable water storage, and distribution.
- –
- PX to save energy, which is being taken highly into consideration lately [33].
Furthermore, as depicted in Figure 2, the FW is divided into two flows: one flow passes directly through a high-pressure pump (HPP) that elevates the flow directly to the required pressure, and the second flow passes through a pressure exchanger (PX). It is evident that the brine exiting the RO modules possesses a high-pressure (HP) flow. This brine is directed through the PX to transfer its HP to the feed water, which constitutes the alternate flow. Conversely, the FW enters the PX at a lower pressure and exits at a higher pressure referred to as HP1. Subsequently, a booster pump is employed to elevate the pressure of the flow to match that of the feed water before entering the RO modules. To enhance the system’s environmental friendliness [29], a proposal has been put forward to implement a solar power system to operate the booster and high-pressure pump.
- Step 1: Feed water considerations [22,23]
The design of the membrane system depends on accessible feed water. Hence, the system design information shall follow the analysis of feed water. In our case,
- (A)
- Choosing the Mediterranean seawater with conventional pretreatment with SDI < 5 and specifying its chemical composition is presented in Table 2 [24].
Table 2. Mediterranean seawater’s major ion composition.
- (B)
- Specifying overall feed water concentration in TDS (ppm) is shown in Table 3.
Table 3. Input and desired parameters.
- Step 2: Required permeate flow.
Permeate flow ( is the desired parameter; the system is designed accordingly as in Table 4.
Table 4.
Required quality for the desired permeate.
- Step 3: Select the configuration flow and number of passes.
The flow configuration for a membrane system is one or two passes through the system. It is estimated based on experience. Usually, the SWRO (Sea Water RO) system is designed for continuous operation. In our case, a double pass is selected where the 2nd pass is two-staged. After defining the desired parameters, other parameters are classified directly as in Table 5.
Table 5.
Classification of parameters.
- Step 4: Select the membrane.
The membrane, which is a dependent parameter, is selected according to four main criteria:
- System capacity (element diameter, element length)
- Feedwater TDS:
- –
- <1000 mg/L: NF270, NF90, XLE, LE, LP, TW30, BW30
- –
- 1000–10,000 mg/L: BW30
- –
- 10,000–30,000 mg/L: SW30XLE, SW30ULE
- –
- 30,000–50,000 mg/L: SW30HR, SW30XHR, SW30HRLE, SW30XLE
- Feedwater fouling potential (feed spacer thickness, fouling resistance)
- Required product water quality and energy requirements (a salt passage, feed pressure)
As mentioned before, each membrane has specifications, and the user may choose the membrane based on the output interest. The specifications of each membrane can be found in ROSA software. As an example, Table 6 shows five types of membranes.
Table 6.
Choosing the SWRO membrane (Dow).
As noticed, different types of membranes can be selected; in the comparison section, a study using ROSA software is conducted to investigate the impact and performance of each one.
- Step 5: Calculate the required units of SWRO.
The calculation of RO units is classified based on permeate output, availability (number of operation hours in a year after reducing the downtime), and redundancy (the spare production ability of RO operation system). Table 7 is an example of our case to show the calculation procedure.
Table 7.
Calculation units of SWRO.
Usually, each SWRO train is designed to produce (10–20%) of the total permeate capacity. However, our designed plant is moderate, so it is sufficient to have 10 SWRO trains in the first pass and 5 BWRO trains in the second pass, where each train would have a capacity of 10,000 m3/day. This capacity is feasible and considered by various studies, which is why 10 SWRO is chosen [33]. The capacity of each train varies from one study to another; some studies set a capacity of 20,000 m3/day [34], others 5000 m3/day [35] or the commonly used capacity of 10,000 m3/day [36], which is chosen in our design. Now, the number of trains does not just affect the capacity of each train; however, it also affects design, where increasing the number of trains would result in decreasing pressure vessels, and decreasing the number of trains would result in increasing the number of pressure vessels in each pass.
- Step 6: Select membrane average design flux.
RO systems are designed for system recovery and specific permeate flow rates (g/d or L/h). Usually, the design flux (L/m2h) is selected based on expertise, pilot data, or the typical design fluxes recommended by expert professionals. Once the SWRO unit size is calculated, the number of membrane elements can be obtained based on the selected average flux. Permeate flux and recovery ratios depend on the feed source type as shown in Table 8 where, for each feedwater type, there is an optimum range of flux and recovery ratio (R).
Table 8.
Selection of the design average permeate flux and RO recovery reproduced from [22,23].
Since the selected FW is an open intake, the average permeate flux denoted by f is between 10 and 15 L/m2h with an average recovery of 40% to 50% as given in Table 8.
- Step 7: Calculate the number of membrane elements needed.
The total number of membrane elements is determined by dividing the design permeate flow rate (m3/h) by the design flux f (m3/m2·h) and the surface area A (m2) of the membrane, as in the equation below, which gives elements:
- Step 8: Calculate the number of pressure vessel arrays needed.
When the total number of elements is calculated, the total number of vessels in the system can be obtained by dividing by the number of elements in the pressure vessel ( as shown in Equation (2), which gives 1394 pressure vessels.
Then, since we have 10 trains in the 1st pass, each train contains around 140 pressure vessels.
- Step 9: Select the number of stages.
The number of stages defines the number of pressure vessels in series and depends on system recovery as shown in Table 9. In other words, for each range of system recovery, there is an optimum number of elements and stages.
Table 9.
Number of stages of SWRO systems [30].
The higher the system recovery, the lower the feed water quality obtained. In our case, a 45% system recovery is chosen so the number of stages is 1 and 7 elements per vessel.
- Step 10: Select the staging ratio.
The relation of the number of pressure vessels in succeeding stages is called the staging ratio R [21,37], which is denoted by Equation (3):
For ideal staging, each stage functions at the same system recovery (Y). The system recovery Y depends on the type of the FW and the number of elements and stages. The staging ratio of a system can be calculated by Equation (4):
where R is the staging ratio, n is the number of stages, and y is the system recovery. Thus, in our study, for n = 2 and y = 45%, . Accordingly, the number of pressure vessels for n stages is calculated. The can be obtained using the following Equations (5) and (6):
That means and .
- Step 11: Balance the permeate flow rate.
The permeate flow rate of the tail elements (tail elements are placed at the concentrate end) is located below the flow rate of the lead elements, which drops the pressure of the feed/brine and increases the osmotic pressure from the feed to the concentrate. This may result in a high ratio of the permeate flow rate, under specific conditions, where the ratio of the permeate flow of the tail and lead elements may have high system recovery, high feed salinity, low-pressure membranes, or high-water temperature.
Then, an optimum design aims to equalize or balance the flux of elements in the various postures. Thus, balancing the permeate flow is a crucial step to avoid the excessive flux of lead elements, decrease the number of elements and fouling rate of the 1st stage, use the tail end membranes optimally, and enhance product water quality.
Balancing the permeate is carried out after finishing all the above ten steps through enhancing the feed pressure between stages, putting a permeate backpressure for the first stage of a two-stage system, proposing a hybrid system of low water permeability membranes in the first stage, then a high-water permeability membrane in the last stage.
- Step 12: Reverse Osmosis System Analysis (ROSA).
Once the calculations and selection of the parameters are completed, the software can be used to finalize, optimize, and check the validity of the design. Output parameters give details for selecting the feed pump, water recovery available, permeate quality, and blending potential. The ROSA software is an advanced RO design program that predicts the performance of membranes in user-specified systems [38]. ROSA 9.1 software is used to determine the performance of the membrane and the desalination energy requirements. It has six input pages, each tab on the bottom of the screen. The six tabs are Project Info, Feed Data, Scaling, System Configuration, Cost Analysis, and Report.
From the above steps, it is noticed that the values for dependent parameters should be chosen from a certain range to accomplish the design. For each value of these parameters, there could exist a different design output and a different optimum. For example, if the chosen area of the membrane is 40.9 m2, then there exist 5 different membranes that can be chosen. Each choice can lead to a different output, i.e., a different set of optimization parameters. Similarly, the other dependent parameters (recovery ratio and salinity) have a range of possible values following a specific chosen input parameter. Therefore, a comparison study is conducted to check how the change of a parameter affects the results.
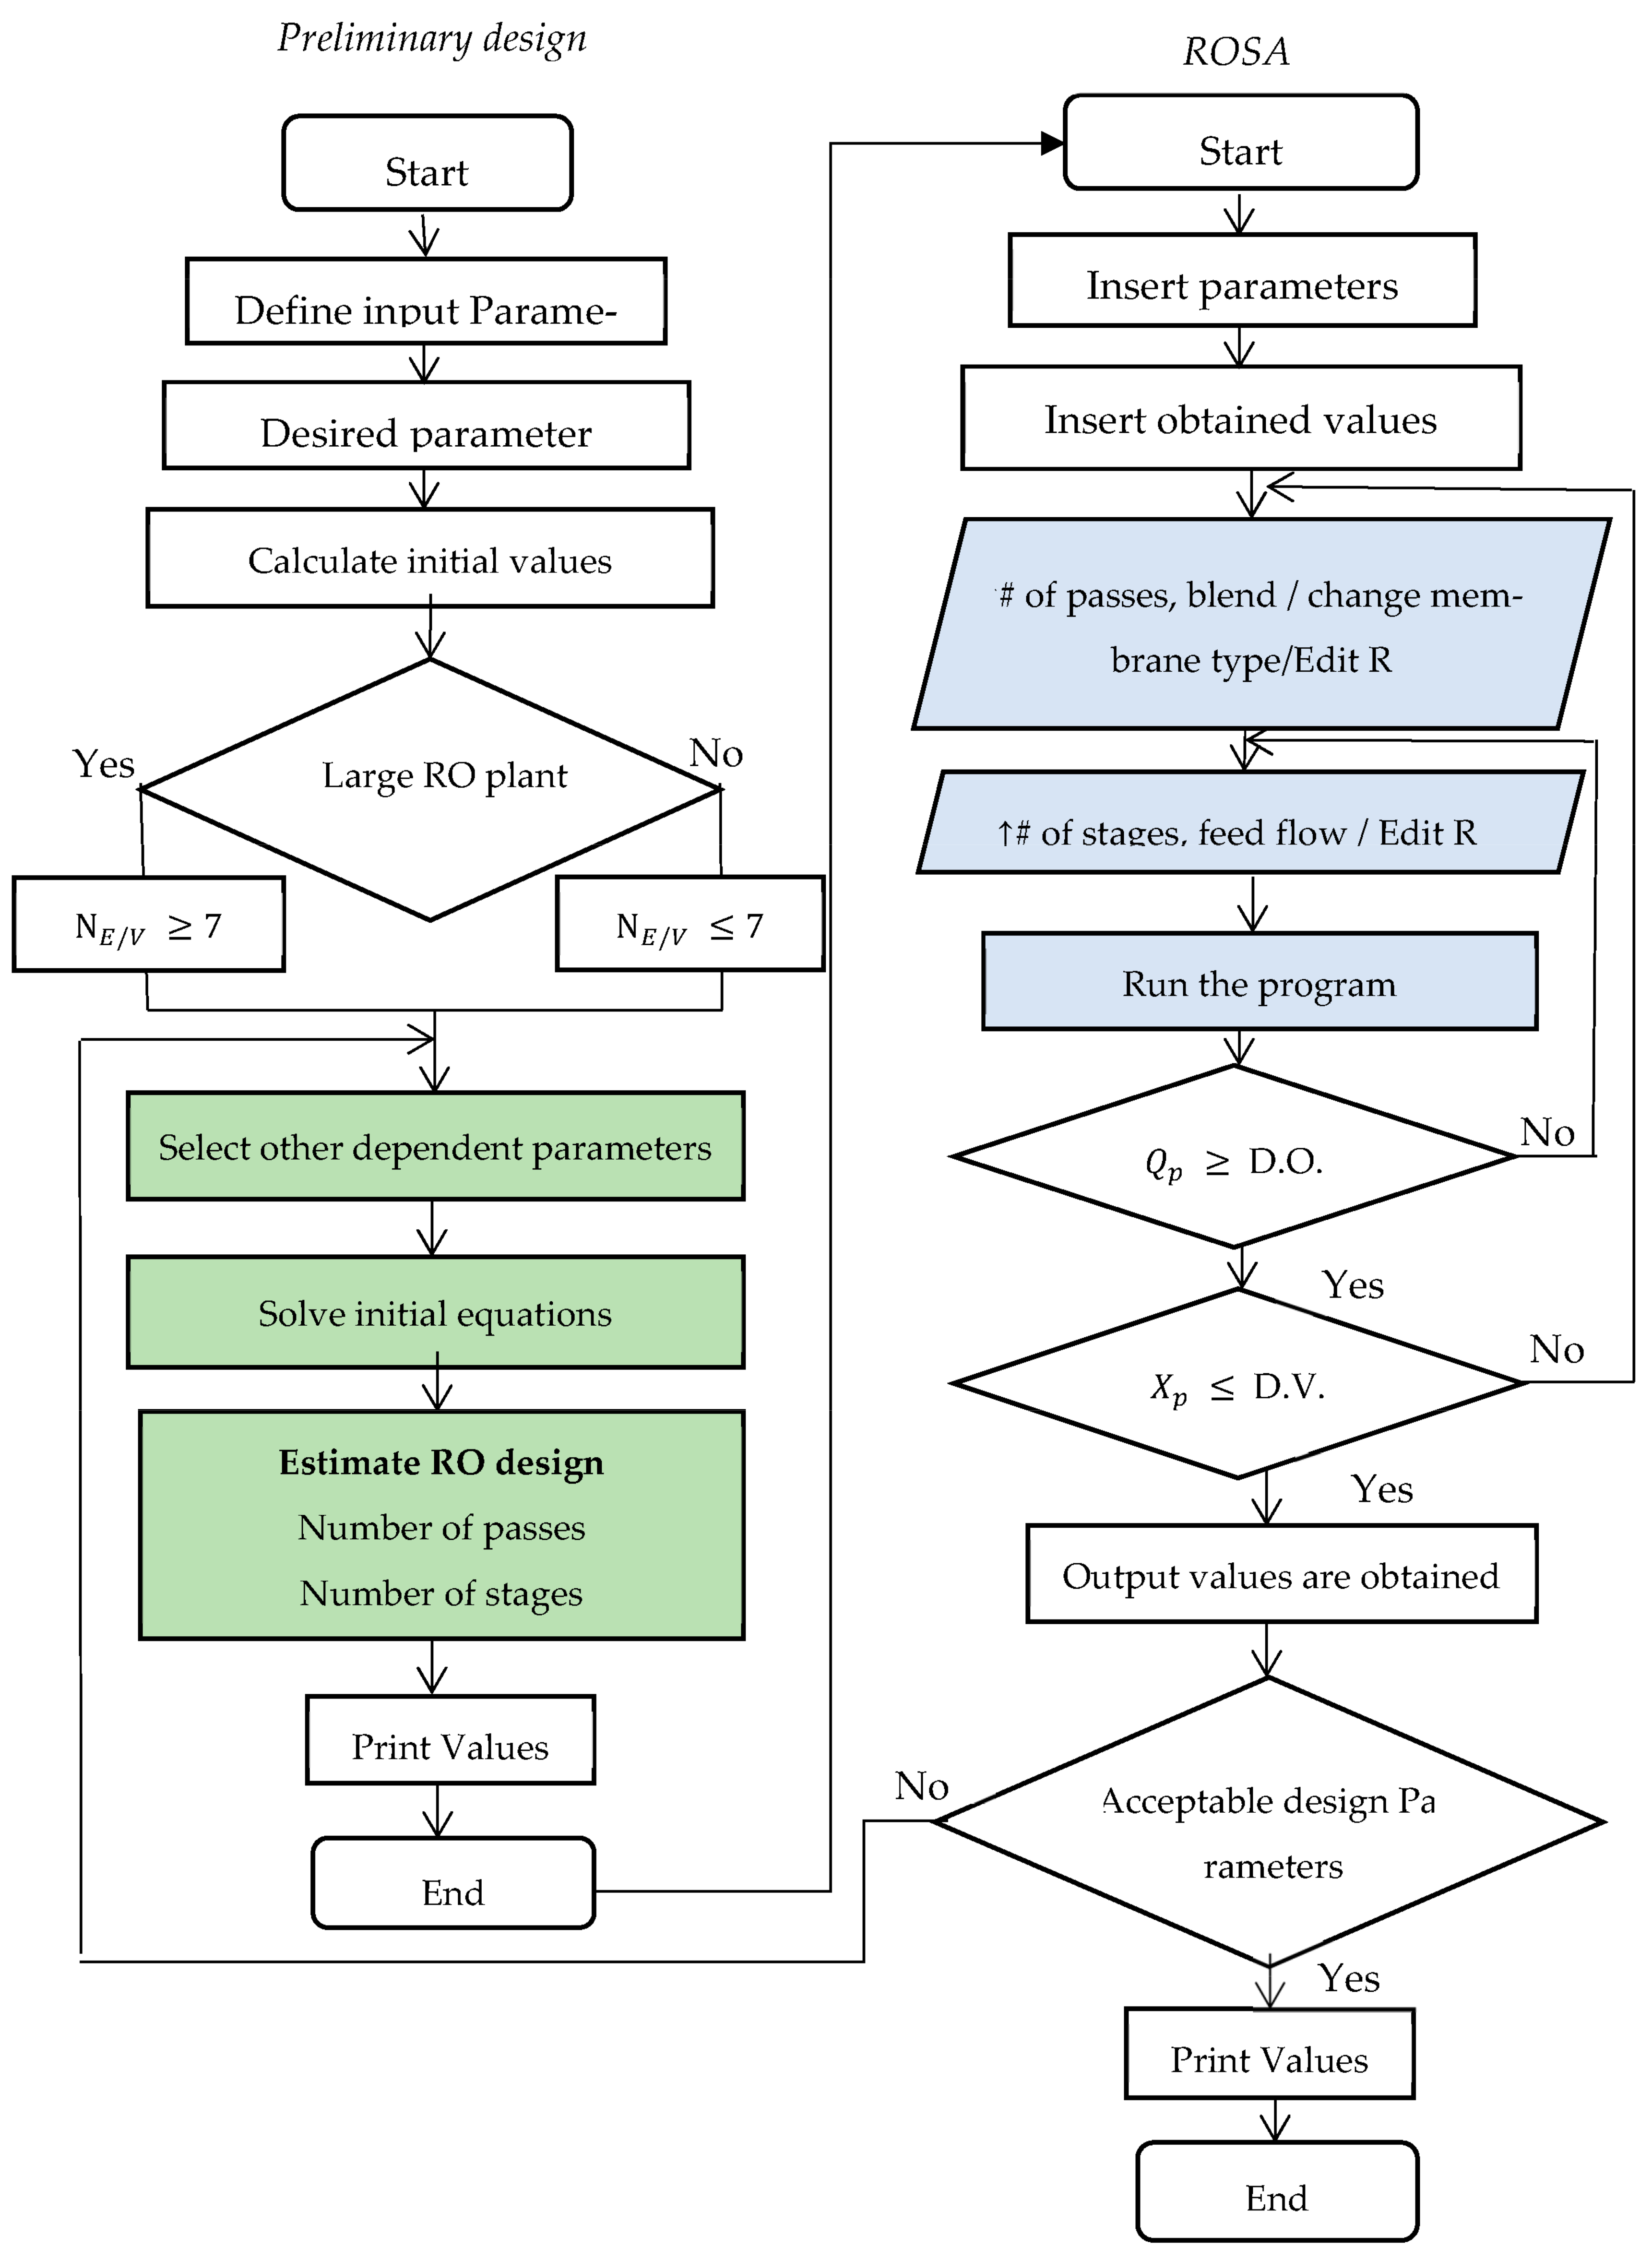
3.4. Flow Chart
Figure 3 shows a flowchart that lists the steps required to design RO and edit according to the results obtained. The user can replace the desired value with the desired parameter chosen at the beginning and go through the flow chart.
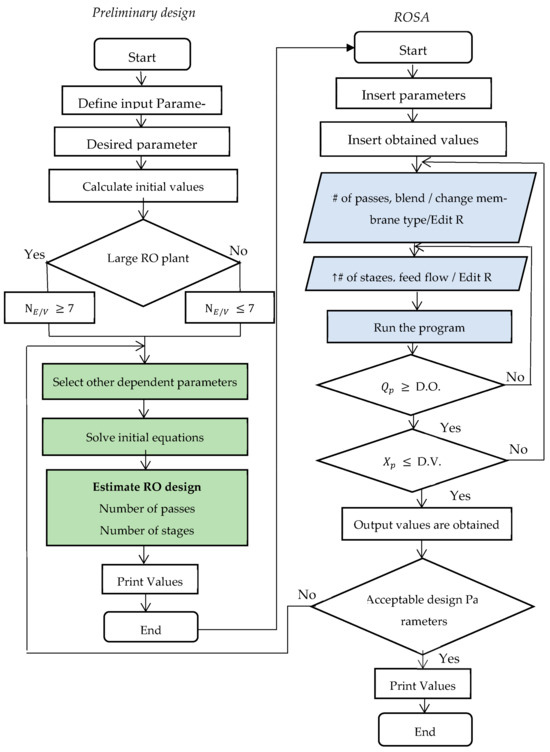
Figure 3.
Flow chart for the RO system design.
The constraints in our case are placed on salinity, which should be less than the desired value (D.V.), and flow rate, which should be greater than the desired output (D.O.). The flow chart is separated into the preliminary design (calculation process) and ROSA design, which requires entering the values into the software. However, the main part of the analysis is after obtaining the results, where, in most cases, the design is edited to reach the desired output value. The editing process depends on the results obtained, and it is classified into two sections:
- –
- Editing is performed on the dependent parameters so they can be changed within the given range which is indicated in the blue boxes in Figure 3. For example, if the results show high salinity, then membrane type or blending quantity can be changed, and the number of passes or stages within the pass can be increased. If the results show low output, then an increase in feed flow rate, number of stages, or recovery ratio can be made.
- –
- Editing is performed mainly on the design input parameters which are indicated in green boxes in Figure 3. For example, changing the temperature or feed water type membrane area requires recalculations before using the software and determining the dependent parameters.
3.5. Reducing Energy Consumption
Optimizing energy consumption in RO processes involves a comprehensive approach that includes three main points: selecting high-efficiency pumps and membranes, configuring them optimally, and implementing advanced control and monitoring systems. When it comes to predictive algorithms detecting and predicting membrane fouling or other system failures in RO desalination plants, it is a promising avenue for enhancing efficiency. Optimizing the selection and configuration of pumps entails using high-efficiency variable speed pumps to adjust flow rate and pressure in real time, reducing energy consumption by operating only at necessary capacity. Integrating ERDs like pressure exchangers or turbochargers also helps by recovering energy from the high-pressure brine stream and transferring it to the incoming feed water [33]. Advanced pump materials and designs, such as those made from composites and featuring magnetic bearings, reduce frictional losses and improve efficiency. Proper pump sizing is crucial, as correctly sized pumps prevent inefficiencies associated with both oversized and undersized pumps. In large RO plants, employing multiple smaller pumps in parallel instead of a single large pump enhances efficiency and flexibility, allowing for energy savings during low demand periods. The selection and configuration of membranes are crucial for reducing energy consumption, as optimal design can provide high output with the same input energy [16]. Additionally, implementing advanced process control and monitoring systems is important. Using sophisticated control systems and performance monitoring, along with predictive maintenance leveraging machine learning and artificial intelligence, can further reduce energy consumption and enhance overall efficiency [20,29].
4. Results and Discussion
The performance of the SWRO system is studied using the calculated design configurations, and the values are inserted in ROSA. The results are shown in Figure 4, where numbers without the letter “A” represent the flow in and out of the first pass. When the letter “A” is present, it indicates the flow for the second pass. The number 1 is the flow that is coming from the FW and is applied to filtration, 2 is the flow coming from the FW after being filtered, and 3 is the flow that passes through the PX to recuperate the pressure loss. The number 5 is the product of the first cycle, but it still has high TDS, so it is applied to another desalination process. The numbers 4 and 6 are the brine from the first and second passes. The number 7 is a part of the product that has around 140 mg/L TDS and will be mixed with the final product 8, which has a TDS of 3.4 mg/L, and 9 is the mixture between 7 and 8 with the required TDS of 100.3 mg/L. The number 10 is the retentate that is used again in the PX.
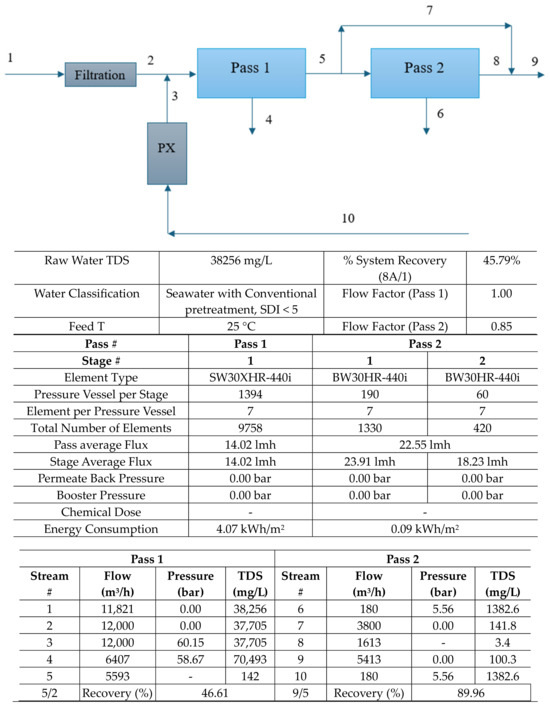
Figure 4.
Flow diagram of the process in the first and second stages.
From Figure 4, it is noticed that the specific energy is 4.07 kWh/m3 before applying the PX. A permeate flow rate of 3800 m3/h in the first pass is blended with the permeate from the second pass to reach the final permeate of 5410 m3/h. The feedwater in pass 1 is assumed to be 12,000 m3/h at a recovery of 46.6%; in pass 2, the recovery is set at 90%, and the overall system recovery becomes 45.8% with a final permeate flow rate of 5413 m3/h.
A pressure exchanger is a method for recovering the lost energy from the brine. The brine indicated by the letter (E) in Figure 5 leaves with high pressure; this pressure can be captured as “Captured Pressure (CP)” and exchanged with FW (G) using PX, which helps in reducing the need for extra power. Figure 5 shows the assembly of PX and the way it exchanges pressure, and three main parameters are affected by PX: salinity, pressure, and flow rate [21,37,39]. The TDS of the flow before the membrane is calculated as per Equation (7):
where the parameter “TDS” represents the total dissolved solids in the flow, measured in parts per million (ppm). “Q” denotes the volumetric flow rate, expressed in cubic meters per hour (m3/h). The letters “A” and “G” in the indices indicate the respective positions of the flow as depicted in Figure 5. The remaining values in Figure 5 are obtained from the software and reflect the configurations of the PX.
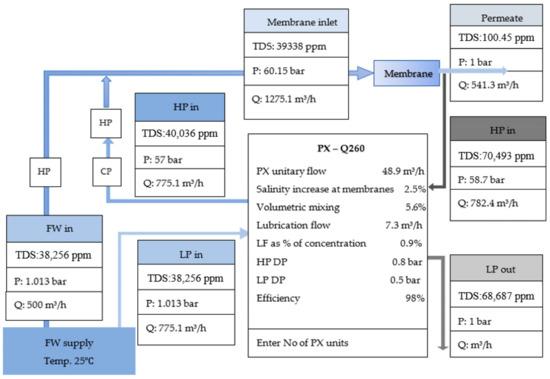
Figure 5.
ERD PX model.
4.1. Comparison between the Main Parameters
As noticed in the previous section, there is a range of selections that can be chosen; accordingly, different cases will be taken to investigate the effect of each parameter on the results, and then, a comparison will be held among the cases. In each case, one of the dependent parameters will vary, while the others are fixed, as illustrated in Table 10.
Table 10.
Varied and fixed parameters in each of the six cases.
In some cases, the design exceeds the limits, for example, feedwater temperature in RO where the temperature should not exceed 45 °C to avoid fouling and technical issues. However, it is taken just to study the variation in the other parameters. Note that the dashed curves in the graphs below belong to the secondary axis.
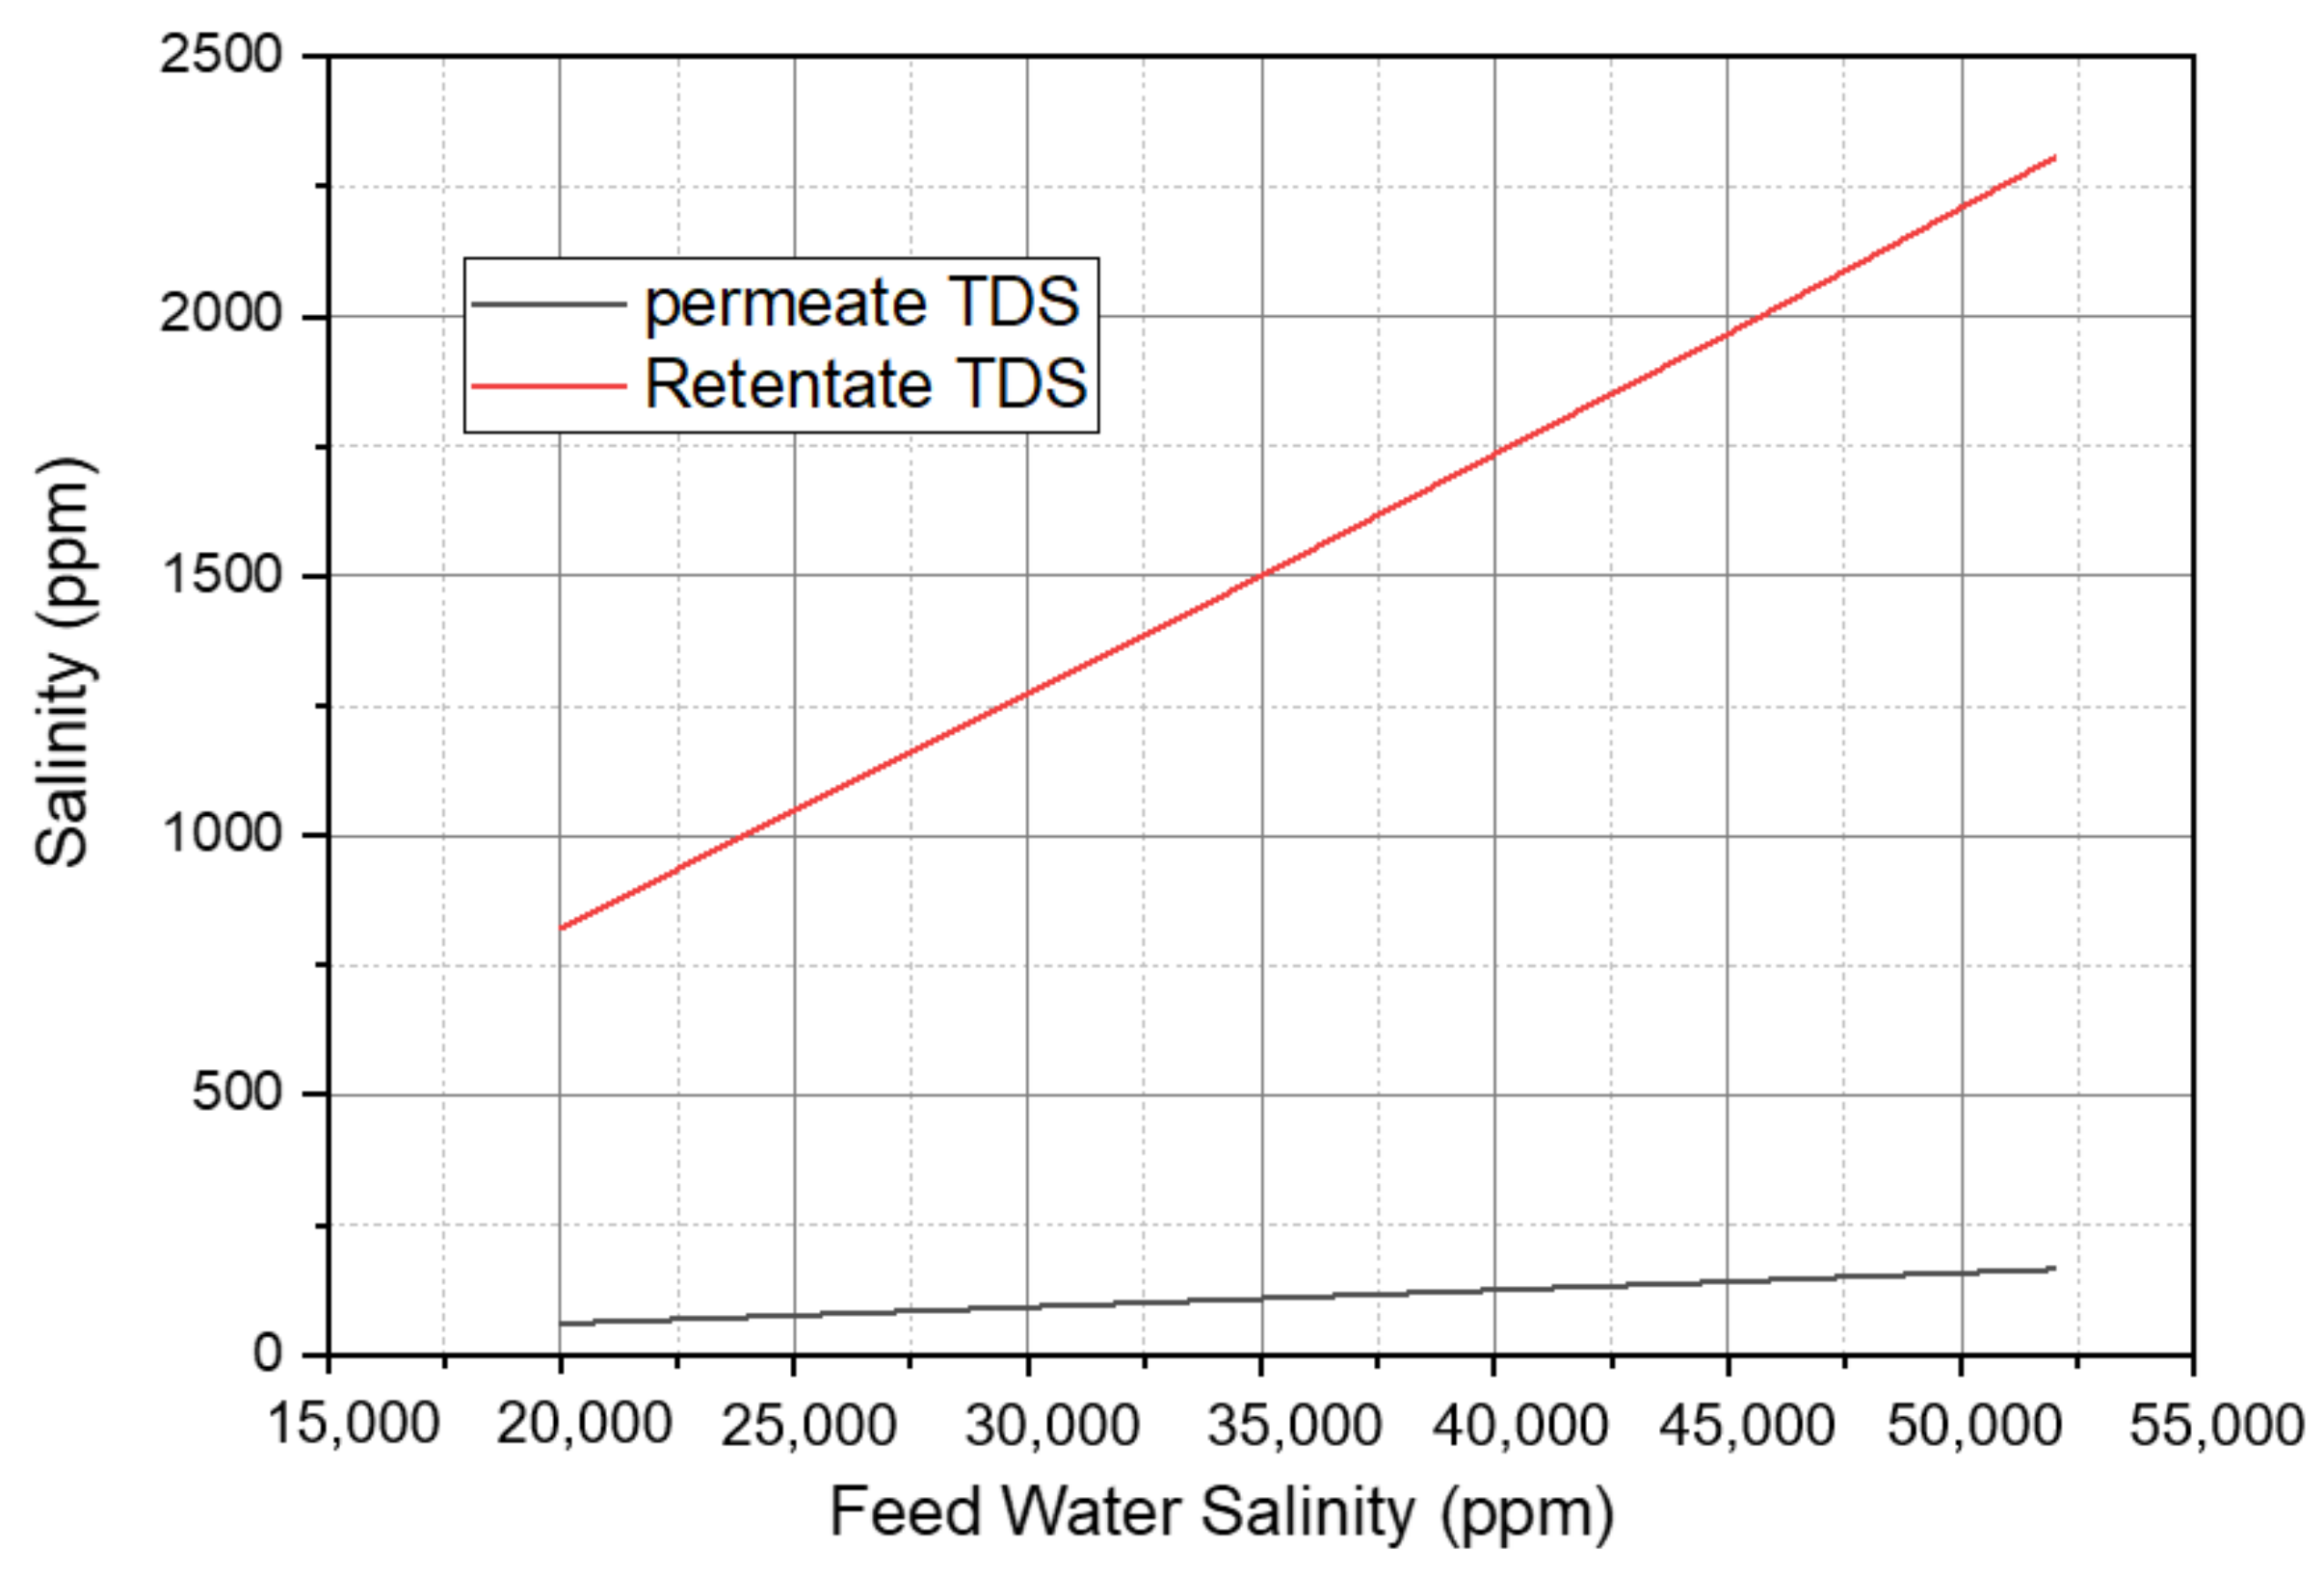
- Case 1:
In the first case, all parameters are fixed except for the salinity, which varies from 20,000 to 52,000 ppm. The retentate R is the concentrate from pass 2 to the feed for pass 1.
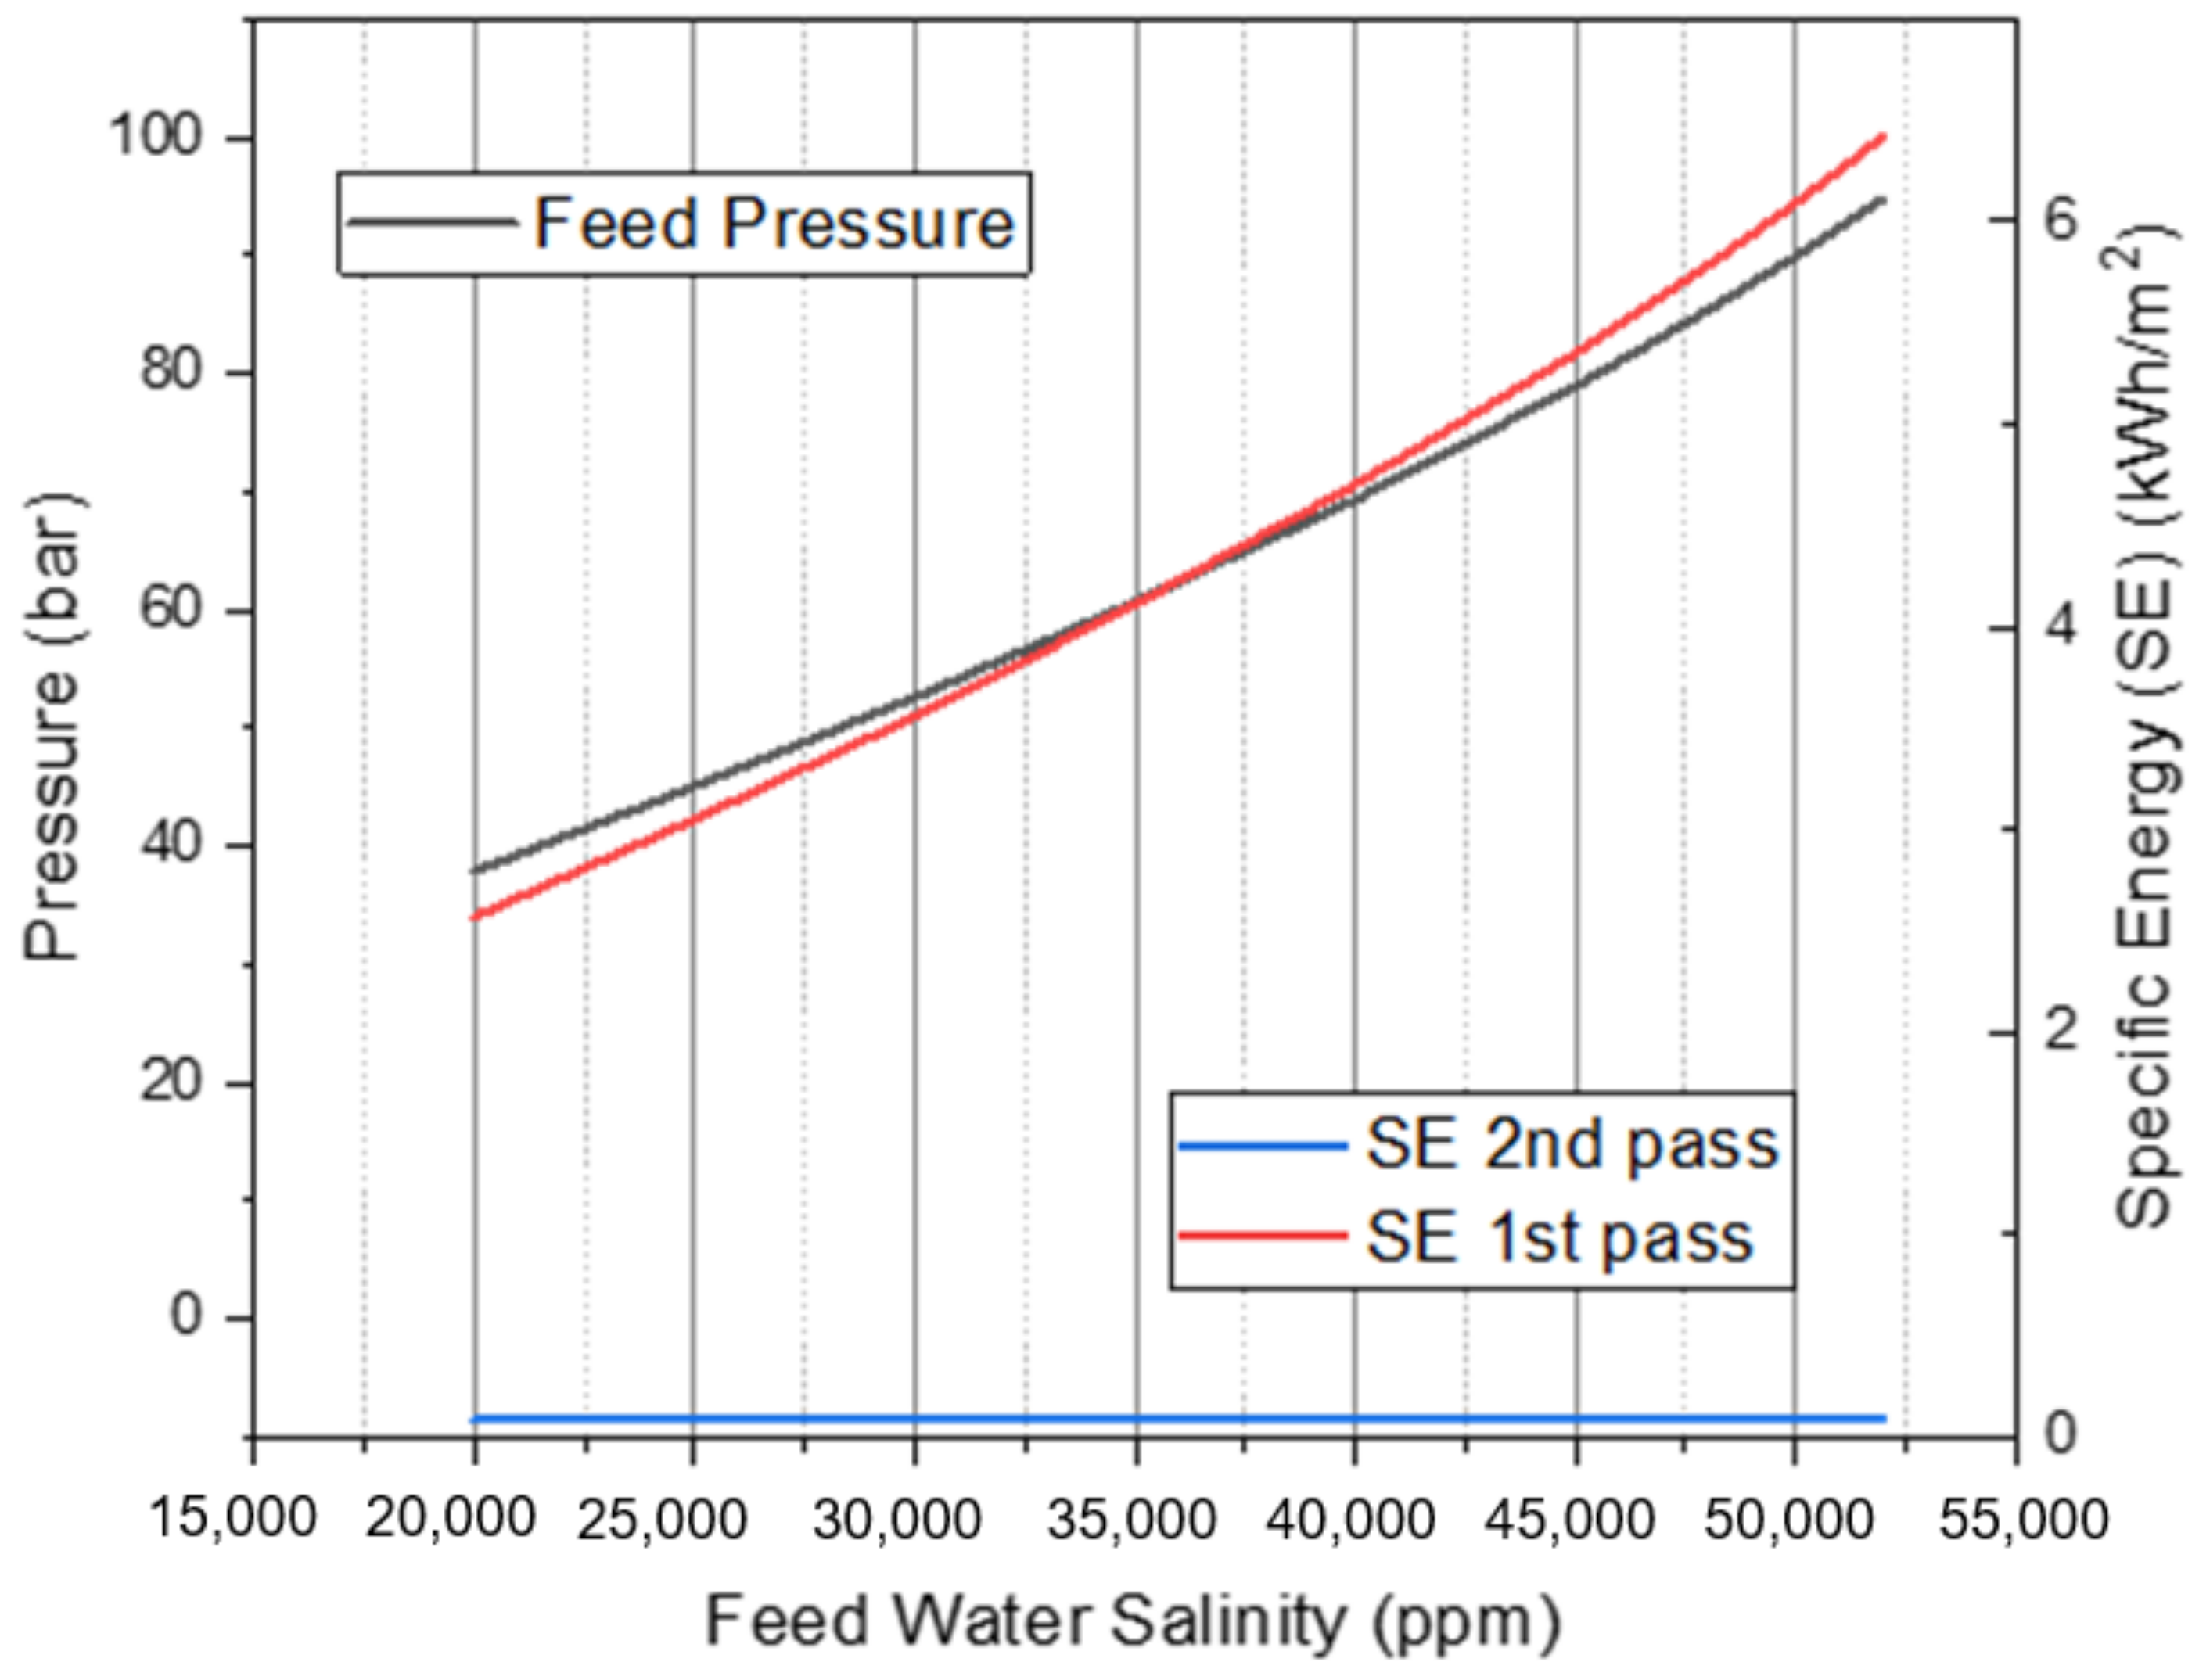
It is noticed from Figure 6 that the permeate and retentate salinity increase with the increase in FW salinity which is logically expected. However, the rate of increase in retentate salinity is higher than that in the permeate, which is probably due to the required TDS that the membrane should provide and the higher rate of increase in the feed pressure as noticed in Figure 6. Additionally, SE in the first pass and feed pressure increase with the increase in FW salinity as illustrated in Figure 7. Yet, the SE in the second pass remains constant; this is probably due to the approximate rate of increase in retentate salinity that is higher than that in the permeate.
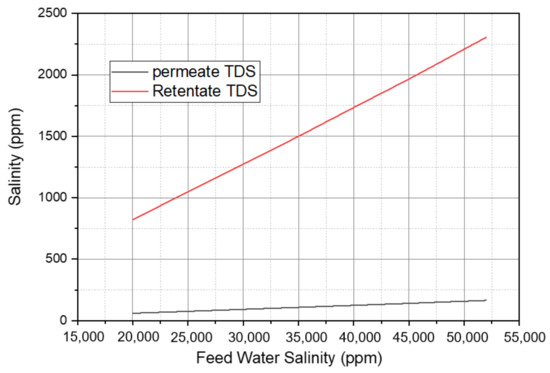
Figure 6.
Variation in permeate and retentate salinity versus feedwater salinity at 25 °C, 12,000 m3/h feedwater flow rate, 46.6% recovery for the first pass, and 90% recovery for the second pass.
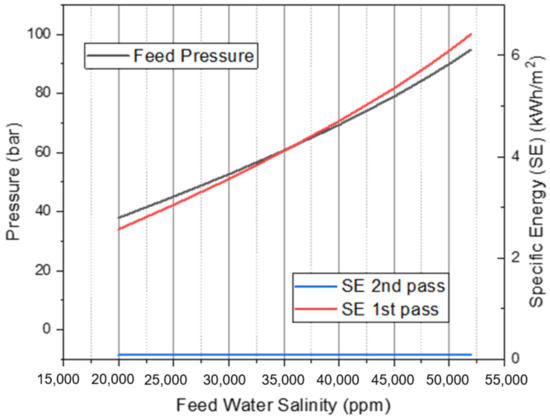
Figure 7.
Variation in feedwater pressure, SE in first and second pass versus feed water salinity at 25 °C, 12,000 m3/h feedwater flow rate, 46.6% recovery for the first pass, and 90% recovery for the second pass.
- Case 2:
In the second case, all the parameters are fixed as in the example except for the temperature, which varies between different values from 15 to 50 °C.
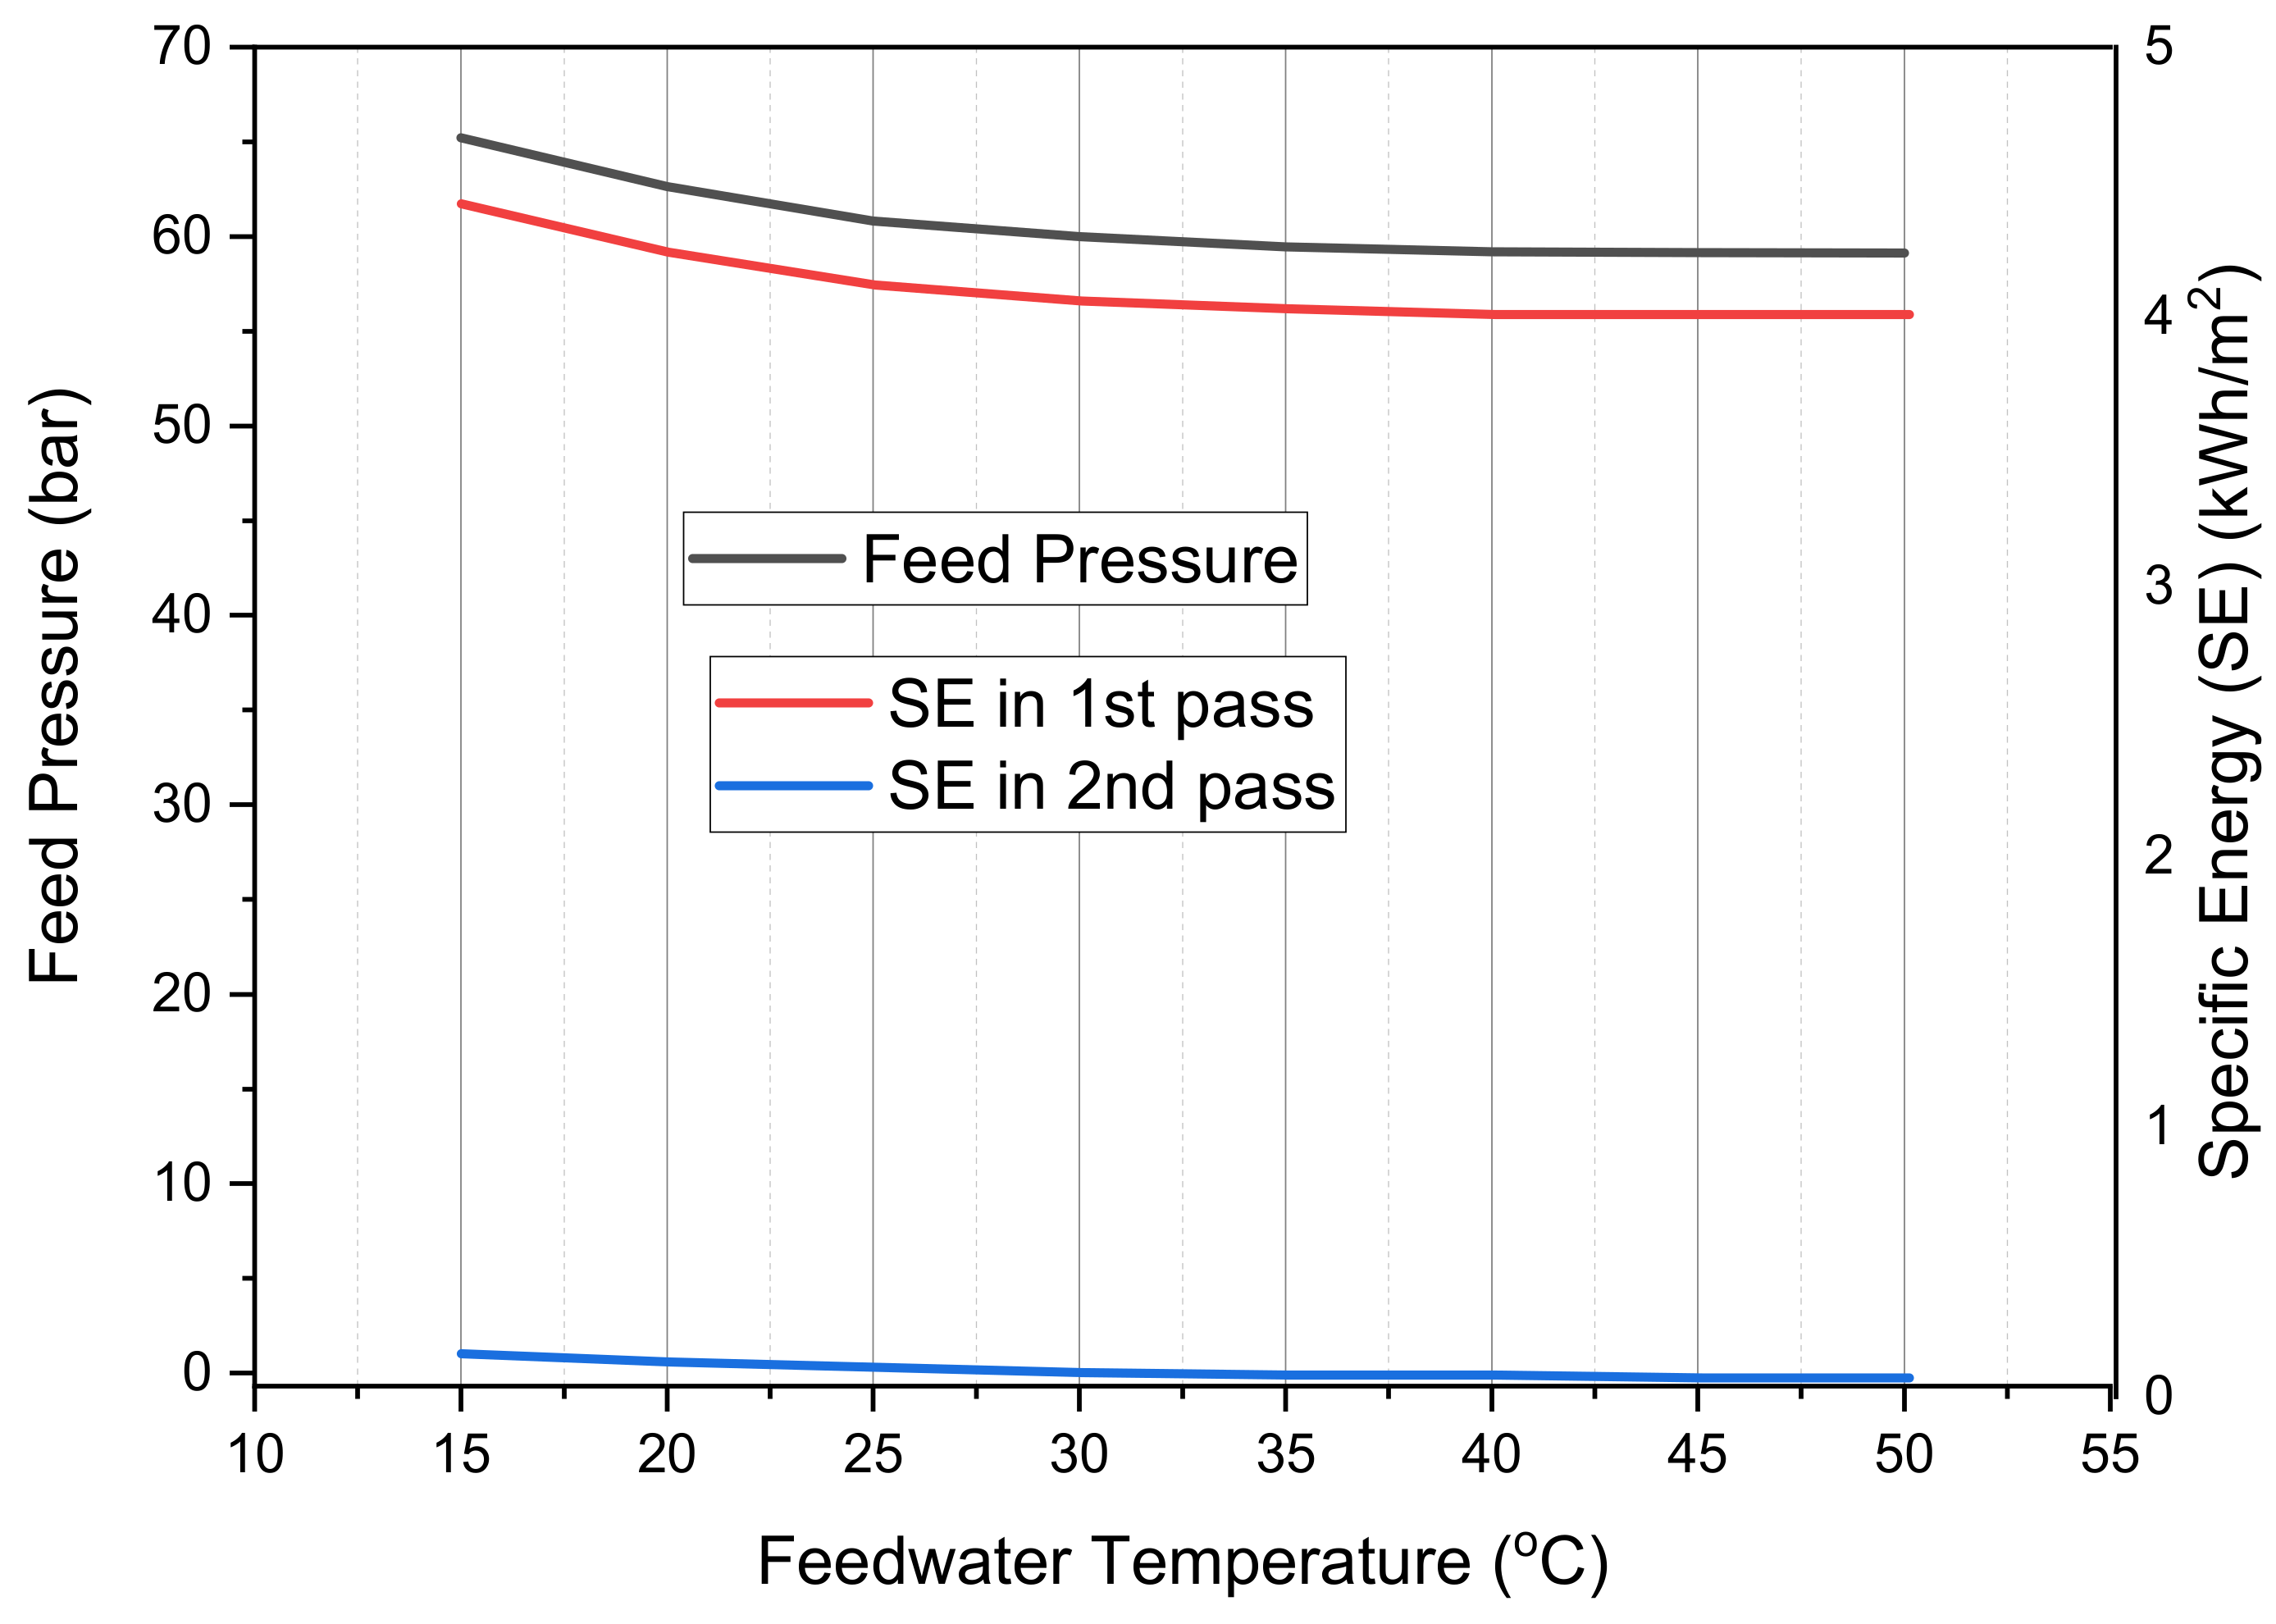
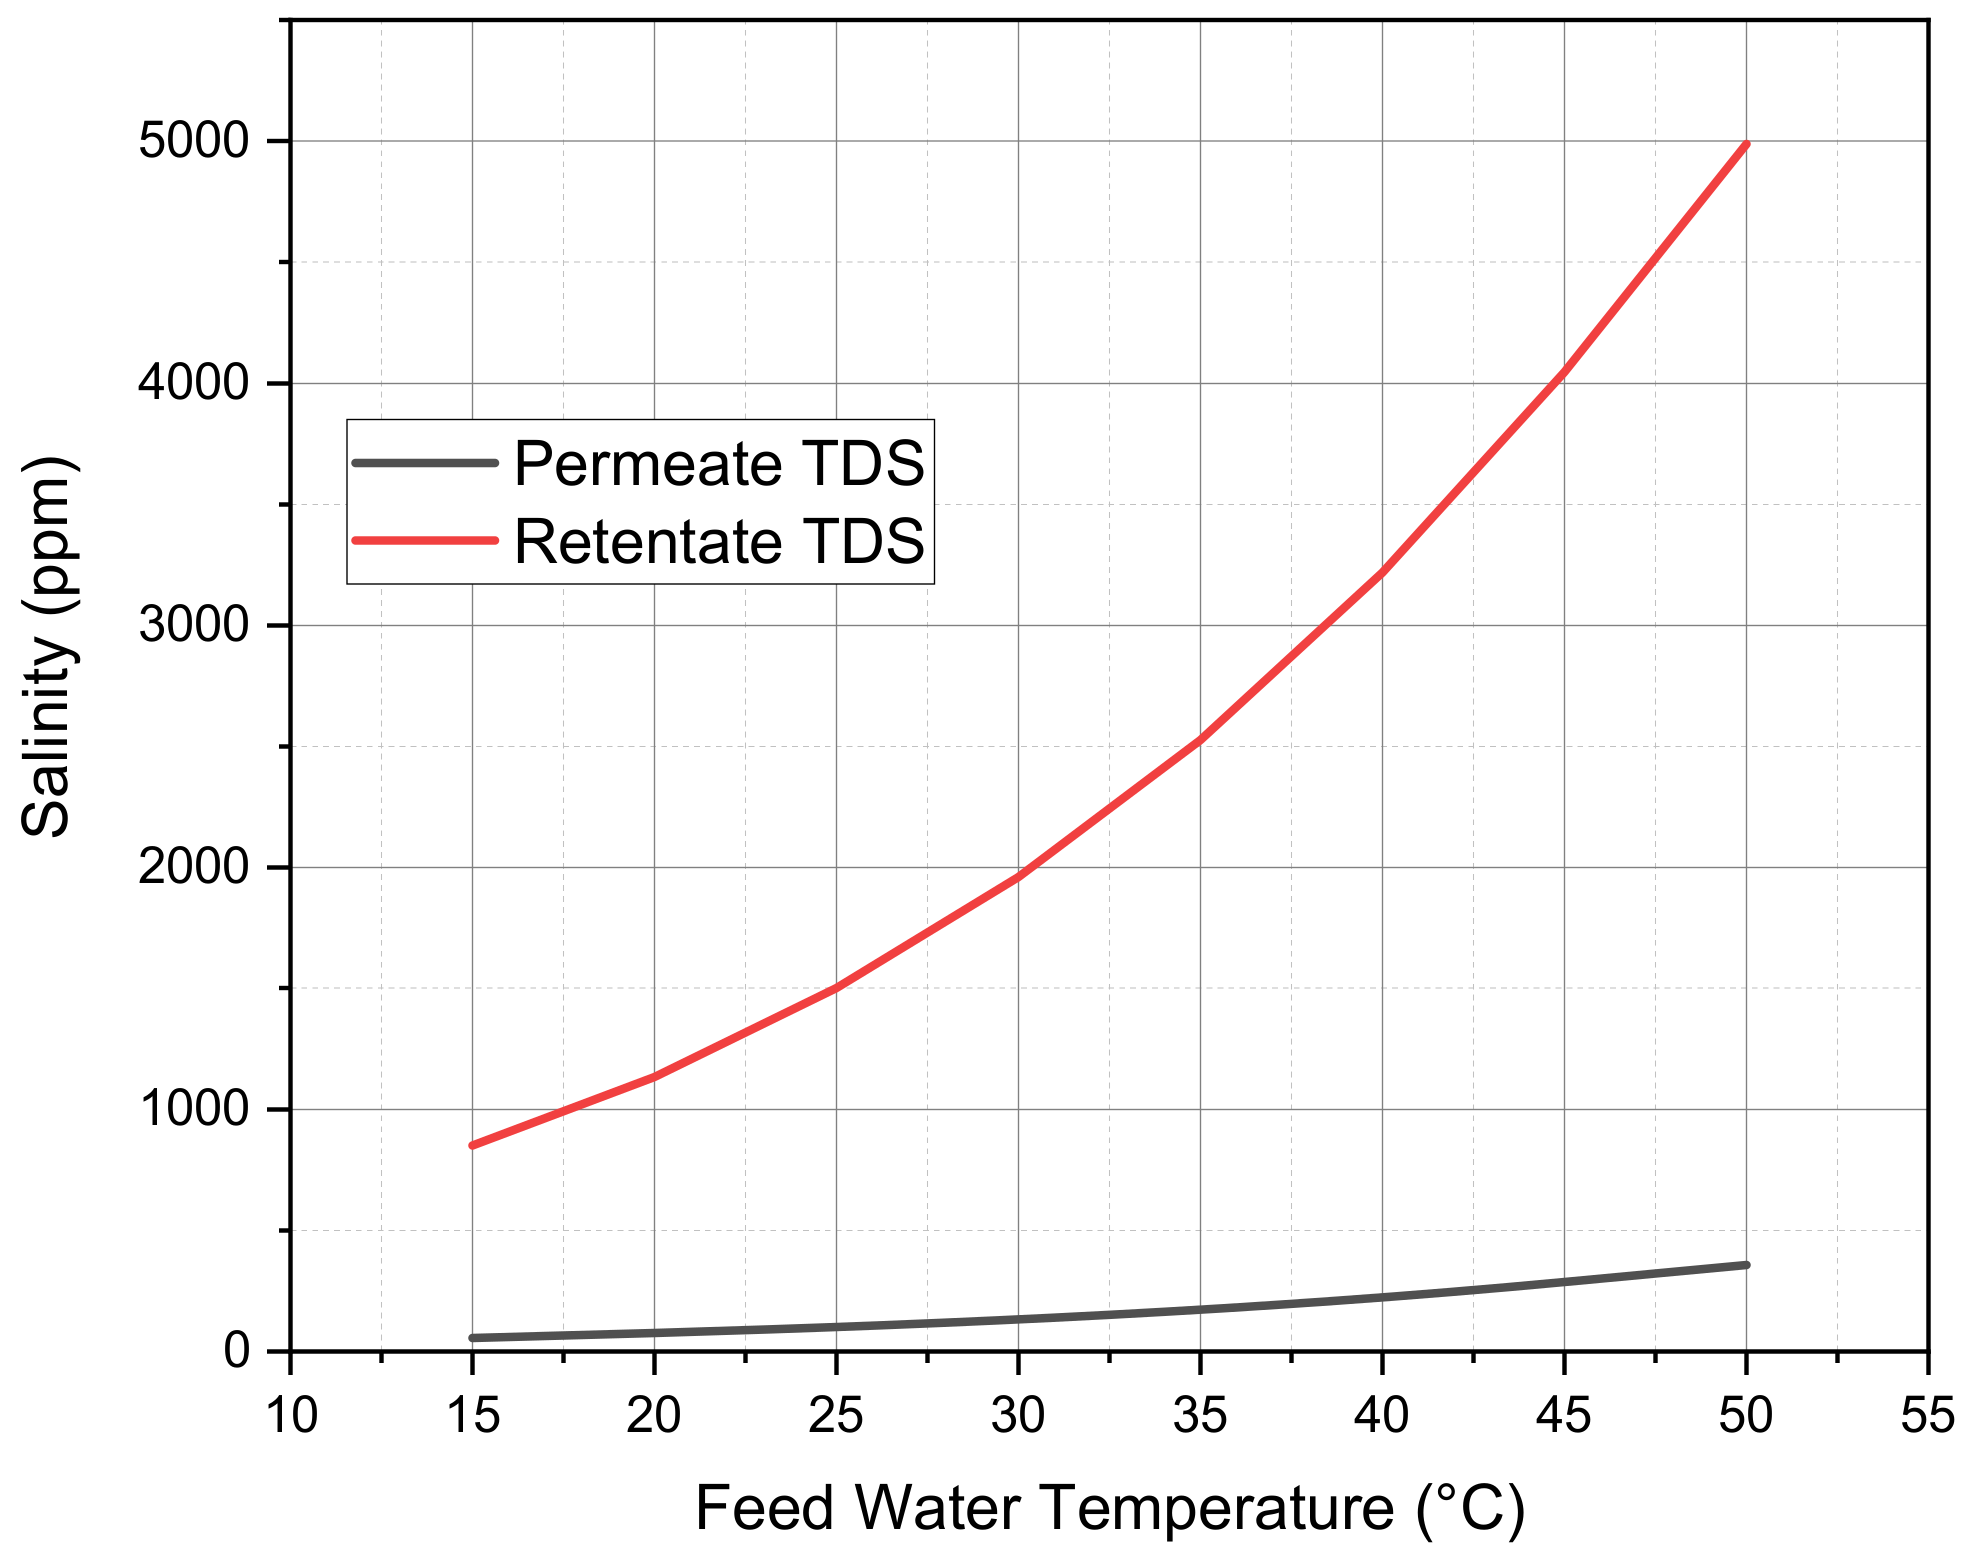
It is noticed from Figure 8 and Figure 9 that the feed pressure and specific energy in the first and second pass decrease with the increase in feed water temperature. However, the retentate and permeate TDS increase. This can be justified probably because an increase in temperature results in a decrease in the viscosity of water, which increases permeate flow rate and solute permeation rate and decreases the feed pressure. It is also noticed that the feed pressure and specific energy consumption in the first and second pass curves reach a plateau for specific temperatures above 30–35 °C, where they become steady. It is because the membrane is limited to a maximum temperature of 45 °C, and above this temperature, there will be technical and fouling problems. Additionally, the SE in the second pass is slightly affected by the increase in temperature, and this is due to the membrane used.
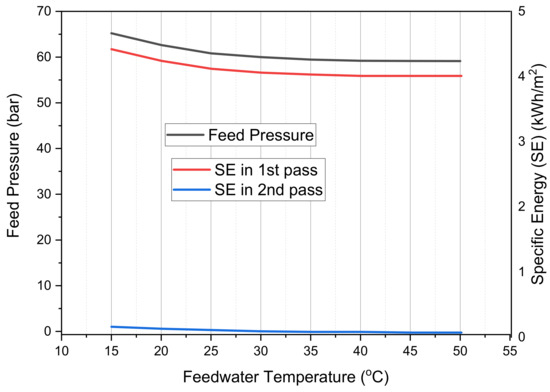
Figure 8.
Variation in FW pressure, SE in first and second pass vs. T at 38255 ppm, 12,000 m3/h FW flow rate, 46.6% recovery for the first pass, and 90% recovery for the second pass SW.

Figure 9.
Variation in permeate and retentate salinity vs. T at 38,255 ppm, 12,000 m3/h feedwater flow rate, 46.6% recovery for the first pass, and 90% recovery for the second pass.
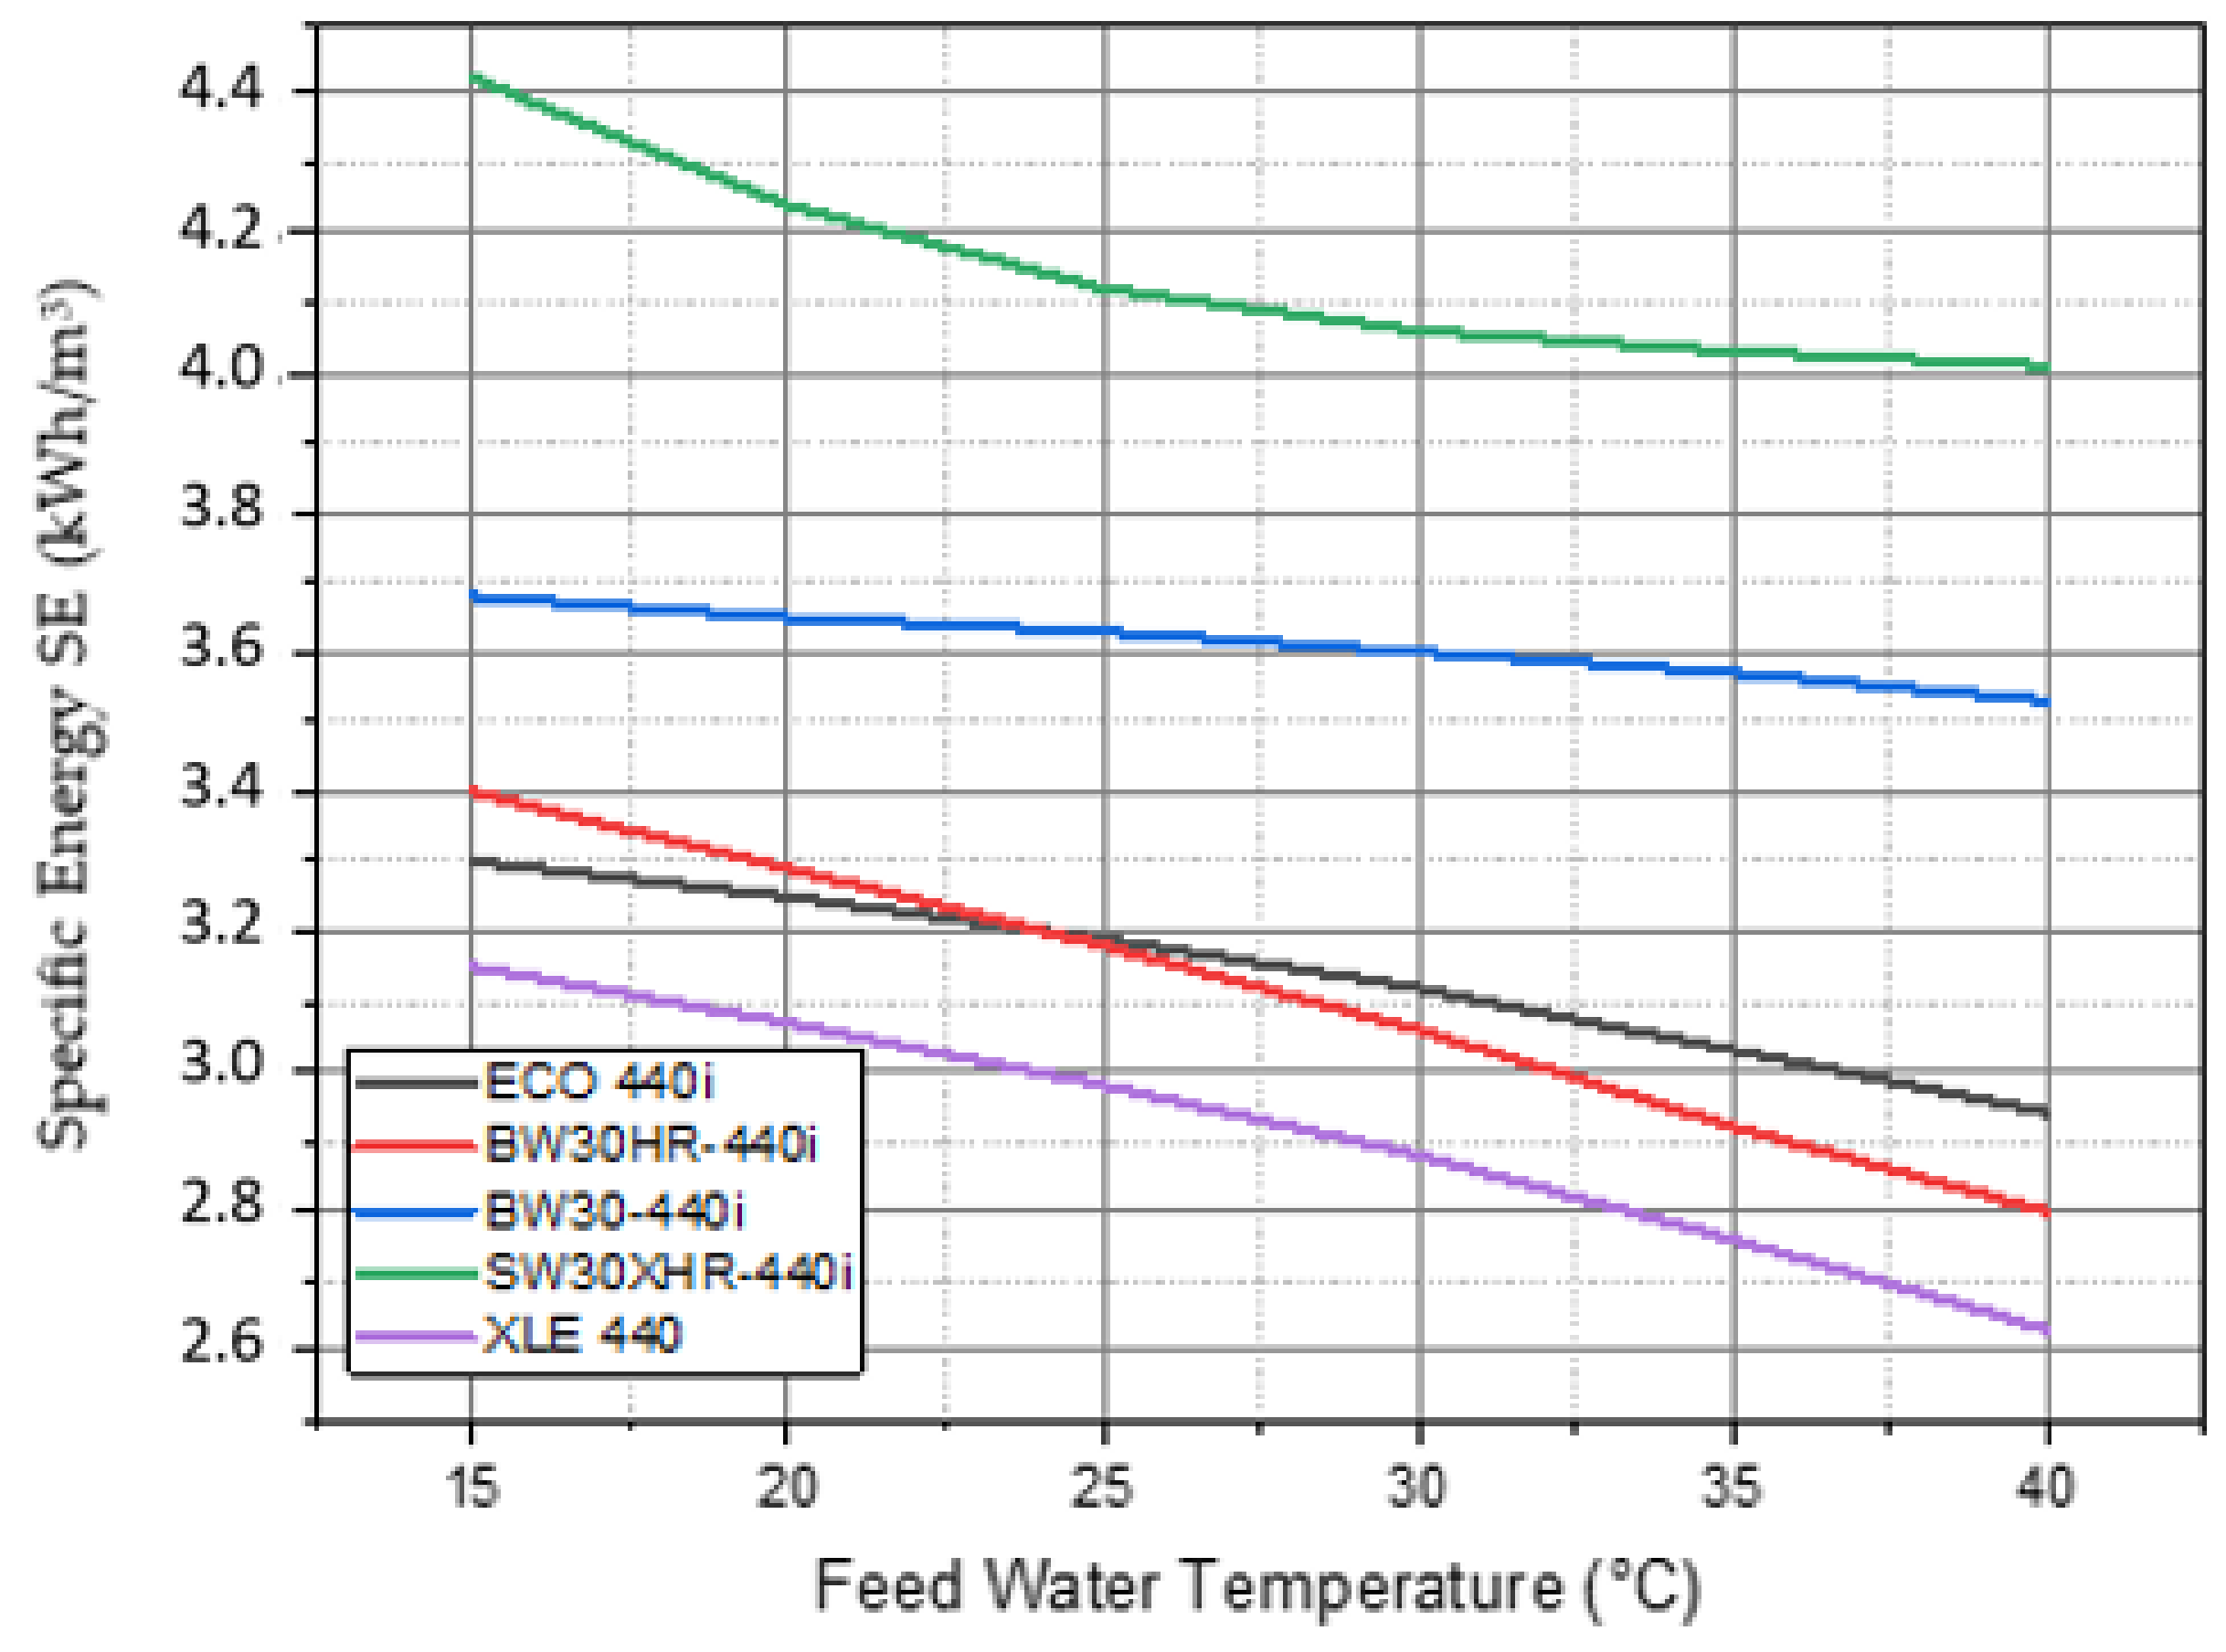
Figure 10 indicates that as temperature increases, SE decreases. However, the decrease is not the same for all membranes. For example, when BW 30-440i of SR 99.5% or XLE 440 of SR 99% is used, the temperature change has a lower effect than that in SWHX440i of SR 99.82% or ECO-440i of SR 99.7%, or BW30HR-440i of SR 99.7%. This is probably due to the pores of each membrane where membranes with smaller pores are less affected by the temperature difference than membranes with larger pores.

Figure 10.
SE for different membranes vs. the FW temperature at 38255 ppm FW salinity, 12,000 m3/h feed flowrate, and 46.6% recovery ratio.
- Case 3:
In the third case, the membrane type of the first pass is changed, where four membranes of the same area are chosen (different areas affect the number of elements and pressure vessels). Table 11 shows the specifications of the chosen membranes.
Table 11.
Specifications of each of the chosen membrane type.
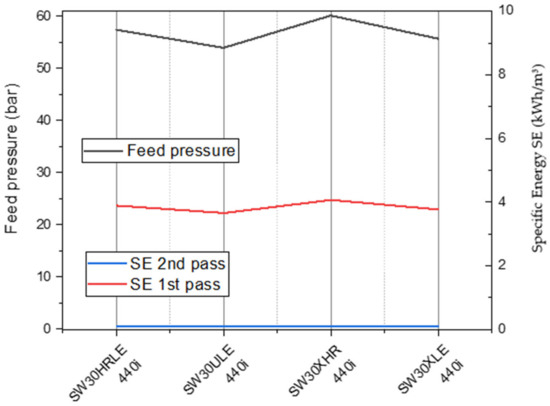
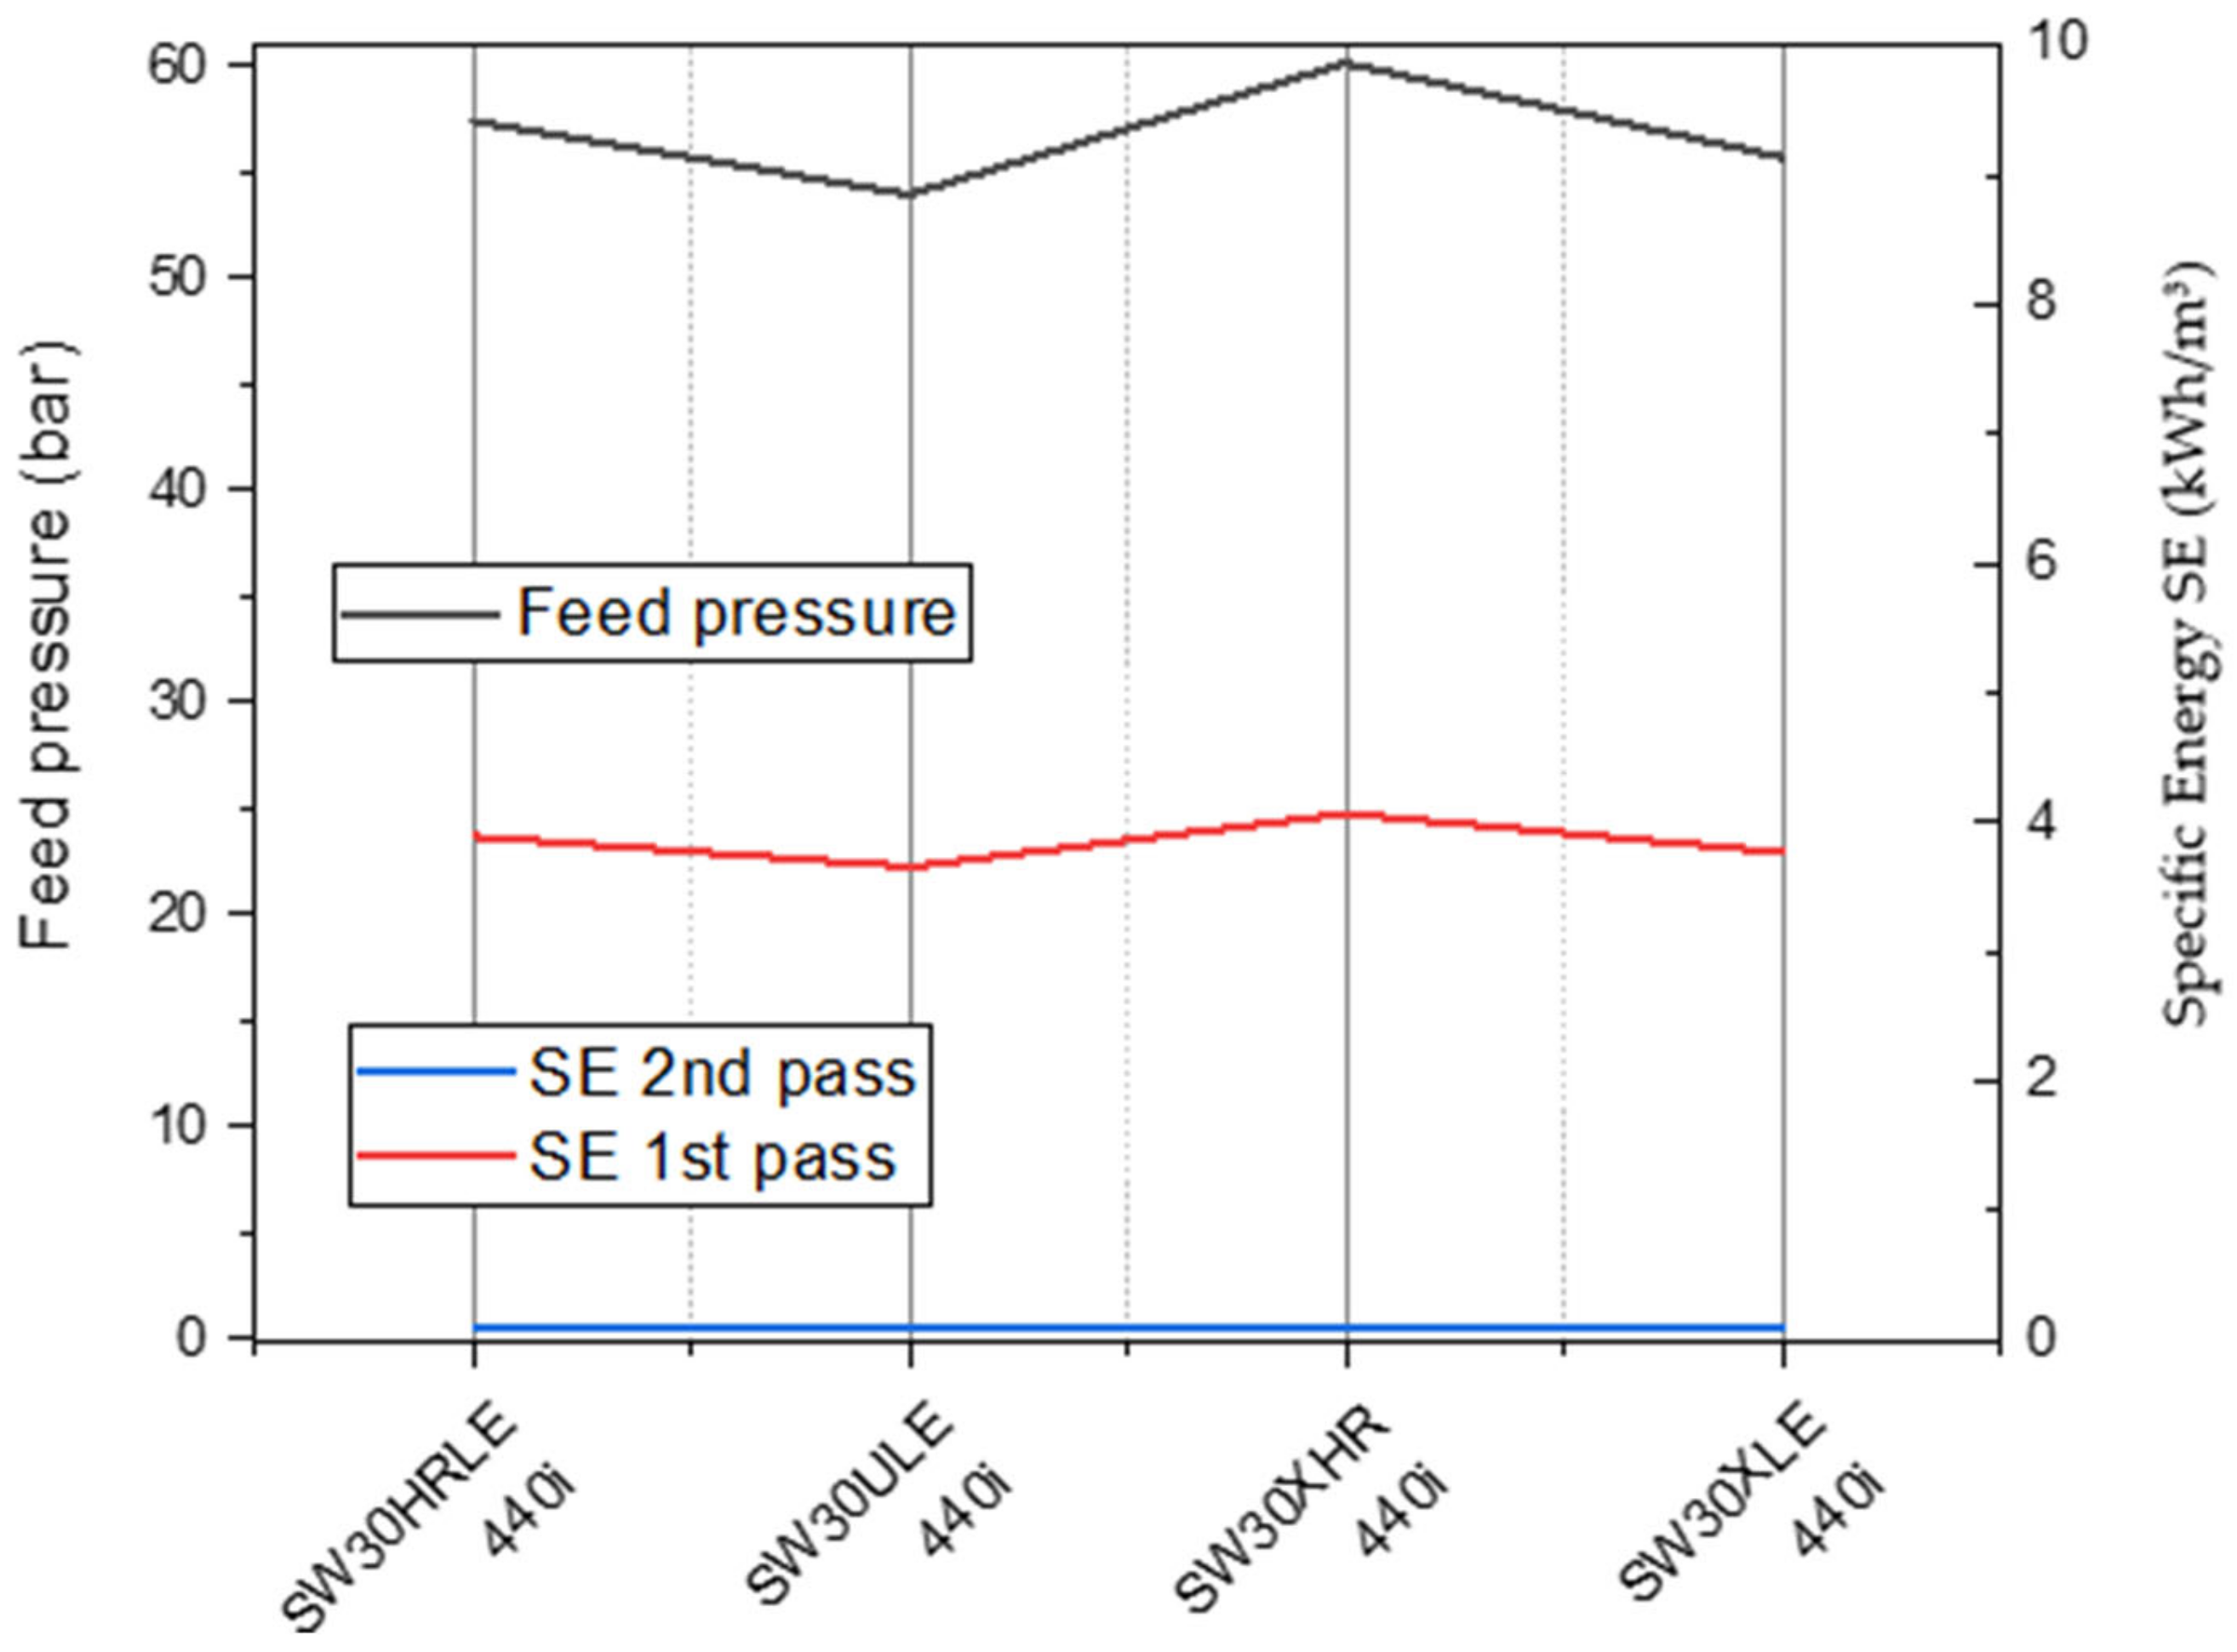
Figure 11.
Variation in FW pressure, SE in first and second pass versus membrane-type at 25 °C, 38,255 ppm, 12,000 m3/h FW flow rate, 46.6% recovery for the first pass, and 90% R for the second pass.

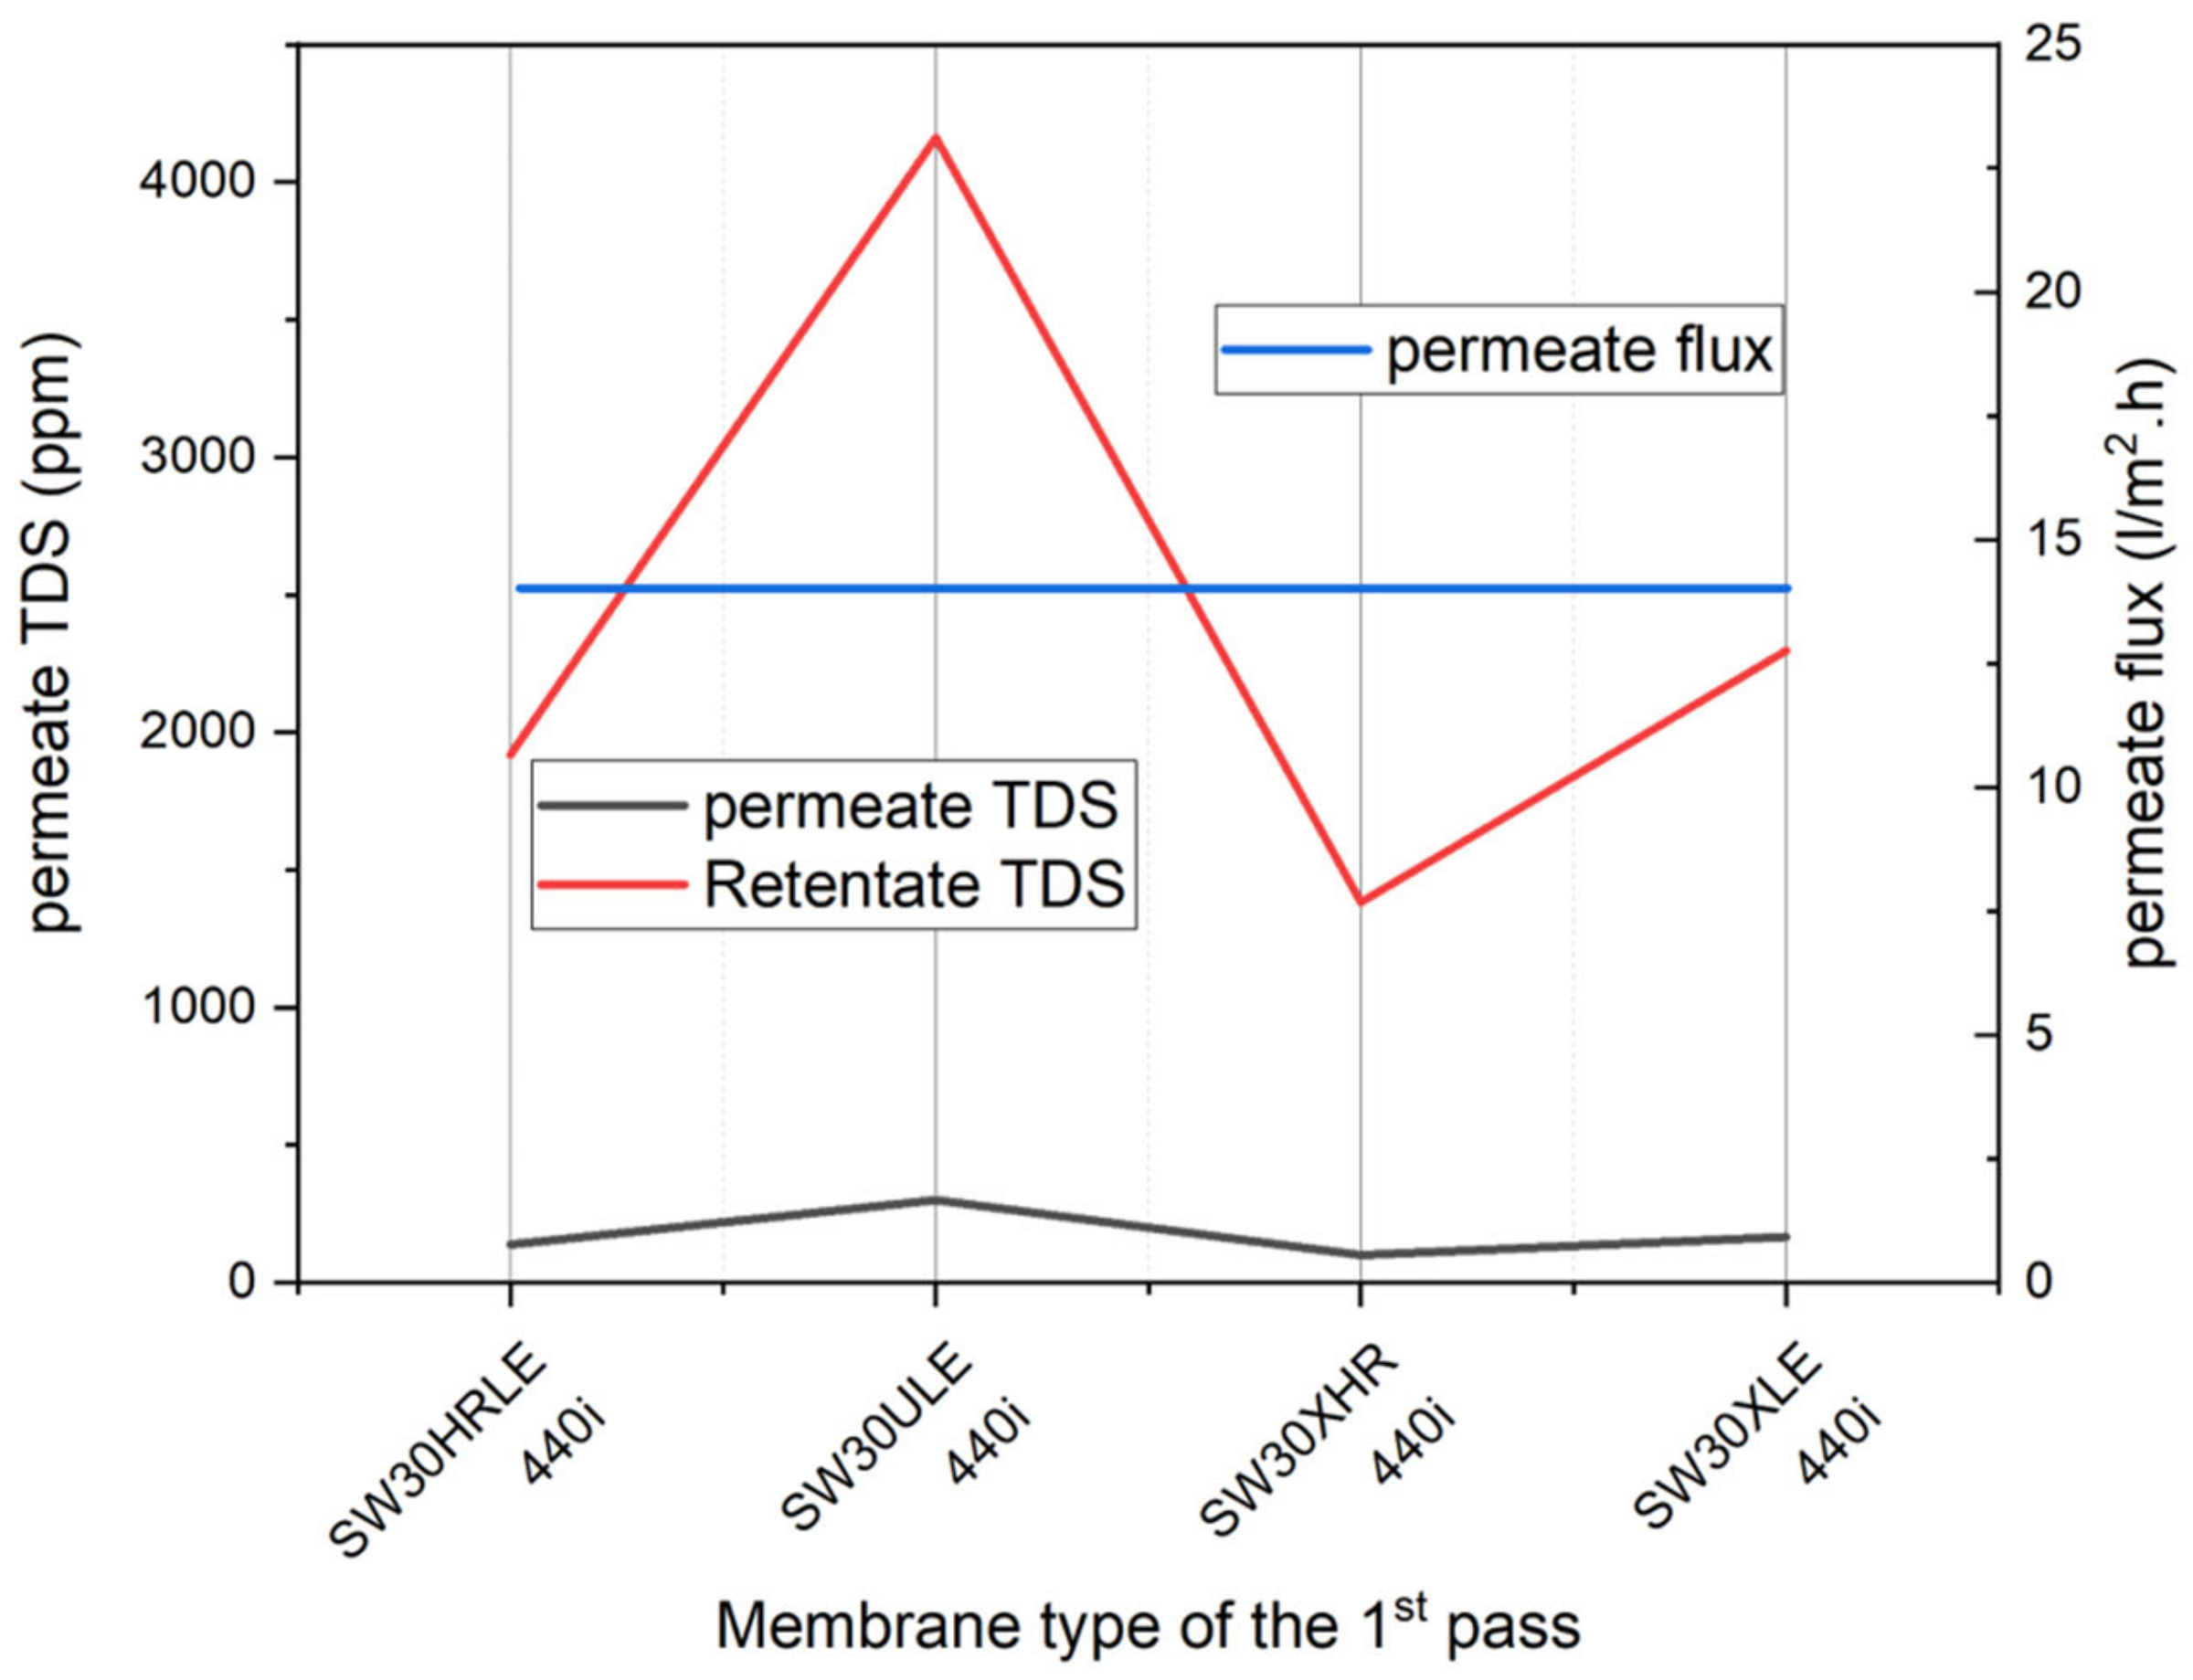
Figure 12.
Variation in Retentate and permeate vs. membrane-type at 25 °C FW temp, 38,255 ppm FW salinity, 12,000 m3/h FW flow rate, 46.6% R for the first pass, and 90% recovery for the second pass.
It is noticed that the membrane type has a significant effect on the feed pressure, TDS, and SE in the first pass as can be seen in Figure 11 and Figure 12. Yet, in both the retentate and permeate, the TDS increases. Additionally, it is noticed that the TDS of the permeate and retentate change oppositely to the feed pressure and SE, where the membrane that requires higher feed pressure and SE provides the lowest salinity. This can be explained by the fact that the membranes that require higher pressure have high salt rejection, which provides lower salinity. Additionally, it is found that membrane type does not affect membrane system flux because the flux depends on area and flow rate. However, in our case, all the membranes are of the same area (40.9 m2), and the flow rate is constant.
- Case 4:
In the 4th case, feed pressure varies from 65 to 100 bar, while other parameters are fixed.
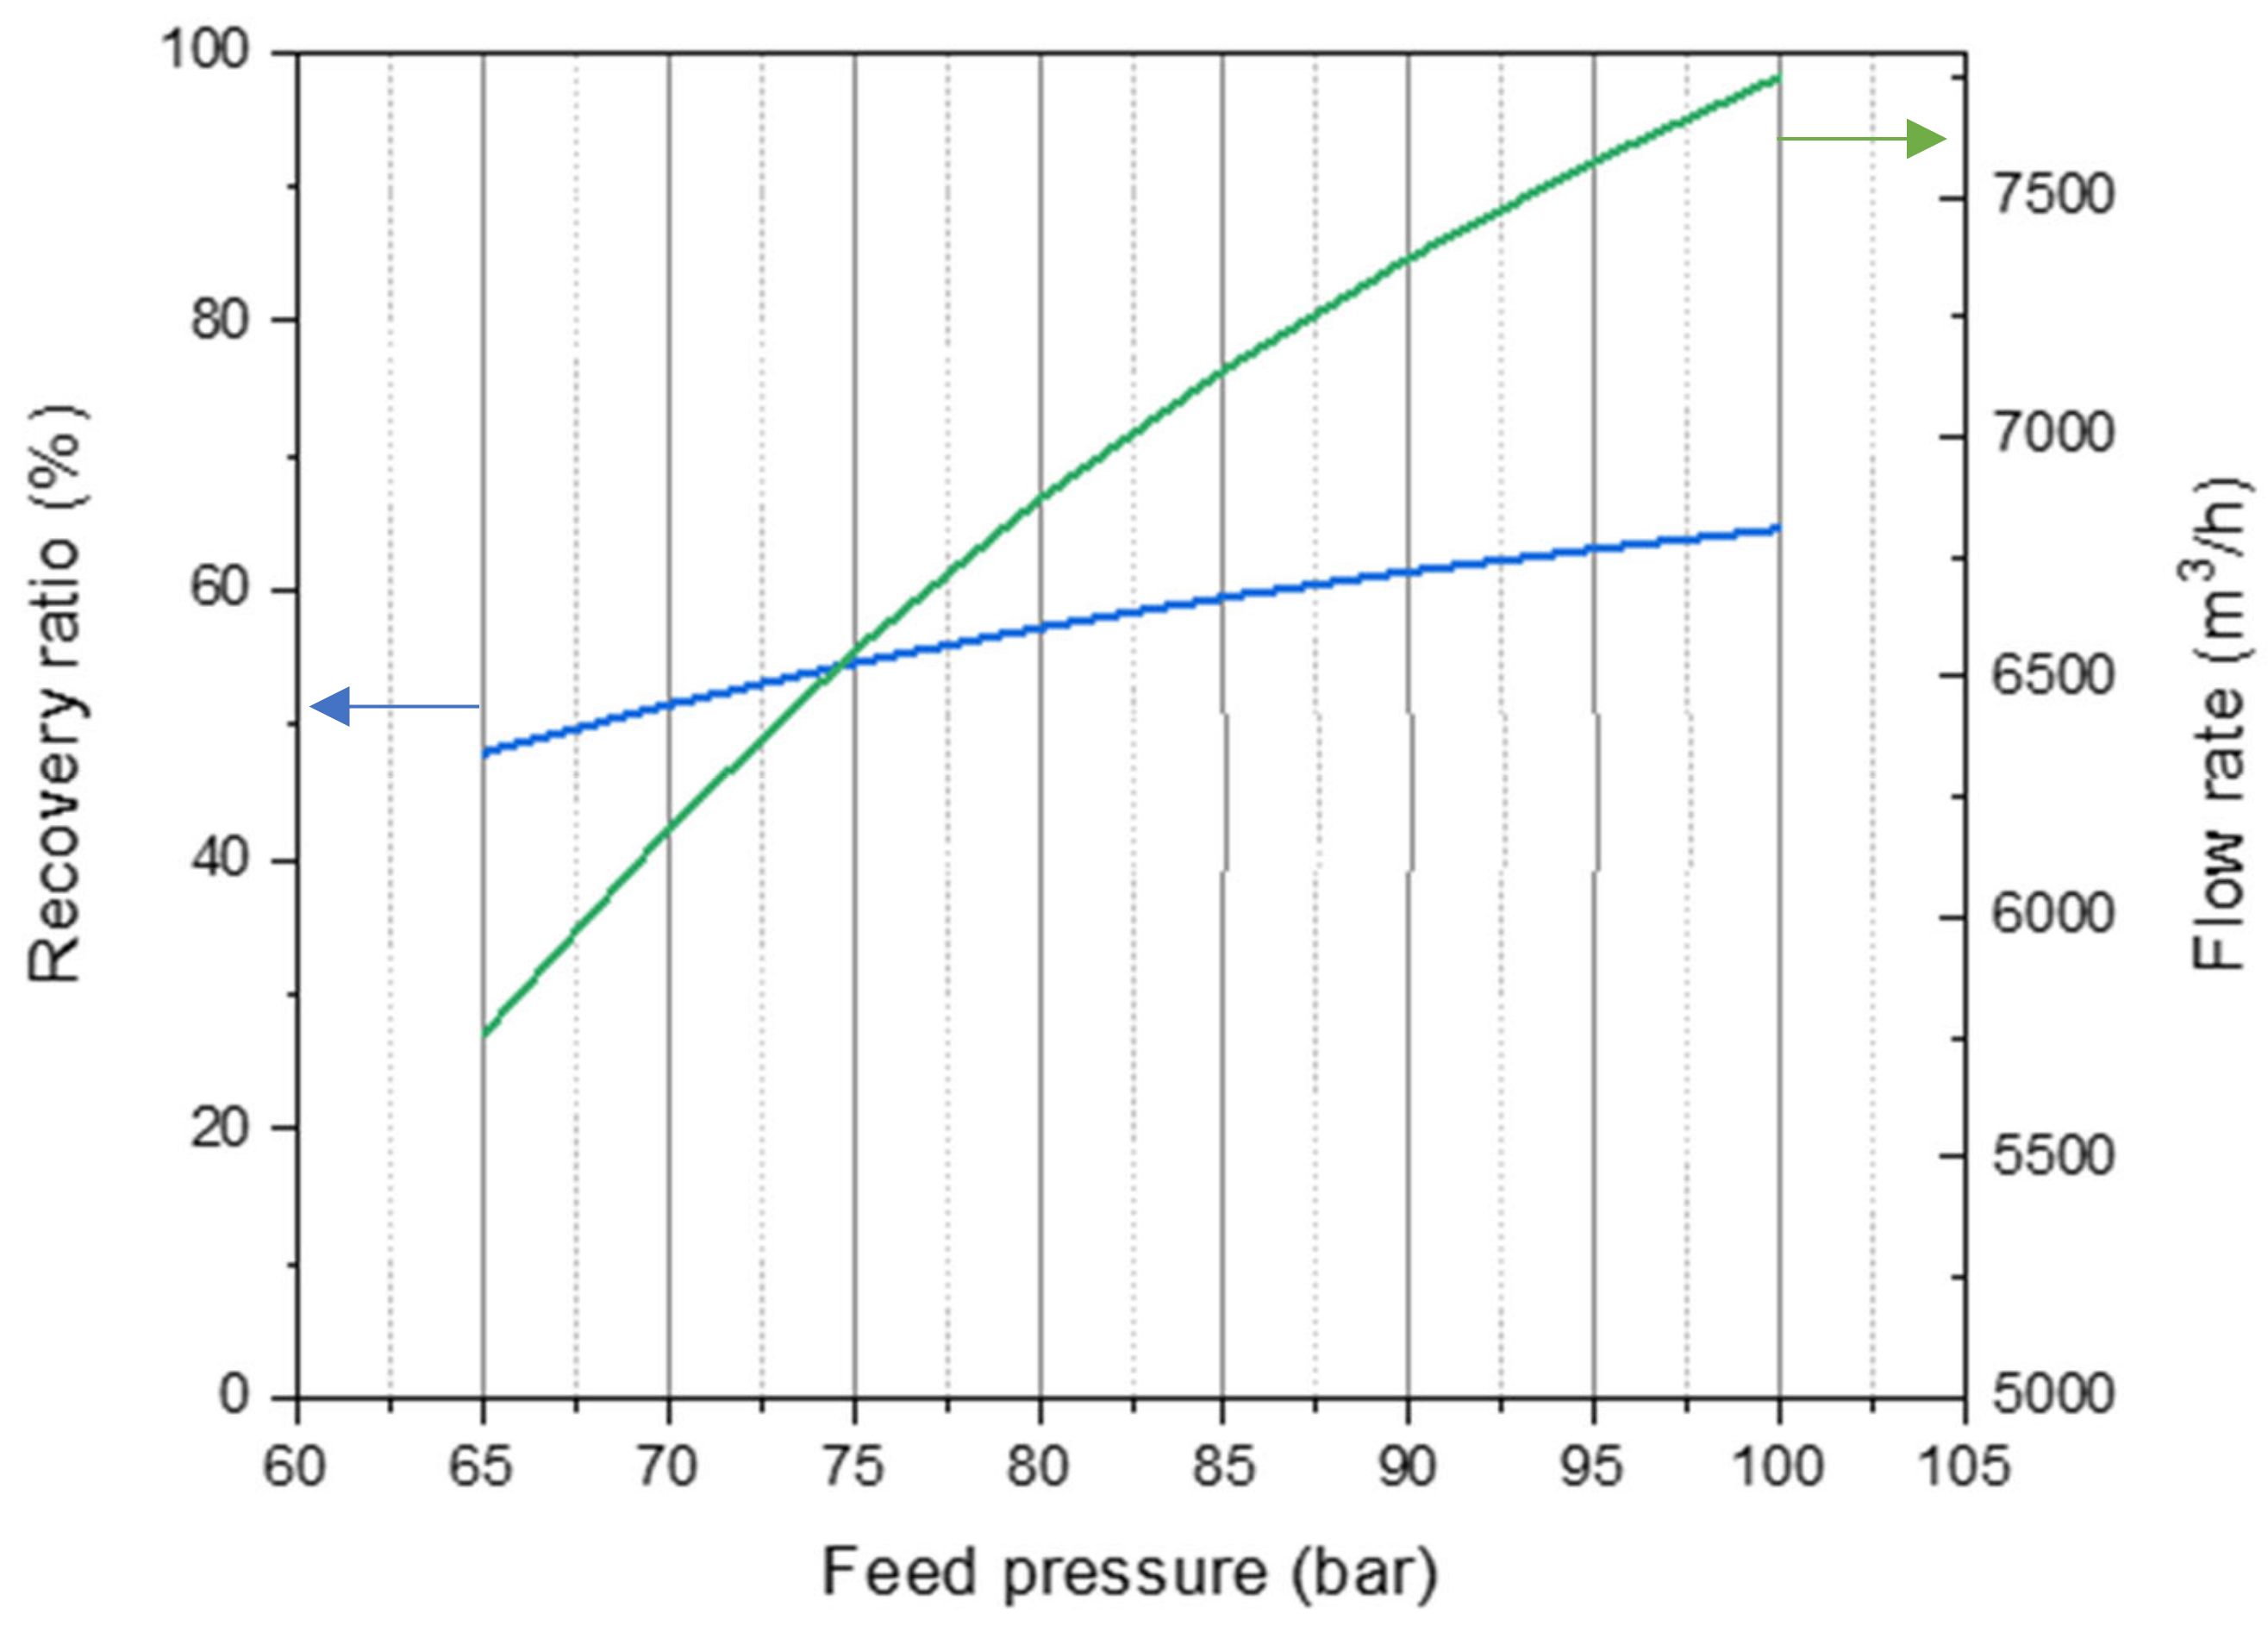
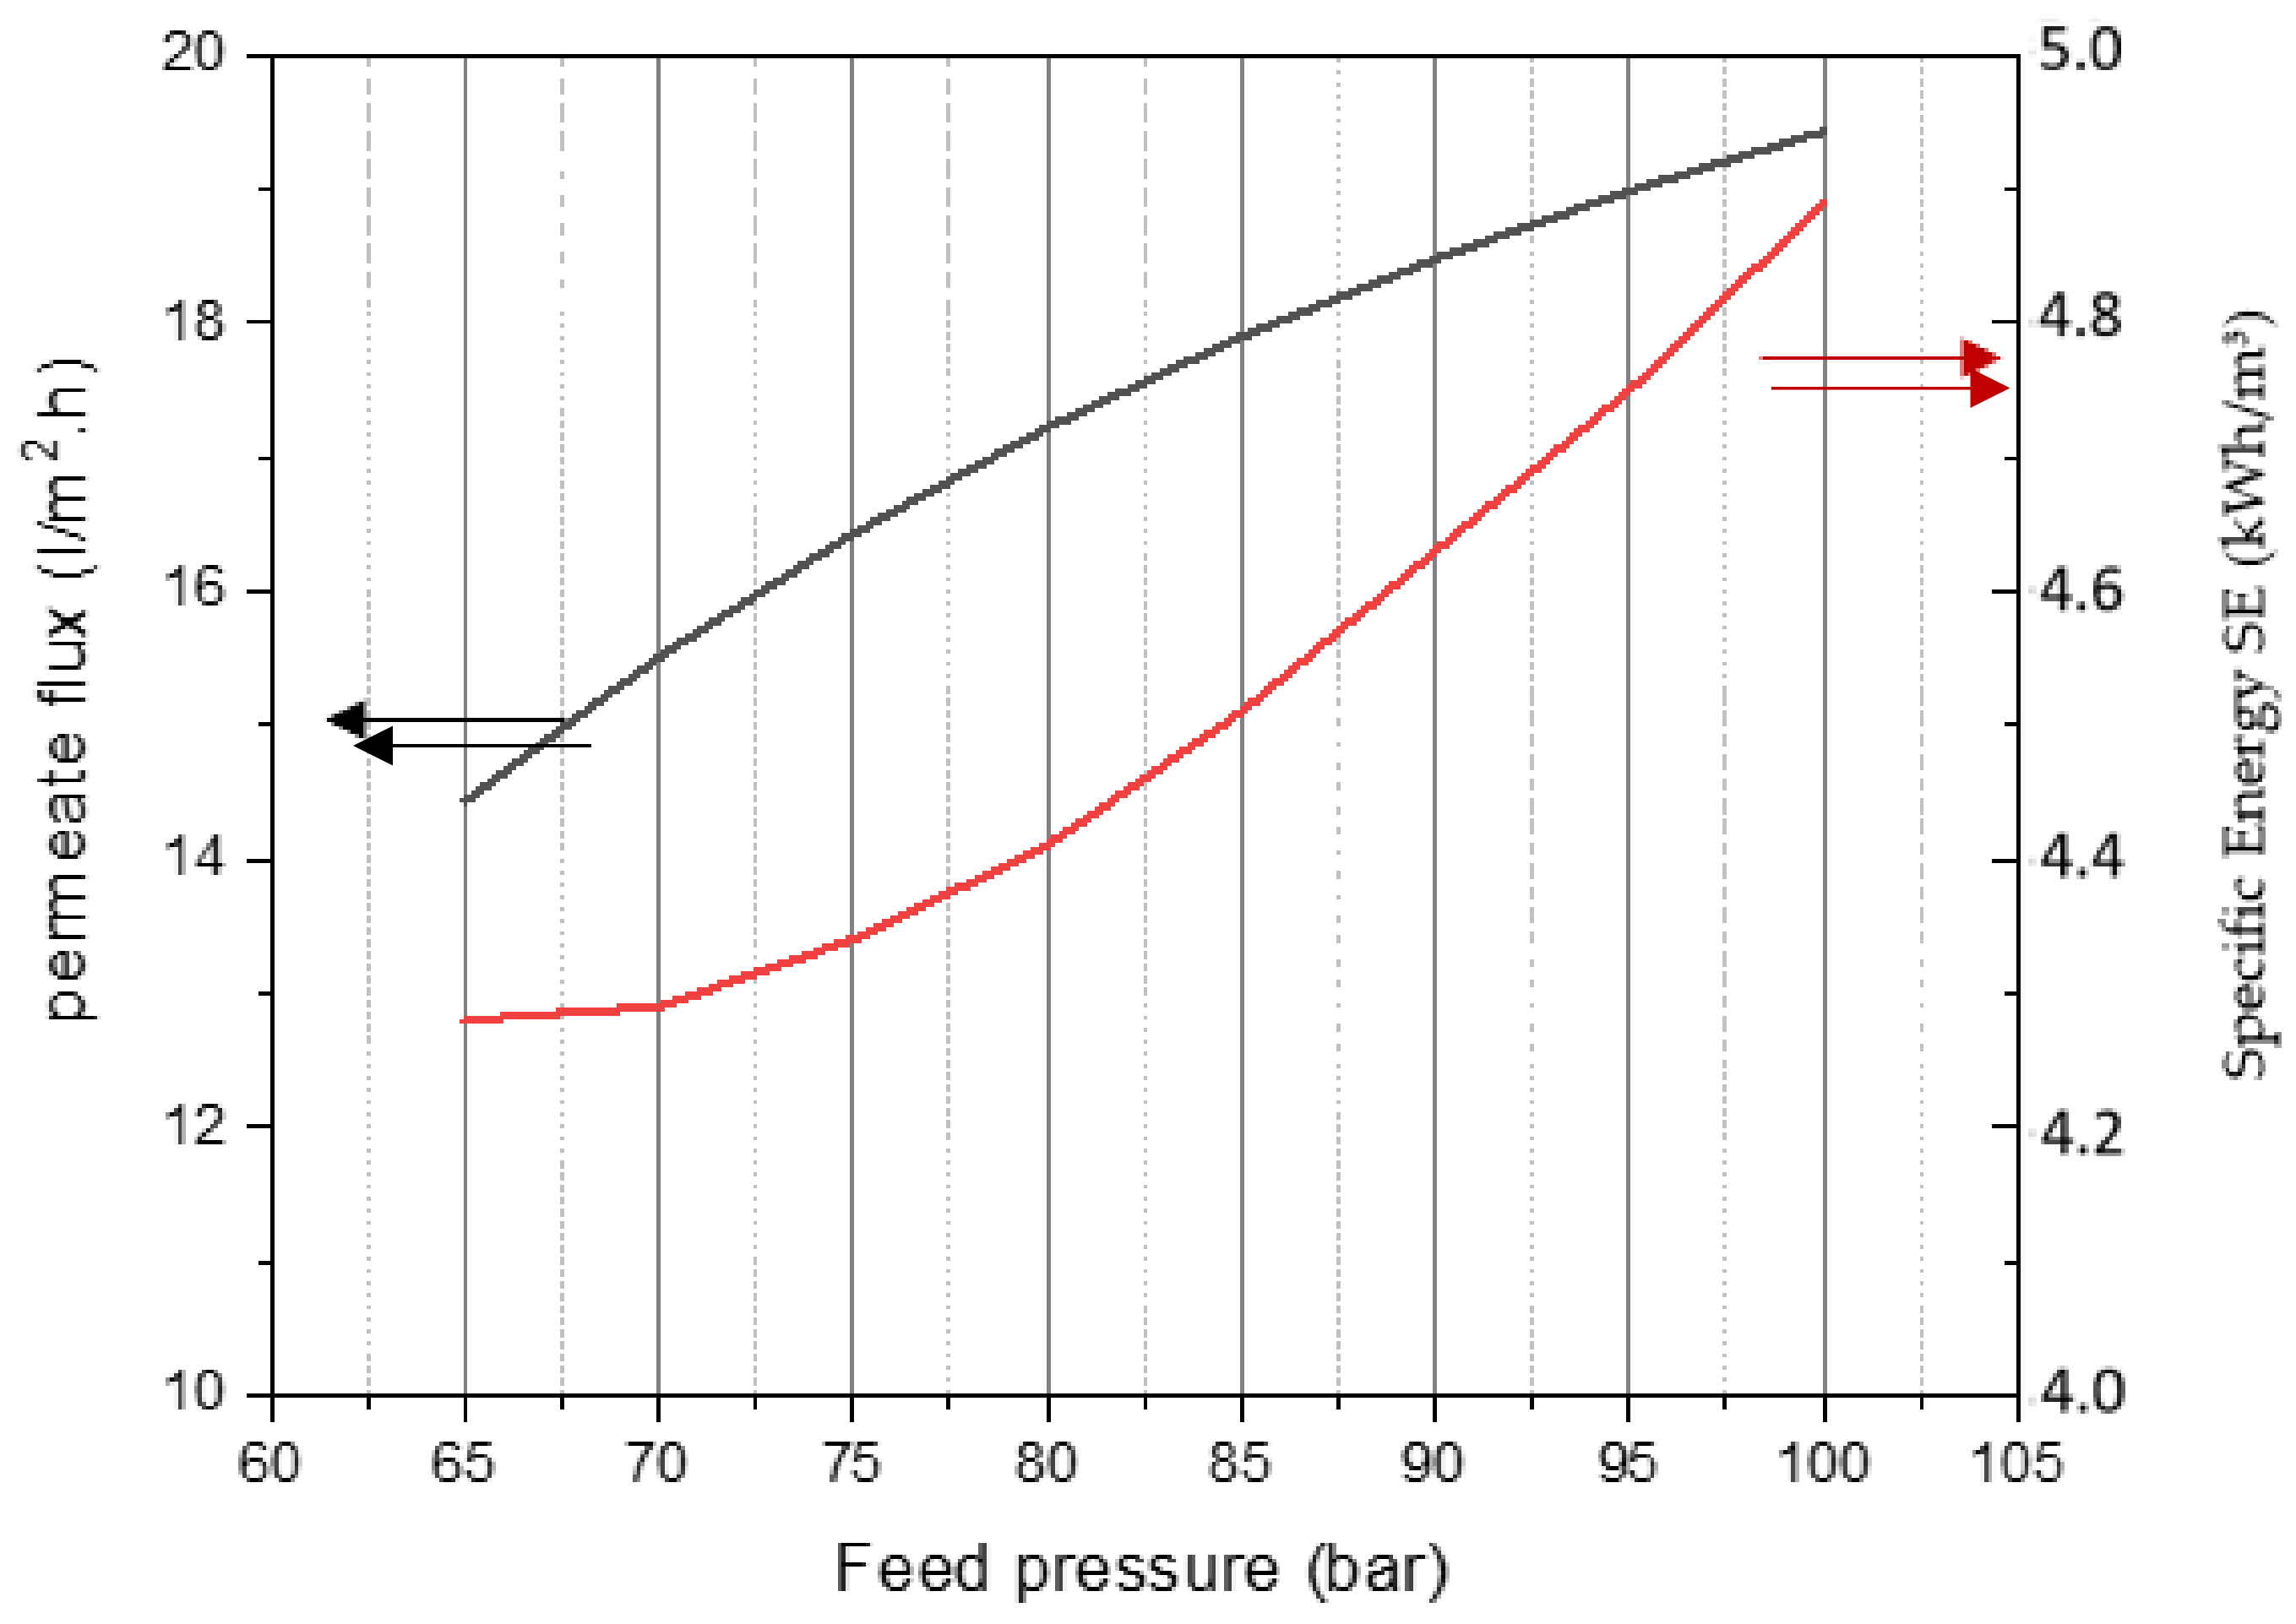
It is noticed from Figure 13 and Figure 14 that the increase in feed pressure leads to an increase in the system recovery, specific energy consumption, and permeate flux in the first pass. So, when subjecting a membrane to a higher pressure at the same temperature and feedwater source conditions, the energy consumption will increase, as well as the system recovery, where the permeate flow rate increases with the increase in feed pressure.
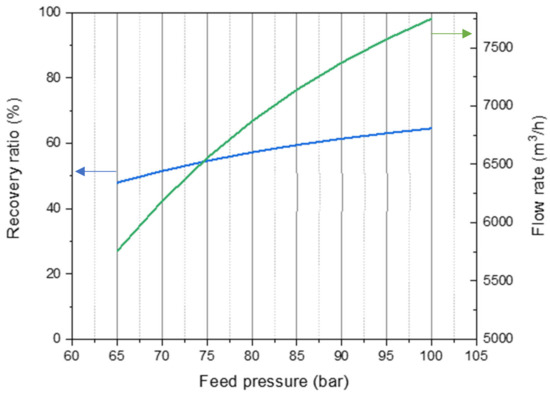
Figure 13.
Variation in recovery and permeate flowrate vs. feed pressure at 25 °C FW temp, 38,255 ppm FW salinity, and 12,000 m3/h FW flow rate.
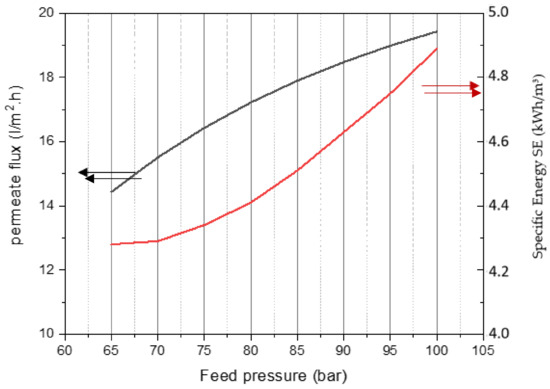
Figure 14.
Variation in SE and permeate flux in the first pass vs. feed pressure at 25 °C FW temp, 38,255 ppm FW salinity, and 12,000 m3/h feedwater flow rate.
- Case 5:
In the fifth case, all the parameters are fixed except for the recovery in the first pass, which varies within the chosen range of 35 to 55%.
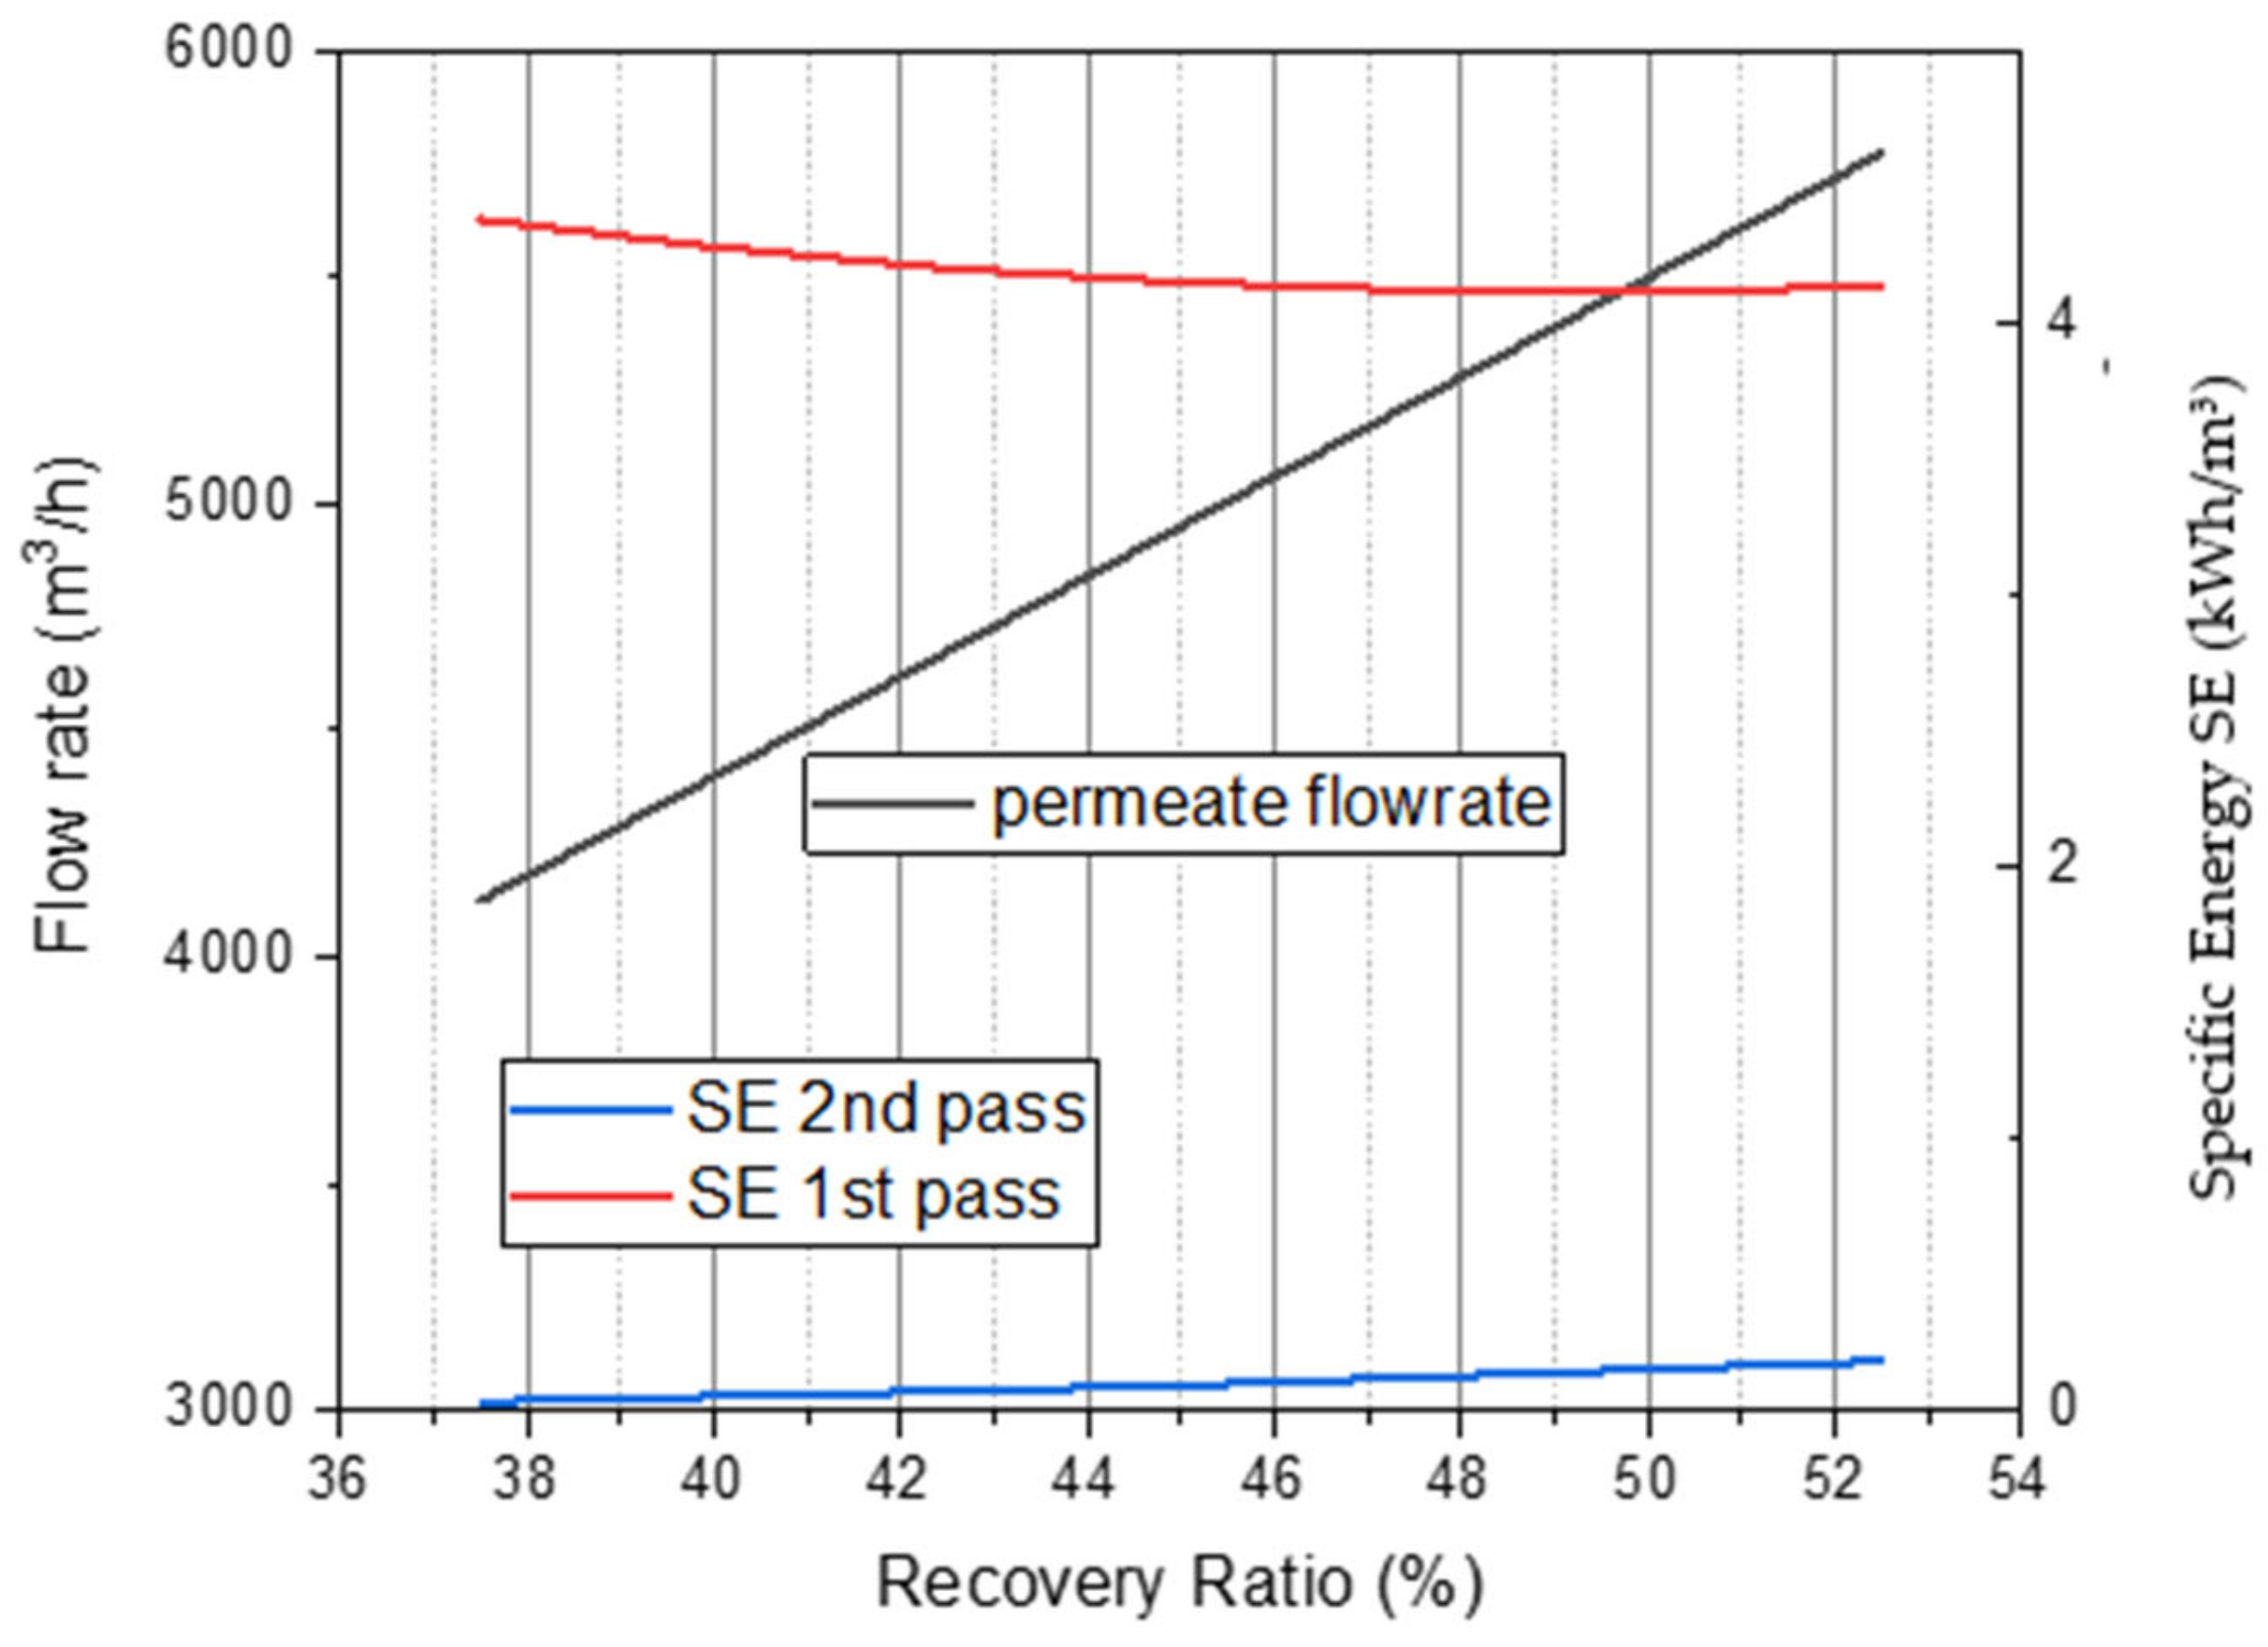
It is noticed from Figure 15 and Figure 16 that as the permeate recovery increases, permeate flux, feed pressure, and flow rate increase. Conversely, SE in the first pass decreases. There is a slight increase in SE in the second pass; this is maybe due to the increase in the permeate flux that requires a higher increase in energy under a constant recovery rate (90%). However, the recovery in the first pass is increasing, so there is a slight decrease in the SE, which means that this increase in recovery compensates for the increase in the permeate flux which results in lower energy consumption.
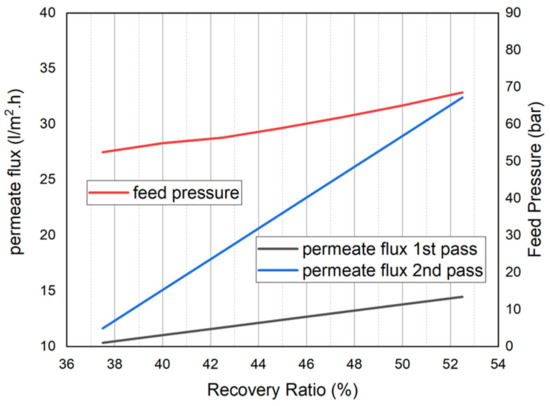
Figure 15.
Variation in feed water pressure, permeate flux in the first and second pass vs. permeate recovery at 25 °C FW temp, 38,255 ppm FW salinity, 12,000 m3/h feedwater flow rate.
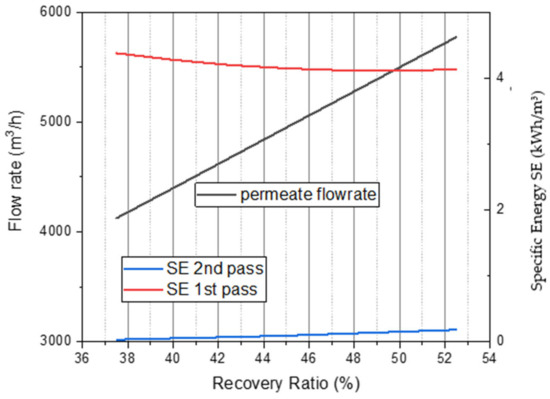
Figure 16.
Variation in permeate flow rate, SE in the first and second pass vs. permeate recovery at 25 °C FW temp, 38,255 ppm FW salinity, 12,000 m3/h feed water flow rate.
- Case 6:
In the sixth case, all the parameters are fixed as in the example except for the feed flow rate.
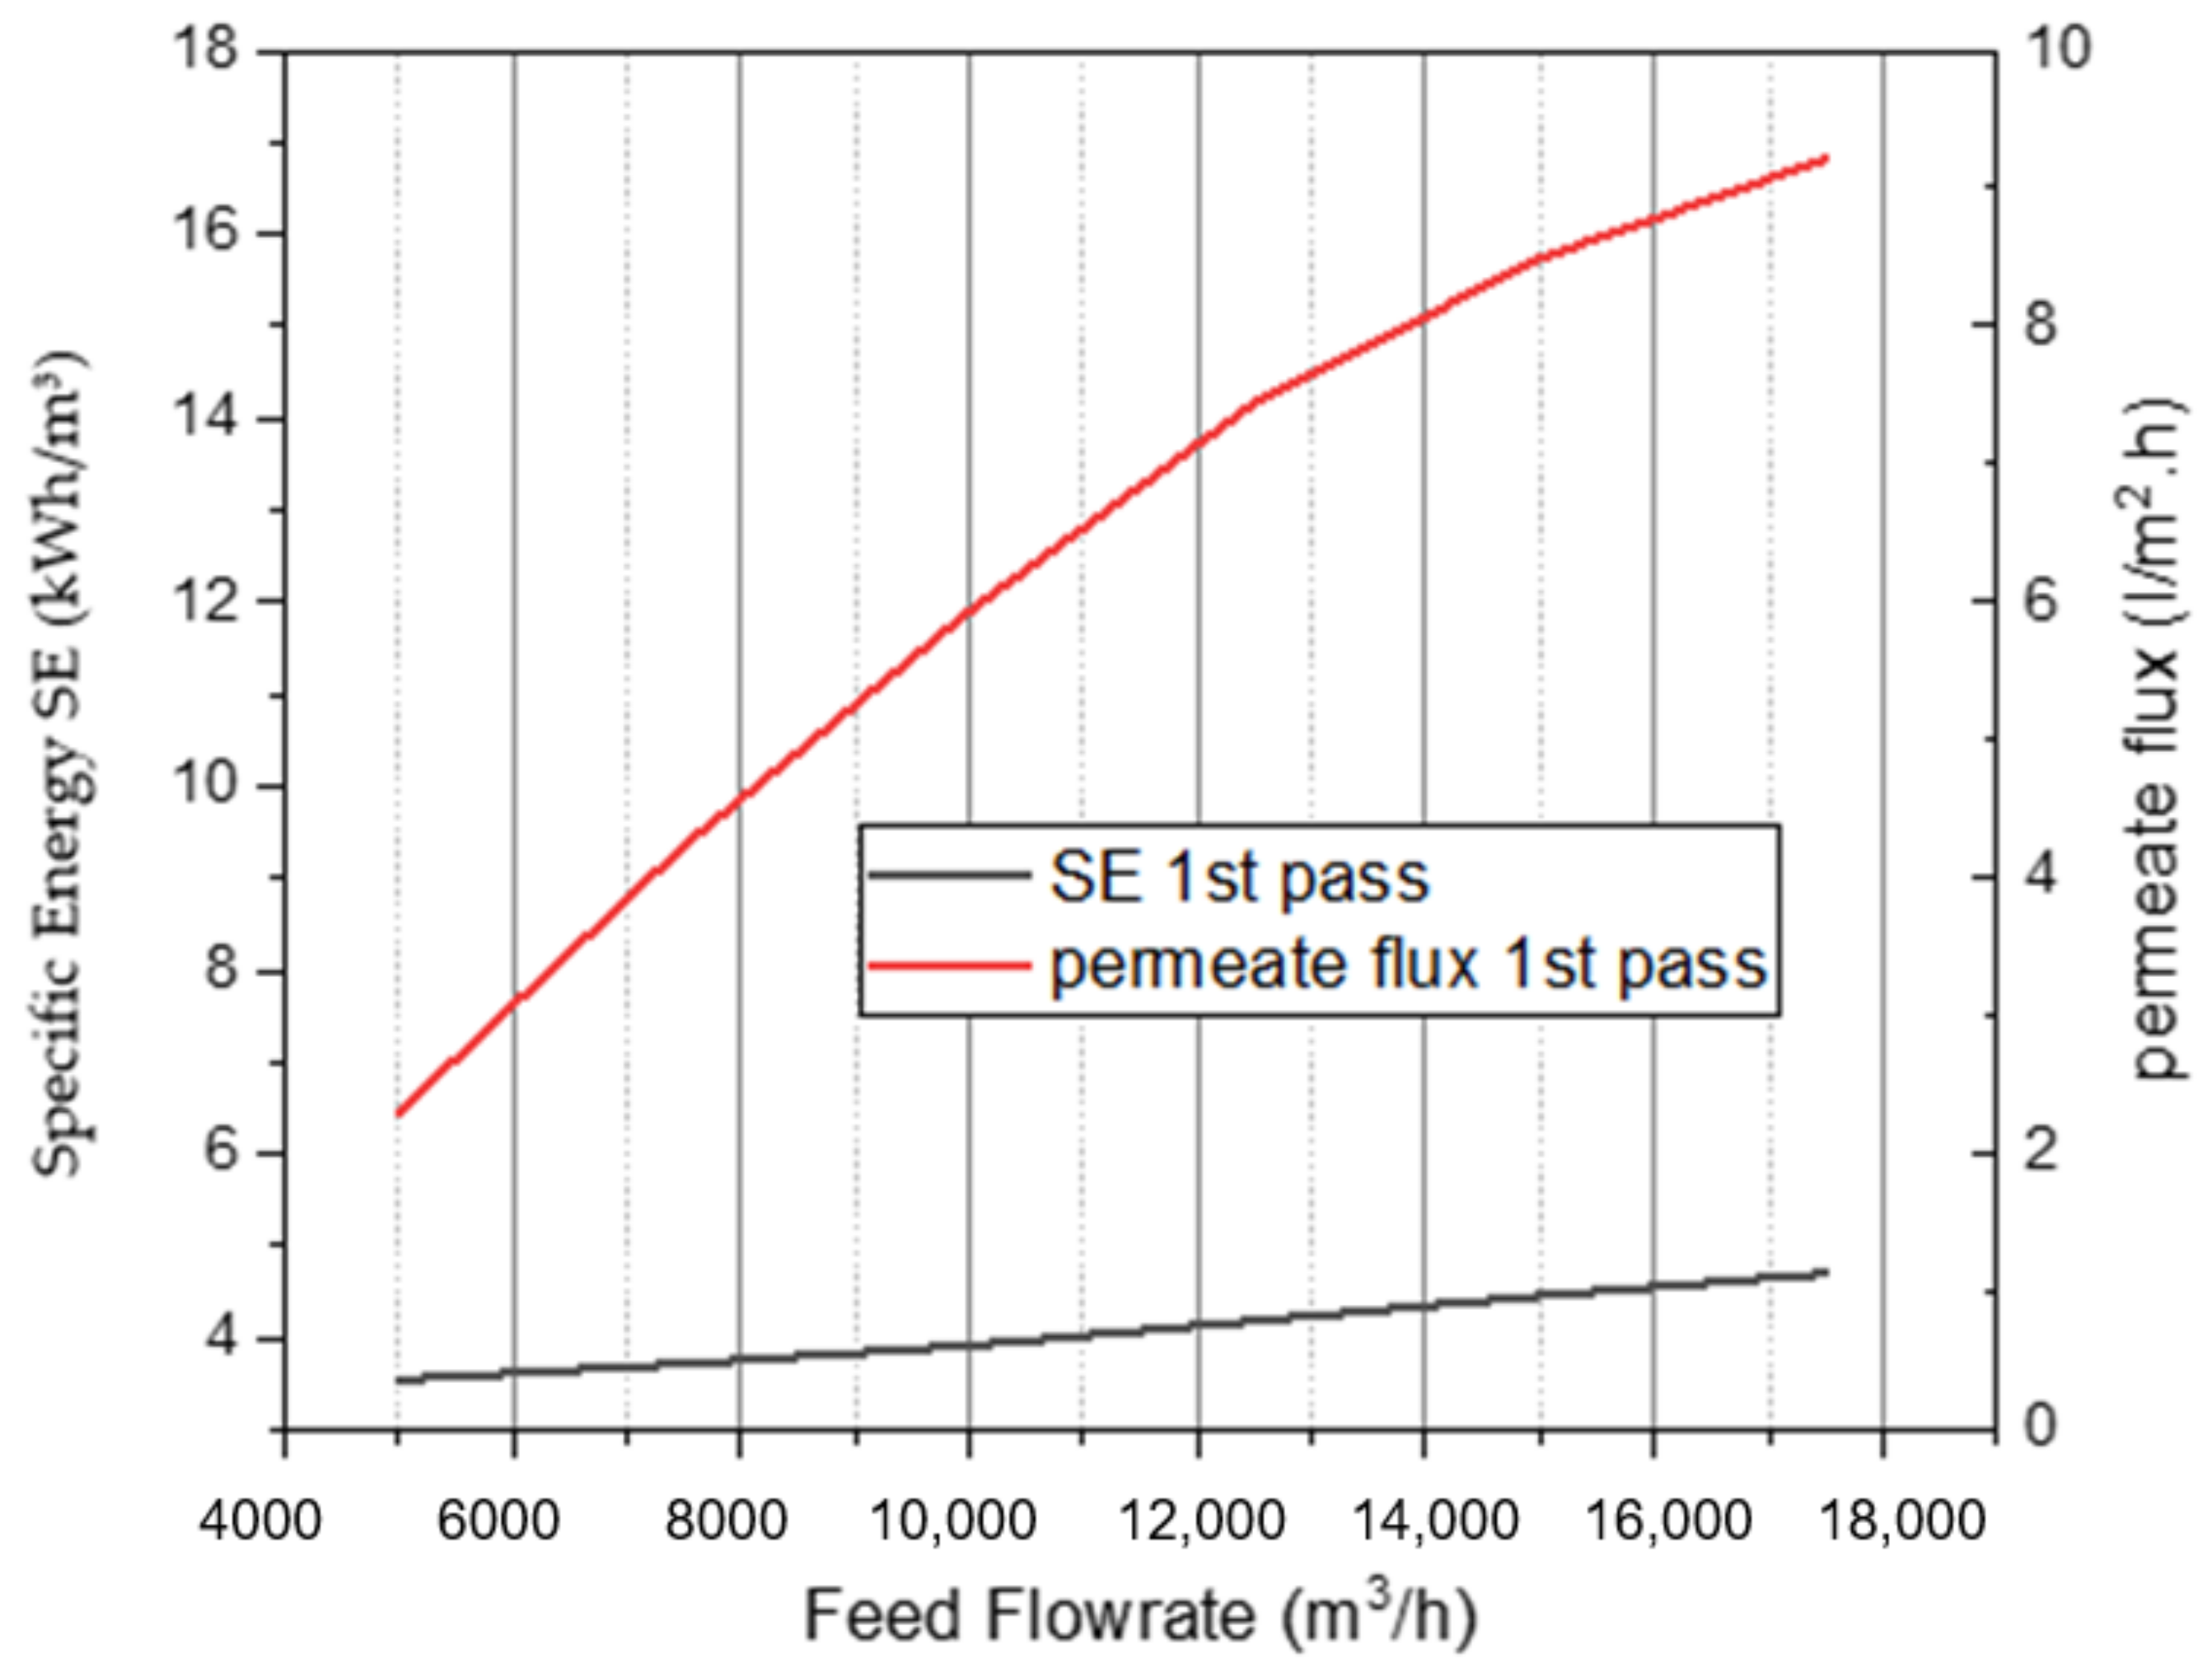
It is noticed from Figure 17 and Figure 18 that when the feed flow rate increases at a constant feed pressure, the recovery ratio and permeate TDS decrease; however, SE and permeate flux in the first pass increase. Permeate TDS is expected to increase with the increase in feed flow rate. However, it is decreasing, and this can be attributed to the recovery ratio which is not fixed and is decreasing.
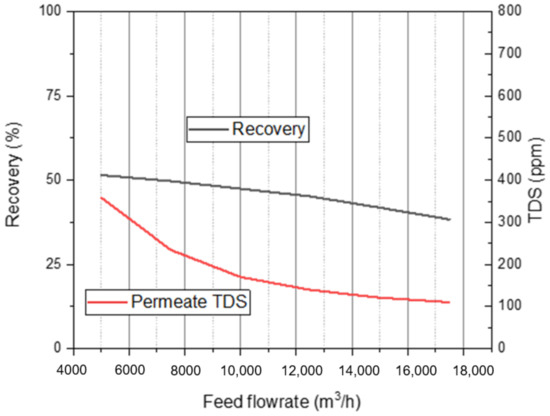
Figure 17.
Variation in recovery %, permeate TDS vs. flow rate at 25 °C FW temp, 38,255 ppm FW salinity, and 60 bar.
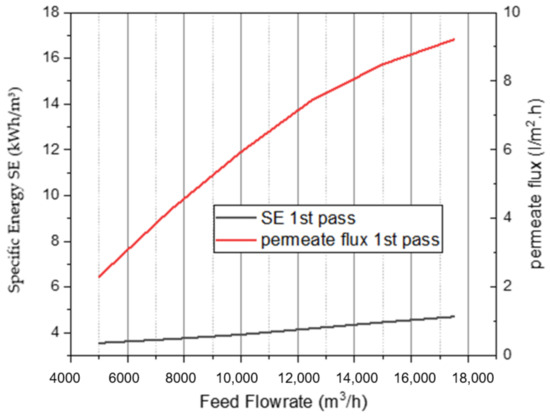
Figure 18.
Variation in SE and permeate flux in the first pass vs. flow rate at 25 °C FW temp, 38,255 ppm FW salinity, and 60 bar.
Table 12 shows the effect of the operating conditions on RO system performance based on the results and equations mentioned above.
Table 12.
Comparison between the main parameters.
4.2. Validating the ROSA Software
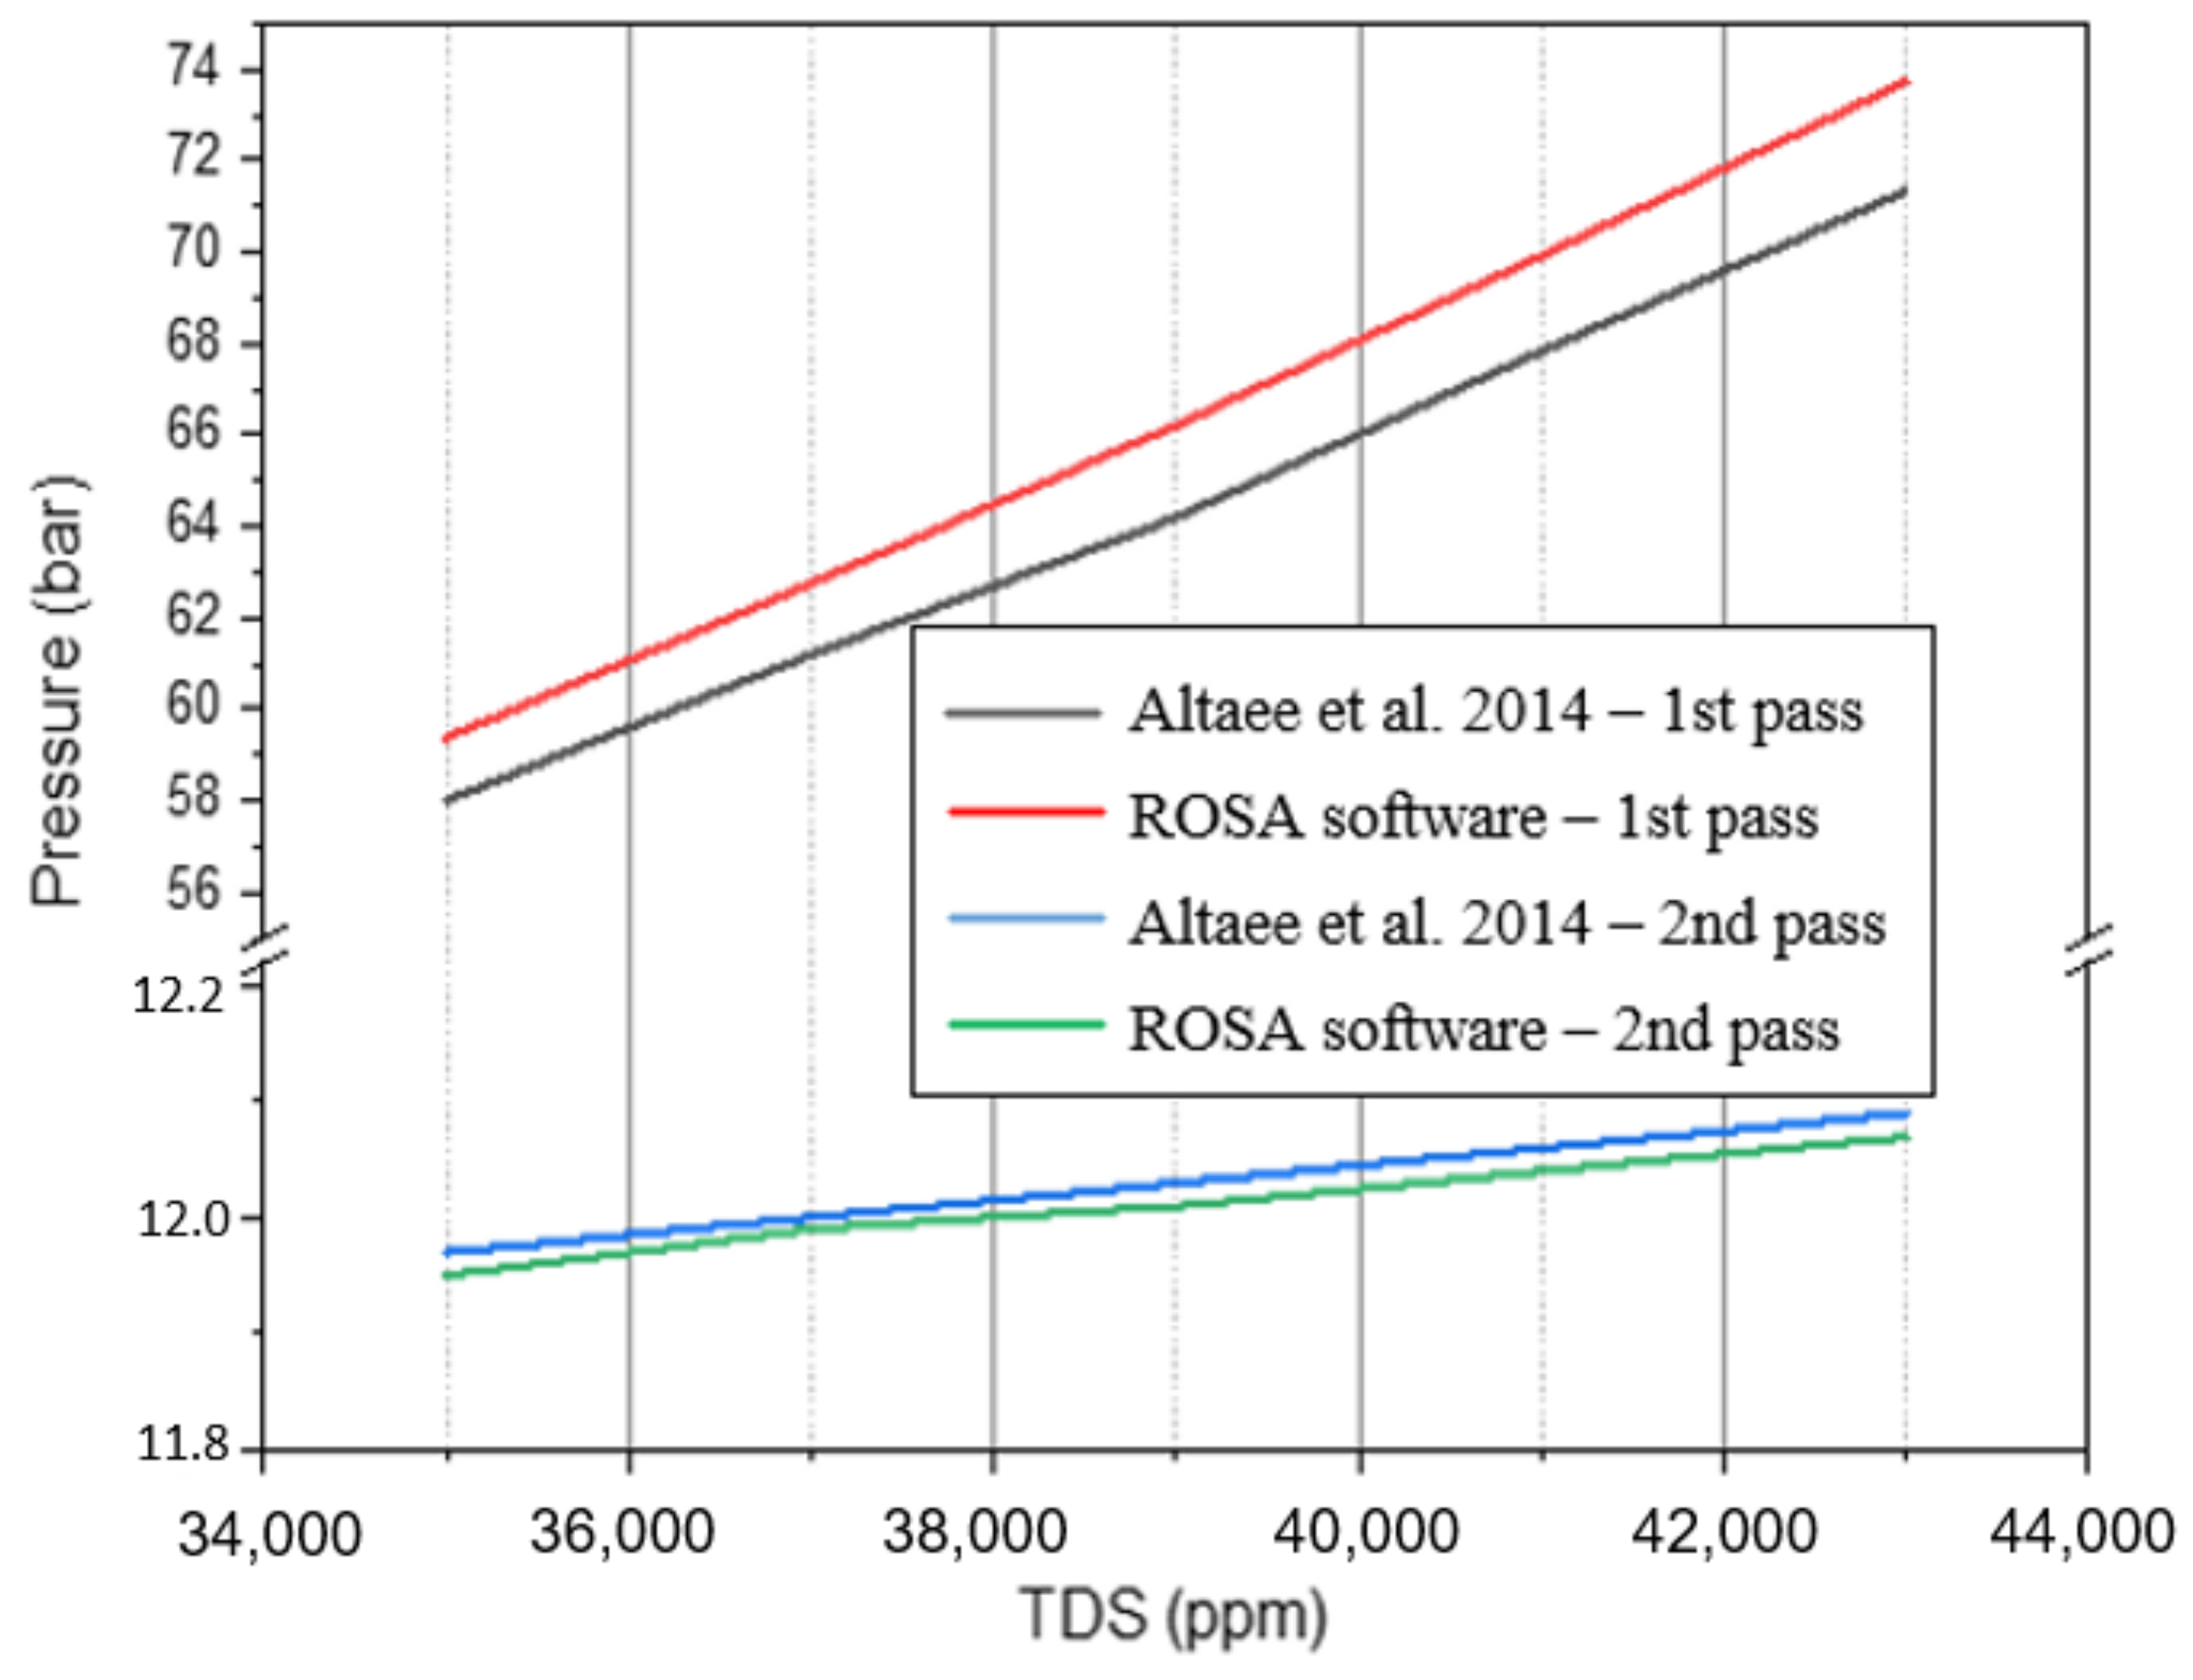
The objective of this section is to make sure that the results of ROSA are efficient by applying a published case study on ROSA and obtaining the results. The following results have been validated by Altaee et al. [40] using ROSA 9.1 software as shown in Figure 19. The error was found to be a maximum of 2.77% and 0.17% of the first and second passes, respectively. These errors are attributed to some assumptions that were made due to the absence of some factors such as pump efficiency, flow factor, and the ROSA version used by Altaee et al. [40].
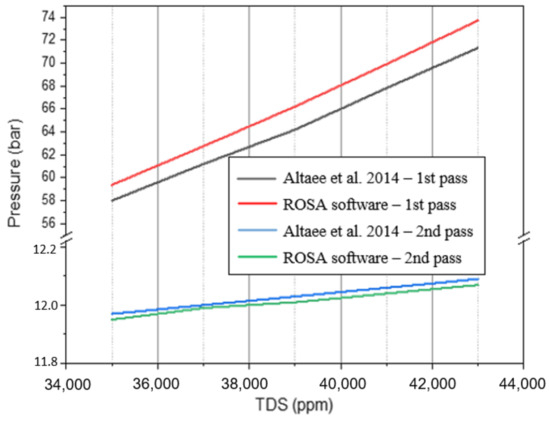
Figure 19.
Comparing results of FW TDS vs. FW pressure in the first and second passes between ROSA results and reference [40] at 25 °C feed temperature and 24.3 m3/h feed flow rate.
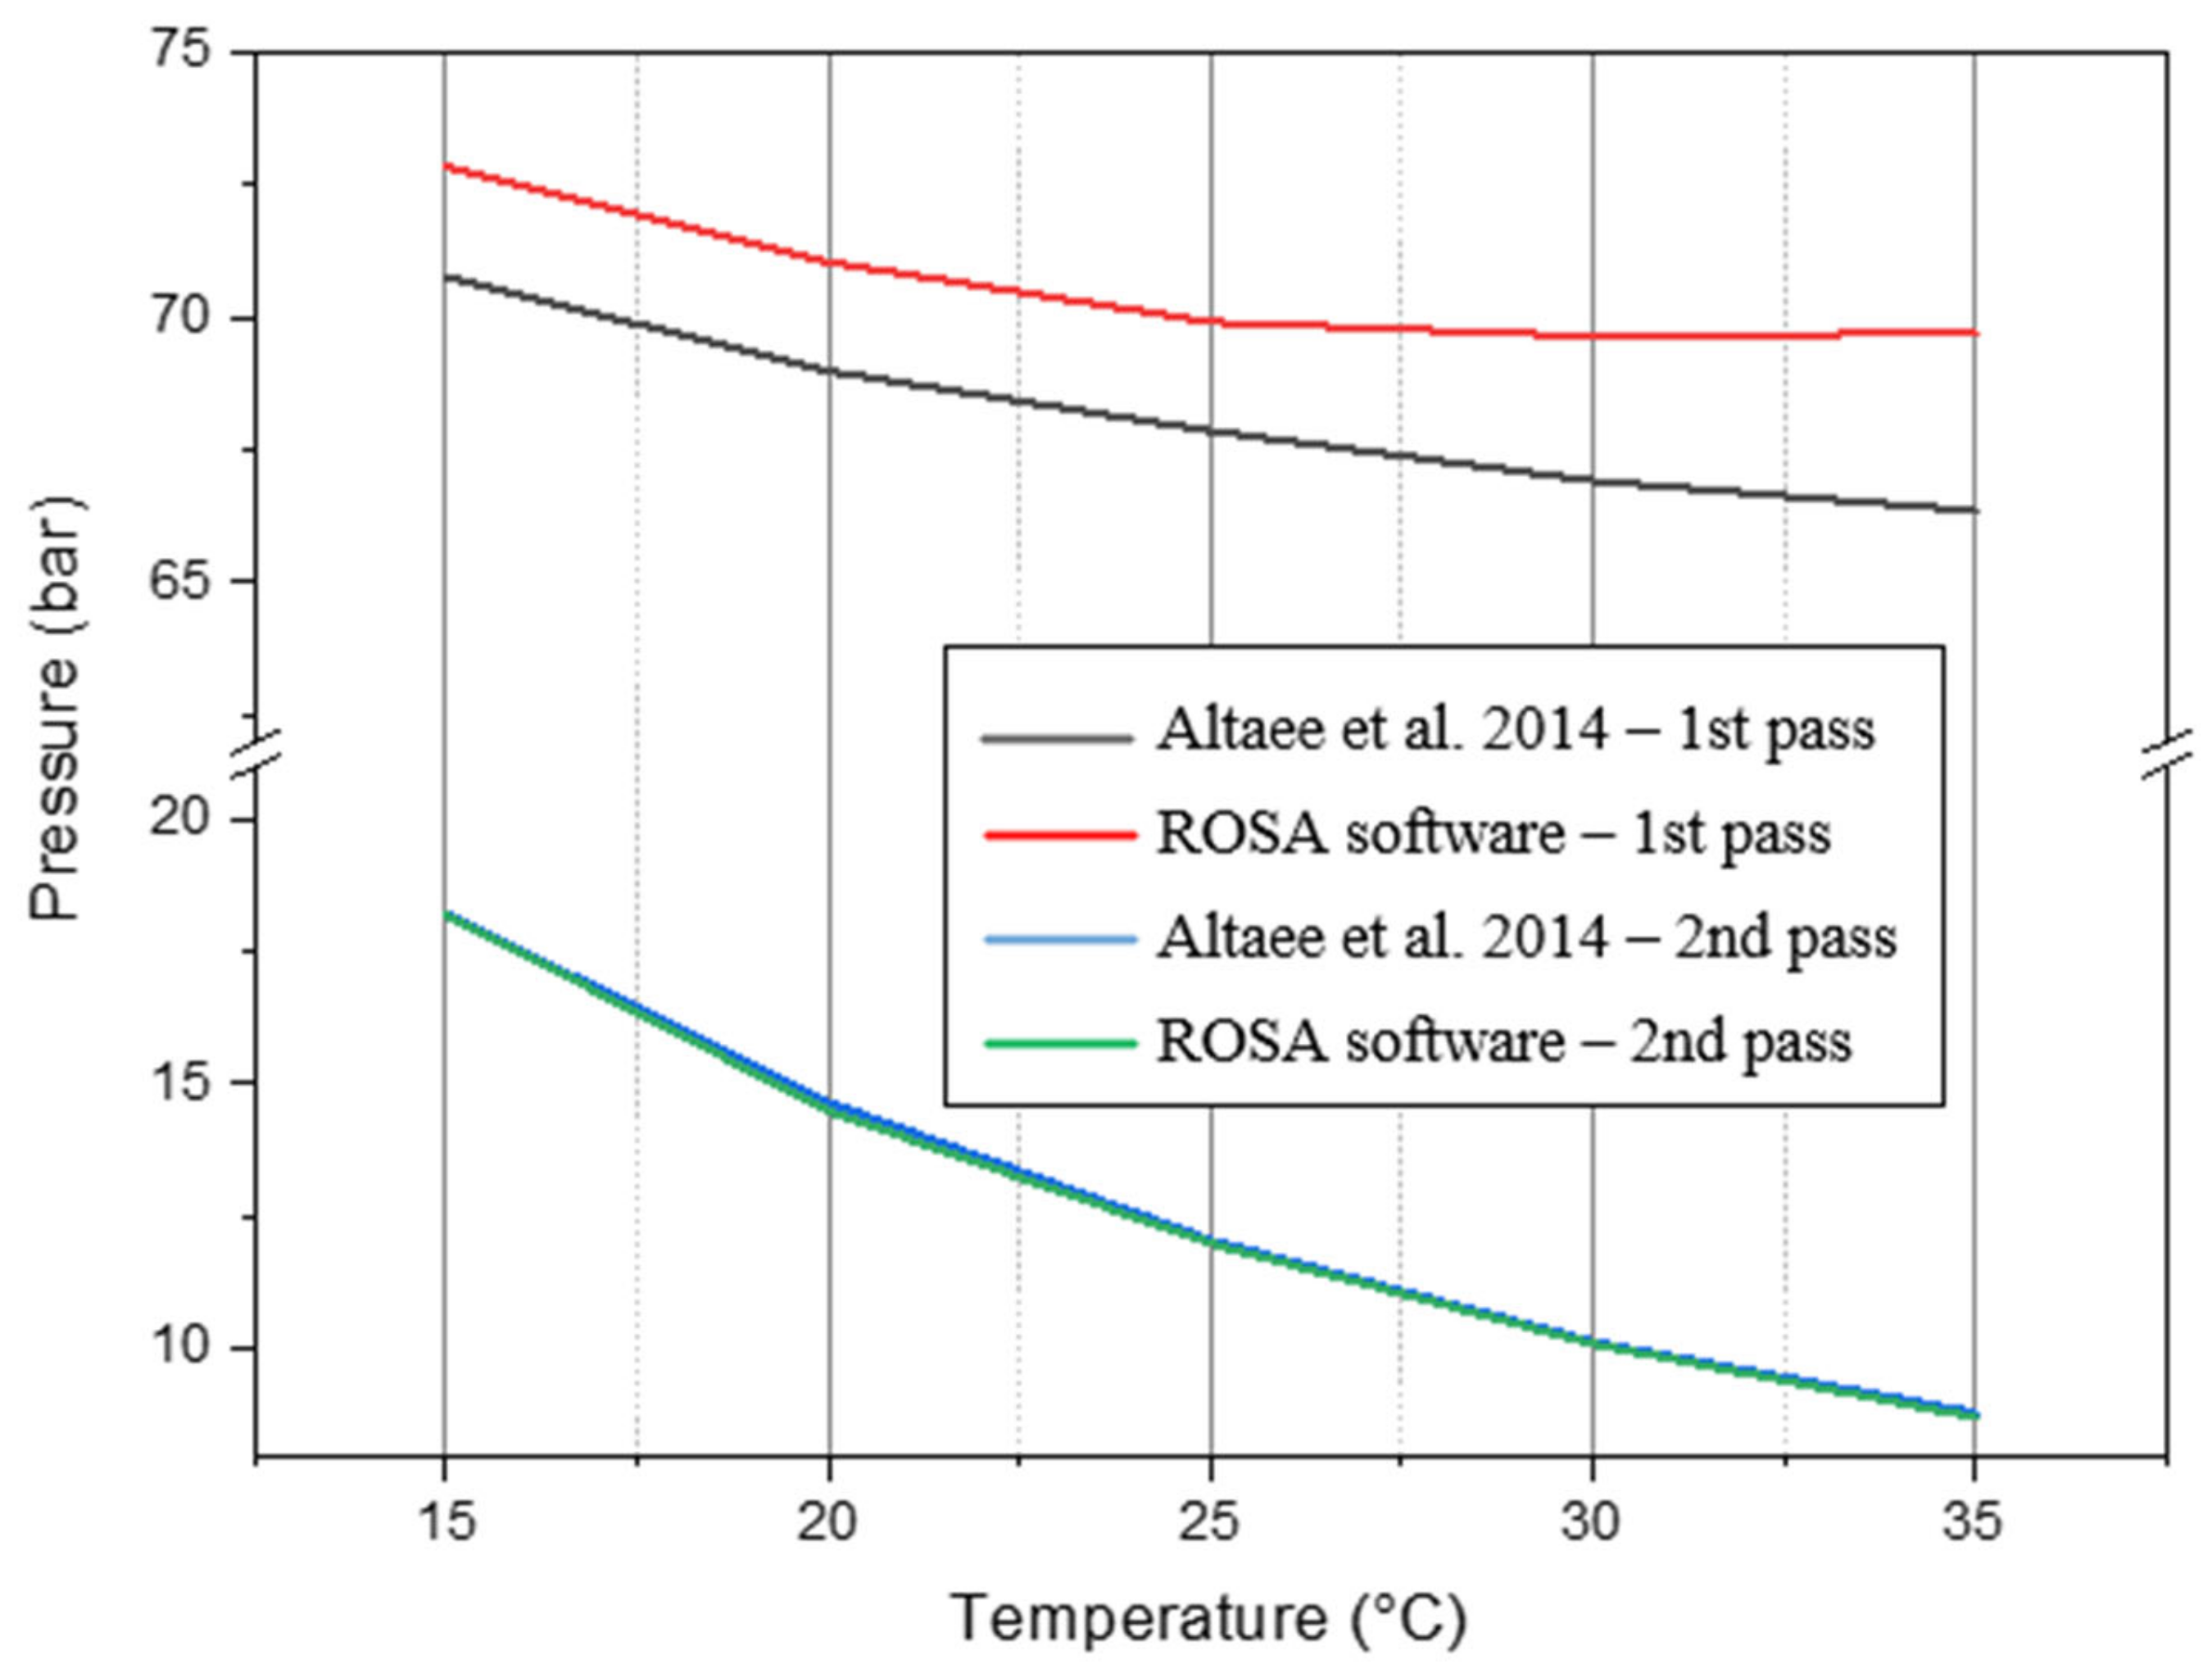
Figure 20 shows that the obtained results have good agreement with those published by Altaee et al. [40] with maximum percentage errors of 5.05% and 1.02% in the first and second passes, respectively. The difference in the results is due to the assumptions that were made and due to the different ROSA versions since using different ROSA versions might result in slightly different outputs [41].
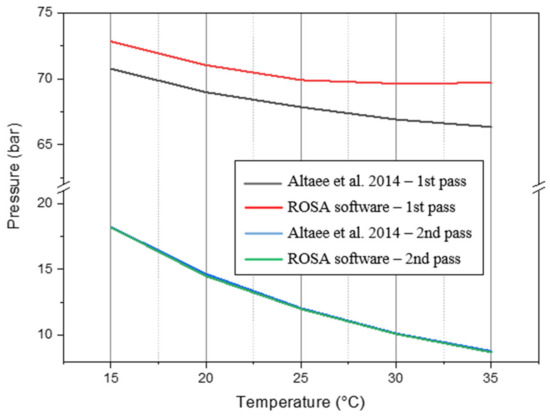
Figure 20.
Comparing results of FW TDS vs. FW pressure in the first and second passes between ROSA and reference [40] at 24.3 m3/h feed flow rate and 41,000 ppm feed salinity.
5. Conclusions
This paper presents a methodology to facilitate the optimal design of small RO desalination systems. The main steps are integrated in an algorithm flow chart and validated with a case study. A comparison of the main parameters is carried out to investigate the impact of each one on the output. From this research, the following concluding remarks can be outlined:
- –
- More than one output can be obtained from the same design due to two main changing parameters: dependent parameters when varying within a specific range as noticed in the results, and input parameters that affect the results such as temperature and feed pressure.
- –
- Energy recovery methods, such as selecting high-efficiency pumps and membranes, optimizing their configuration, and implementing advanced control and monitoring systems, are crucial for reducing the energy consumption of an RO plant.
- –
- There are major factors that affect the design to achieve lower power consumption:
- The parametric effect, which is the result of chosen parameters mentioned in Table 12.
- The optimizing effect, which is the result of balancing the design after testing it on the software (high-pressure pumps, energy recovery devices).
- –
- It is found that the higher temperature of feedwater causes better RO operation, where, as the feedwater temperature increases for a constant permeate flow, feed pressure decreases, and the salinity of permeate increases. Hence, as a result of the lower pressure required, specific energy consumption (SEC) decreases. However, the rate of decrease in FW pressure and SEC depends on the type of membrane used.
- –
- Increasing recovery has a significant effect on the design. As the recovery rate is reduced, the concentration of reject water decreases; hence, the osmotic pressure in the membrane elements decreases. Decreasing recovery dilutes the concentrate flow, which reduces the membrane feed pressure, which reduces the load on the high-pressure pump motor.
- –
- ERDs mainly depend on the operating parameters (flow and pressure) for better performance.
- –
- The active area, salt rejection, and flow capacity are the main affecting parameters of membrane performance.
- –
- Membrane types do not affect membrane system flux because the quality of feed water defines the ultimate flux.
Author Contributions
Conceptualization, M.G.E.-R.; methodology, R.A., M.A.M. and M.G.E.-R.; validation, R.A. and M.A.M.; formal analysis, R.A., M.A.M., E.H., T.L., M.K. and M.G.E.-R.; investigation, R.A., M.A.M., E.H., T.L., M.K. and M.G.E.-R.; data curation, R.A. and M.A.M.; writing—original draft, R.A. and M.A.M.; writing—review and editing, E.H., T.L., M.K. and M.G.E.-R.; project administration, M.G.E.-R.; supervision, M.G.E.-R. All authors have read and agreed to the published version of the manuscript.
Funding
This research received no external funding.
Data Availability Statement
The raw data supporting the conclusions of this article will be made available by the authors on request.
Conflicts of Interest
The authors declare no conflicts of interest.
References
- Shafieian, A.; Rizwan Azhar, M.; Khiadani, M.; Kanti Sen, T. Performance improvement of thermal-driven membrane-based solar desalination systems using nanofluid in the feed stream. Sustain. Energy Technol. Assess. 2020, 39, 100715. [Google Scholar] [CrossRef]
- Topaloglu, D.; Tilki, Y.M.; Aksu, S.; Yilmaz, T.N.; Celebi, E.E.; Oncel, S.; Aydiner, C. Novel technological solutions for eco-protective water supply by economical and sustainable seawater desalination. Chem. Eng. Res. Des. 2018, 136, 177–198. [Google Scholar] [CrossRef]
- Anis, S.F.; Hashaikeh, R.; Hilal, N. Reverse osmosis pretreatment technologies and future trends: A comprehensive review. Desalination 2019, 452, 159–195. [Google Scholar] [CrossRef]
- Kadhom, M. A review on the polyamide thin film composite (TFC) membrane used for desalination: Improvement methods, current alternatives, and challenges. Chem. Eng. Res. Des. 2023, 191, 472–492. [Google Scholar] [CrossRef]
- Rodríguez-Calvo, A.; Silva-Castro, G.A.; Osorio, F.; González-López, J. Reverse osmosis seawater desalination_ current status of membrane systems_ Desalination and Water Treatment. Desalination Water Treat. 2015, 56, 849–861. [Google Scholar] [CrossRef]
- Edokali, M.; Bocking, R.; Mehrabi, M.; Massey, A.; Harbottle, D.; Menzel, R.; Hassanpour, A. Chemical modification of reduced graphene oxide membranes: Enhanced desalination performance and structural properties for forward osmosis. Chem. Eng. Res. Des. 2023, 199, 659–675. [Google Scholar] [CrossRef]
- Al-Obaidi, M.A.; Rasn, K.H.; Aladwani, S.H.; Kadhom, M.; Mujtaba, I.M. Flexible design and operation of multi-stage reverse osmosis desalination process for producing different grades of water with maintenance and cleaning opportunity. Chem. Eng. Res. Des. 2023, 182, 525–543. [Google Scholar] [CrossRef]
- Slocuma, A.H.; Haji, M.N.; Trimble, A.Z.; Ferrara, M.; Ghaemsaidi, S.J. Integrated Pumped Hydro Reverse Osmosis systems. Sustain. Energy Technol. Assess. 2016, 18, 80–99. [Google Scholar] [CrossRef]
- Li, M.; Chan, N.; Li, J. Novel dynamic and cyclic designs for ultra-high recovery waste and brackish water RO desalination. Chem. Eng. Res. Des. 2022, 179, 473–483. [Google Scholar] [CrossRef]
- Qasim, M.; Badrelzaman, M.; Darwish, N.N.; Darwish, N.A.; Hilal, N. Reverse osmosis desalination: A state-of-the-art review. Desalination 2019, 459, 59–104. [Google Scholar] [CrossRef]
- Ali, I.B.; Turki, M.; Belhadja, J.; Roboam, X. Systemic design and energy management of a standalone battery-less PV/Wind driven brackish water reverse osmosis desalination system. Sustain. Energy Technol. Assess. 2020, 42, 100884. [Google Scholar]
- Mostafaeipour, A.; Qolipour, M.; Rezaei, M.; Babaee-Tirkolaee, E. Investigation of off-grid photovoltaic systems for a reverse osmosis desalination system: A case study. Desalination 2019, 454, 91–103. [Google Scholar] [CrossRef]
- Naseri, A.; Bidi, M.; Ahmadi, M.H.; Saidur, R. Exergy analysis of a hydrogen and water production process by a solar-driven transcritical CO2 power cycle with Stirling engine. J. Clean. Prod. 2017, 158, 165–181. [Google Scholar] [CrossRef]
- Shaaban, S.; Yahya, H. Detailed analysis of reverse osmosis systems in hot climate conditions. Desalination 2017, 423, 41–51. [Google Scholar] [CrossRef]
- Greenlee, L.F.; Lawler, D.F.; Freeman, B.D.; Moulin, P. Reverse osmosis desalination: Water sources, technology, and today’s challenges. Water Res. 2009, 43, 2317–2348. [Google Scholar] [CrossRef]
- Datta, S.; Baul, A.; Sarker, G.C.; Sadhu, P.K.; Hodges, D.R. A Comprehensive Review of the Application of Machine Learning in Fabrication and Implementation of Photovoltaic Systems. IEEE Access 2023, 11, 77750–77778. [Google Scholar] [CrossRef]
- Delgado-Torres, A.M.; García-Rodríguez, L.; del Moral, M.J. Preliminary assessment of innovative seawater reverse osmosis (SWRO) desalination powered by a hybrid solar photovoltaic (PV)—Tidal range energy system. Desalination 2020, 477, 114247. [Google Scholar] [CrossRef]
- Saleem, H.; Zaidi, S.J. Nanoparticles in reverse osmosis membranes for desalination: A state of the art review. Desalination 2020, 475, 114171. [Google Scholar] [CrossRef]
- Mahlangu, O.T.; Nthunya, L.N.; Motsa, M.M.; Morifi, E.; Richards, H.; Mamba, B.B. Fouling of high pressure-driven NF and RO membranes in desalination processes: Mechanisms and implications on salt rejection. Chem. Eng. Res. Des. 2023, 199, 268–295. [Google Scholar] [CrossRef]
- Bani, N.A.; Noordin, M.K.; Hidayat, A.A.; Kamil, A.S.A.; Amran, M.E.; Kasri, N.F.; Muhtazaruddin, M.N.; Muhammad-Sukki, F. Development of Predictive Maintenance System for Haemodialysis Reverse Osmosis Water Purification System. In Proceedings of the 2022 4th International Conference on Smart Sensors and Application (ICSSA), Kuala Lumpur, Malaysia, 26–28 July 2022; pp. 23–28. [Google Scholar] [CrossRef]
- Du, C.; Zhao, X.; Du, J.R.; Feng, X.; Yang, H.; Cheng, F.; Ali, M.E.A. A field study of desalination of high-salinity surface brackish water via an RO-NF hybrid system. Chem. Eng. Res. Des. 2022, 182, 133–144. [Google Scholar] [CrossRef]
- FILMTEC Membranes—Steps to Design a Reverse Osmosis System. Dow Water & Process Solutions, 13 March 2018. [Online]. Available online: https://www.dupont.com/content/dam/dupont/amer/us/en/water-solutions/public/documents/en/RO-NF-FilmTec-Manual-45-D01504-en.pdf (accessed on 24 May 2024).
- 10 Steps to Design an RO/NF Membrane System. Desal Supplies, [Online]. Available online: https://fr.scribd.com/document/414151608/10-Steps-to-Design-an-RO-NF-Membrane-System (accessed on 24 May 2024).
- Oren, S.; Biesheuvel, M. Theory of Ion and Water Transport in Reverse-Osmosis Membranes. Phys. Rev. Appl. 2018, 9, 024034. [Google Scholar] [CrossRef]
- Haryati, S.; Hamzah, A.B.; Goh, P.S.; Abdullah, M.S.; Ismail, A.F.; Bustan, M.D. Process intensification of seawater reverse osmosis through enhanced train capacity and module size—Simulation on Lanzarote IV SWRO plant. Desalination 2017, 48, 92–101. [Google Scholar] [CrossRef]
- Aridi, R.; Faraj, J.; Ali, S.; Lemenand, T.; Khaled, M. Innovative concept of vortex generator-equipped multi-drain heat recovery systems–Numerical study and energetic analysis. Int. J. Thermofluids 2023, 20, 100455. [Google Scholar] [CrossRef]
- Aridi, R.; Faraj, J.; Ali, S.; Lemenand, T.; Khaled, M. Thermoeconomic and environmental impacts of vortex generator-equipped multi-drain heat recovery systems under various renewable sources. Energy Convers. Manag. X 2023, 20, 100431. [Google Scholar] [CrossRef]
- Aridi, R.; Yehya, A. Review on the sustainability of phase-change materials used in buildings. Energy Convers. Manag. X 2022, 15, 100237. [Google Scholar] [CrossRef]
- Aridi, R. Advanced Heat Recovery Systems: Use of Vortex Generators and Hybridization with Thermoelectric Generators, Considering Renewable Energy Sources and Life Cycle Assessment; Polytech Angers: Angers, France, 2023. [Google Scholar]
- Aridi, R.; Faraj, J.; Ali, S.; El-Rab, M.G.; Lemenand, T.; Khaled, M. Energy Recovery in Air Conditioning Systems: Comprehensive Review, Classifications, Critical Analysis, and Potential Recommendations. Energies 2021, 14, 5869. [Google Scholar] [CrossRef]
- Aridi, R.; Faraj, J.; Ali, S.; Lemenand, T.; Khaled, M. Thermoelectric Power Generators: State-of-the-Art, Heat Recovery Method, and Challenges. Electricity 2021, 2, 359–386. [Google Scholar] [CrossRef]
- Aridi, R.; Faraj, J.; Ali, S.; Lemenand, T.; Khaled, M. A comprehensive review on hybrid heat recovery systems: Classifications, applications, pros and cons, and new systems. Renew. Sustain. Energy Rev. 2022, 167, 112669. [Google Scholar] [CrossRef]
- Das, A.; Rao, A.K.; Alnajdi, S.; Warsinger, D.M. Pressure exchanger batch reverse osmosis with zero downtime operation. Desalination 2024, 547, 117121. [Google Scholar] [CrossRef]
- Stover, R. Expansion Retrofit of the Via Maris Palmachim Seawater Reverse Osmosis Plant; International Desalination Association World Congress: Dubai, United Arab Emirates, 2021. [Google Scholar]
- Abdel-Fatah, M.A.; Elsayed, M.M.; Al Bazedi, G.A. Design of Reverse Osmosis Desalination Plant in Suez City (Case Study). J. Sci. Eng. Res. 2016, 3, 149–156. [Google Scholar]
- Ezzeghni, U.A. Designing and Optimizing 10,000 m3 Conventional SWRO Desalination Plant; First Conference for Engineering Sciences and Technology (CEST): Libya, North Africa, 2018. [Google Scholar]
- Prakash, N.; Chaudhuri, A.; Das, S.P. Numerical modelling and analysis of concentration polarization and scaling of gypsum over RO membrane during seawater desalination. Chem. Eng. Res. Des. 2023, 190, 497–507. [Google Scholar] [CrossRef]
- Ghoujdi, I.E.; Hadiannasab, H.; Bidi, M.; Naeimi, A.; Ahmadi, M.H.; Nazari, M.A.; Ming, T. Multiobjective optimization design of the solar field and reverse osmosis system with preheating feed water using Genetic algorithm. Energy Sci. Eng. 2018, 6, 624–642. [Google Scholar] [CrossRef]
- Stover, R.L.; Martin, J. Reverse Osmosis and Osmotic Power Generation with Isobaric Energy Recovery. Desalination Water Treat. 2010, 15, 267–270. [Google Scholar] [CrossRef]
- Altaee, A.; Sharif, A. A conceptual NF/RO arrangement design in the pressure vessel for seawater desalination. Desalination Water Treat. 2014, 54, 624–636. [Google Scholar] [CrossRef]
- Version 5.01-9.1. DOW, 23 April 2019. [Online]. Available online: https://dowac.custhelp.com/app/answers/detail/a_id/19181/~/filmtec-membranes---rosa-version-history (accessed on 8 May 2019).


Disclaimer/Publisher’s Note: The statements, opinions and data contained in all publications are solely those of the individual author(s) and contributor(s) and not of MDPI and/or the editor(s). MDPI and/or the editor(s) disclaim responsibility for any injury to people or property resulting from any ideas, methods, instructions or products referred to in the content. |
© 2024 by the authors. Licensee MDPI, Basel, Switzerland. This article is an open access article distributed under the terms and conditions of the Creative Commons Attribution (CC BY) license (https://creativecommons.org/licenses/by/4.0/).