1. Introduction
Titanium alloys have become increasingly significant in the aeronautical industry for its exceptional strength-to-weight ratio and corrosion and temperature resistance [
1]. Aeronautical structures, particularly those made from Titanium Alloy (Ti-6Al-4V) which can now constitute up to 15% of a modern airplane’s weight, represent a critical intersection of material science, engineering innovation, and industrial application.
When an industry receives a request for quotation, it faces the challenge of promptly determining the most cost-effective [
2,
3] and suitable forming process, whether hot forming (HF) or Superplastic Forming (SPF), and the optimal temperature for manufacturing a specific part [
4,
5]. These decisions are critical, as they directly influence the manufacturing cost and the feasibility of producing complex shapes. In order to mitigate risks associated with these decisions, industries increasingly rely on numerical methods, especially finite element analysis (FEA), to evaluate and select the appropriate forming process for complex shapes.
The HF process, pivotal in shaping these complex components, leverages elevated temperatures to enhance material ductility up to approximately 60%, facilitating the deformation of Ti-6Al-4V into intricate geometries without compromising its inherent strength and lightweight characteristics [
6,
7]. This process is instrumental in the aerospace industry, where the demand for materials combining high strength-to-weight ratios and corrosion resistance is paramount.
Comparatively, cold forming operates at room temperature and, while cost-effective and efficient for some applications, it does not offer the same level of material ductility or complexity in shaping as HF. The typical elongation does not exceed 10%. This limitation is pronounced particularly for high-strength alloys like Ti-6Al-4V, where cold forming can lead to increased work hardening and potential cracking. On the other end of the spectrum, SPF represents a specialized technique that exploits the superplastic behavior of some alloys at elevated temperatures, allowing for the production of components with extremely complex shapes, fine details, and large elongations up to 300% [
8,
9,
10]. SPF exploits the superplastic behavior of certain materials, enabling extensive deformation without failure under specific temperature and strain rate conditions. However, SPF requires higher temperatures, longer processing times, and specific microstructures, which can limit production rates despite its unparalleled forming capabilities.
For manufacturing aeronautical Ti-6Al-4V structures, the choice between forming processes depends on component complexity, material properties, production efficiency, and cost. The HF process is particularly advantageous, providing a synergistic blend of material utilization, structural integrity, and geometric complexity. It caters to stringent aerospace performance criteria while aligning with the pursuit of lightweight, durable, and cost-effective solutions.
The use of FEA in metal forming process design has been instrumental in addressing these challenges. By simulating different forming scenarios, FEA helps identify the most efficient process that minimizes defects and meets the part specifications. This identification is particularly valuable in HF and SPF, where the temperature and strain rate significantly affect the material’s behavior and the final product’s properties as reported by Lobbe et al. [
11]. Moreover, FEA facilitates the exploration of rapid HF processes, which are crucial for reducing manufacturing times and costs while ensuring high-quality outcomes.
The primary objective of this study is to compare the effectiveness of different finite element types (classic shell elements, 3D brick elements, and continuum shell elements) in simulating the HF process of a part with a blank thickness of 1.6mm. The blank is treated as a deformable entity exhibiting anisotropic plastic behavior, whereas the forming tools, namely the matrix and the punch, are modeled as rigid bodies. This setup reflects the real-world conditions, where the tools are significantly stiffer than the material being formed.
For accurate HF process simulation, the material model must account for uncoupled temperature and strain rate effects, friction, and anisotropy, which are crucial for metallic component forming and final shape control [
12]. Simulation validation compares the predicted and actual final part geometry, focusing on the thickness distribution indicative of material flow, deformation, and potential defects. This study aims to provide insights for selecting appropriate finite element types to simulate HF processes, contributing to process optimization, improved part quality, and efficiency, which is of significant interest to the manufacturing industry.
Section 2 presents Ti-6Al-4V material properties and behavior law from the literature, laying the groundwork for the material model and simulation methodology. It details the initial and boundary conditions, compares modeling approaches, and introduces three finite element types: classic shell, continuum shell, and 3D solid elements. Each element type is scrutinized for capturing complex HF process phenomena, setting the framework for evaluating their merits in subsequent sections.
Section 3 presents and discusses the simulation results. It compares the performance of classic shell, continuum shell, and 3D solid elements in the HF process context. The influence of various process parameters on simulation outcomes is analyzed. Finally, the simulation model is validated by comparing the geometrical features and thickness distribution of the simulated part against the actual manufactured component. This approach aims to validate the simulation’s accuracy and potential as a predictive tool for HF processes.
2. Materials and Methods
The conducted case study examines the manufacturing process of an aeronautical component, with approximate dimensions of
currently in use within the lower section of the A320 neo pylon (see
Figure 1 for a picture of the manufactured part after forming and contour machining) [
5].
This part undergoes a HF process at a temperature of 725 °C to achieve the desired shape and mechanical properties as recommended by Tekin et al. [
7]. As reported in
Figure 2, six components (highlighted in red) are concurrently shaped using a pair of intricate dies, demonstrating the complexity of the process.
The general shape of the formed part is not developable, as it does not have any plane of symmetry and has one predominant length over the other two.
To mitigate the risk of slippage during forming, the metal blank is pre-formed, as the final geometry involves a complex 3D shape as reported in
Figure 1 and
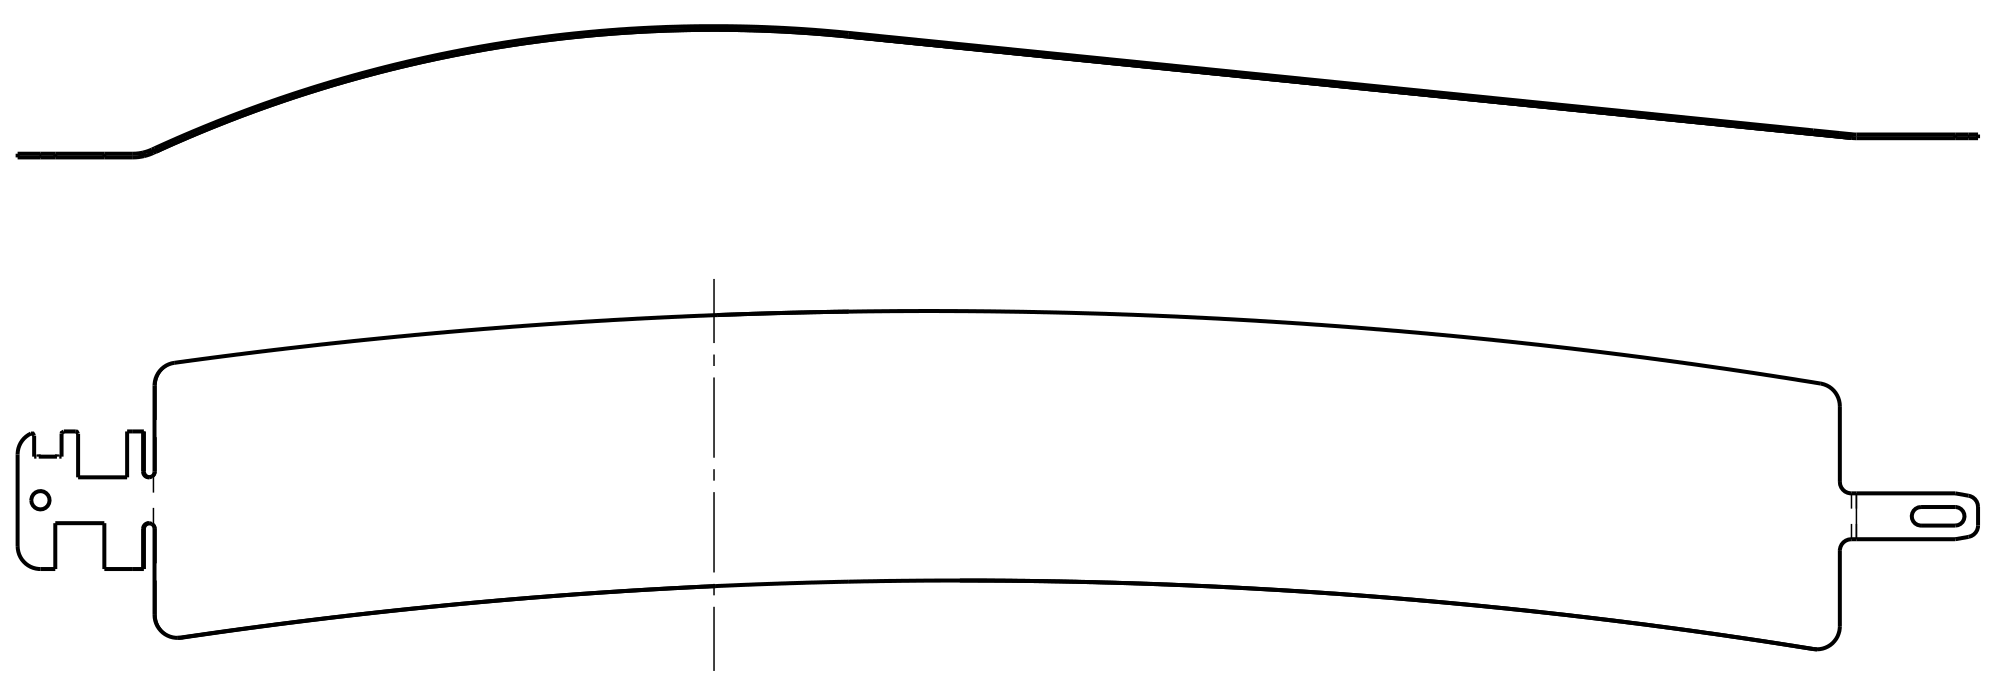
Figure 2. An initial flat blank is incompatible with the nonflat geometry of the lower die (punch), which features a concave shape with ends lower than the middle. To ensure successful forming, a pre-forming stage must adapt the blank to mirror the contour of the lower die; therefore, a metal blank with an initial dimension of
central zone is about
is reported in
Figure 3.
This adaptation is crucial for preventing slippage and ensuring that the metal flows correctly during the HF process. Slippage during forming can lead to defects, such as wrinkles or incomplete forming, which compromise the part’s structural integrity and aesthetic appearance. In the real-life application, we also restrain the displacement of the blank at both ends, along the longitudinal and transverse directions on the left end and along the transverse direction of the right end to accommodate the elongation during the forming process. This restraint is achieved through specialized fixtures designed to hold the pre-formed blank securely. To simplify the numerical modeling, the left end of the blank is modified, and the boundary conditions are adapted accordingly.
The total process time is divided into a heating phase of 3 min to 5 min (temperature rises from 20 °C to 725 °C), a forming phase of 5 min at a constant temperature of 725 °C, and a final relaxation phase of 5 min before the die opening in 1.5 min. This relaxation phase is critical in allowing the material to settle and the stresses to redistribute after forming. Although the design of the production setup allows the forming of multiple blanks at once using an 80 t hot press, for simulation purposes, only a single blank is modeled and assumed to withstand a maximum force of around 13 t. Using a single blank is justified by the uniformity of the blanks, which ensures that the simulation results represent the entire batch.
2.1. Material Properties
The raw material used for the HF process is a Ti-6Al-4V sheet whose main chemical composition is reported in
Table 1.
Concerning the behavior law of the Ti-6Al-4V at 725 °C, for this paper, the material data are sourced from Bylya et al. [
13] and Seshacharyulu et al. [
14] due to the confidential nature of the material parameters obtained from hot tensile tests in our lab during this study. To precisely determine the hot deformation characteristics of titanium alloy sheets, hot tensile uniaxial tests using a Gleeble thermomechanical simulator at various strain rates and temperatures must be performed as proposed by Fu et al. [
15]. This characterization can also include the evaluation of hot-forming limit diagrams of titanium alloy sheets as proposed by Fan et al. [
16] that can reflect the anisotropic hardening and the r-value evolution during the deformation. This decision was necessitated by the proprietary nature of the actual data, which precludes their public disclosure.
Seshacharyulu et al. [
14] have published stress/strain curves for a temperature range from 500 °C to 1100 °C and strain rates from 10
−6 s
−1 to 10
2 s
−1. From the latter, the evolution of the Young modulus depending on the material temperature and the flow stress depending on both the temperature and the strain rate is extracted for the simulations. It is acknowledged that the real behavior of materials under various conditions is inherently more complex than the simplified models presented in this study. This complexity arises from the multitude of factors influencing material behavior, including but not limited to microstructural variations, phase transformations, and anisotropic properties.
In the proposed model, the anisotropic plasticity is taken into account using the Hill’s criterion through the ratios of the yield stress
in different directions using the following expression:
where
F,
G,
H,
L,
M, and
N are the anisotropic coefficients defined as functions of
, conforming to the Abaqus reference manual [
17]. The material parameters used for the simulations are reported in
Table 2.
2.2. Simulation Methodology
In the realm of forming simulations, Abaqus offers two primary solvers: the standard (implicit) solver and the explicit solver. The choice between these solvers depends on the specific requirements of the simulation task. Forming simulations often involve complex contact interactions, material nonlinearities, and large deformations. The explicit solver is preferred frequently due to its robust handling of these complexities and its ability to solve problems with severe discontinuities and instabilities efficiently, so the choice has been retained here. The real-time duration of the process is approximately 15 min; however, to optimize computational resources and time, the process will be artificially sped up (with a factor of ) in the simulation environment, while only the forming and relaxation phase and the die opening will be simulated. Therefore, the forming duration is set to 3 s and the opening of the dies is set to 1 s for a total simulation time of 4 s. This acceleration of the simulation time necessitates a corresponding adjustment to the strain rate, ensuring that the material behavior under the faster simulated conditions accurately reflects the behavior that would be observed under the actual forming process speed.
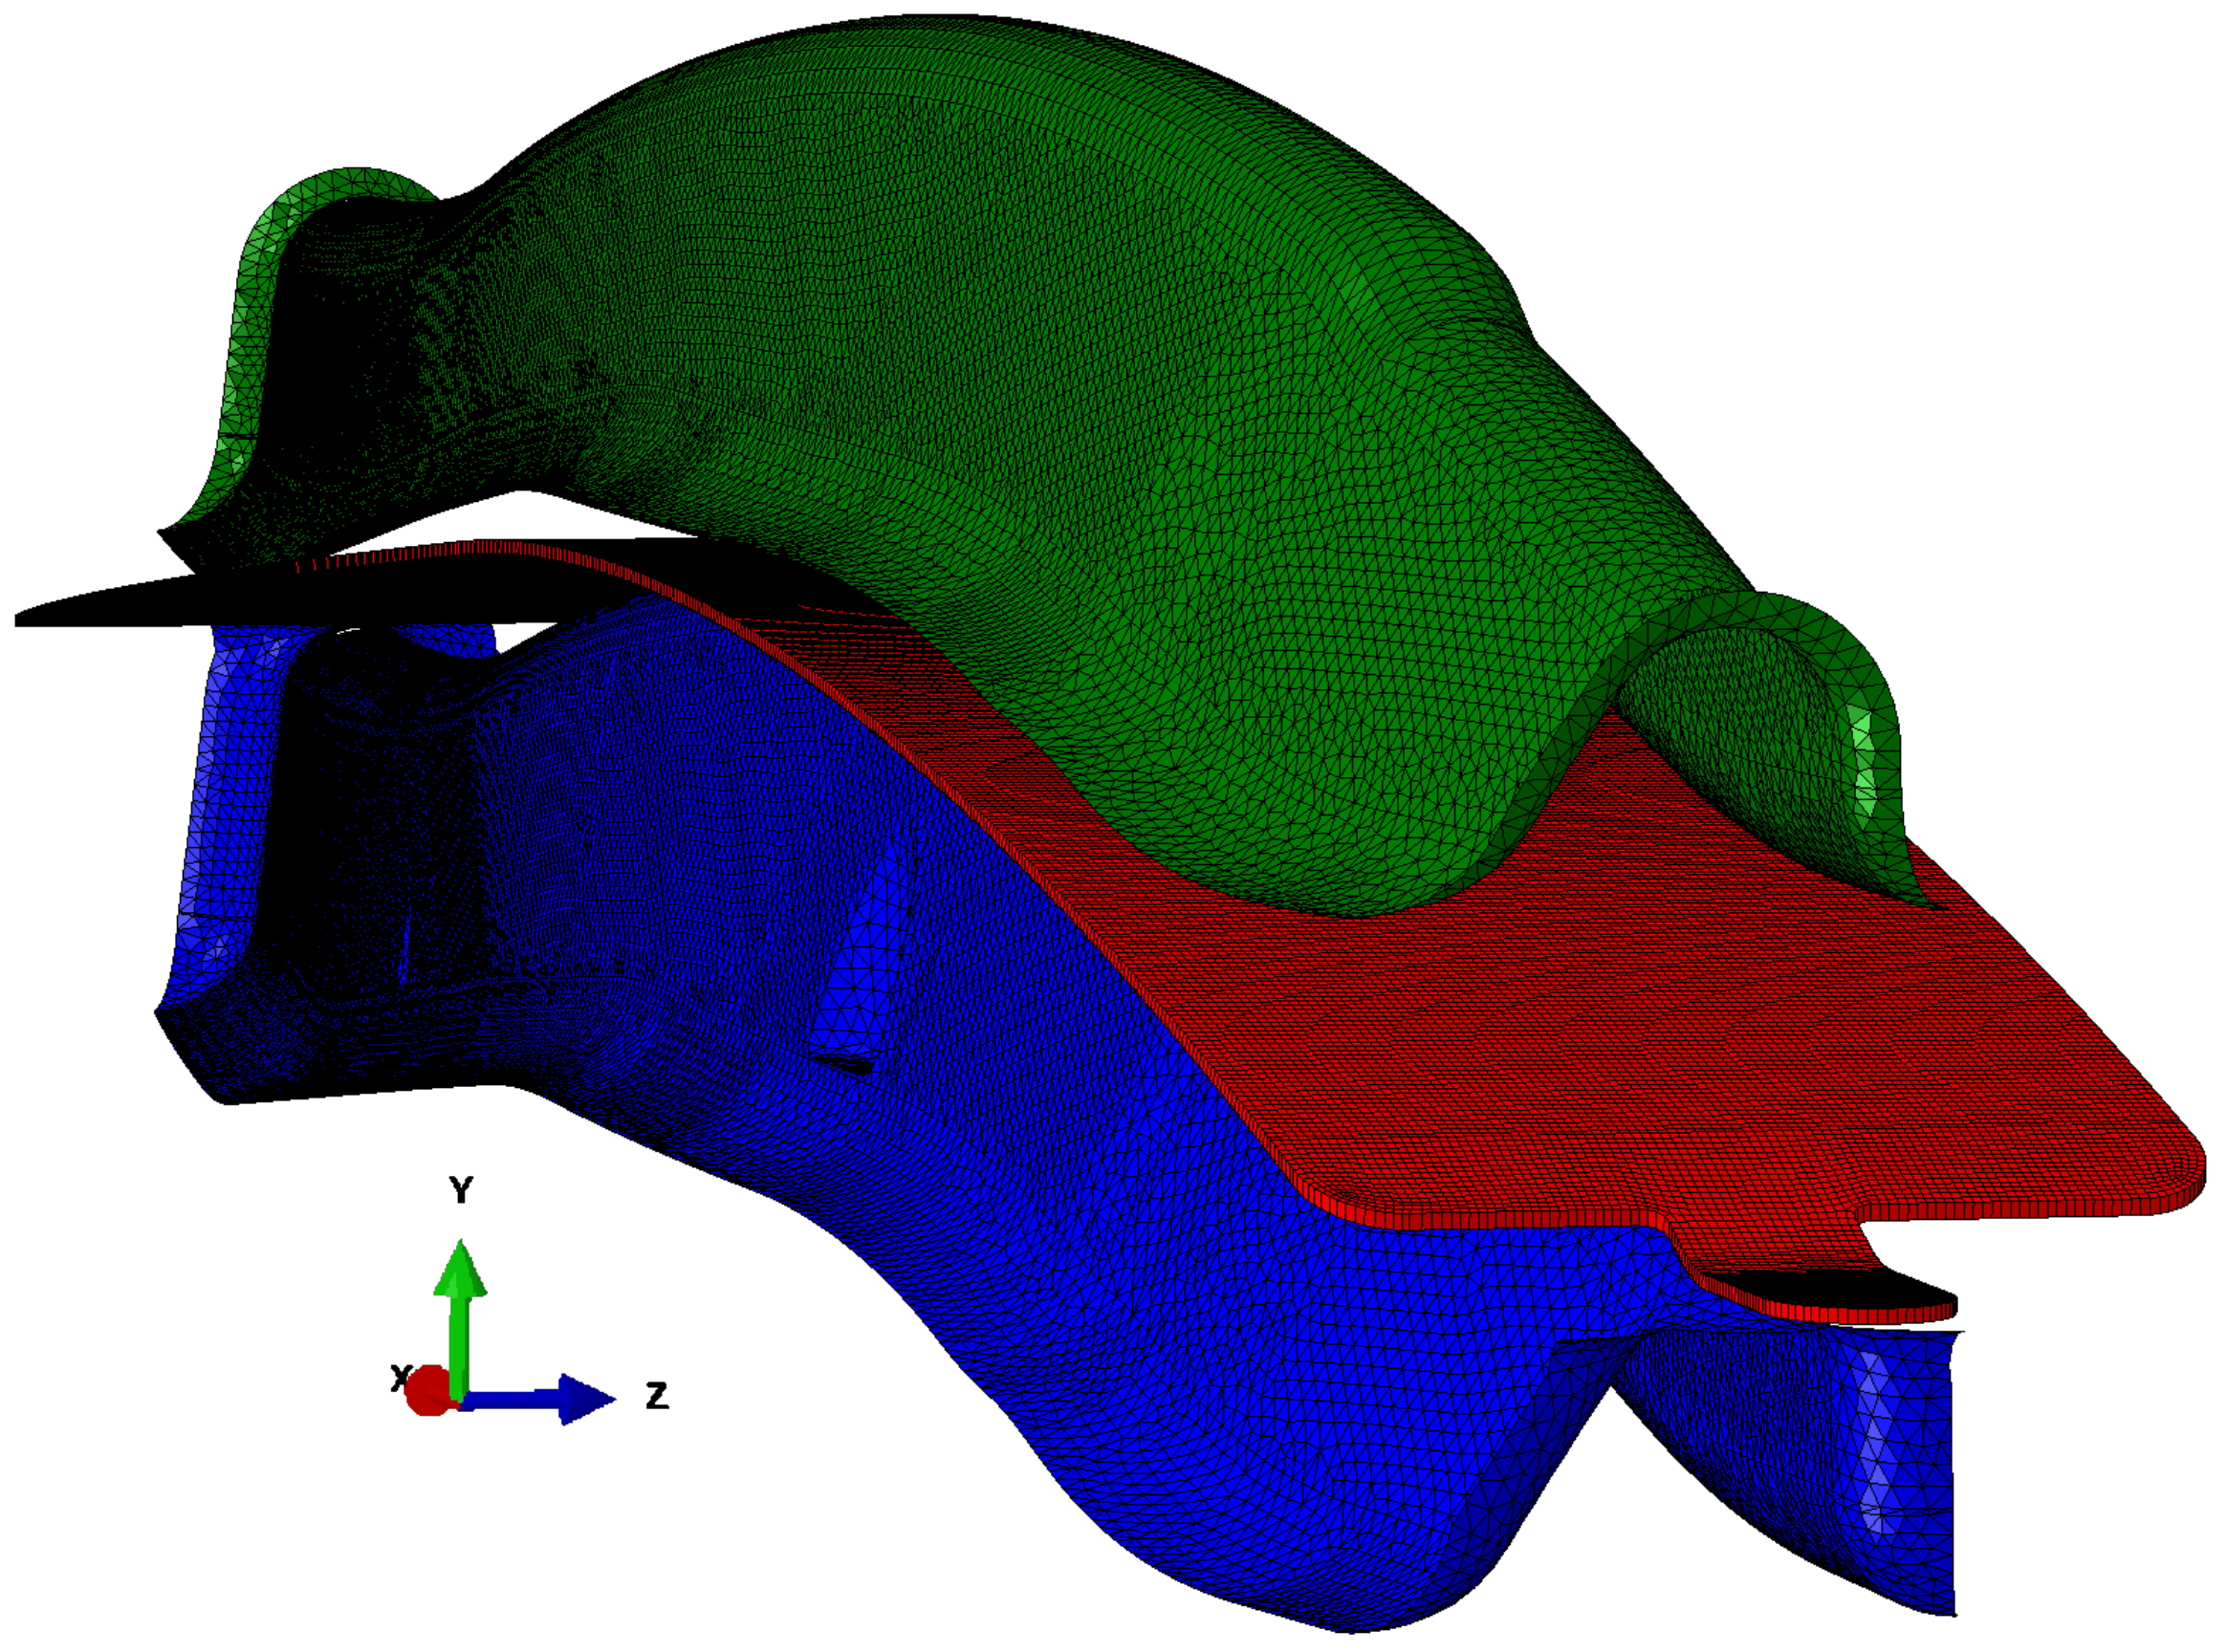
For numerical simulation of sheet metal forming, a common practice is to model the tools involved in the process, such as the matrix (die) and punch, as 3D rigid body elements (R3D3), while the blank, the piece of sheet metal being formed, is treated as a deformable element as reported in
Figure 4.
The approach to simulate the forming process with rigid tools and the blank as deformable is particularly effective for capturing the essential physics of the interactions between the blank and the tools. This approach is typical since the material properties of the blank are significantly reduced under hot temperatures, making the dies effectively rigid in comparison. Modeling the tool as rigid significantly reduces the computational cost of the simulation, as it avoids the need to model the deformation of the tools.
The blank, with a specified thickness of 1.6 mm, is subjected to various stresses and strains as it conforms to the shape dictated by the rigid tools. Using a deformable element for the blank is crucial for accurately predicting the outcome of the forming process, as it enables the simulation to account for the material’s behavior under the applied loads, including plastic deformation and springback effects. Regarding the boundary conditions for the tools, the upper die moves down a distance of 62 mm along the Y-axis during forming, while the lower die is fixed. During the opening of the matrices, the upper die moves up 50 mm along the Y-axis. As for the boundary conditions applied to the blank, it is blocked in translation along the X and Z directions and the three rotations, while the translation along the Y direction is free at the front of
Figure 4 (corresponding to the left end in
Figure 3). However, the other end of the blank (corresponding to the right end in
Figure 3) is also free to move along the X direction to compensate for the longitudinal deformation during forming.
Concerning friction, a layer of Boron Nitride (BN) deposit is used as a lubricant to reduce friction between the blank and the forming tools [
18,
19]. BN has a layered structure similar to graphite, which allows it to exhibit low friction coefficients and high thermal stability. In the context of HF processes, many conventional lubricants degrade due to the high forming temperatures. BN powder remains stable and retains its lubricating properties at temperatures up to 1000 °C and beyond, making it an ideal choice for such applications. Its use can reduce tool wear and improve the surface quality of the formed titanium sheets by minimizing friction between the workpiece and the forming tools.
In order to speed up simulations, a global mass scaling factor of is used in our simulations. This technique involves increasing the mass of certain elements in the model, which in turn increases the stable time increment, thereby reducing the overall simulation time by a factor of .
2.3. Element Types for Modeling the Deformable Blank
In the present study, three distinct element types were utilized, and their respective performances were evaluated: a classic shell element, a solid element, and a continuum shell element.
The four nodes shell element is widely used for HF simulations of thin metal sheets. Both versions are available in Abaqus explicit: with and without reduced integration, respectively named S4R and S4. This element enhances six degrees of freedom (3 translations and 3 rotations). Its ability to model the mechanical and thermal responses of thin structures, along with complex contact interactions with tools (upper and lower dies), explains its use for applications like automotive body panels and aerospace components.
The solid element exists in both versions: full and reduced integration in Abaqus explicit, respectively named C3D8 and C3D8R. It is a hexahedron brick element with eight nodes that have 1 or 8 Gauss points depending on the retained integration scheme.
The continuum shell element (SC8R) is an element that looks like a solid element (same shape as the C3D8 element) but behaves as a shell element, except it has only three degrees of freedom (3 translations). This one is advantageous for simulating HF processes involving thick metal sheets or bulk components due to its reduced integration scheme (only one Gauss point is used for the integration of the behavior law), which lowers computational costs while maintaining accuracy through quite efficient hourglass control. It is well suited for scenarios where large deformations and nonlinear material behavior are prevalent. The SC8R element in Abaqus Explicit is exclusively available only with reduced integration.
Due to the complexity of the different parts, the mesh is quite fine and consists of 75,456 C3D8 or C3D8R solid elements, 75,456 SC8R continuum shell elements, or 75,931 S4 or S4R shell elements for the blank, depending on the model considered. The two rigid tools consist of 38,504 and 47,006 R3D3 elements, respectively, for the upper and lower dies. This results in a total of 161,441 elements and 120,333 nodes for the classic shell model and 160,966 elements and 196,251 nodes for two other models. Only one element is used along the thickness of the blank.
3. Results and Discussion
The numerical simulations in this research were performed using the Abaqus/Explicit solver, version 2023 with the double precision solver. The computational work was carried out on a ProLiant DL380 Gen10 Plus server, which is well appointed with two Intel® Xeon® Gold 6330 CPUs, each with a clock speed of 2.00 GHz, and a total of 256 GiB of RAM. Although the server is also equipped with a powerful GPU, the NVIDIA A100, this particular resource was not utilized for the simulations. The explicit solver in Abaqus 2023 does not support GPU acceleration, and therefore the A100 card remained idle during the computations.
3.1. Selection of the Number of CPU Cores to Use
One of the straightforward ways to speed up a numerical simulation is to use parallel computation on many CPU cores. Unfortunately, there is no direct relationship between computing time and the number of cores for Abaqus Explicit simulations in the context of HF processes, so selecting the optimal number of cores to use is not straightforward. In the explicit numerical simulation of sheet metal forming, the speed-up achieved is often constrained by the extensive contact interactions between the sheet and the forming tools. Since the entire lower and upper surfaces of the sheet are in contact with the tools, the software is unable to optimize domain decomposition for parallel computing, and thus the potential for code parallelization remains limited. Regardless of the number of cores utilized for the simulations, the initial domain solely encompasses all nodes and elements of the structure. Consequently, the computationally expensive contact calculations are exclusively processed by the first core. This is because the contact calculations involve determining the interactions between different parts of the structure, which requires access to all the nodes and elements since only one layer of elements is used for the blank. Only the aspects related to the plastic flow law, which is relatively simplistic, can be efficiently distributed across the computational cores. Consequently, the reduction in computation time as a function of the number of cores is quite modest for this type of simulation as reported by Dutton et al. [
20].
It is important to carefully select the number of cores to use because of the cost of the server and the fact that the cost in terms of Abaqus licenses is proportional to the number of cores involved in the computation as reported by Equation (
2):
where
is the number of tokens necessary to run a simulation,
is the number of cores used, and
is the floor function.
In order to define the optimal number of cores to use for the simulation process, and to ensure the reliability and consistency of our computing times, we have conducted five simulations for each case. To mitigate the effects of outliers and variability, we discarded the highest and lowest values from these five runs, and the remaining three values were then averaged to provide a more stable and representative measure of the computed time for each simulation case.
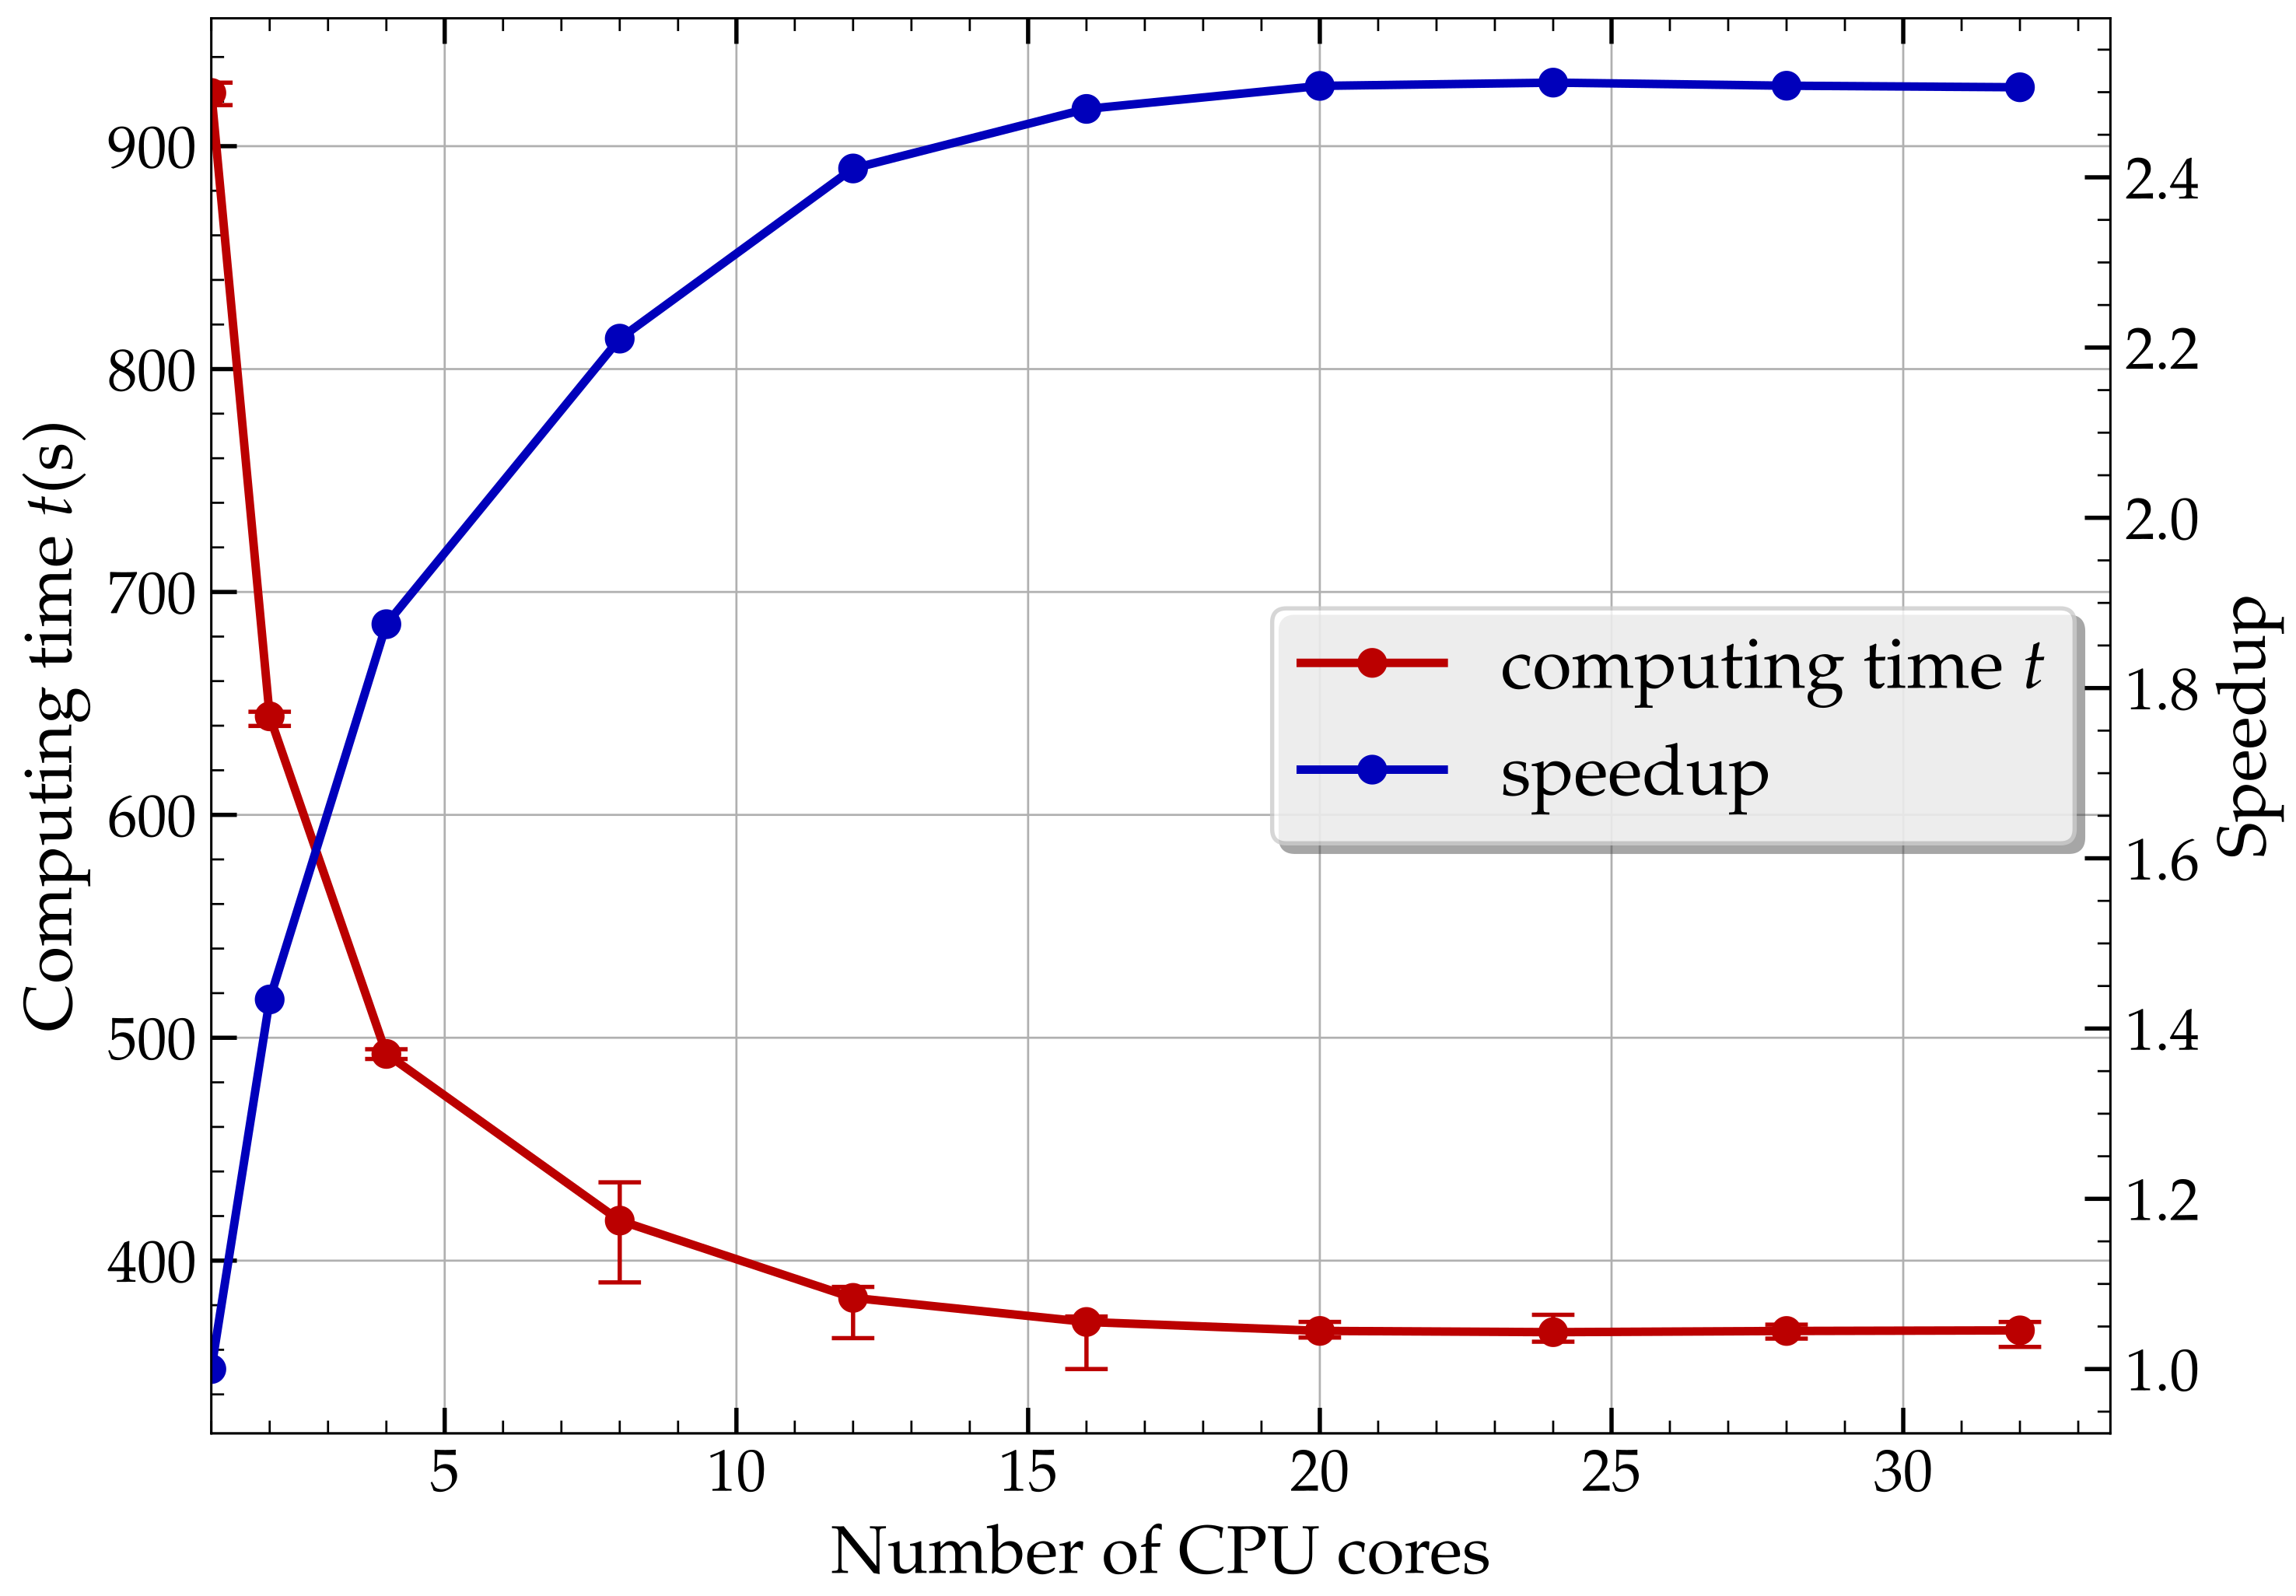
Table 3 and
Figure 5 reports the evolution of the computing time and the speed-up versus the number of cores for a partial simulation of the HF process (here, we only consider 7.5% of the total simulation to perform).
The speed-up is a measure of the relative performance improvement of a parallel algorithm compared to its sequential counterpart. It is defined as the ratio of the time required by the best sequential algorithm to solve a problem to the time required by the parallel algorithm using p processors to solve the same problem .
As reported in
Table 3 and
Figure 5, the relationship between computing time and the number of cores is not linear, especially as the number of cores increases. Initially, a reduction in the computing time can be observed as the number of cores increases from 1 to 8 cores but far from the expected results (the speed-up is only 2.2 for 8 cores). This reduction in computing time decreases drastically over 8 cores and is no longer present beyond 20 cores.
When the number of cores is increased from 8 to 12, the hardware requirement () is multiplied by 1.5, and the software cost, in terms of the number of requested tokens (), increases by a factor of 1.16, resulting in only an 8.3% reduction in computing time t. Therefore, it is concluded that for all simulations hereafter, we are restrained to using 8 cores, as increasing the core count beyond this does not yield significant gains in performance and increases the resulting cost.
3.2. Simulations Results and Comparison with Experiments
The overall results of the numerical simulations for the five test cases, i.e., models based on classic shell elements (S4R and S4), solid elements (C3D8R and C3D8), and continuum shell elements (SC8R), are presented in
Table 4.
Concerning the results in terms of computing time, the S4R model exhibits the shortest computing time at approximately 1 h and 1 min (1:00:47), indicating efficient computational performance. The C3D8 model shows a moderate computing time longer than its reduced integration counterpart (C3D8R). The S4 model is significantly longer than the S4R model, highlighting again the efficiency of reduced integration elements. The SC8R model, despite being a reduced integration element, has the longest computing time, about twice the one of the S4R model, but this is due to the fact that the stable time increment
for the continuum shell element is half the one of the classic shell element; therefore, it needs twice the number of iterations to complete the simulation. Both S4(R) and SC8R time increments depend on the element size and wave speed, but S4(R) mainly depends on thickness, while SC8R depends on all dimensions. Continuum shells will often have smaller time increments for the same mesh density when their thickness is small [
17]. The ratio of the computing time with the number of increments (Time/Inc.) is the same for S4R and SC8R elements.
Figure 6 illustrates the evolution of the force applied in the Y-axis direction by the press during the numerical simulation, while the maximum value of the force is reported in
Table 4.
From these results, it is observed that the evolution of the forces is consistent across all models. The forces start to appear around 15% of the simulation (they are almost null before this point), and are more or less constant during the first phase of the forming process, up to 65% of the total computation time. From 70% to 75% of the simulation, the forces increase significantly, reaching values between 120 kN and 150 kN depending on the model used. The maximum force values are close to each other across the different models, and the image width is consistent for all cases, ensuring a proper comparison of the force evolution at the same scale. This period corresponds to the end of the die-closing phase. From 75% to 80% of the simulation, these forces return to around zero throughout the entire die-opening phase. Beyond 80%, these forces return to a value of zero until the simulation is fully completed.
Figure 7 shows the shell thickness contour plot for the continuum shell model (SC8R).
Recalling that the initial blank thickness is 1.6 mm, the final thickness of the formed shape varies within the range from 1.460 mm to 1.697 mm. The lateral area on the edges of the final shape presents a thickening of about 0.1 mm in a zone outside the useful area of the part (the area that will be removed during the final machining phase). At the shoulder level (upper part of the formed shape), there is a presence of a thinning of the thickness (blue zone) in which the thickness reduction is about 0.14 mm in the upper part and there is an extra thickness of about 0.03 mm in the lower part of the shoulder. These thickness variations are a crucial criterion for the final quality of the formed parts insofar as the manufacturer’s specifications specify that the thicknesses must be as constant as possible throughout the entire part.
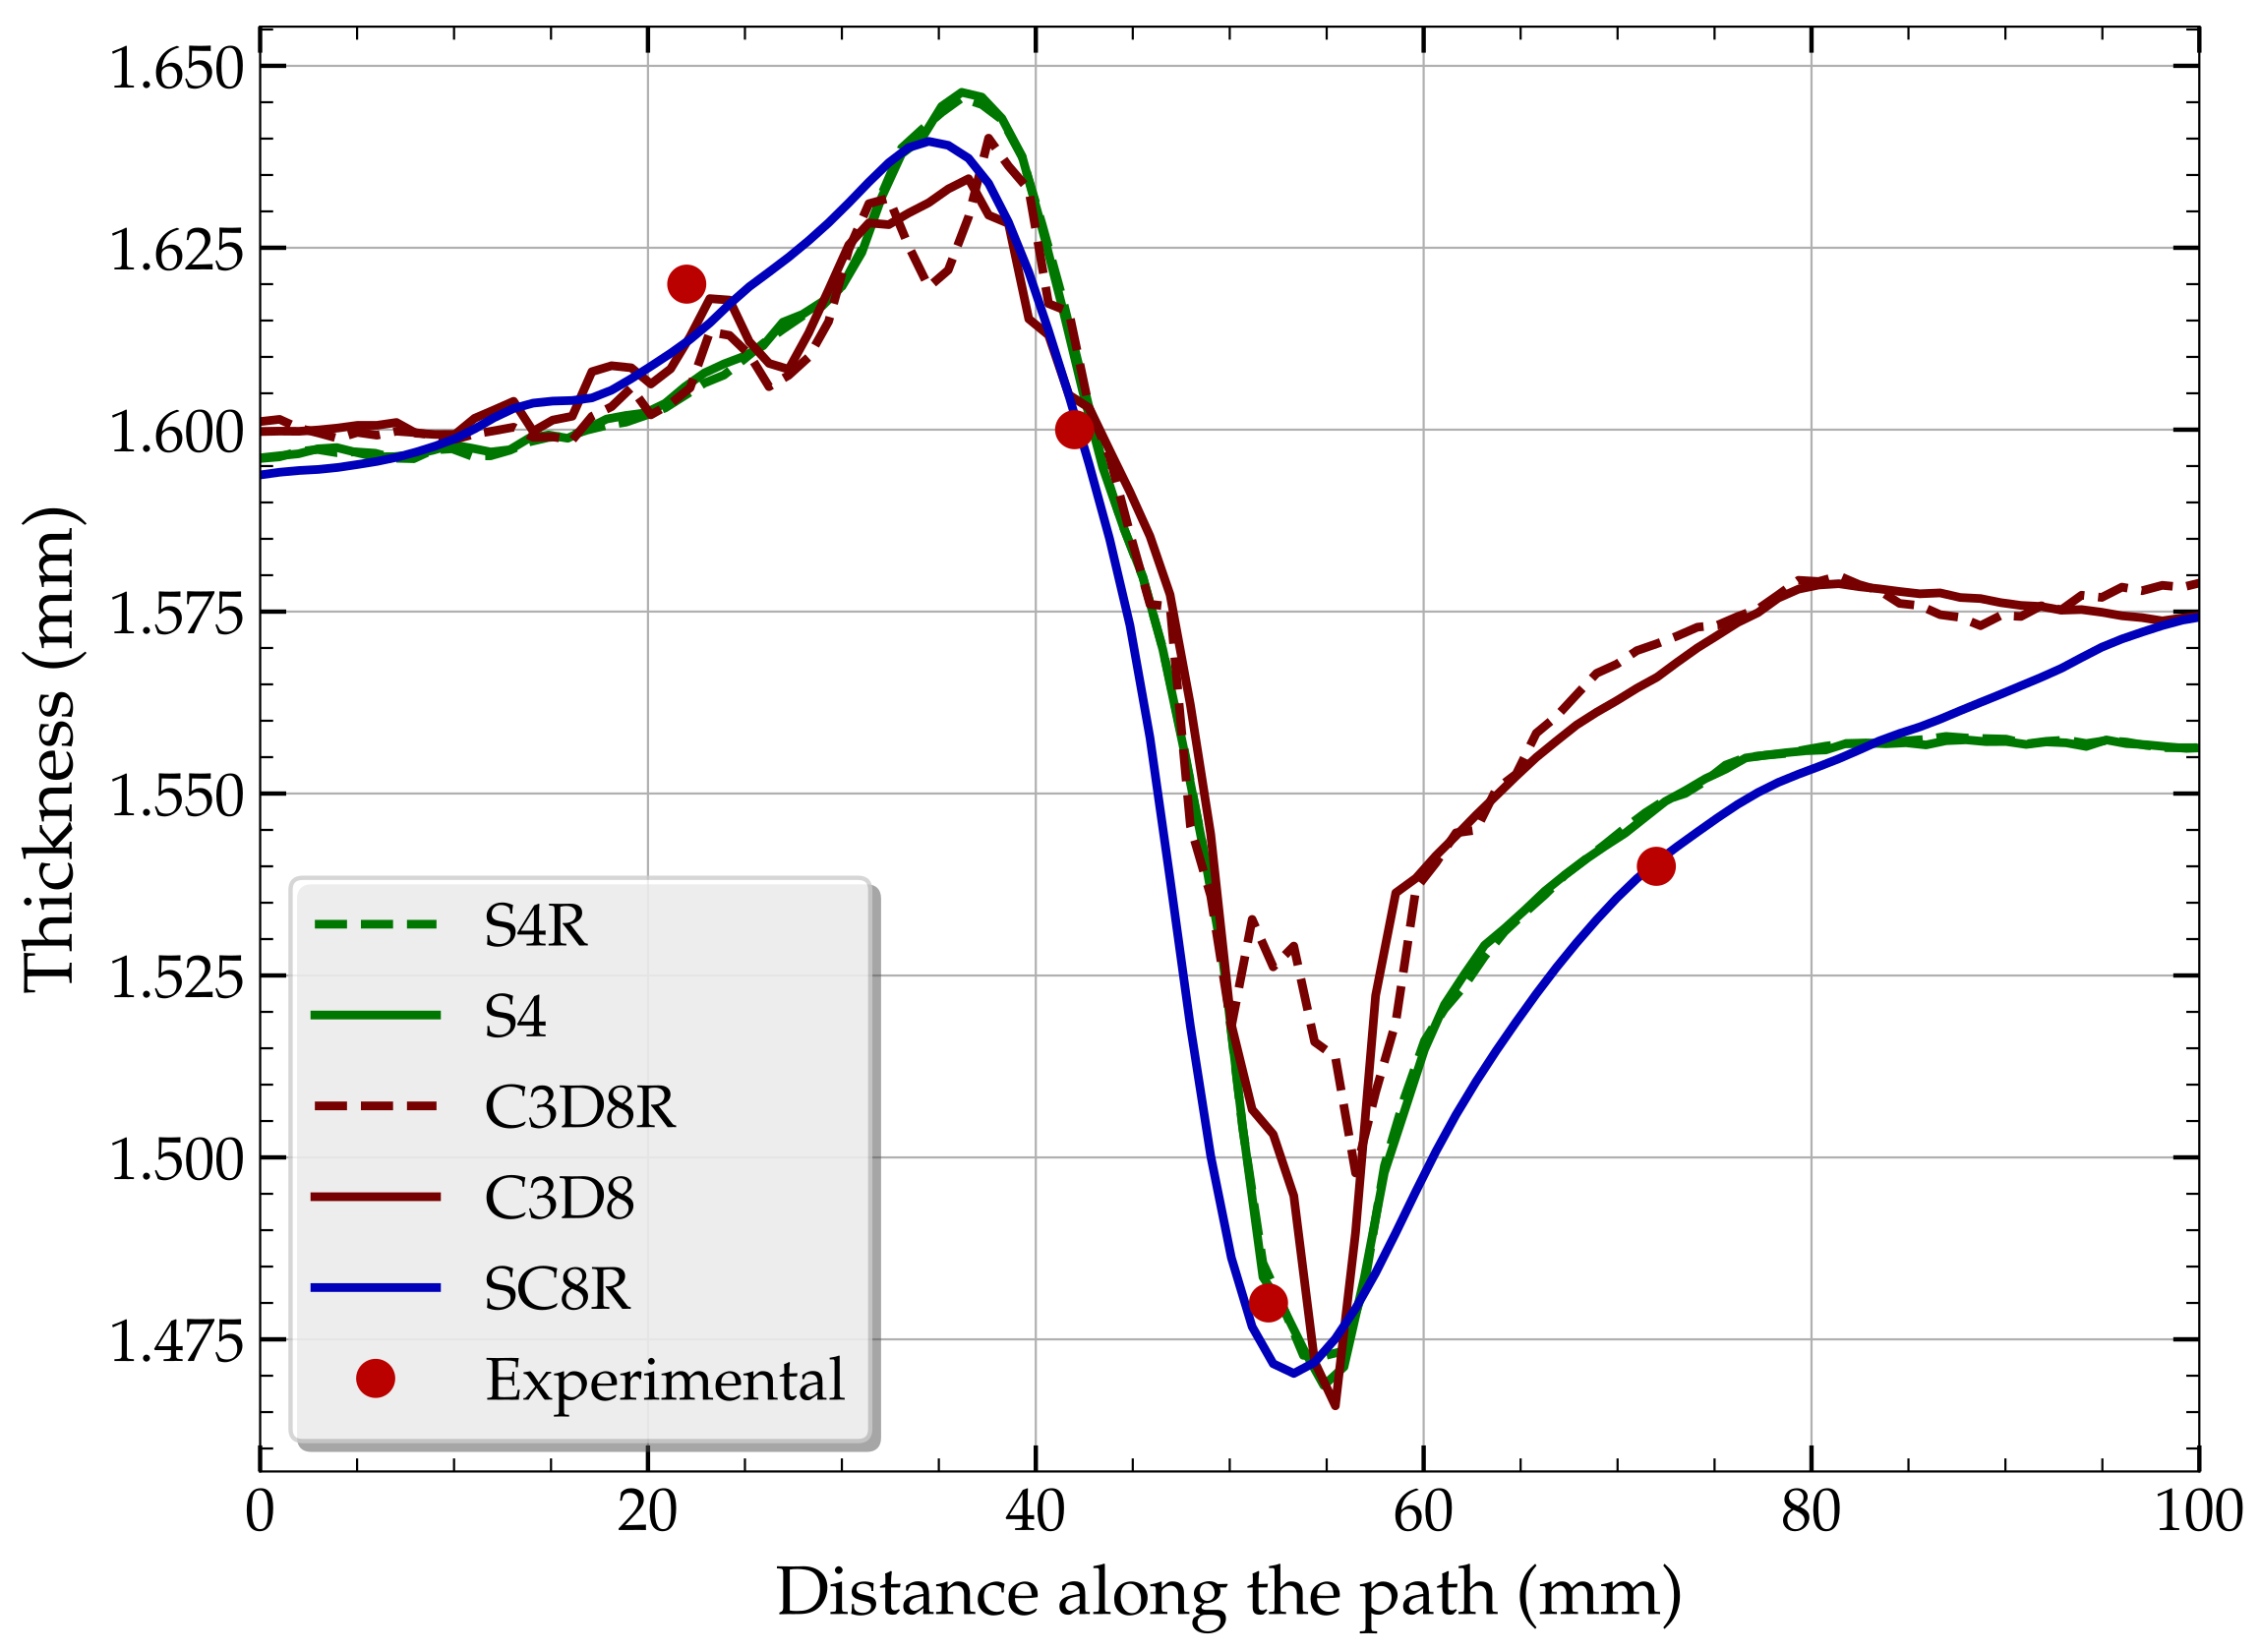
In order to better follow the thickness variations at the shoulder level, a profile of the thicknesses over a length of 100 mm along the red arrow on
Figure 7 is extracted for the five models and is reported in
Figure 8.
Since the notion of thickness is not present in the formulation of the solid C3D8 and C3D8R elements, the calculation of thicknesses was performed by a routine in Python language based on the final coordinates of the nodes of the elements located on the path of the red arrow of
Figure 7. The SC8R element provides the smoothest variation in the sheet thickness. The classic shell elements give results in agreement with the thickness evaluation given by the SC8R element. Regarding the solid elements, the thickness variation shows oscillations in its evolution, mainly due to the fact that it is calculated from the coordinates of the nodes and because the notion of thickness is absent from the formulation of those finite elements. All models give coherent results except the C3D8R model, where a lot of oscillations are visible in the results, and the C3D8 model underestimates the thickness variation along the path.
In order to validate the numerical simulations, thickness measurements were carried out at four points along the profile of the red arrow, and the experimental results (red points) are reported in
Figure 8. We can see the correlation of the numerical results of all models with the experimental measurements. Here, we have deliberately reduced the number of experimental points presented to a strict minimum due to the confidentiality of the results. The aim is to prove that the models fit quite well with the experiments.
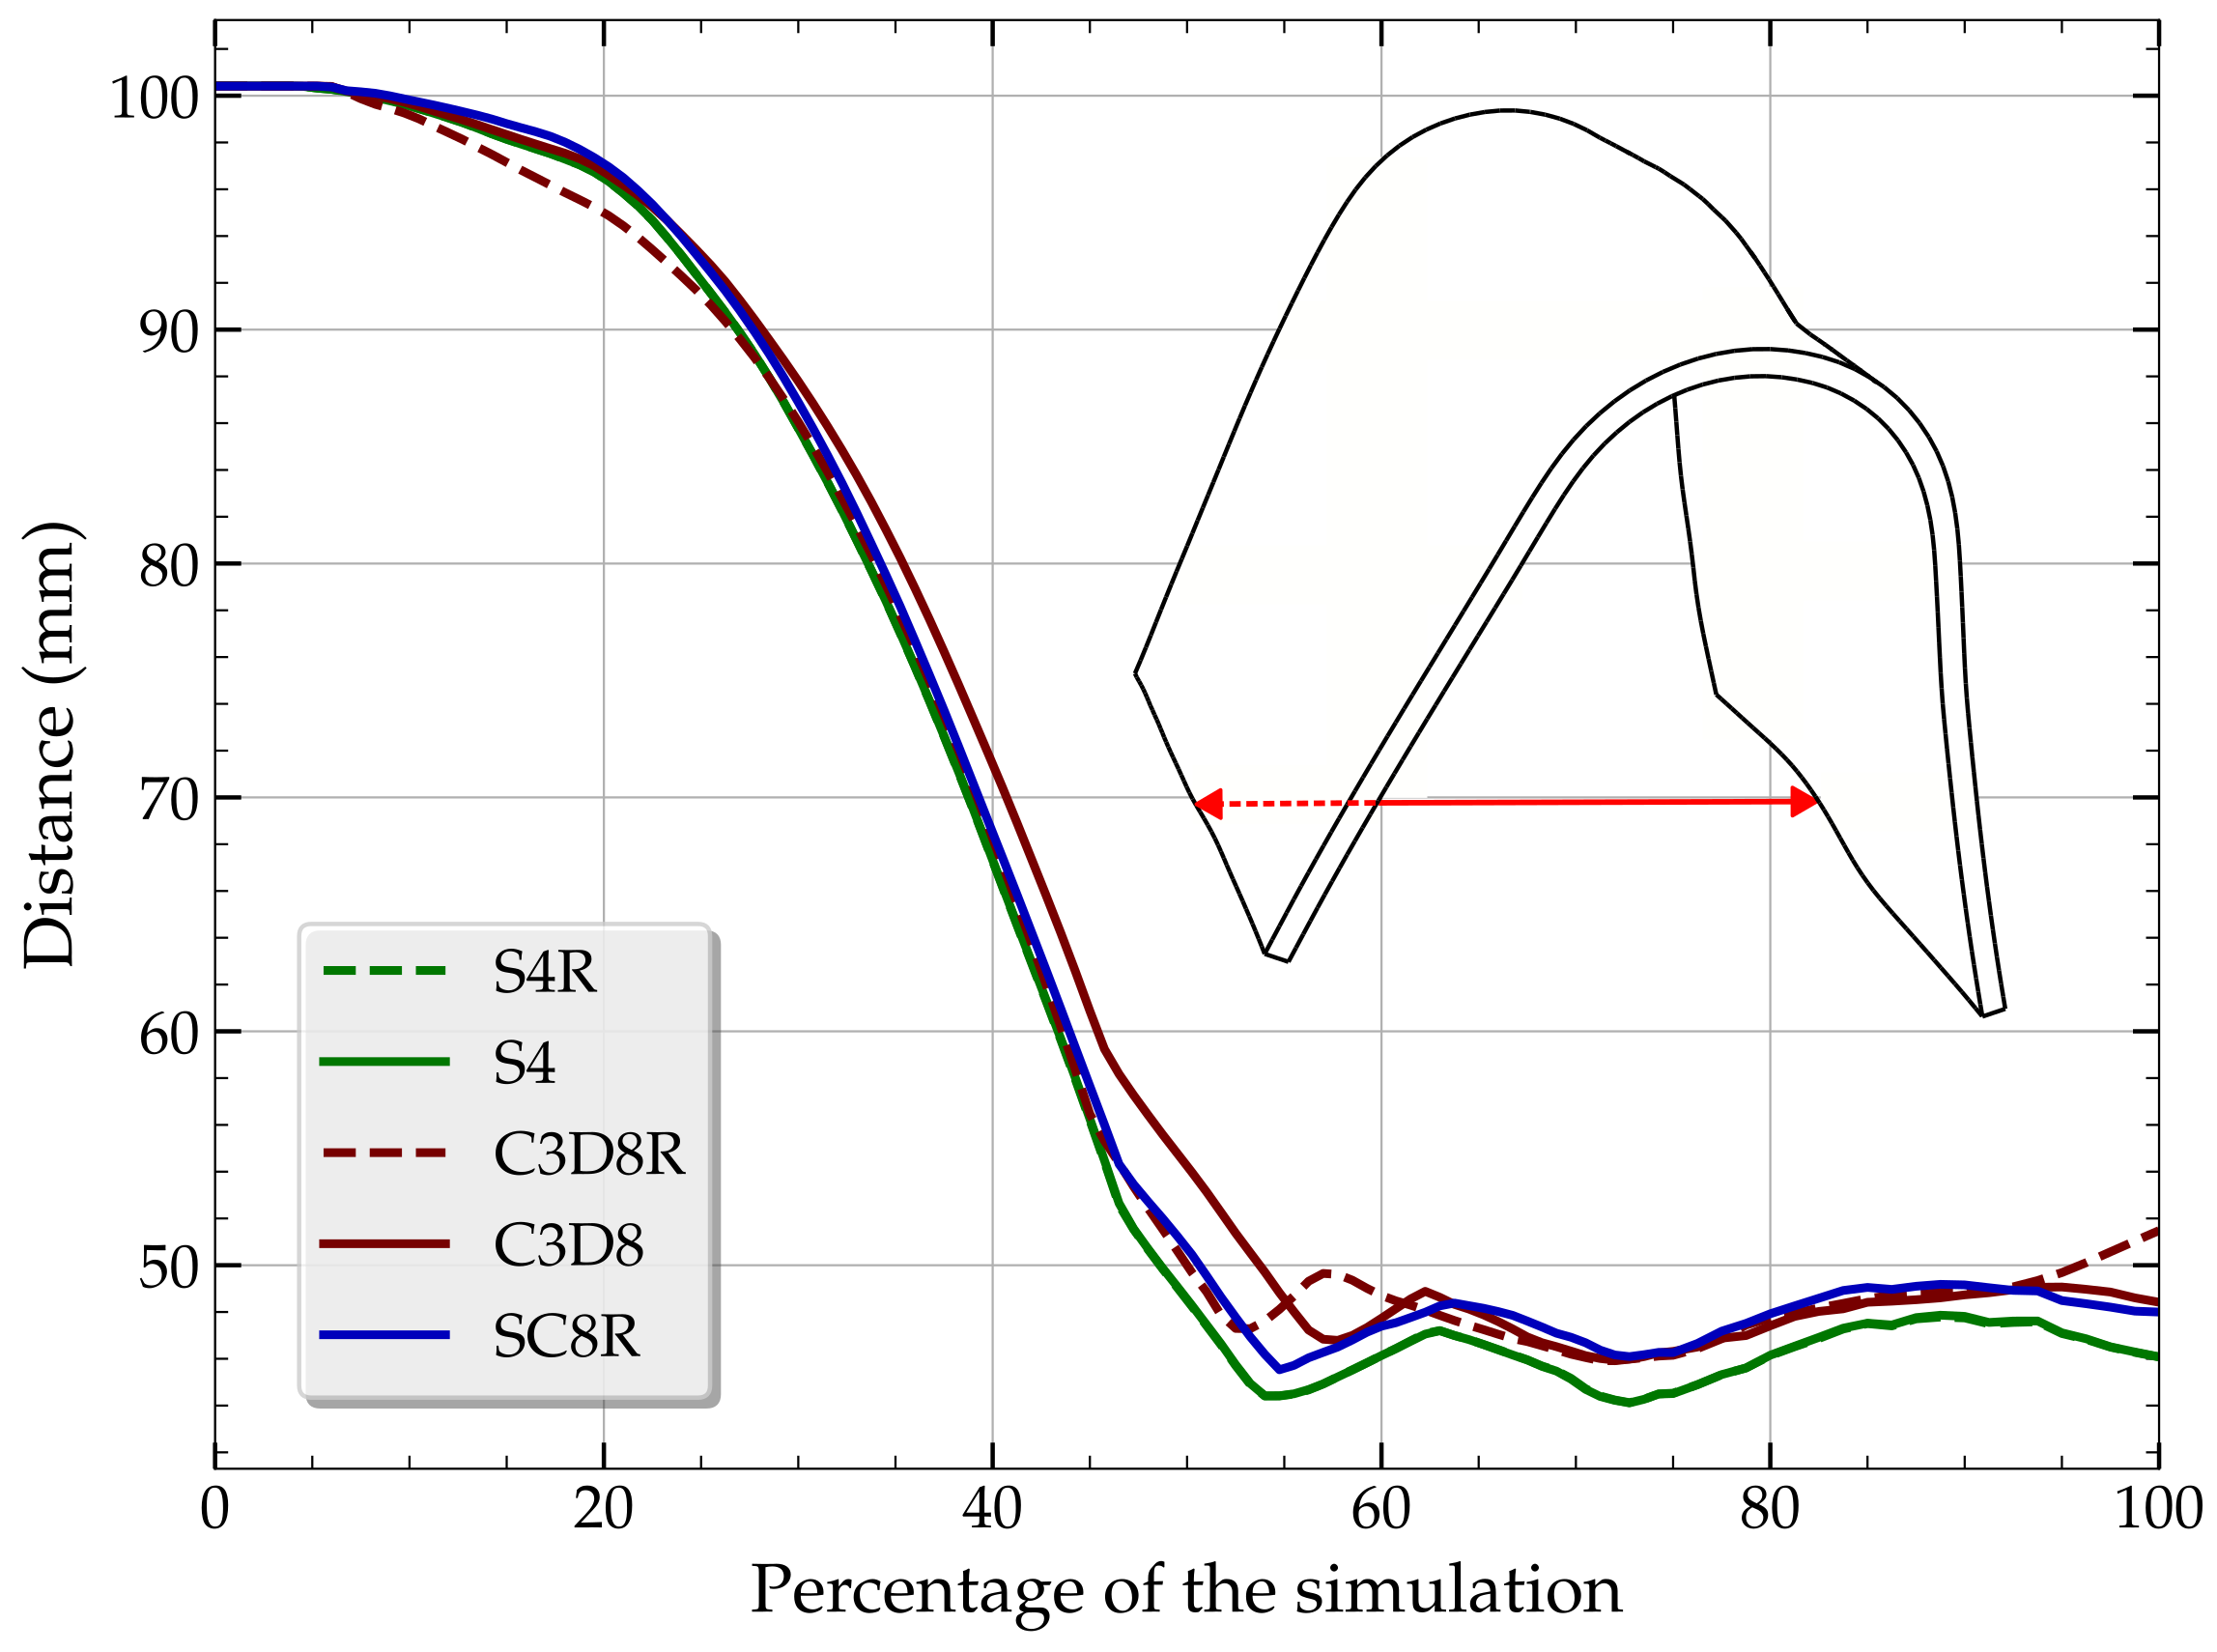
Figure 9 now illustrates the temporal evolution of the distance between the two edges of the blank at the front shoulder of the workpiece.
The initial distance between the two edges is 100 mm, which decreases during the forming operation to reach a value of approximately 45 mm based on the model used. Beyond 75% of the simulation,
Figure 9 then shows the evolution of this distance, reflecting an elastic recovery of the workpiece after forming when the dies are reopened. The different behavior of the C3D8R model compared to the other models indicates an anomaly in the behavior of the numerical simulation. Once again, this model provides results that are not in agreement with the other numerical simulations.
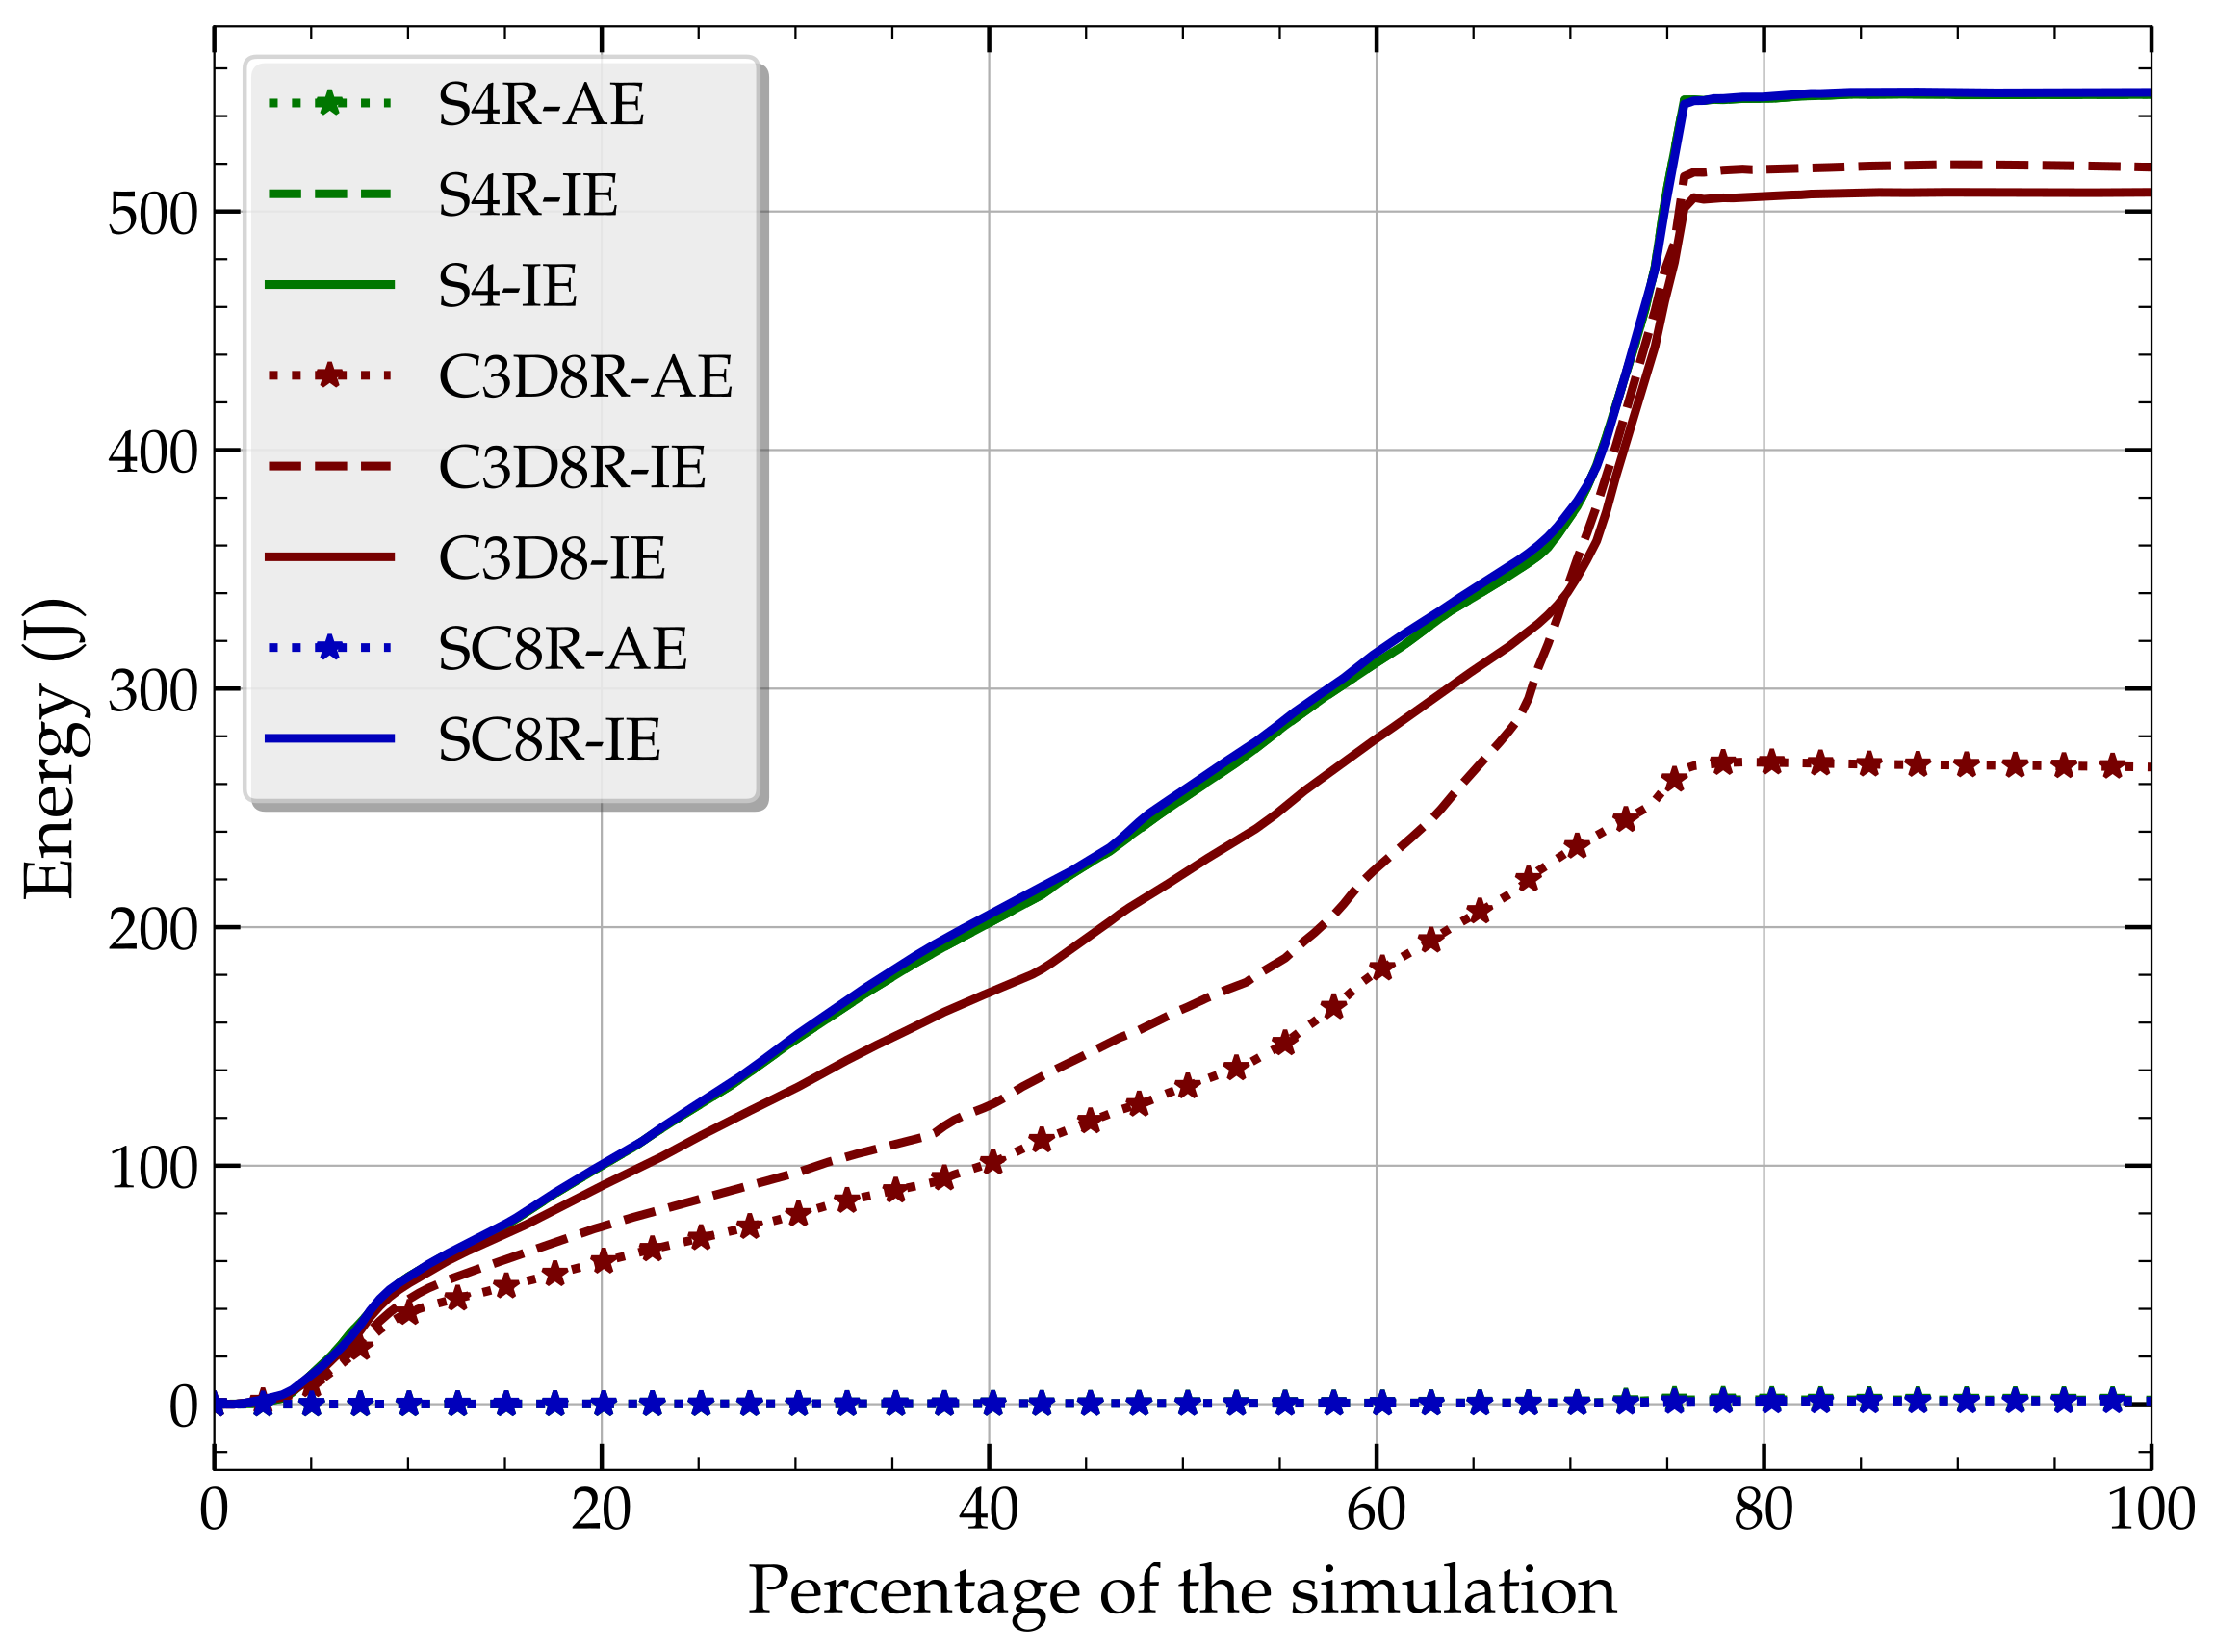
Finally, an explanation for the different behavior of the reduced integration solid model C3D8R compared to other models is illustrated in
Figure 10, which shows the temporal evolution of internal energy (IE) and the artificial strain energy (AE).
The three curves concerning the internal energy of S4R, S4, and SC8R models are superposed, while the ones concerning the two solid models differ. This figure reveals that the artificial strain energy of the C3D8R model accounts for 52% of the inelastic deformation energy at the end of the simulation, whereas the other two reduced integration models accumulate artificial strain energy less than 0.5% of the internal energy (again S4R and SC8R models shows same evolution of the artificial strain energy). This artificial strain energy compensates for the zero-energy deformation modes (hourglass modes) associated with the under-integration of the elements. The evident presence of numerous hourglass modes (12 for a linear 8-node hexahedral element) explains this high value of artificial strain energy. Such a result is undesirable in a numerical simulation, and the value of this artificial strain energy should always remain below 5% for a reliable numerical simulation. Fortunately, for several years now, the full-integration element C3D8 has been implemented in Abaqus, and even though it suffers from certain weaknesses due to a propensity for locking, it is imperative to avoid using the under-integrated element C3D8R, as it brings more disadvantages than advantages due to its erratic behavior regarding hourglassing.
4. Conclusions
This study has presented a comprehensive analysis of different finite element types for simulating the HF process of a complex Ti-6Al-4V aerospace component. The findings underscore the importance of selecting appropriate element formulations to accurately capture the intricate deformation behavior and predict defects during manufacturing processes.
Among the evaluated approaches, the continuum shell element (SC8R) demonstrated superior performance, providing the smoothest representation of thickness variations along critical regions of the formed part. This element’s ability to combine the advantages of shell and solid elements, coupled with an efficient reduced integration scheme, renders it well suited for modeling thick sheet metal forming operations involving large deformations and complex contact conditions.
The classic shell elements (S4R and S4) also yielded satisfactory results, closely aligning with the SC8R predictions and experimental measurements. However, the reduced integration solid element (C3D8R) exhibited erratic behavior, accumulating excessive artificial strain energy due to hourglassing modes, which undermined the reliability of the simulation outcomes.
The findings of this research have significant implications for optimizing HF processes in the aerospace industry, where stringent quality standards and tight dimensional tolerances are paramount. By leveraging accurate simulation tools, manufacturers can minimize trial-and-error approaches, reduce production costs, and enhance the overall efficiency of their operations.
Looking ahead, further research is warranted to investigate the performance of these element formulations under more complex loading scenarios, such as SPF conditions or incremental forming processes. Additionally, incorporating advanced material models that account for microstructural evolution and phase transformations could further enhance the predictive capabilities of these simulations, paving the way for a more comprehensive understanding of the intricate phenomena governing the HF of titanium alloys.
In summary, this study has demonstrated the critical role of finite element formulations in capturing the nuances of HF processes, highlighting the continuum shell element as a promising approach for accurate and efficient simulations in the aerospace manufacturing domain.
Author Contributions
Conceptualization, O.P.; methodology, S.R.R.M. and O.P.; software, S.R.R.M. and O.P.; validation, O.P.; formal analysis, S.R.R.M. and O.P.; investigation, S.R.R.M.; resources, O.D. and O.P.; data curation, S.R.R.M. and O.P.; writing—original draft preparation, O.P.; writing—review and editing, S.R.R.M., O.D. and O.P.; visualization, O.P.; supervision, O.D. and O.P.; project administration, O.D.; funding acquisition, O.D. All authors have read and agreed to the published version of the manuscript.
Funding
Funding received from Agence Nationale de la Recherche (ANR) as a part of the France Relance program under n°21-PRRD-0042-01-01-004.
Institutional Review Board Statement
Not applicable.
Informed Consent Statement
Not applicable.
Data Availability Statement
Data available upon request to the corresponding author.
Acknowledgments
DRARI—Occitanie for approving the project and Yves Marcel from Group Lauak for providing the samples, details of the tools geometry and sharing his vast knowledge on HF and SPF.
Conflicts of Interest
The author declare no conflicts of interest.
Abbreviations
The following abbreviations are used in this manuscript:
| C3D8 | Solid 3D element |
| C3D8R | Solid 3D element with reduced integration |
| FEA | Finite Element Analysis |
| HF | Hot Forming |
| S4 | Classic shell element |
| S4R | Classic shell element with reduced integration |
| SC8R | Continuum Shell element with reduced integration |
| SPF | Superplastic Forming |
References
- Sana, G. Titanium sheet hot forming in the aerospace industry. In Proceedings of the MATEC Web of Conferences, Nantes, France, 10–14 June 2019; Villechaise, P., Appolaire, B., Castany, P., Dehmas, M., Delaunay, C., Delfosse, J., Denquin, A., Gautier, E., Germain, L., Gey, N., et al., Eds.; EDP Sciences: Les Ulis, France, 2020; Volume 321, p. 04020. [Google Scholar] [CrossRef]
- Veeramani, D.; Joshi, P. Methodologies for rapid and effective response to requests for quotation (RFQs). IIE Trans. 1997, 29, 825–838. [Google Scholar] [CrossRef]
- Elhafsi, M.; Rolland, E. Negotiating Price/Delivery Date in a Stochastic Manufacturing Environment. SSRN Electron. J. 2008, 31, 255–270. [Google Scholar] [CrossRef][Green Version]
- Sana, G.; Petiot, A.; Giraudet, A. Hot Forming and Superplastic Forming: Presses Evolution and New Applications in the Aerospace Industry. In Proceedings of the Superplasticity in Advanced Materials—ICSAM, Tokyo, Japan, 7–11 September 2015; Trans Tech Publications Ltd.: Zurich, Switzerland, 2016; Volume 838, pp. 563–567. [Google Scholar] [CrossRef]
- Marcel, Y. Integration of HF and SPF technology in an efficient industrial production flow for high rates aeronautical parts. Mater. Res. Proc. 2023, 32, 119–126. [Google Scholar] [CrossRef]
- Nawaya, T.; von Hehl, A.; Wagner, S.; Beck, W. Hot Deep Drawing Processing of Titanium Sheet Metal Parts for High Temperature Applications. Adv. Eng. Mater. 2018, 21, 1800544. [Google Scholar] [CrossRef]
- Tekin, M.; Ertan, R.; Özgül, H.G. Forming evolution of titanium grade2 sheets. Mater. Test. 2022, 64, 116–124. [Google Scholar] [CrossRef]
- Li, Z.Q.; Zhu, H.L. Industrial Applications of Superplastic Forming Technology in China. Mater. Sci. Forum 2001, 357–359, 53–58. [Google Scholar] [CrossRef]
- Nick, A.; Zettler, J.; Hirt, G. Optimization of Superplastic Forming Processes for High Volume Production in Aeronautics. Key Eng. Mater. 2013, 549, 189–196. [Google Scholar] [CrossRef]
- Akula, S.P.; Ojha, M.; Rao, K.L.; Gupta, A.K. A review on superplastic forming of Ti-6Al-4V and other titanium alloys. Mater. Today Commun. 2023, 34, 105343. [Google Scholar] [CrossRef]
- Löbbe, C.; Hering, O.; Hiegemann, L.; Tekkaya, A. Setting Mechanical Properties of High Strength Steels for Rapid Hot Forming Processes. Materials 2016, 9, 229. [Google Scholar] [CrossRef]
- Löbbe, C.; Tekkaya, A.E. Mechanisms for controlling springback and strength in heat-assisted sheet forming. CIRP Ann. 2018, 67, 273–276. [Google Scholar] [CrossRef]
- Bylya, O.I.; Vasin, R.; Blackwell, P.L. The Mechanics of Superplastic Forming - How to Incorporate and Model Superplastic and Superplastic-Like Conditions. In Materials Science Forum; Trans Tech Publications Ltd.: Zurich, Switzerland, 2016; Volume 838–839, pp. 468–475. [Google Scholar] [CrossRef]
- Seshacharyulu, T.; Medeiros, S.; Frazier, W.; Prasad, Y. Hot working of commercial Ti-6Al-4V with an equiaxed α-β microstructure: Materials modeling considerations. Mater. Sci. Eng. A 2000, 284, 184–194. [Google Scholar] [CrossRef]
- Fu, K.; Peng, H.; Zheng, K.; Yuan, S. Phenomenological model of hardening and flow for Ti-6Al-4 V titanium alloy sheets under hot forming conditions. Int. J. Adv. Manuf. Technol. 2022, 125, 91–103. [Google Scholar] [CrossRef]
- Fan, R.; Wu, Y.; Chen, M.; Wu, D.; Wu, T. Determining the hot forming limits of titanium alloy sheet under different strain paths by constant equivalent strain rate hot gas bulging tests. J. Mater. Process. Technol. 2023, 319, 118067. [Google Scholar] [CrossRef]
- Dassault Systèmes. Abaqus Reference Manual; Dassault Systèmes: Vélizy-Villacoublay, France, 2024. [Google Scholar]
- Podgornik, B.; Kosec, T.; Kocijan, A.; Donik, Č. Tribological behaviour and lubrication performance of hexagonal boron nitride (h-BN) as a replacement for graphite in aluminium forming. Tribol. Int. 2015, 81, 267–275. [Google Scholar] [CrossRef]
- Puppa, J.; Behrens, B.A. Optimization of Cooling and Lubrication for Nitrided and Ceramic-Coated Hot Forging Dies. Appl. Mech. Mater. 2015, 794, 97–104. [Google Scholar] [CrossRef]
- Dutton, T.; Weinschenk, A. Optimising Run Times for Sheet Metal Forming Simulation. In Proceedings of the 16th International LS-DYNA Users Conference, Virtual Event, 10–11 June 2020. [Google Scholar]
| Disclaimer/Publisher’s Note: The statements, opinions and data contained in all publications are solely those of the individual author(s) and contributor(s) and not of MDPI and/or the editor(s). MDPI and/or the editor(s) disclaim responsibility for any injury to people or property resulting from any ideas, methods, instructions or products referred to in the content. |
© 2024 by the authors. Licensee MDPI, Basel, Switzerland. This article is an open access article distributed under the terms and conditions of the Creative Commons Attribution (CC BY) license (https://creativecommons.org/licenses/by/4.0/).


