Automatic Reconstruction of 3D Models from 2D Drawings: A State-of-the-Art Review
Abstract
1. Introduction
2. Related Work
3. Three-Dimensional Reconstruction
3.1. Input Documentation
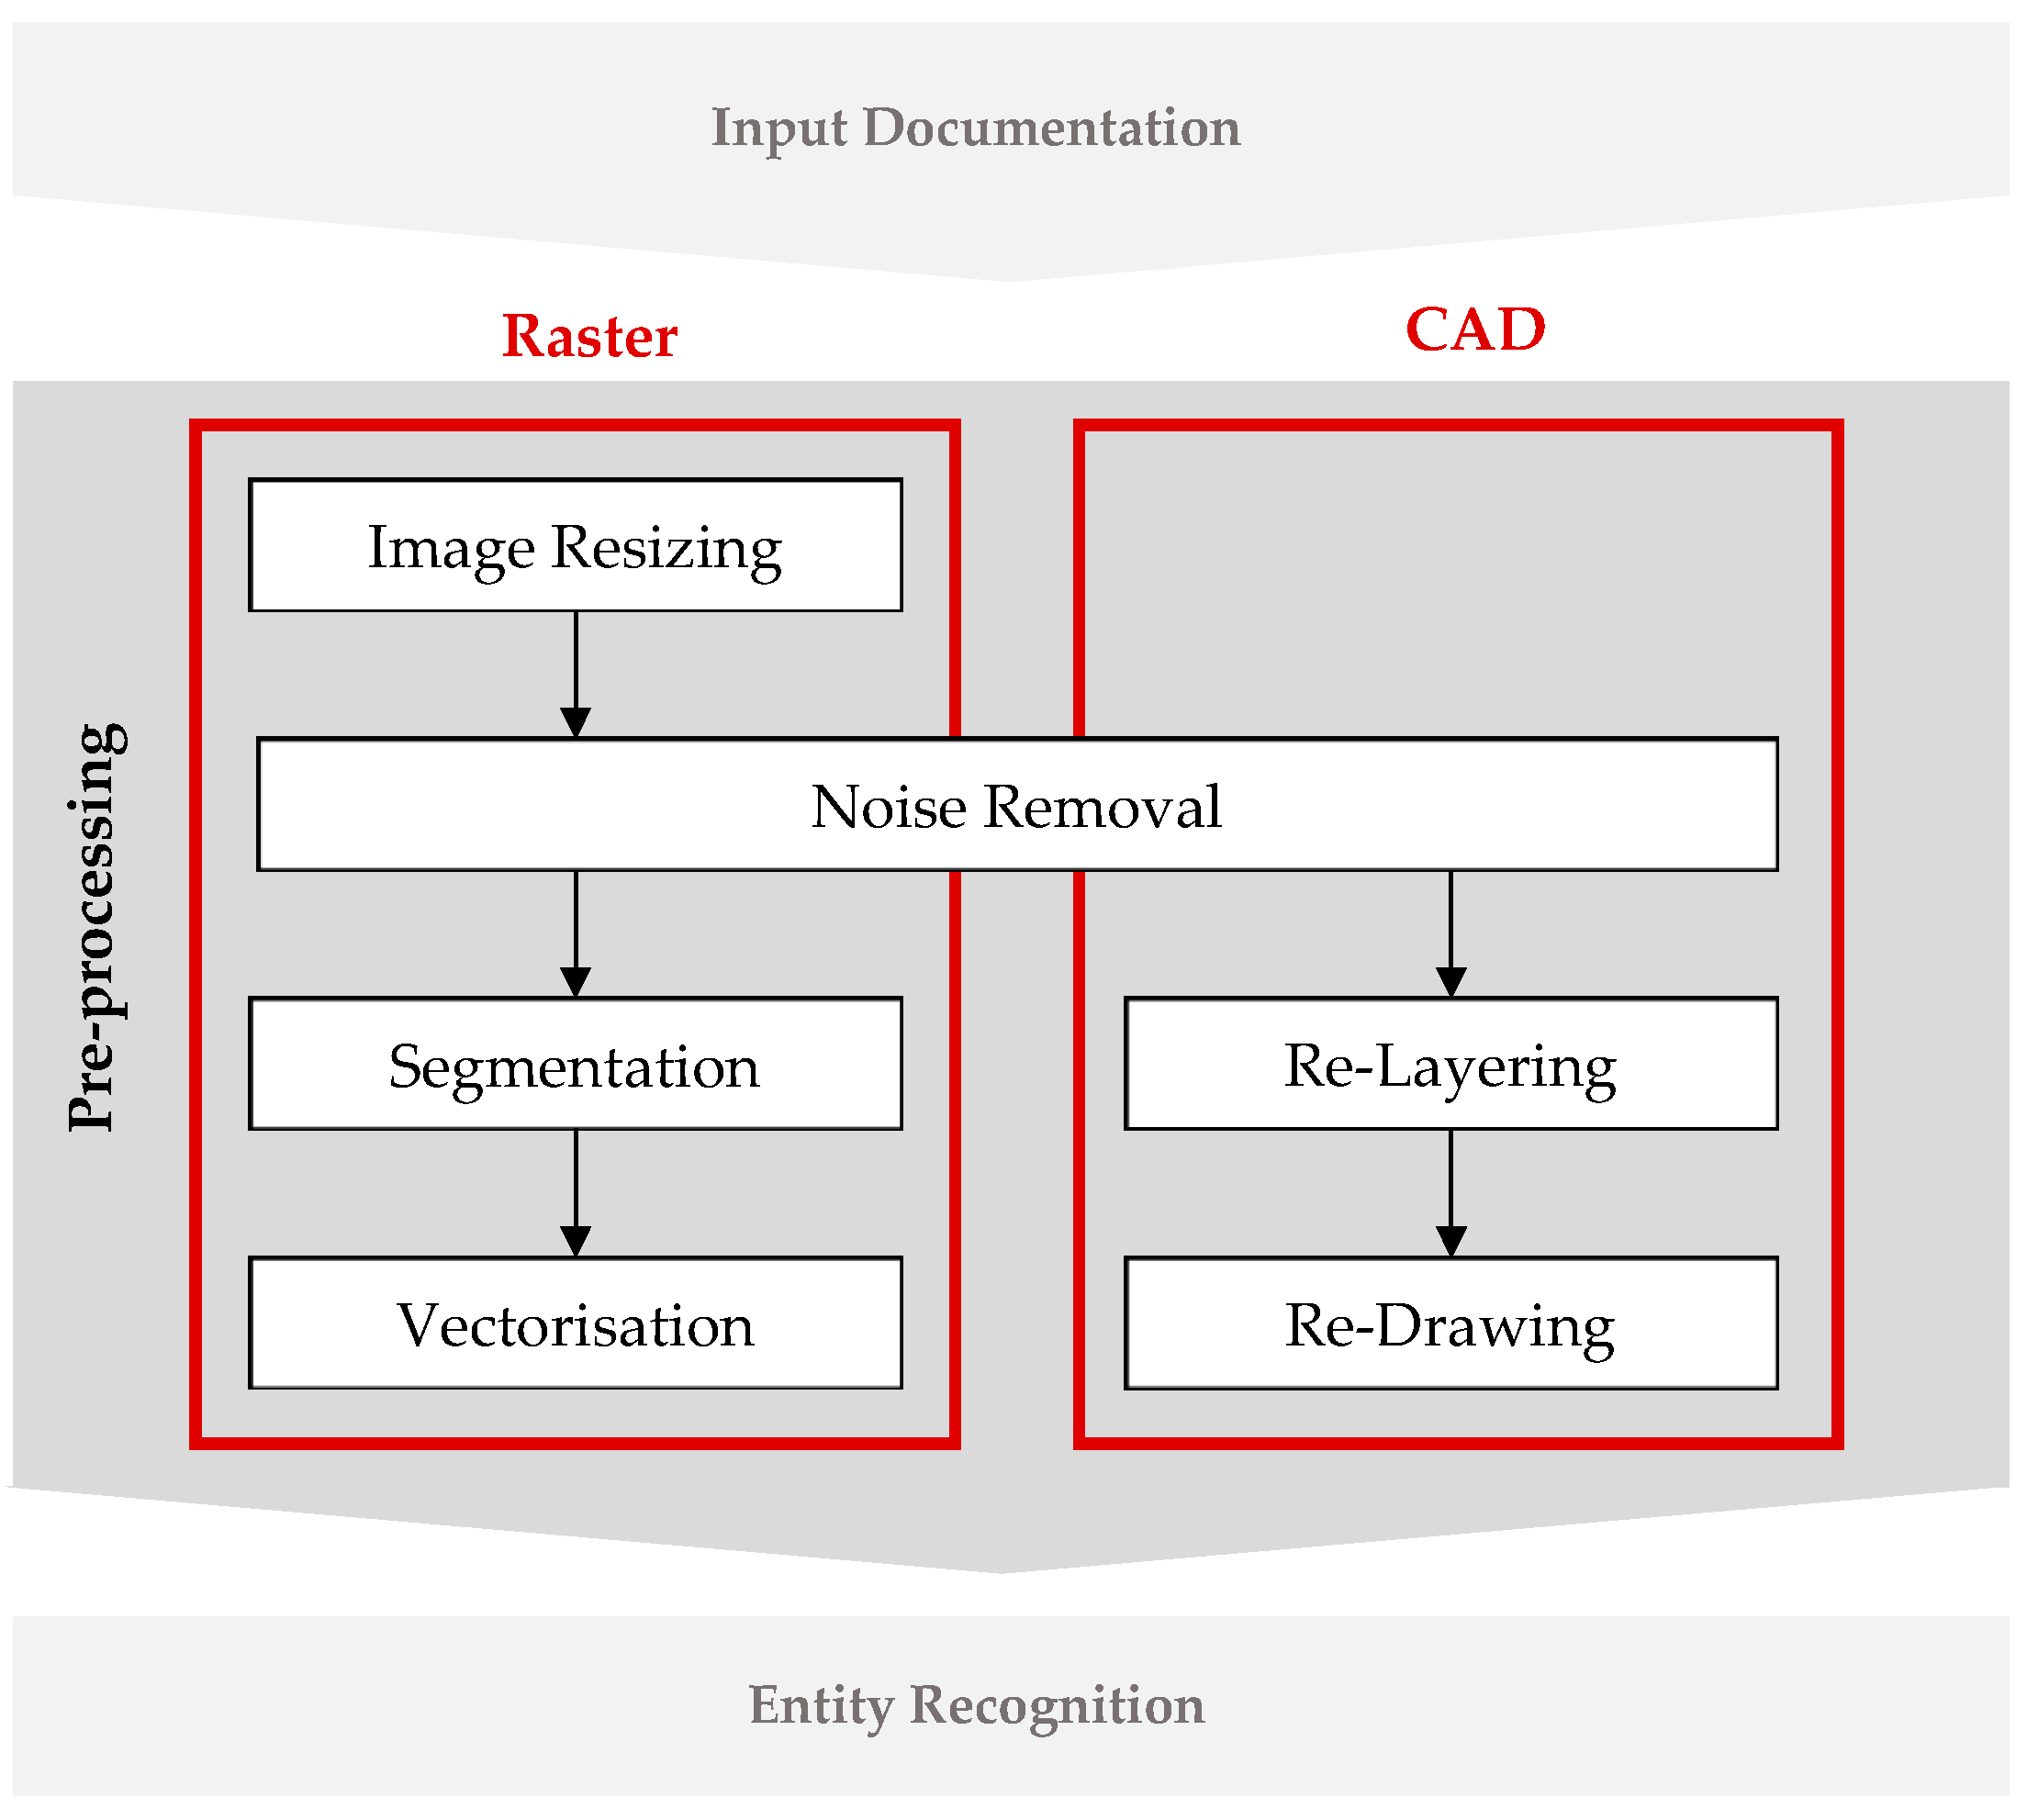
3.2. Pre-Processing
3.2.1. Raster Drawings
- Image Resizing: Image resizing consists of reducing the size of the input image to reduce the amount of pixel information that needs to be processed when dealing with large input drawings. Image resizing techniques include downsampling and tiling/merging. Downsampling involves downscaling the size of an image to reduce dimensionality and the amount of information present in the image. For example, in Riedinger et al. [15], the input image is downscaled by sampling it on a grid of pixels and keeping the darkest pixel of the sample. There are different implementations of downscaling [15,16,22]; however, these methods inherently result in some form of information loss. As an alternative, tiling/merging preserves all the original information, partitioning the input image into tiles, processing and analysing each tile individually and merging them back together after processing. In [23], Dosch et al. use tiling and merging to reduce image size and reduce memory strain on the computation workstation. This approach allows them to reduce processing time while maintaining a reportedly low error rate.
- Noise Removal: Noise removal consists of reducing the amount of information from a scanned image while leaving only the relevant information for processing. Common sources of noise in scanned drawings include paper smudges, folding and printing and scanning noise. Removing or reducing this noise involves a series of image processing techniques such as binarisation, dilation and erosion. Binarisation, a popular method in scanned drawings [14,15,22,24,25], converts the input image into black-and-white pixels, eliminating unnecessary colour information and enhancing the contrast between black elements and white space. Horaud [26] and Ghorbel [27] differentiate between three binarisation types: global binarisation, i.e., applying a single threshold to the entire image; local binarisation, i.e., determining thresholds based on local pixel data; and dynamic binarisation, i.e., calculating thresholds per pixel based on neighbouring grey levels. Following binarisation, morphological operations like dilation and erosion refine the image further. For instance, Shinde et al. [28] utilise dilation to remove fine details and pixel noise, whereas Zhao et al. [25] use erosion to amplify black pixel areas, highlighting potentially important features. Opening and closing, combinations of dilation and erosion, are commonly employed to address salt-and-pepper noise [24]. Additionally, the Non-Local Means algorithm is widely adopted for noise removal [15]. This algorithm averages pixel values in similar neighbourhoods, obtaining the median value of the greyscale image and forming the binarised version by comparing pixel values against predefined thresholds.
- Text and Graphics Segmentation: As opposed to discarding texts in a scanned drawing as noise, some researchers [14,22,23,24,29] choose to retain texts by separating pixels corresponding to textual information from pixels corresponding to graphical information into two different images—the text image and graphics image. In this way, textual information is preserved and can be used to introduce semantic information to the geometric information extracted from the graphics image. This segmentation is performed because information that is not required for a specific recognition process will just be noise and potentially lead to incorrect results. A popular algorithm for this process is the Hough transform-based approach by Fletcher and Kasturi [30]. Used in [22,23], the Hough transform-based algorithm is a technique used in computer vision for detecting shapes. In this context, it can be employed to identify lines representing architectural elements in floor plans. Furthermore, many authors [14,24,29] used the QGAR library. The now-discontinued QGAR project [31] introduced an open software environment, providing a common platform for applications and third-party contributions. Central to QGAR is the QGAR library which offered an extraction mechanism for sets of characters in images [24]. The methodology revolved around identifying geometry primitives that play a crucial role in depicting architectural components like walls and openings as sets of points, such as segments or arcs [14]. However, in this method, there is an underlying assumption that these primitives adequately capture the essential architectural elements targeted by the project [14]. Once graphics and texts have been separated, the graphics image can optionally be further divided into two other images, containing thick and thin lines, respectively, to separate walls (thick lines) from other symbols, such as doors and windows (thin lines). This can be achieved with further morphological filtering [22,23].
- Vectorisation: Vectorisation is the process of converting a raster image, consisting of pixels, into a vector image consisting of lines, arcs and other geometric shapes. Vectorisation methods can be categorised into transform-based methods [14,17,29,32], thinning-based methods [15,23,24], contour-based methods [22,33], sparse-pixel-based methods [34,35], run-graph-based methods [36,37], mesh-pattern-based methods [38] and, more recently, neural-network-based methods [39,40,41,42]. Each of these categories, except for neural-network-based methods, is thoroughly reviewed and compared by Wenyin and Dori [43]. They conclude that vectorisation methods should be chosen according to the needs of the system. Good vectorisation methods should preserve shape in formation, including line width, line geometry and intersection junction, and should be fast to be practical.
3.2.2. CAD Drawings
- Noise Removal: In the context of CAD drawings, this stage involves simplifying the drawings to enhance recognition accuracy, akin to the process used for scanned drawings. CAD drawings may contain vector elements, such as dimensions, grid lines, hatches or drawing borders, that are unnecessary for and can hinder the recognition of other geometric entities. Additionally, problematic or redundant geometry, such as segments with zero length or duplicate lines, needs to be addressed. In the literature, this step is mostly executed manually, with a designer manually deleting unneeded elements. Exceptions include Domínguez, García and Feito’s iterative checker [44], which automatically loops over geometric primitives, removing duplicate segments and segments with zero length and replacing partially overlapping segments with unique segments, until no more problematic geometry is found.
- Re-Layering: CAD drawings use layers to group geometric primitives representing building elements of the same type and, in this way, map semantic information to those primitives. This is one of the easiest ways to classify information in CAD drawings and, in some cases [45,46], almost entirely dismisses the need for the recognition process altogether. Unfortunately, there is no universal standard way to organise information in layers in CAD drawing, and each designer can have their own system of layer organisation. Moreover, during project development, some geometric primitives may be mistakenly placed in the wrong layers, further complicating this process. Thus, a common approach to re-layering in CAD drawings often involves the manual re-layering of geometric entities into component-specific layers, e.g., categorised by element types, such as walls, doors and windows [7,44,45,46], according to the semantic information that designers wish to assign to those primitives.
- Re-drawing: Sometimes, as-designed drawings may contain drawing errors or too much information that complicates the recognition process. Thus, some researchers opt to re-draw parts of the drawing to simplify or fix problematic geometry before recognition. This process can include the reduction in the level of details of specific objects, such as doors and windows [7], grouping geometric primitives corresponding to the same building component into single entities, such as blocks [44,45], the contour outlining of difficult-to-detect building elements, such as floors, ceilings and walls [45,46], and primitive uniformisation—some researchers prefer to group lines into polylines [46], while others prefer to separate polylines into singular lines [47,48,49]. Unlike raster drawings, problematic geometry in CAD can be readily identified and excluded from the recognition process. While predominantly manual, some researchers use error detection mechanisms [50], while others have developed algorithms to automatically address minor geometry issues, such as Lewis and Sequin’s coerce-to-grid algorithm [7] for fixing gaps between lines and overlapping line edges or Xi et al.’s rule-based merging of overlapped lines and arcs [47].
3.3. Entity Recognition
- Layer-based approaches: Entity recognition in CAD drawings typically falls under this category [7,44,45,46,51]. In layer-based approaches, geometry recognition is simplified using layers, which semantically identify geometric primitives belonging to building elements of the same type. In some cases, combined with prior re-drawing, wall polylines in the wall layer can be extruded, and symbol blocks’ information in the door and window layers can be read, requiring no further recognition [45,46]. This results in more manual pre-processing and less automated recognition. In other cases, authors seek to combine the information extracted from layers with other recognition methods to develop more automated alternatives to identify building elements from disjointed lines. For example, Dominguez et al. [44] combine a rule-based wall-prone pair strategy with a Wall Adjacency graph data structure to keep track of the hierarchical and topological relations between line segments in the wall layers and find pairs of lines that constitute a wall. By combining these methods, different types of information can be extracted and combined to achieve a more complete 3D model.
- Rule-based approaches: Rule-based approaches, or template-matching approaches, seek to recognise geometric entities or symbols by describing them through the geometric and topological rules that define them and comparing them to predefined rules or templates. These methods are predominantly used in symbol recognition, where drawing symbols, such as doors and windows [16,24,52], dimensions [53] or other mechanical, electrical and plumbing (MEP) symbols [47], are compared to databases of symbol templates to find a match based on similarity. These databases can be dynamically adapted as new symbols are discovered [19]. Rule-based methods can also be used for the recognition of structural elements such as walls. These can generally be divided into wall-driven methods and room-driven methods. Wall-driven methods focus on finding the parallel pair lines representing a wall [19,29,44,46]. Room-driven methods focus on finding closed room contours by its boundary walls [7]. Horna et al. [50] formalise some of these rules by proposing a set of consistency constraints to define the geometry, topology and semantics of architectural indoor environments and automatically reconstruct 3D buildings.
- Graph-based approaches: Graph-based approaches seek to represent building elements as a network of connected nodes. They focus not only on the identification of building elements but also on the geometric and topological relationships between them. A graph-based approach is the most topological-centric approach of them all. For example, in [7], Lewis et al. use a spatial adjacency graph to map the relationships between rooms and discover the location of doors and spaces in the floor plan. Dominguez et al. [44] develop a Wall Adjacency graph, where nodes represent the line segments from a floor plan, and edges represent relations between those segments. This allows them to identify walls from the topological relationships between their composing line segments. Gimenez et al. [14] develop a topological wall graph, where each node represents a relationship between two walls, to aid in the contour-finding of each room. Xi et al. [47] develop a global relationship graph for finding beams by mapping the relationship between beams and their load-bearing columns.
- Grid-based approaches: Typically used in engineering drawings, this method uses grid lines to locate and identify structural entities in floor plans. It assumes columns are located around the intersection points between grid lines and that beams extend as parallel lines between columns. Lu et al. [48] pioneer this method with their Self-Incremental Axis-Net-based Hierarchical Recognition model, which progressively simplifies the drawing by removing objects that have already been recognised [54]. This offers an alternative recognition method for CAD drawings, not reliant on layers. Y. Byun and B.-S. Sohn [20] developed an automatic BIM model generation system that relied on the grid lines of structural CAD drawings and a list of information containing cross-sectional shape data of structural elements (including, columns, beams, slabs and walls) to automatically create an Industry Foundation Classes (IFC) file containing structural elements. In a similar study, Q. Lu et al. [20] created a semi-automatic system to generate geometric digital twins from CAD drawings. Their method used optical character recognition technology to extract symbology from CAD drawings to create grids and blocks to define the location of each structural component.
- Learning-based approaches: Learning-based approaches have been gaining popularity in the field of entity recognition in scanned drawings and consist of the use of deep learning for training a network to identify building components in technical drawings. Different types of networks have been used throughout the literature, including Graph Neural Networks (GNN) [18,39], Generative Adversarial Networks (GAN) [39,55], Convolutional Neural Networks (CNN) [56,57,58], Global Convolutional Networks (GCN) [59], Fully Convolutional Networks (FCN) [60], Faster Region-based Convolutional Neural Networks (Faster R-CNN) [25], Cascade Mask R-CNN [61,62] and ResNet-50 [63,64,65]. These networks rely on datasets containing large quantities of floor plans to train the network to produce reliable results. Floorplan datasets include the Rent3D dataset [66], a database of floor plans and photos collected from a rental website; the CubiCasa5K dataset [67], a vectorisation database containing geometrically and semantically annotated floor plans in SVG vector graphics format; the CVC-FP dataset [68], a floor plan database annotated with architectural objects’ labels and their structural relation; and the SESYD dataset [69], a synthetic database for the performance evaluation of symbol recognition and spotting systems, among others. Other learning-based approaches include the use of clustering techniques to group geometric primitives representing building components of the same type [52].
3.4. Three-Dimensional Modelling
4. Discussion
4.1. Type of Input Data
4.2. Type of Information Extracted
4.3. Scanned Drawings vs. CAD Drawings
4.4. Geometric Coverage
4.5. Two-Dimensional vs. Scan-to-BIM vs. Photogrammetry
4.6. Comparison of Entity Recognition Approaches
4.7. Limitations and Future Research Paths
5. Conclusions
Author Contributions
Funding
Institutional Review Board Statement
Informed Consent Statement
Data Availability Statement
Conflicts of Interest
References
- Gimenez, L.; Hippolyte, J.-L.; Robert, S.; Suard, F.; Zreik, K. Review: Reconstruction of 3D Building Information Models from 2D scanned plans. J. Build. Eng. 2015, 2, 24–35. [Google Scholar] [CrossRef]
- Tang, P.; Huber, D.; Akinci, B.; Lipman, R.; Lytle, A. Automatic reconstruction of as-built building information models from laser-scanned point clouds: A review of related techniques. Autom. Constr. 2010, 19, 829–843. [Google Scholar] [CrossRef]
- Fathi, H.; Dai, F.; Lourakis, M. Automated as-built 3D reconstruction of civil infrastructure using computer vision: Achievements, opportunities, and challenges. Adv. Eng. Inform. 2015, 29, 149–161. [Google Scholar] [CrossRef]
- Patraucean, V.; Armeni, I.; Nahangi, M.; Yeung, J.; Brilakis, I. Haas, State of research in automatic as-built modelling. Adv. Eng. Inform. 2015, 29, 162–171. [Google Scholar] [CrossRef]
- Son, H.; Bosché, F.; Kim, C. As-built data acquisition and its use in production monitoring and automated layout of civil infrastructure: A survey. Adv. Eng. Inform. 2015, 29, 172–183. [Google Scholar] [CrossRef]
- Ma, Z.; Liu, S. A review of 3D reconstruction techniques in civil engineering and their applications. Adv. Eng. Inform. 2018, 37, 163–174. [Google Scholar] [CrossRef]
- Lewis, R.; Séquin, C. Generation of 3D building models from 2D architectural plans. Comput. Des. 1998, 30, 765–779. [Google Scholar] [CrossRef]
- Che, E.; Jung, J.; Olsen, M.J. Object recognition, segmentation, and classification of mobile laser scanning point clouds: A state of the art review. Sensors 2019, 19, 810. [Google Scholar] [CrossRef] [PubMed]
- Lu, Q.; Lee, S. Image-based technologies for constructing as-is building information models for existing buildings. J. Comput. Civ. Eng. 2017, 31, 04017005. [Google Scholar] [CrossRef]
- Czerniawski, T.; Leite, F. Automated digital modeling of existing build ings: A review of visual object recognition methods. Autom. Constr. 2020, 113, 103131. [Google Scholar] [CrossRef]
- Brenner, C. Building Reconstruction from Images and Laser scanning. Int. J. Appl. Earth Obs. Geoinf. 2005, 6, 187–198. [Google Scholar] [CrossRef]
- Musialski, P.; Wonka, P.; Aliaga, D.G.; Wimmer, M.; van Gool, L.; Purgathofer, W. A Survey of Urban Reconstruction. Comput. Graph. Forum 2013, 32, 146–177. [Google Scholar] [CrossRef]
- Yin, X.; Wonka, P.; Razdan, A. Generating 3D Building Models from Architectural Drawings: A Survey. IEEE Comput. Graph. Appl. 2008, 29, 20–30. [Google Scholar] [CrossRef]
- Gimenez, L.; Robert, S.; Suard, F.; Zreik, K. Automatic reconstruction of 3D building models from scanned 2D floor plans. Autom. Constr. 2016, 63, 48–56. [Google Scholar] [CrossRef]
- Riedinger, C.; Jordan, M.; Tabia, H. 3D models over the centuries: From old floor plans to 3D representation. In Proceedings of the 2014 International Conference on 3D Imaging (IC3D), Liege, Belgium, 9–10 December 2014; pp. 1–8. [Google Scholar]
- Santos, D.; Dionísio, M.; Rodrigues, N.; Pereira, A.M.d.J. Efficient creation of 3D models from buildings’ floor plans. Int. J. Interact. Worlds 2011, 2011, 1–30. [Google Scholar] [CrossRef]
- Lu, Q.; Chen, L.; Li, S.; Pitt, M. Semi-automatic geometric digital twinning for existing buildings based on images and CAD drawings. Autom. Constr. 2020, 115, 103183. [Google Scholar] [CrossRef]
- Vidanapathirana, M.; Wu, Q.; Furukawa, Y.; Chang, A.X.; Savva, M. Plan2scene: Converting floorplans to 3d scenes. In Proceedings of the 2021 IEEE/CVF Conference on Computer Vision and Pattern Recognition, Nashville, TN, USA, 20–25 June 2021; pp. 10733–10742. [Google Scholar]
- Lu, T.; Yang, H.; Yang, R.; Cai, S. Automatic analysis and integration of architectural drawings. Int. J. Doc. Anal. Recognit. 2007, 9, 31–47. [Google Scholar] [CrossRef]
- Byun, Y.; Sohn, B.-S. ABGS: A system for the automatic generation of building information models from two-dimensional CAD drawings. Sustainability 2020, 12, 6713. [Google Scholar] [CrossRef]
- D’Antoni, F.A. Workflow for the 3D Reconstruction of a Late Antique Villa: The Case Study of the Villa Dei Vetti. In Proceedings 2024, Proceedings of Una Quantum 2022: Open Source Technologies for Cultural Heritage. Cult. Act. Tour. 2024, 96, 6. [Google Scholar] [CrossRef]
- Ahmed, S.; Liwicki, M.; Weber, M.; Dengel, A. Improved automatic analysis of architectural floor plans. In Proceedings of the 2011 International Conference on Document Analysis and Recognition, Beijing, China, 18–21 September 2021; pp. 864–869. [Google Scholar]
- Dosch, P.; Tombre, K.; Ah-Soon, C.; Masini, G. A complete system for the analysis of architectural drawings. Int. J. Doc. Anal. Recognit. 2000, 3, 102–116. [Google Scholar] [CrossRef]
- Or, S.-H.; Wong, K.-H.; Yu, Y.-K.; Chang, M.M.-Y.; Kong, H. Highly automatic approach to architectural floorplan image understanding & model generation. Pattern Recognit. 2005, 25–32. [Google Scholar]
- Zhao, Y.; Deng, X.; Lai, H. Reconstructing BIM from 2D structural drawings for existing buildings. Autom. Constr. 2021, 128, 103750. [Google Scholar] [CrossRef]
- Horaud, R.; Monga, O. Vision par Ordinateur: Outils Fondamentaux; Traité des Nouvelles Technologies; Hermes Science Publications: Paris, France, 1995; p. 426. [Google Scholar]
- Ghorbel, A. Interprétation Interactive de Documents Structurés: Application `a la Rétroconversion de Plans d’Architecture Manuscrits. Ph.D. Thesis, Université Européenne de Bretagne, Rennes, France, 2012. [Google Scholar]
- Shinde, P.; Turate, A.; Mehta, K.; Nagpure, R. 2D to 3D dynamic modeling of architectural plans in augmented reality. Int. Res. J. Eng. Technol. 2022, 9, 2384–2386. [Google Scholar]
- Macé, S.; Locteau, H.; Valveny, E.; Tabbone, S. A system to detect rooms in architectural floor plan images. In Proceedings of the 9th IAPR International Workshop on Document Analysis Systems, Boston, MA, USA, 9–11 June 2010; pp. 167–174. [Google Scholar]
- Fletcher, L.A.; Kasturi, R. A robust algorithm for text string separation from mixed text/graphics images. IEEE Trans. Pattern Anal. Mach. Intell. 1988, 10, 910–918. [Google Scholar] [CrossRef]
- Rendek, J.; Masini, G.; Dosch, P.; Tombre, K. The Search for Genericity in Graphics Recognition Applications: Design Issues of the Qgar Software System. In Document Analysis Systems VI. DAS 2004; Lecture Notes in Computer Science, vol 3163; Marinai, S., Dengel, A.R., Eds.; Springer: Berlin/Heidelberg, Germany, 2004. [Google Scholar] [CrossRef]
- Llado, J.; López-Krahe, J.; Martí, E. A system to understand hand drawn floor plans using subgraph isomorphism and though transform. Mach. Vis. Appl. 1997, 10, 150–158. [Google Scholar]
- Hori, O.; Tanigawa, S. Raster-to-vector conversion by line fitting based on contours and skeletons. In Proceedings of the 2nd International Conference on Document Analysis and Recognition (ICDAR’93), Tsukuba City, Japan, 20–22 October 1993; pp. 353–358. [Google Scholar]
- Chiang, J.Y.; Tue, S.; Leu, Y. A new algorithm for line image vectorization. Pattern Recognit. 1998, 31, 1541–1549. [Google Scholar] [CrossRef]
- Dori, D.; Liu, W. Sparse pixel vectorization: An algorithm and its performance evaluation. IEEE Trans. Pattern Anal. Mach. Intell. 1999, 21, 202–215. [Google Scholar] [CrossRef]
- Tan, J.; Peng, Q. A global line recognition approach to scanned image of engineering drawings based on graphics constraint. Chin. J. Comput. 1994, 17, 561–569. [Google Scholar]
- Park, S.; Kim, H. 3DPlanNet: Generating 3D models from 2D floor plan images using ensemble methods. Electronics 2021, 10, 2729. [Google Scholar] [CrossRef]
- Lin, X.; Shimotsuji, S.; Minoh, M.; Sakai, T. Efficient diagram understanding with characteristic pattern detection. Comput. Vision Graph. Image Process. 1985, 30, 84–106. [Google Scholar] [CrossRef]
- Egiazarian, V.; Voynov, O.; Artemov, A.; Volkhonskiy, D.; Safin, A.; Taktasheva, M.; Zorin, D.; Burnaev, E. Deep vectorization of technical drawings. In Proceedings of the Computer Vision–ECCV 2020: 16th European Conference, Glasgow, UK, 23–28 August 2020; Part XIII 16. Springer: Berlin/Heidelberg, Germany, 2020; pp. 582–598. [Google Scholar]
- Dong, S.; Wang, W.; Li, W.; Zou, K. Vectorization of floor plans based on EdgeGAN. Information 2021, 12, 206. [Google Scholar] [CrossRef]
- Radne, A.; Forsberg, E. Vectorizaton of Architectural Floor Plans: PixMax—A Semi-Supervised Approach to Domain Adaptation through Pseudolabelling. Master’s Thesis, Chalmers University of Technology, Gothenburg, Sweden, 2021. [Google Scholar]
- Nguyen, M.T.; Pham, V.L.; Nguyen, C.C.; Nguyen, V.V. Object detection and text recognition in large-scale technical drawings. In Proceedings of the 10th International Conference on Pattern Recognition Applications and Methods (ICPRAM 2021), Scitepress, Online, 4–6 February 2021; pp. 612–619. [Google Scholar]
- Wenyin, L.; Dori, D. From raster to vectors: Extracting visual information from line drawings. Pattern Anal. Appl. 1999, 2, 10–21. [Google Scholar] [CrossRef]
- Domínguez, B.; García, A.L.; Feito, F. Semiautomatic detection of floor topology from CAD architectural drawings. Comput. Des. 2012, 44, 367–378. [Google Scholar] [CrossRef]
- So, C.; Baciu, G.; Sun, H. Reconstruction of 3d virtual buildings from 2d architectural floor plans. In Proceedings of the ACM Symposium on Virtual Reality Software and Technology, Taipei, Taiwan, 2–5 November 1998; pp. 17–23. [Google Scholar]
- Lim, J.; Janssen, P.; Stouffs, R. Automated generation of BIM models from 2D CAD drawings, in: Learning, Adapting and Prototyping. In Proceedings of the 23rd International Conference of the Association for Computer-Aided Architectural Design Research in Asia (CAADRIA), Beijig, China, 17–19 May 2018; Volume 2, pp. 61–70. [Google Scholar]
- Xi, X.-P.; Dou, W.-C.; Lu, T.; Cai, S.-J. Research on automated recognizing and interpreting architectural drawings. In Proceedings of the 2002 International Conference on Machine Learning and Cybernetics, Beijing, China, 4–5 November 2002. [Google Scholar]
- Lu, T.; Tai, C.-L.; Su, F.; Cai, S. A new recognition model for electronic architectural drawings. Comput. Des. 2005, 37, 1053–1069. [Google Scholar] [CrossRef]
- Paoluzzi, A.; Milicchio, F.; Scorzelli, G.; Vicentino, M. From 2D plans to 3D building models for security modeling of critical infrastructures. Int. J. Shape Model. 2008, 14, 61–78. [Google Scholar] [CrossRef]
- Horna, S.; Meneveaux, D.; Damiand, G.; Bertrand, Y. Consistency constraints and 3D building reconstruction. Comput. Des. 2009, 41, 13–27. [Google Scholar] [CrossRef]
- Mas, A.; Besuievsky, G. Automatic architectural 3D model generation with sunlight simulation. In SIACG 2006: Ibero-American Symposium in Computer Graphics; Brunet, P., Correia, N., Baranoski, G., Eds.; The Eurographics Association: Eindhoven, The Netherlands, 2006; pp. 37–44. [Google Scholar]
- Moloo, R.K.; Dawood, M.A.S.; Auleear, A.S. 3-phase recognition approach to pseudo 3d building generation from 2d floor plan. arXiv 2011, arXiv:1107.3680. [Google Scholar]
- Su, F.; Song, J.; Tai, C.-L.; Cai, S. Dimension recognition and geometry reconstruction in vectorization of engineering drawings. In Proceedings of the 2001 IEEE Computer Society Conference on Computer Vision and Pattern Recognition. CVPR 2001, Kauai, HI, USA, 8–14 December 2001; Volume 1, p. I. [Google Scholar]
- Lu, Q.; Lee, S. A Semi-Automatic Approach to Detect Structural Components from CAD Drawings for Constructing As-Is BIM Objects. In Proceedings of the ASCE International Workshop on Computing in Civil Engineering 2017, Seattle, DA, USA, 25–27 June 2017. [Google Scholar]
- Kim, S.; Park, S.; Kim, H.; Yu, K. Deep floor plan analysis for complicated drawings based on style transfer. J. Comput. Civ. Eng. 2021, 35, 04020066. [Google Scholar] [CrossRef]
- Khare, D.; Kamal, N.; Ganesh, H.B.; Sowmya, V.; Variyar, V.S. Enhanced object detection in floor plan through super-resolution. In Machine Learning, Image Processing, Network Security and Data 589 Sciences: Select Proceedings of 3rd International Conference on MIND 590 2021; Springer: Berlin/Heidelberg, Germany, 2021; pp. 247–257. [Google Scholar]
- Goyal, S.; Chattopadhyay, C.; Bhatnagar, G. Knowledge-driven description synthesis for floor plan interpretation. Int. J. Doc. Anal. Recognit. (IJDAR) 2021, 24, 19–32. [Google Scholar] [CrossRef]
- Lu, Z.; Wang, T.; Guo, J.; Meng, W.; Xiao, J.; Zhang, W.; Zhang, X. Data-driven floor plan understanding in rural residential buildings via deep recognition. Inf. Sci. 2021, 567, 58–74. [Google Scholar] [CrossRef]
- Jang, H.; Yu, K.; Yang, J. Indoor reconstruction from floorplan images with a deep learning approach. ISPRS Int. J. Geo-Inf. 2020, 9, 65. [Google Scholar] [CrossRef]
- Dodge, S.; Xu, J.; Stenger, B. Parsing floor plan images. In Proceedings of the 2017 Fifteenth IAPR International Conference on Machine Vision Applications 602 (MVA), Nagoya, Japan, 8–12 May 2017; pp. 358–361. [Google Scholar]
- Pan, Z.; Yu, Y.; Xiao, F.; Zhang, J. Recovering building information model from 2D drawings for mechanical, electrical and plumbing systems of ageing buildings. Autom. Constr. 2023, 152, 104914. [Google Scholar] [CrossRef]
- Urbieta, M.; Urbieta, M.; Laborde, T.; Villarreal, G.; Rossi, G. Generating BIM model from structural and architectural plans using Artificial Intelligence. J. Build. Eng. 2023, 78, 107672. [Google Scholar] [CrossRef]
- Wei, C.; Gupta, M.; Czerniawski, T. Automated Wall Detection in 2D CAD Drawings to Create Digital 3D Models. In Proceedings of the 39th International Symposium on Automation and Robotics in Construction, Bogotá, Colombia, 13–15 July 2022; pp. 152–158. [Google Scholar]
- Barreiro, A.C.; Trzeciakiewicz, M.; Hilsmann, A.; Eisert, P. Automatic Reconstruction of Semantic 3D Models from 2D Floor Plans. In Proceedings of the 2023 18th International Conference on Machine Vision and Applications (MVA), Shizuoka, Japan, 23–25 July 2023. [Google Scholar]
- Wang, T.; Gan, V.J.L. Automated joint 3D reconstruction and visual inspection for buildings using computer vision and transfer learning. Autom. Constr. 2023, 149, 104810. [Google Scholar] [CrossRef]
- Liu, C.; Schwing, A.G.; Kundu, K.; Urtasun, R.; Fidler, S. Rent3d: Floor plan priors for monocular layout estimation. In Proceedings of the IEEE Conference on Computer Vision and Pattern Recognition, Boston, MA, USA, 7–12 June 2015; pp. 3413–3421. [Google Scholar]
- Kalervo, A.; Ylioinas, J.; Haikou, M.; Karhu, A.; Kannala, J. Cubicasa5k: A dataset and an improved multi-task model for floorplan image analysis. In Proceedings of the Image Analysis: 21st Scandinavian Conference, SCIA 2019, Norrkoping, Sweden, 11–13 June 2019; Proceedings 21. Springer: Berlin/Heidelberg, Germany, 2019; pp. 28–40. [Google Scholar]
- de las Heras, L.-P.; Terrades, O.R.; Robles, S.; Sánchez, G. Cvc-fp and sgt: A new database for structural floor plan analysis and its ground truthing tool. Int. J. Doc. Anal. Recognit. 2015, 18, 15–30. [Google Scholar] [CrossRef]
- Delalandre, M.; Valveny, E.; Pridmore, T.; Karatzas, D. Generation of synthetic documents for performance evaluation of symbol recognition & spotting systems. Int. J. Doc. Anal. Recognit. 2010, 13, 187–207. [Google Scholar] [CrossRef]
- Zhang, C.; Pinquié, R.; Polette, A.; Carasi, G.; De Charnace, H.; Pernot, J.-P. Automatic 3D CAD models reconstruction from 2D orthographic drawings. Comput. Graph. 2023, 114, 179–189. [Google Scholar] [CrossRef]
- Barki, H.; Fadli, F.; Shaat, A.; Boguslawski, P.; Mahdjoubi, L. Bim models generation from 2d cad drawings and 3d scans: An analysis of challenges and opportunities for aec practitioners, Building Information Modelling (BIM) in Design. Constr. Oper. 2015, 149, 369–380. [Google Scholar]
- Shin, M.; Park, S.; Koo, B.; Kim, T.W. Automated CAD-to-BIM generation of restroom sanitary plumbing system. J. Comput. Des. Eng. 2024, 11, 70–84. [Google Scholar] [CrossRef]
- Zhu, J.; Zhang, H.; Wen, Y. A New Reconstruction Method for 3D Buildings from 2D Vector Floor Plan. Comput. Des. Appl. 2014, 11, 704–714. [Google Scholar] [CrossRef]
- Pađen, I.; García-Sánchez, C.; Ledoux, H. Towards automatic reconstruction of 3D city models tailored for urban flow simulations. Front. Built Environ. 2022, 8, 899332. [Google Scholar] [CrossRef]
- Fotsing, C.; Hahn, P.; Cunningham, D.; Bobda, C. Volumetric wall detection in unorganized indoor point clouds using continuous segments in 2D grids. Autom. Constr. 2022, 141, 104462. [Google Scholar] [CrossRef]
- Cheng, B.; Chen, S.; Fan, L.; Li, Y.; Cai, Y.; Liu, Z. Windows and Doors Extraction from Point Cloud Data Combining Semantic Features and Material Characteristics. Buildings 2023, 13, 507. [Google Scholar] [CrossRef]
- Chung, S.; Moon, S.; Kim, J.; Kim, J.; Lim, S.; Chi, S. Comparing natural language processing (NLP) applications in construction and computer science using preferred reporting items for systematic reviews (PRISMA). Autom. Constr. 2023, 154, 105020. [Google Scholar] [CrossRef]
- Shamshiri, A.; Ryu, K.R.; Park, J.Y. Text mining and natural language processing in construction. Autom. Constr. 2024, 158, 105200. [Google Scholar] [CrossRef]


Disclaimer/Publisher’s Note: The statements, opinions and data contained in all publications are solely those of the individual author(s) and contributor(s) and not of MDPI and/or the editor(s). MDPI and/or the editor(s) disclaim responsibility for any injury to people or property resulting from any ideas, methods, instructions or products referred to in the content. |
© 2024 by the authors. Licensee MDPI, Basel, Switzerland. This article is an open access article distributed under the terms and conditions of the Creative Commons Attribution (CC BY) license (https://creativecommons.org/licenses/by/4.0/).
Share and Cite
Feist, S.; Jacques de Sousa, L.; Sanhudo, L.; Poças Martins, J. Automatic Reconstruction of 3D Models from 2D Drawings: A State-of-the-Art Review. Eng 2024, 5, 784-800. https://doi.org/10.3390/eng5020042
Feist S, Jacques de Sousa L, Sanhudo L, Poças Martins J. Automatic Reconstruction of 3D Models from 2D Drawings: A State-of-the-Art Review. Eng. 2024; 5(2):784-800. https://doi.org/10.3390/eng5020042
Chicago/Turabian StyleFeist, Sofia, Luís Jacques de Sousa, Luís Sanhudo, and João Poças Martins. 2024. "Automatic Reconstruction of 3D Models from 2D Drawings: A State-of-the-Art Review" Eng 5, no. 2: 784-800. https://doi.org/10.3390/eng5020042
APA StyleFeist, S., Jacques de Sousa, L., Sanhudo, L., & Poças Martins, J. (2024). Automatic Reconstruction of 3D Models from 2D Drawings: A State-of-the-Art Review. Eng, 5(2), 784-800. https://doi.org/10.3390/eng5020042


