1. Introduction
The European Union (EU) has implemented policies aimed at reducing the energy consumption and improving the energy performance of buildings. The Energy Performance Building Directive (EPBD) was introduced in 2002, establishing an energy certification system and thermal parameters to measure and control the performance and energy needs of certain building elements [
1]. The directive has since been updated [
2,
3] with the introduction of common methodologies to calculate building performance among member states (MS) and the implementation of nearly zero-energy buildings for both new and renovated units.
Following the Paris Agreement, the EU defined the Energy Union Package [
4], which highlights climate change policy [
5]. The EU also established a long-term strategy in 2020 [
6,
7] based on the decarbonization of the built environment until 2050, issuing guidelines for MS. To achieve this goal, the EU produced a document called ‘A Renovation Wave for Europe’ [
8], which outlines the key principles of building renovation in two phases: 2030 and 2050. Some of these principles include energy efficiency, affordability (fighting energetic poverty), decarbonization and the integration of renewables, life-cycle thinking and circularity, high health and environment standards, green and digital transitions, and respect for aesthetics and architectural quality [
9].
Cooling and heating decarbonization is one of the intervention domains identified in ‘A Renovation Wave for Europe’, as it is responsible for 80% of the energy consumption in the housing sector [
8]. To achieve this, the EU aims to create a sustainable built environment, improve reuse and recycling, and encourage the efficient use of resources and renewables [
8,
10,
11,
12].
Intervening with existing buildings in a sustainable way requires a deep understanding of their primary characteristics, materials, and constructive solutions [
12,
13,
14]. The initial building diagnosis phase is crucial for identifying the main aspects that must be considered when defining the intervention techniques and adequate solutions. To maintain the integrity of the constructive elements, noninvasive and nondestructive methodologies must be prioritized, and infrared thermography can assist in this initial process [
15,
16].
Overall, the EU’s policies and guidelines aim to achieve a sustainable and efficient built environment, with a focus on decarbonization and the integration of renewables. Understanding building characteristics and utilizing noninvasive methodologies can aid in this process.
The main objective of this work is to analyze the possibilities of using thermography for the constructive characterization of existing buildings, without the need to resort to destructive inspection techniques, to ensure knowledge about the structures and materials, as well as the compatibility of the intervention. This technology has significant advantages, and its portability and reliability is an added value in inspection activities through the adoption of appropriate procedures and parameters.
Surveying the built environment is a challenge due to the diversity of techniques and materials that characterize different construction periods and their evolution. In this sense, it is essential to find techniques that allow for identifying these elements quickly and reliably. We offer a valuable tool for construction sector professionals, regulatory authorities, and policy makers. Furthermore, by promoting the use of non-invasive methodologies, such as thermography, this study supports the preservation of the built heritage while advancing toward a more sustainable and energy-efficient built environment.
2. Thermography
Thermographic images were first used for military activities in the 1960s, and their use in construction began between the 1970s and the 1980s. With a reduction in size, improved portability, and the introduction of cooling mechanisms in the 1990s, cameras have become better adapted for commercial use, particularly in construction areas [
17]. Currently, as the equipment has become more accessible, it is possible to extend its application area, and it is being used in medicine, veterinary medicine, process maintenance and monitoring, mechanical and/or electrical diagnostics, equipment installations, and building inspections. Thermographic techniques are also used in asset management as inspection techniques to aid management and investment decisions.
Active thermography is a nondestructive testing method used to detect and characterize defects in materials. The technique uses thermal contrast to identify defects such as delamination, cracks, or skin holes in the subsurface layers of the tested material [
18]. Unlike classical standardized methods, active thermography does not require a reference thermogram or a defect-free area for the detection and characterization of defects [
18]. This relatively young method has been used in various fields, including civil engineering and material examination [
18]. An infrared thermal camera was used to measure the electromagnetic radiation emitted in the infrared spectrum during active thermography [
18]. The term “active thermography” refers to the basic technique of using simple heat flow to excite the test object [
18]. It is a noninvasive and contactless technique that does not compromise the integrity of the findings [
18]. This makes it useful for investigating defects close to the surface because it can detect surface cracks and defects that are not visible to the naked eye [
18,
19]. The heating pulse can be realized as a square pulse, and a thermal heating unit with infrared radiators can be used for laboratory measurements. After heating, the cooling process of the surface was observed with an IR camera that detected in the wavelength region of 3 to 5 µm [
19]. This method is also useful for assessing the state of the conservation of historical and archaeological discoveries [
18]. A hybrid technique that combines active thermography with eddy current pulsed thermography can improve the effectiveness of detecting surface defects in concrete structures [
18,
19]. Overall, active thermography is an effective nondestructive testing tool that is being researched and applied in various fields.
2.1. Benefits of Using Active Thermography in Characterizing the Built Environment
Active thermography has numerous benefits in characterizing the built environment, particularly in the detection and characterization of defects in reinforced concrete structures [
19]. This technique is particularly adept at uncovering and detailing defects, such as cracks and inclusions, within various materials and components of the built environment. The procedure provides a physical background, equipment, and post-processing methods to analyze thermogram sequences. This makes it a nondestructive testing (NDT) method that can be used to investigate structural problems in a wide variety of materials and components. Furthermore, active thermography methods enable structural investigations of reinforced concrete elements, considering many different testing problems [
19]. IRT can also detect emissivity changes on a surface, even though the entire surface is made of the same material [
19]. This indicates that active thermography has potential for the development of more advanced, effective, and accurate approaches that employ a combination of thermography approaches [
19]. In addition to its benefits in characterizing reinforced concrete structures, active thermography is useful in identifying problems caused by ruts, accumulated rubber, slight changes in surface color, and road markings [
19]. Finally, infrared thermography can be coupled with other nondestructive evaluation (NDE) techniques for the evaluation of fiber-reinforced polymer (FRP)-bonded concrete [
20]. Overall, active thermography is a powerful tool for characterizing built environments and is likely to become even more important in the future as new applications are being developed.
2.2. Limitations of Using Active Thermography in Characterizing the Built Environment
While active thermography has been proven to be a useful tool for detecting and characterizing defects in built environments, it is not without limitations. Thermal image processing algorithms are necessary to perform qualitative and quantitative analyses, as raw thermal images are often insufficient to thermally characterize both damaged and undamaged regions in a structure [
21]. These algorithms are essential for extracting meaningful information from images and ensuring accurate and reliable results. In addition, raw thermal images often contain too much noise to allow for the clear detection of defects in structures [
21]. This can lead to false positives or negatives, which can be detrimental to decision-making processes related to the maintenance or repair of structures. Furthermore, when processing thermal images, the adaptation and interpretation of visible image processing algorithms are necessary because of the lower resolution and different nature of pixel values in thermal images [
21]. This requires a level of expertise and an understanding of both visible and thermal image processing techniques. Overall, while active thermography can be a powerful tool for characterizing the built environment, it is important to be aware of its limitations and use appropriate processing algorithms to ensure reliable results.
2.3. Research Design for the Qualitative Investigation of Active Thermography
Various qualitative studies have investigated the effectiveness of active thermography in different contexts. For example, Zalameda et al. used active thermography to examine thermal diffusivity and effusivity images of aircraft components and found a strong correlation with ultrasonic C-scan imaging [
22]. In another study, a cardboard sheet was heated using an artificial heat source to observe its temperature evolution, providing a qualitative approach for active thermography [
23]. Active infrared thermography was used to develop an experimental protocol for the quantitative diagnosis of insulated building walls in restored old constructions, thereby demonstrating the potential of active thermography in this application [
24]. In a study on identifying thermal anomalies from gases, an unmanned aerial vehicle (UAV) was used at low ambient temperatures, and a qualitative study method was employed to identify strong thermal anomalies [
25]. These studies demonstrate the potential of active thermography in various applications and highlight the importance of qualitative investigations for assessing its effectiveness.
2.4. Main Findings of the Qualitative Investigation of Active Thermography in Characterizing the Built Environment
The qualitative investigation of active thermography for characterizing the built environment revealed several key findings. Active infrared thermography (IRT) is a useful tool for detecting and characterizing defects in reinforced-concrete structures [
19]. An overview is provided on the physical background, equipment, and post-processing methods utilized for the analysis of thermograms in active thermography [
19]. Additionally, another study [
26] characterized the air-conditioning usage pattern of non-residential buildings using longitudinal thermal images, focusing on two different air-conditioning systems: water-cooled systems operating on a pre-set schedule and window AC units operated by occupants. The results of the analysis were compared with indoor temperature sensors installed in the office spaces of a building, showing great potential for the development of more advanced and accurate approaches that employ a combination of thermography applications [
19,
26]. For water-cooled systems, the difference between the rate of change of the window and wall temperature can be used to extract operational patterns, whereas for window AC units, the wavelet transform of the AC unit temperature is used to extract the frequency and time domain information [
26]. The output of this study can be used to better understand operational and occupant behavior without requiring a large array of sensors in the building space [
26]. Finally, this paper briefly presents previous nondestructive testing (NDT) studies that employed thermography techniques with natural excitation as well as future trends of thermal imaging, indicating the potential for more advanced, effective, and accurate approaches in the future [
19].
2.5. ISO Standards for Infrared Thermography Services and Thermal Evaluation in Buildings: Guidelines, Performance Requirements, and Measurement of Thermal Resistance
According to the standards, ISO 6781-1:2023 [
27] provides guidance on infrared thermographic services for the detection of heat, air, and moisture irregularities in buildings. ISO 18251-1:2017 [
28] describes the main components, and their characteristics, constituting an infrared (IR) imaging system and related equipment used in non-destructive testing (NDT). ISO 18251-2:2023 [
29] specifies the minimum requirements for the performance of infrared thermographic systems used for the non-destructive testing (NDT) of composite materials. Finally, ISO 9869-2:2018 [
30] specifies the measurement of the thermal resistance and thermal transmittance of building components and building elements, excluding doors, windows, and curtain walling.
3. Materials and Methods
Active thermography is a valuable method for characterizing the built environment and provides a comprehensive set of information on subsurface features, such as location, thickness, and thermal properties [
31]. Combining experimental testing and numerical simulations can yield quantitative characterizations of subsurface features of interest. Additionally, active thermography based on cooling down thermographic principles is effective for testing multilayered structures and identifying hidden mosaic artifacts beneath plaster layers [
31]. This allows for a thorough analysis of the built environment, thus allowing for the identification and remediation of defects in reinforced concrete. With the physical background, equipment, and post-processing methods available to analyze sequences of thermograms, active thermography is a valuable tool for improving the characterization of the built environment and ensuring the safety and structural integrity of buildings and other structures.
A literature review was conducted on IR thermal imaging, buildings, and construction. Infrared thermography has emerged as a powerful nondestructive testing technique for evaluating the energy efficiency and structural integrity of building materials and structures. The review included only articles published from 2012, and a bibliographic search was performed using Scopus on 11 April 2023 (
Table 1). The ten selected and most cited articles are discussed below.
In the first article, a new methodology is introduced to evaluate energy efficiency and 3D thermography. It involves merging infrared thermography (IRT) with computational fluid dynamics (CFD) simulations to analyze the thermal effectiveness of building enclosures. This technique has demonstrated the capacity to enhance building design and minimize energy usage.
In the second article, the focal point was the creation of a protocol for constructing thermographic procedures using infrared drones. The authors present a thorough plan for gathering, handling, and assessing IRT images to uncover thermal abnormalities and pinpoint energy wastage in structures.
In the third article, a study was conducted to detect bond defects in concrete structures reinforced with various carbon fiber-reinforced polymer (CFRP) systems using pulse-phase thermography (PTT IRT). This study found that PTT IRT is an effective method for detecting bond defects and distinguishing among different types of CFRP systems.
Article four examines how effectively insulating glass units (IGUs) retain heat using infrared thermography (IRT). The authors note that IRT offers valuable insights into IGUs’ thermal behavior; however, further analysis is necessary to verify these findings. They also discuss the potential and limitations of using IRT to evaluate IGUs’ thermal performance of the IGUs.
In the fifth article, the authors showcase a line-laser thermography scanning system that can assess multiple cracks in concrete structures. This technique proved to be an effective tool for structural evaluation because it could accurately detect and measure the size and depth of the cracks present.
In the sixth article, the authors delve into how photogrammetric surveying of built landscapes can be integrated with IRT. They present a novel methodology that synergizes data from both techniques to produce precise 3D models of structures, including buildings.
In the seventh article, the application of quantitative IRT to determine the indoor air temperature is presented. The results of this study indicate that IRT is an effective tool for measuring the air temperature in enclosed spaces, rendering it a valuable asset for HVAC system optimization and energy auditing.
Article eight outlines a strategy for measuring the U-value of wood-framed wall assemblies using an external IRT. The strengths of this method, such as its noninvasive nature, efficient data collection, and ability to be used on a large scale, are also emphasized.
In the ninth article, the authors provide a comprehensive method for gauging defects in concrete. This entails using IR thermography to identify, pinpoint, and analyze the characteristics of various blemishes that may be present in concrete structures, such as cracking, delamination, and moisture infiltration.
In the tenth article, the authors delve into the use of drones for thermal imaging photography and the 3D imaging of buildings. They explain that this technique can help analyze defects in solar modules by providing information on temperature distribution and defect types. This allows for the effective maintenance and repair of these modules.
Overall, the articles reviewed in this study provide compelling evidence for the potential of IRT as a nondestructive testing technique for evaluating the energy efficiency and structural integrity of building materials and structures. These studies demonstrate the versatility of IRT in providing a unique opportunity to study the environmental impact of buildings and other structures with few limitations and ease of use. Through the analysis of thermograms, we can identify and evaluate potential areas of improvement that could lead to more sustainable and efficient building construction and design. Additionally, this technology can be used to detect and correct damage in existing buildings or even prevent problems at the earliest stages of construction. Ultimately, the utilization of thermograms in construction can lead to innovative solutions and smarter decisions, contributing to the overall improvement in the sustainability and resilience of the building industry [
42,
43].
3.1. Use of Thermography for the Inspection of Buildings
Before using thermography for building inspections, it is necessary to define the type of approach (passive or active). Additionally, the thermogram analysis method must be determined either quantitatively, where temperature variations are analyzed using numerical methods, or qualitatively, through visual analysis of variations in the thermogram, which reflect the variation in radiation emitted by the structural elements being analyzed. The location where the thermograms are captured, whether inside, outside, or both, must also be considered.
Figure 1 presents a planning scheme for building inspection using thermography.
According to the study by Samuel Klein et al. [
44], this work explores the applications of solar-loaded thermography using active thermography algorithms. It is demonstrated that active thermography methods, such as step-heating thermography, exhibit a strong correlation with a solar load setup. Solar-loaded thermography is an approach that has recently garnered scientific interest and is advantageous due to its ease of setup and ability to measure large-scale objects with the sun as the primary heat source. Using the sun as a heating source in active thermography can be an option in certain applications, such as assessing materials in outdoor environments where solar incidence can be employed to create temperature variations. Considering this approach and the fact that the inspected buildings are exposed to external conditions, the images were collected after a period of sun exposure of the construction elements. The winter season and external conditions make it possible to analyze the construction elements in the cooling process, which improves the quality of the images and allows for the analysis of the elements that are inside each constructive element (under the outer cladding).
3.2. Identification of Constructive Solutions with Thermograms
In this study, fieldwork was conducted using a FLIR E60 thermographic camera to identify and assess the potential of thermography to characterize the type of constructive methodology used in different buildings. The use of this technique is fundamental for the identification of constructive solutions in existing buildings, contributing to the adoption of compatible solutions and materials according to the guidelines of the European Commission [
8].
For this investigation, thermograms of the same structure were obtained at different times of the day using the sun as a natural heating source [
45]. Therefore, thermograms of the structures were obtained when the structure absorbed energy from the sun (temperatures increased) and subsequently lost energy to the environment (temperatures decreased). Similar observations were made on an overcast and rainy day.
This was an initial investigation into the use of thermography, framed within the scope of a much broader study aimed at the use of thermographic images for the inspection and maintenance of buildings [
46]. The buildings were chosen based on the type of constructive solution or type of intervention. The first case corresponds to a traditional Portuguese construction solution called ‘Cruz de Santo André.’ The second case presents the ‘taipa de fasquio’, a traditional solution with a wooden structure. The third case features an old original stone construction that underwent major renovations in the 1980s, and the fourth case features an enlarged building that is now part of the current built heritage. This diversity of solutions demonstrates the flexibility of thermography for different materials and construction solutions.
4. Results and Discussion
Infrared (IR) thermography can be used to measure the surface temperature of a material, providing insight into its condition, energy efficiency, and ability to diminish heat transfer [
47]. Using this technology, it is possible to identify areas of a building that do not perform as efficiently as they should, such as those with high and low thermal conductivity or inadequate insulation. Moreover, IR thermography can detect moisture, cracks, and other damage in building materials, which can inform decisions regarding the need for repair or replacement [
16,
48].
4.1. Analysis of Traditional Building with ‘Cruz de Santo André’—Viseu
Figure 2 presents a case study of ‘Casa dos Balcões’, located in the old city center of Viseu. The image captured outside the building reveals the use of a traditional Portuguese construction technique called ‘Cruz de Santo André’, where ceramic bricks and lime mortar fill the spaces between the wood structures. Identification of the type of structure facilitates the definition of the most appropriate type of intervention for preserving existing heritage sites.
Figure 2 shows thermograms that allow for the identification of the traditional Portuguese construction technique ‘Cruz de Santo André’ (
Figure 2a,c). These walls consist of a wooden structure that defines the geometry of the element and are covered with lime mortar (
Figure 2b). The dimensions of the cross define the module that determines the width (2 × a) and height of the spans as well as their spacing (
Figure 2c). The image was scaled to simulate the wall structure scheme (
Figure 2d).
The thermogram in
Figure 2 was captured after a period of sun exposure, and the wall cooled faster than the wood and the infill material, which created the correct conditions for the camera to detect the temperature differences between the wood structure and the infill material. A similar image was captured under the same conditions. The images show the same structural patterns (
Figure 3). It is worth mentioning that the differences in energy are exceedingly small. The thermogram on the right has a vertical line, the maximum temperature measured was 8.9 °C, indicated by the red triangle (at the location of the wood structure), and a lower value of 8.1 °C was located in the infilling plaster.
Several parameters influenced the results, including the thickness of the wall covering (thicker coverings dissipate differences between high and low temperatures), the angle of the incidence of radiation (perpendicular to the wall plastering), and the amount of energy received by the structural elements (one of the elements may have been heated more than the other, behaving differently). All of these conditions must be considered when using active thermography with the sun as the heating source.
Overall, the results demonstrate the potential of IR thermography for identifying and characterizing traditional building techniques and contributing to the preservation of existing heritage sites. This technology provides valuable insights into the conditions of buildings and has the potential for sustainable and efficient construction and design.
4.2. Traditional Building Analysis with ‘Taipa de Fasquio’—City of Orvalho
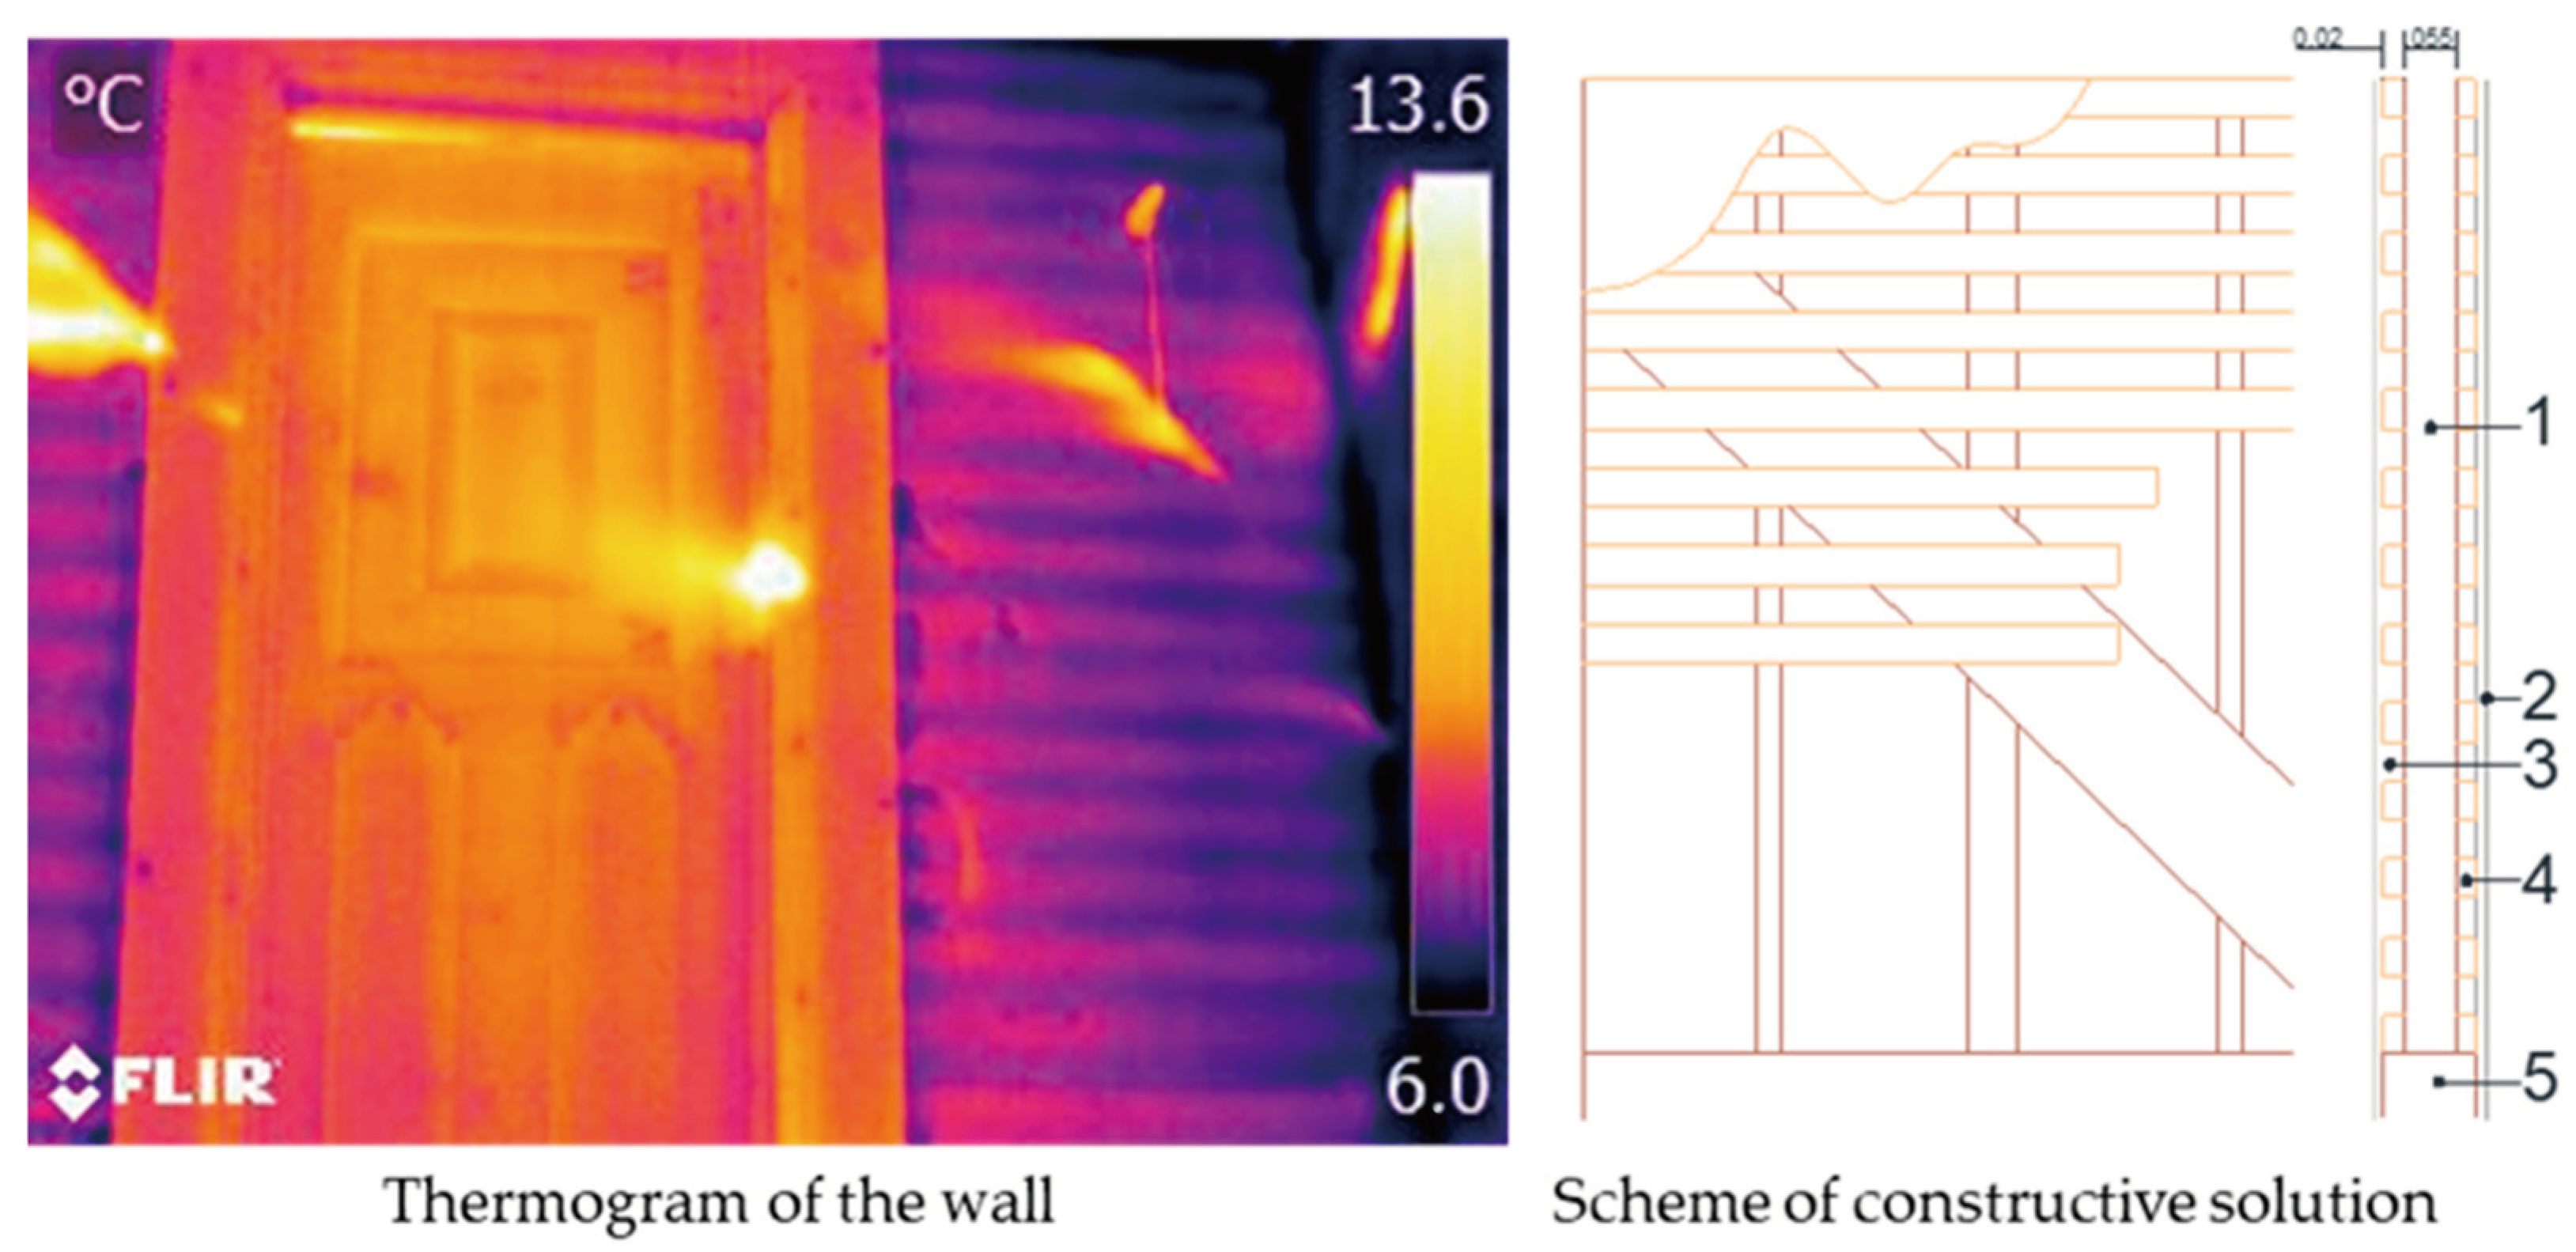
Thermal images were also analyzed for another traditional building in the city of Orvalho, where the ‘taipa de fasquio’ technique was used for both interior and exterior walls [
49]. This technique is similar to the ‘mud and stud’ construction methods.
Figure 4 shows the collected images, where the horizontal slatted structure, known as ’fasquio’, can be identified, showing a higher temperature than the area filled with mortar. This temperature difference is related to the different densities of the materials. Because the mortar also fills the gaps between the wood laths, the mass of the plaster is far higher than that of the wood. Once the building cooled down, the opposite effect was observed; the laths lost heat faster, reaching temperatures lower than those of the mortar, and the picture was inverted.
By adjusting the thermogram to the actual wall dimensions, it is possible to define an existing constructive solution with an acceptable margin of error. This margin of error is the result of the definition and quality of the image; however, it is very close to the dimensions of the existing elements.
4.3. Analysis of a Daycare Center (SCMCB—Castelo Branco)
The third case involved a building located in the old city center of Castelo Branco, which underwent constructive intervention and is currently used as a daycare center for elderly people. The images were captured at the end of the day, when the elements were in the cooling phase after exposure to solar radiation with a mild outer temperature.
The thermogram revealed a raised wall area, indicating an increase in building height. The traditional stone masonry was preserved, and brick masonry was used to add height to the wall. Concrete pillars and beams were used to support the roof structures.
Figure 5 presents both the thermogram and real images side by side, facilitating easier visualization of the new structure. The temperature difference between the stone masonry and brick masonry can be explained by the different densities of the materials used and the energy required to increase their temperature. Bricks heat up faster than stone or reinforced concrete when exposed to the same solar radiation, leading to higher temperatures and the emission of more infrared radiation during the cooling phase. In contrast, stone or concrete emit less infrared radiation as their temperature is lower owing to their larger density and mass, making them appear colder in the thermogram.
Identifying the types of solutions used in the refurbishment of an old building, as demonstrated in this case, can also aid in identifying the possible causes of pathologies that may arise in the future. If the wall cracks in the transition zone between the two materials, acquiring a thermogram to identify the different materials can help assess the cause of the issue without damaging any of the elements.
4.4. Analysis of an Enlarged Building—Castelo Branco
The fourth building analyzed represents a local construction technique used since the 1980s. Analysis of the thermograms allowed for the identification of the constructive solution of the outer layer of the masonry. The exterior image of the building also allowed for the identification of a reinforced concrete structure, namely the slab and pillars at the corner of the building. It is possible to notice the difference in geometry between the pillar of the ground floor and the first floor, as well as the interruption of the pillar in the middle of the first floor (
Figure 6A). This interruption coincides with the existence of a sloped beam with the same slope as that of the roof (
Figure 6B).
Zone 1, under analysis, is shown in
Figure 6 in the image that presents the entire building. Parallelism can be observed between the inclined beam on the wall of the first floor and the roof (
Figure 6, middle image).
The thermogram also suggests that the brick masonry above the sloping beam has a different temperature than the brick cloth below. If we add this information to the discontinuity of the column and the different dimensions of the elements, we can deduce that different types of brick are used. It can be assumed that lighter bricks are required below the beam given the structural requirements of the new wall. This fact is corroborated by the difference in temperature in the thermogram, indicating materials with different densities or masses.
The thermogram allowed for the clear identification of the concrete slab and brick masonry walls. It was also possible to identify the material used in balcony guards as a brick masonry. The shading in some areas of the image compromises the capture of the emitted radiation; these areas appeared at lower temperatures given that they were not exposed to solar radiation.
The captured images allowed for the identification of different materials, and the thermograms clearly identified the difference in the radiation emission capacity of each material. The difference in temperature is related to the specific heat capacity of the materials. Given that the specific heat capacities of concrete and brick are similar, the thermograms suggest that the volume of concrete is much larger and takes longer to heat when subjected to the same amount of radiation.
Another interesting aspect is the discontinuity of the balcony, visible in the detailed pictures in
Figure 6 as a horizontal line on the balcony guard. When analyzing the image of the building presented in
Figure 6, it is clear that the metal guard (seen on the right in
Figure 6A) was removed, and a brick cloth was added to allow for the closure of part of the balcony (
Figure 6B).
The identification of different materials and the thermographic analysis of their radiation emission capacity allows for a better understanding of the construction of buildings and potential issues that may arise in the future. The information obtained can help inform decisions regarding building maintenance and repairs.
4.5. Capturing Images at Different Times
To obtain useful information about different types of construction systems, a temperature difference must be present. This difference is influenced by the time of day and climatic conditions, both of which affect the responses of the materials. Therefore, it is important to define the optimal time for observing building components and materials.
Figure 7 and
Figure 8 show thermograms from two of the previously presented buildings captured at different times of the day. The difference between
Figure 7 and
Figure 8 is the climatic conditions. In
Figure 7, the sky was clear and one of the buildings received direct solar radiation, whereas in
Figure 8, the day was overcast with light rain.
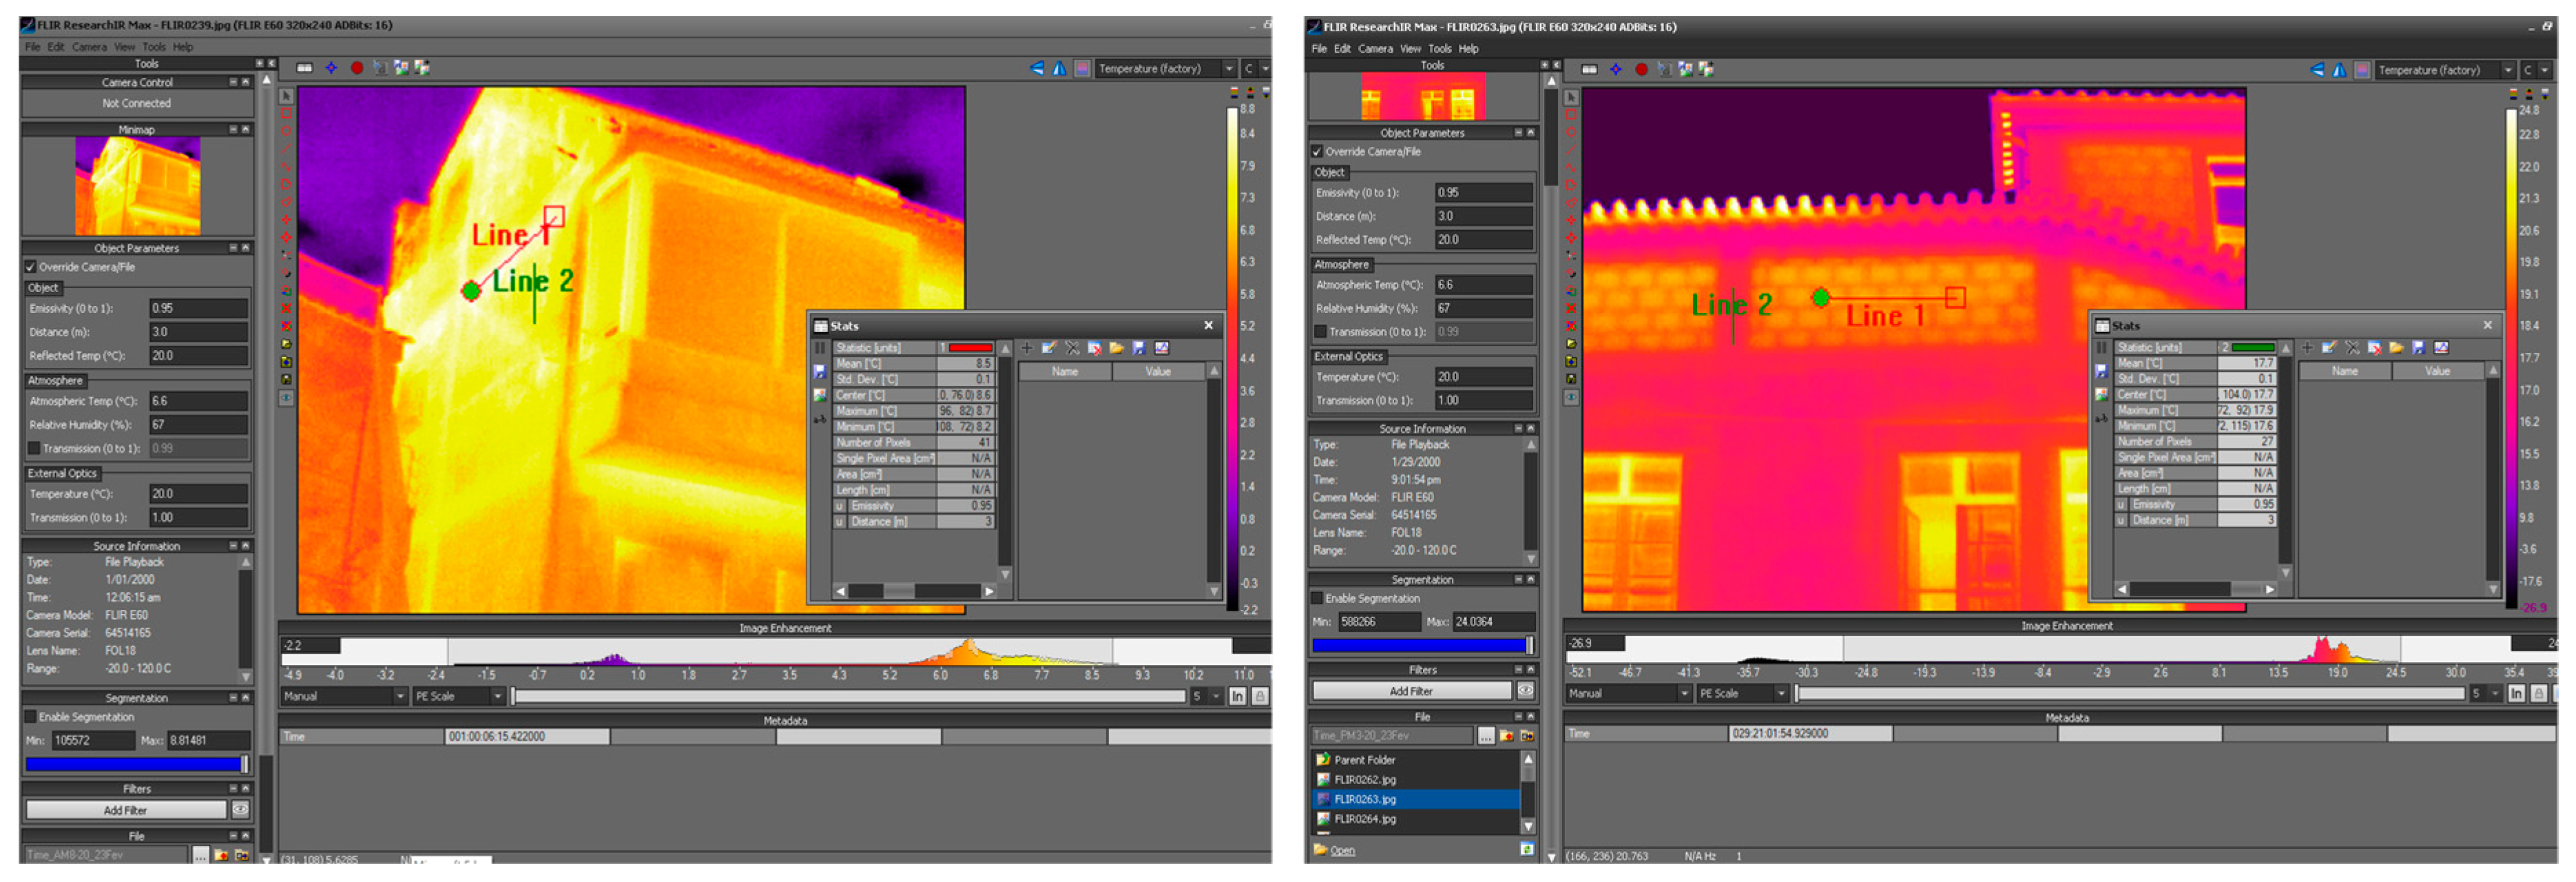
Using ResearchIR software FLIRVersion 4.40.11.35, the images in
Figure 7 and
Figure 8 were analyzed, focusing on the elements of the opaque envelope, such as the structure and wall. By overlapping a line on these elements, it was possible to determine the mean temperature at each time of the day (
Figure 9 and
Figure 10) by comparing different days with varying climatic conditions, such as air temperature, solar incidence, and rain. The three-story building is identified as 3P, and the building that was enlarged is referred to as SC, as it is used as a day care facility by an institution called Santa Casa da Misericórdia.
The temperatures of the different materials are plotted in
Figure 11 and
Figure 12, respectively. The data for the SC building show that on a sunny day, the temperatures of the materials in the facade followed the same trend as the air temperature. The temperatures of the concrete and walls were consistently higher than the air temperature. The data also show that the concrete displayed lower changes in temperature than the brick wall, which was expected given the high density and mass that needed to be heated.
For the 3P building, the direct exposure of the studied facade to sunlight resulted in higher changes in temperature, with the maximum temperature on both the concrete and brick walls measured at 11:20. Given the facade’s orientation, sunlight stops hitting the facade at 12:30, explaining the reduction in temperature of the facade elements afterward. Again, the temperature of the concrete exhibited a lower variation than that of the brick wall. In fact, the temperatures of the facade elements earlier in the morning were similar in both buildings and much closer to the air temperature than at any other measurement time.
The measurements performed during the overcast rainy day showed the smallest changes in temperature for the concrete and bricks. The 3P building had a temperature change pattern similar to the air temperature for both materials, whereas the SC showed a peculiar variation with a reduction in temperature at 15:20, while the air temperature increased. Despite this, the pattern shows that the concrete had the lowest variation in temperature, and the brick walls had the highest variation for both buildings. Given that the surfaces were wet, temperatures lower than those of the exterior air were measured.
The data clearly show that the best time to capture images and notice differences between the various materials used in construction systems is from mid-morning to mid-afternoon on sunny days. Rainy days should be avoided because building surfaces are covered with water, and temperature differences are difficult to detect.
4.6. Considerations Regarding Thermal Imaging Capture and Analysis
The capture of thermograms is directly influenced by the external environment and structural elements being analyzed. The amount of energy radiated depends on the characteristics of the element, such as the emissivity, volume, and specific heat, as well as the external environmental conditions that determine the direction of heat flow. When using active thermography, the amount of energy supplied to heat the structural element is another factor affecting the amount of energy radiated.
Based on the images captured and analyzed in this study, the following observations were made.
- •
Thermograms were captured on winter days with and without rain, with outside temperatures below the indoor temperatures, leading to faster cooling of the elements when the heat source was stopped.
- •
In some cases, thermograms are captured after solar radiation incidence, which increases the temperature difference and makes it easier to identify different materials because of their distinct characteristics.
- •
All thermograms allowed for the identification of the inner element because the outermost layers of all walls were coated with mortar and cooled quickly, except for the first case presented, where the thermogram of the adjacent wall did not allow for the verification of the existing solution.
- •
Wet envelopes influence thermograms, causing temperatures to drop below the exterior temperatures, hindering the analysis and inspection of the building.
- •
The angle of incidence of radiation and surface imperfections, such as air pockets, cracks, different coloring, and moisture, also influence thermograms.
- •
The analysis needs to consider all these combined factors, overlap them with the physical characteristics of each material, and consider the heat flow, especially when the internal and external temperatures are very similar.
The evolution and portability of infrared cameras have facilitated their use. However, the correct interpretation of thermograms is essential, considering the different characteristics of the materials and the conditions of outdoor and indoor environments. It is necessary to consider the factors that influence the infrared radiation emitted by different materials, adjacent bodies, and the atmosphere, which are defined by the emissivity, absorption coefficient, and reflection parameters.
Thermal imaging has great potential for detecting possible defects in a structure, especially when parameters related to the mass of the elements and the amount of heat are considered using the active thermography technique. In particular, when the sun was used as the heat source, the time at which the thermogram was obtained was crucial for the analysis.
5. Conclusions
Infrared thermography has proven to be a highly effective tool for inspecting and diagnosing building structures, providing insights into the construction elements and materials used. This study demonstrates the suitability of thermography for detecting different structural elements and material changes that contribute to the building characterization process. It is crucial to improve the thermal performance of existing buildings as a baseline for decarbonizing the built environment.
This study also highlights that the optimal time for thermography in building inspection is when solar radiation is present and that images should be captured during or immediately after the heating process to maximize the temperature differences. Inspections can also be performed without solar radiation, but the temperature differences will be lower owing to the influence of air temperature.
Overall, this study provides a valuable contribution to the fields of building inspection and thermal performance assessment. Future studies should explore the relationship between thermograms and other relevant thermal building parameters, such as material density and thermal inertia. For accurate diagnosis and intervention strategies, it is essential to consider the various factors that affect the capture and interpretation of thermograms.
This study highlights the potential of infrared thermography for building inspection and underscores its role in improving the thermal performance of existing buildings to achieve climate neutrality in the built environment.


