
Visualization of Movement and Expansion of Coal Reaction Zone by Acoustic Emission Monitoring in Underground Coal Gasification System

 ,
,  and
and
Abstract
:1. Introduction
2. Materials and Methods
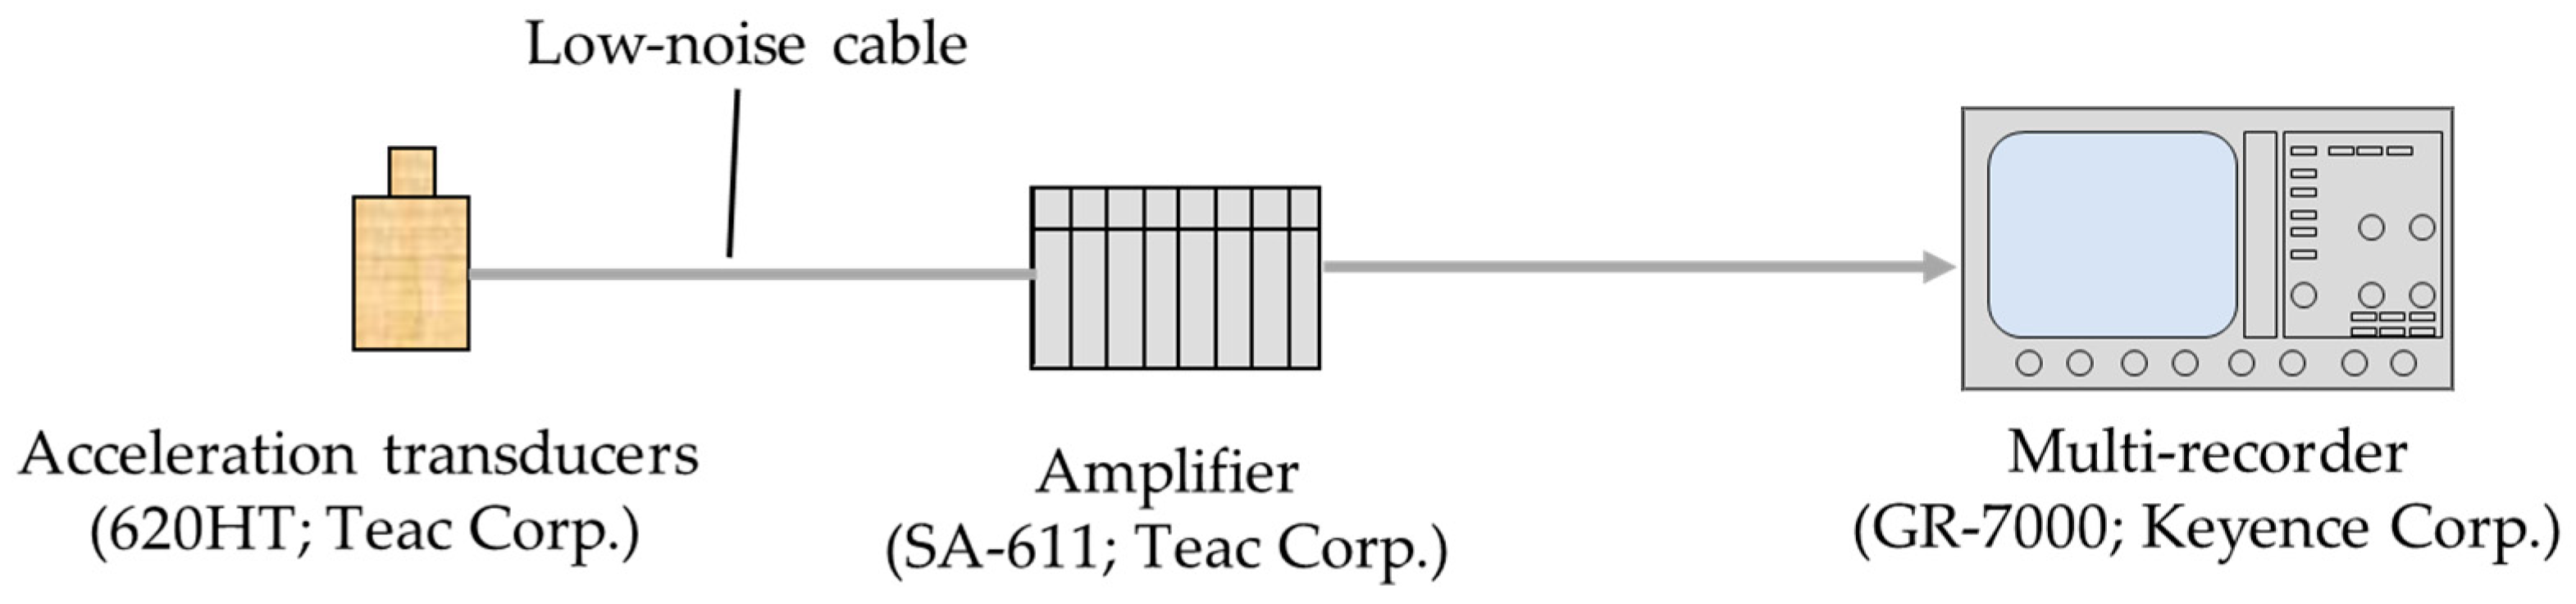
2.1. Acoustic Emission (AE)
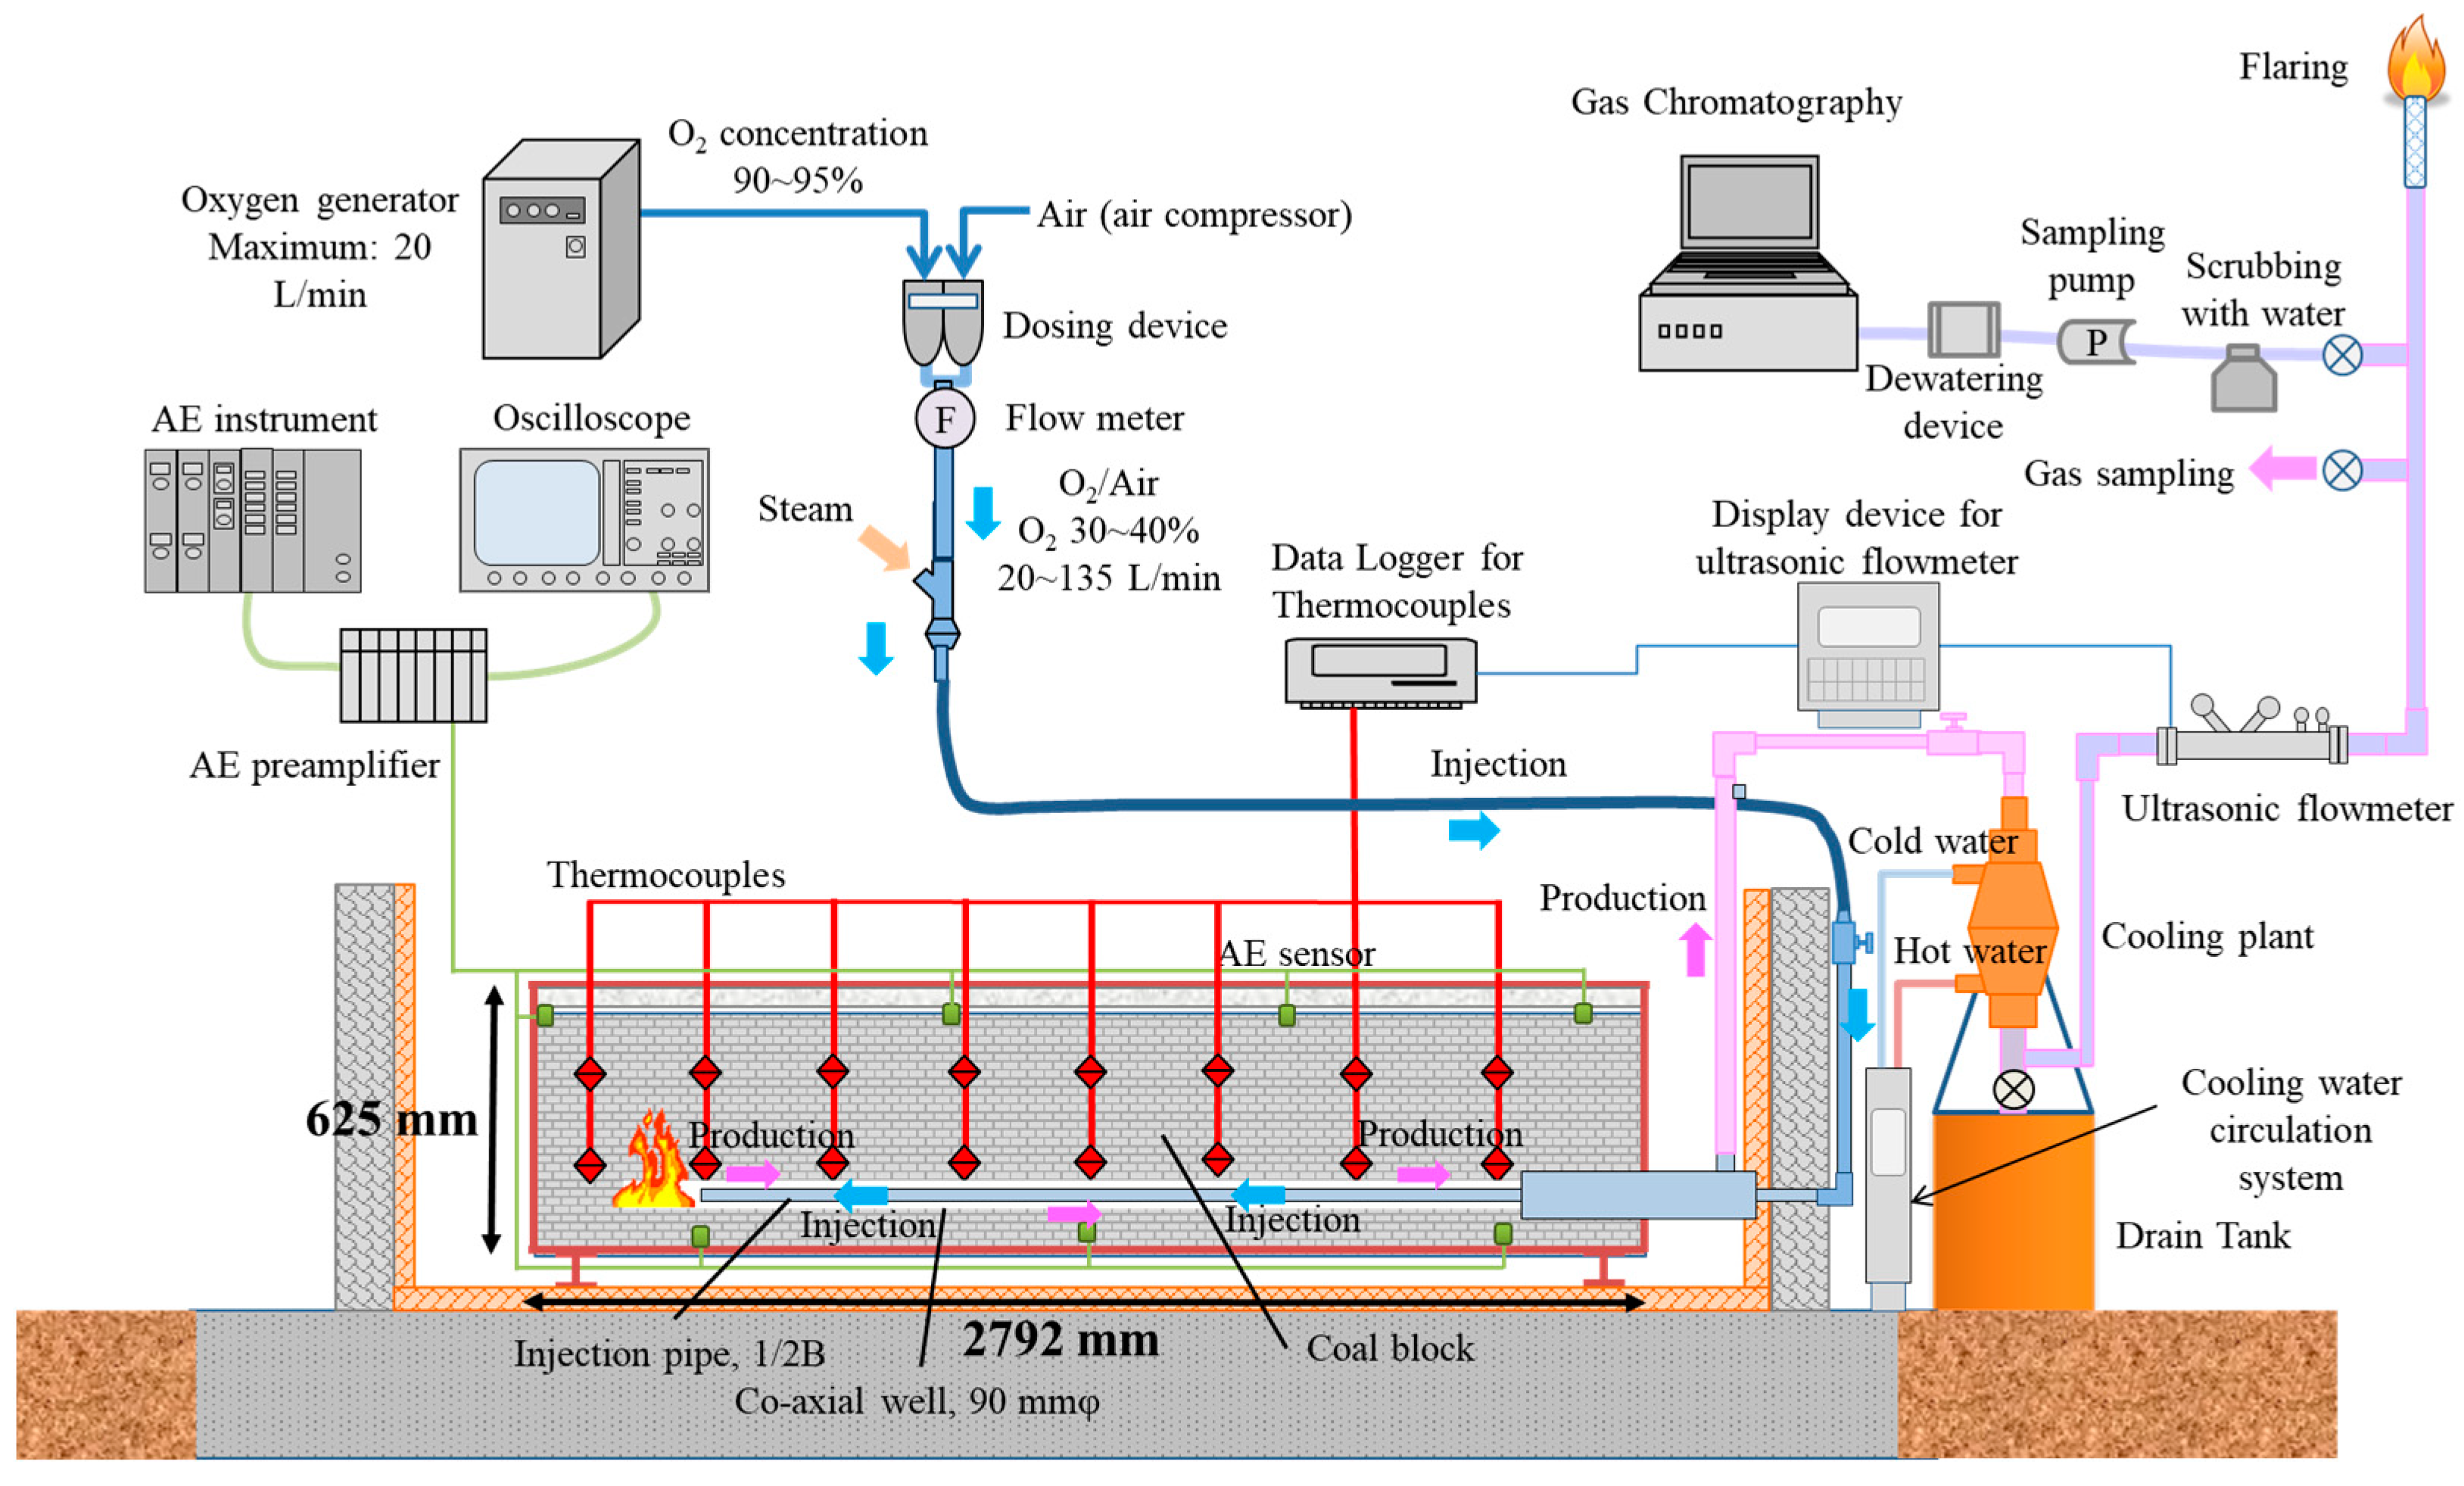
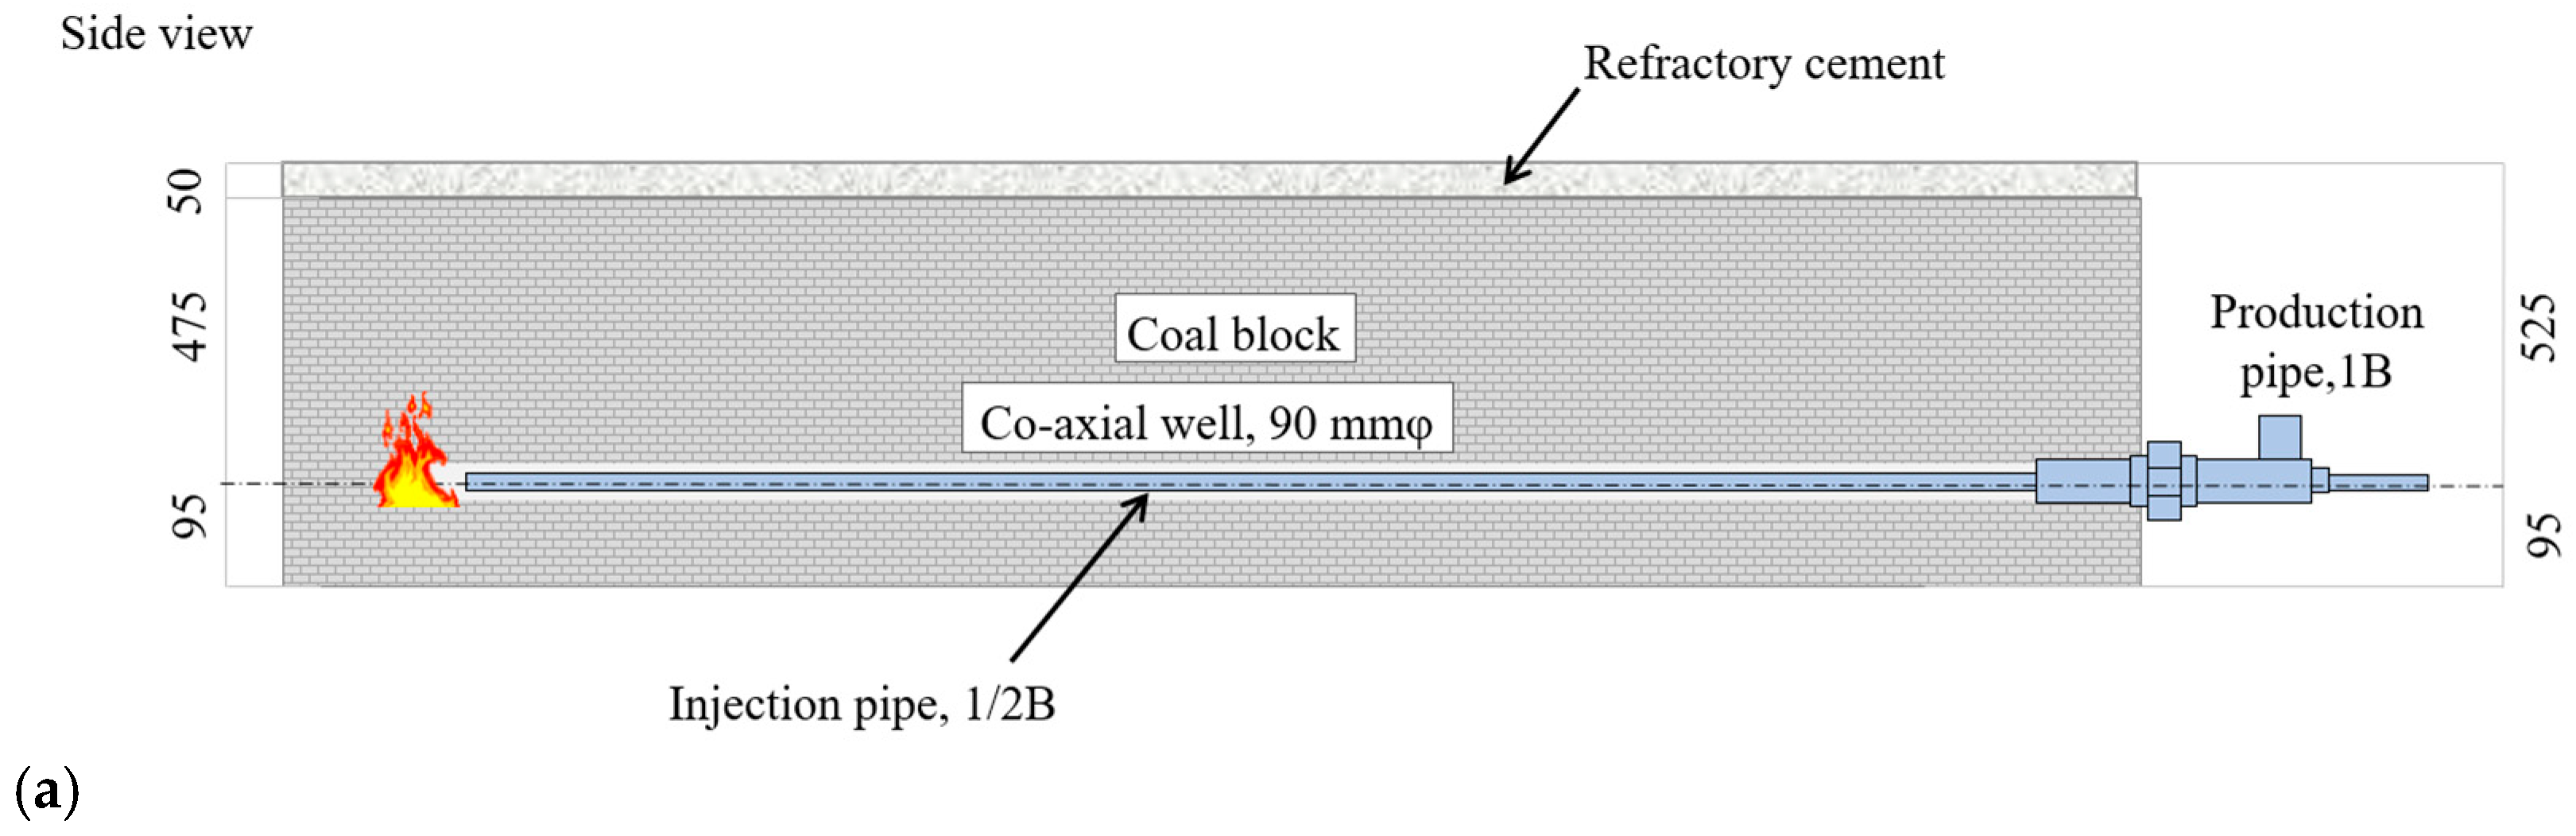
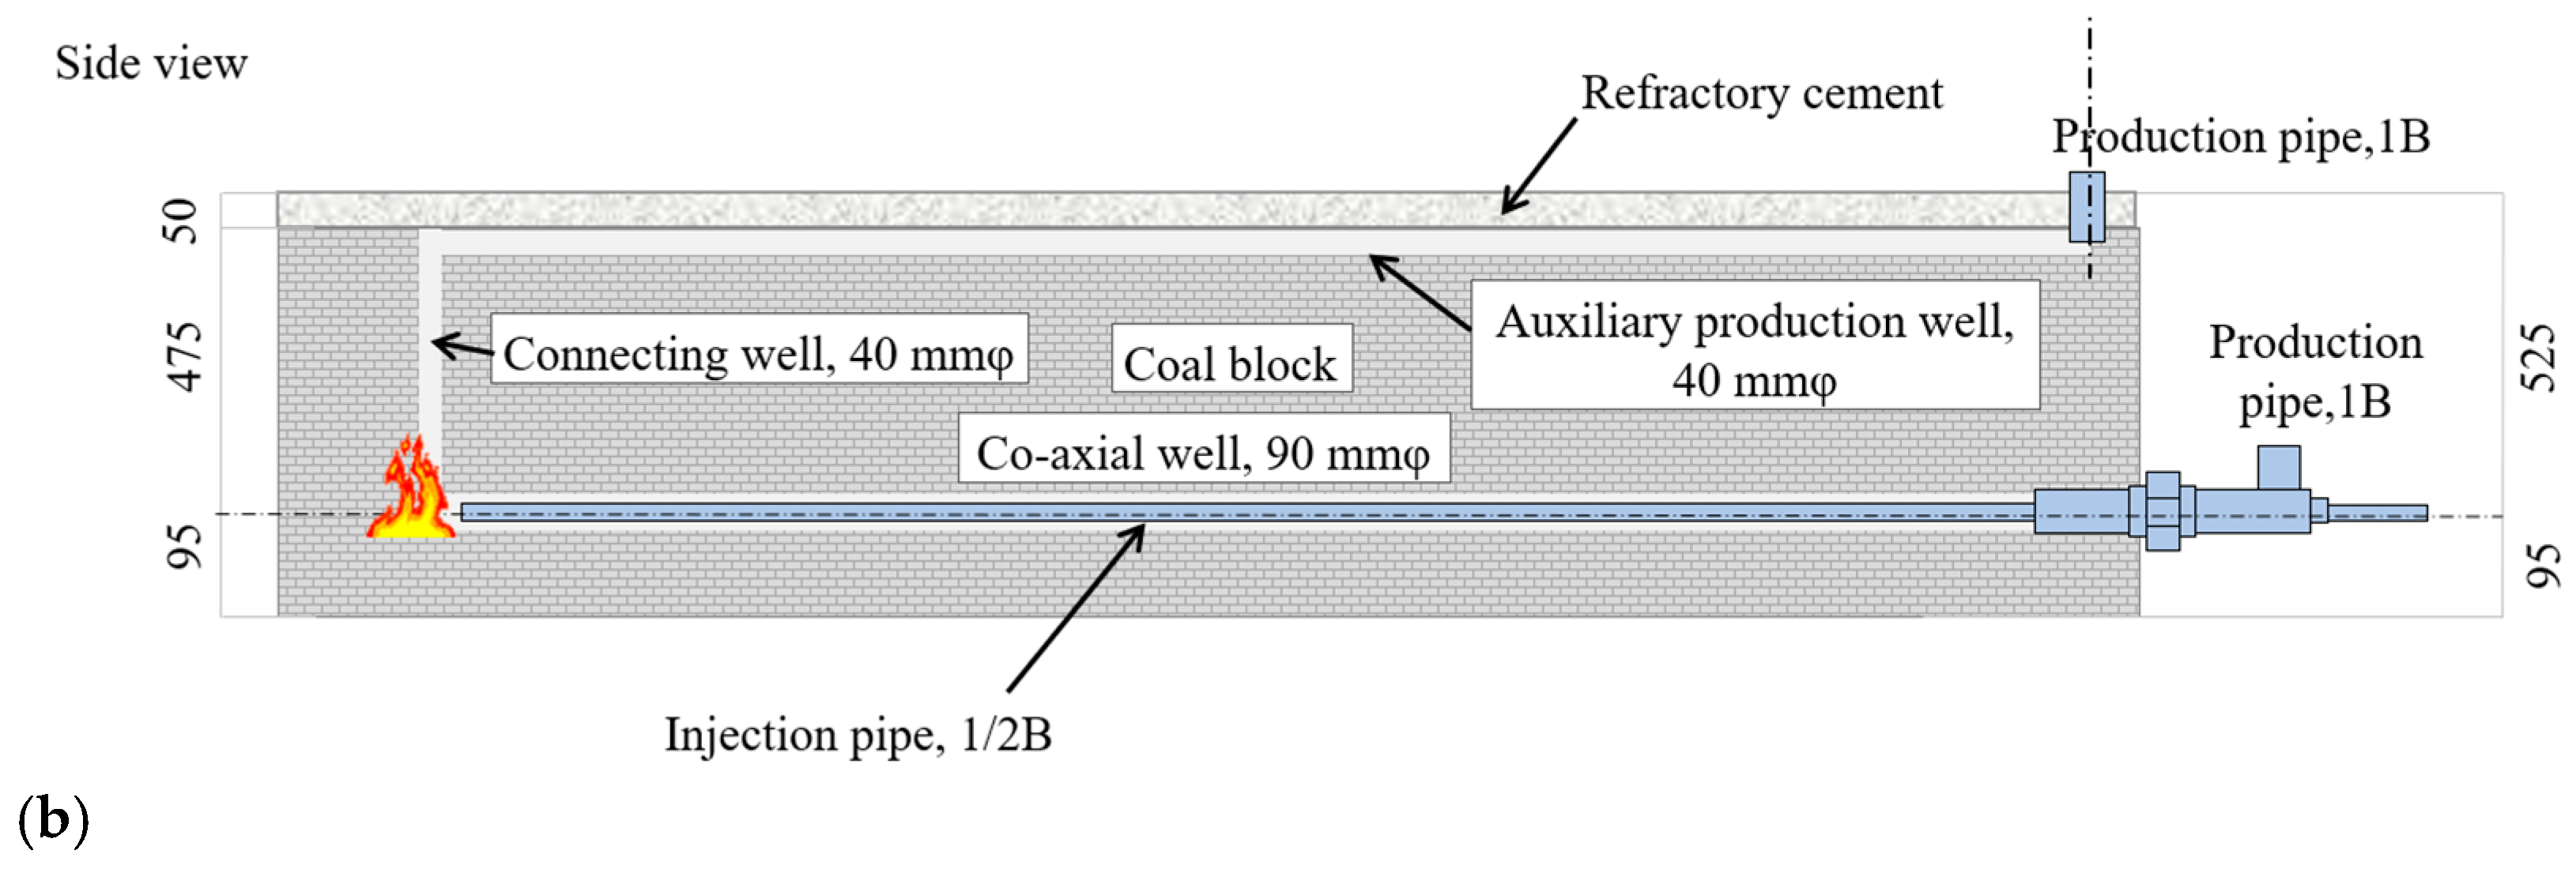
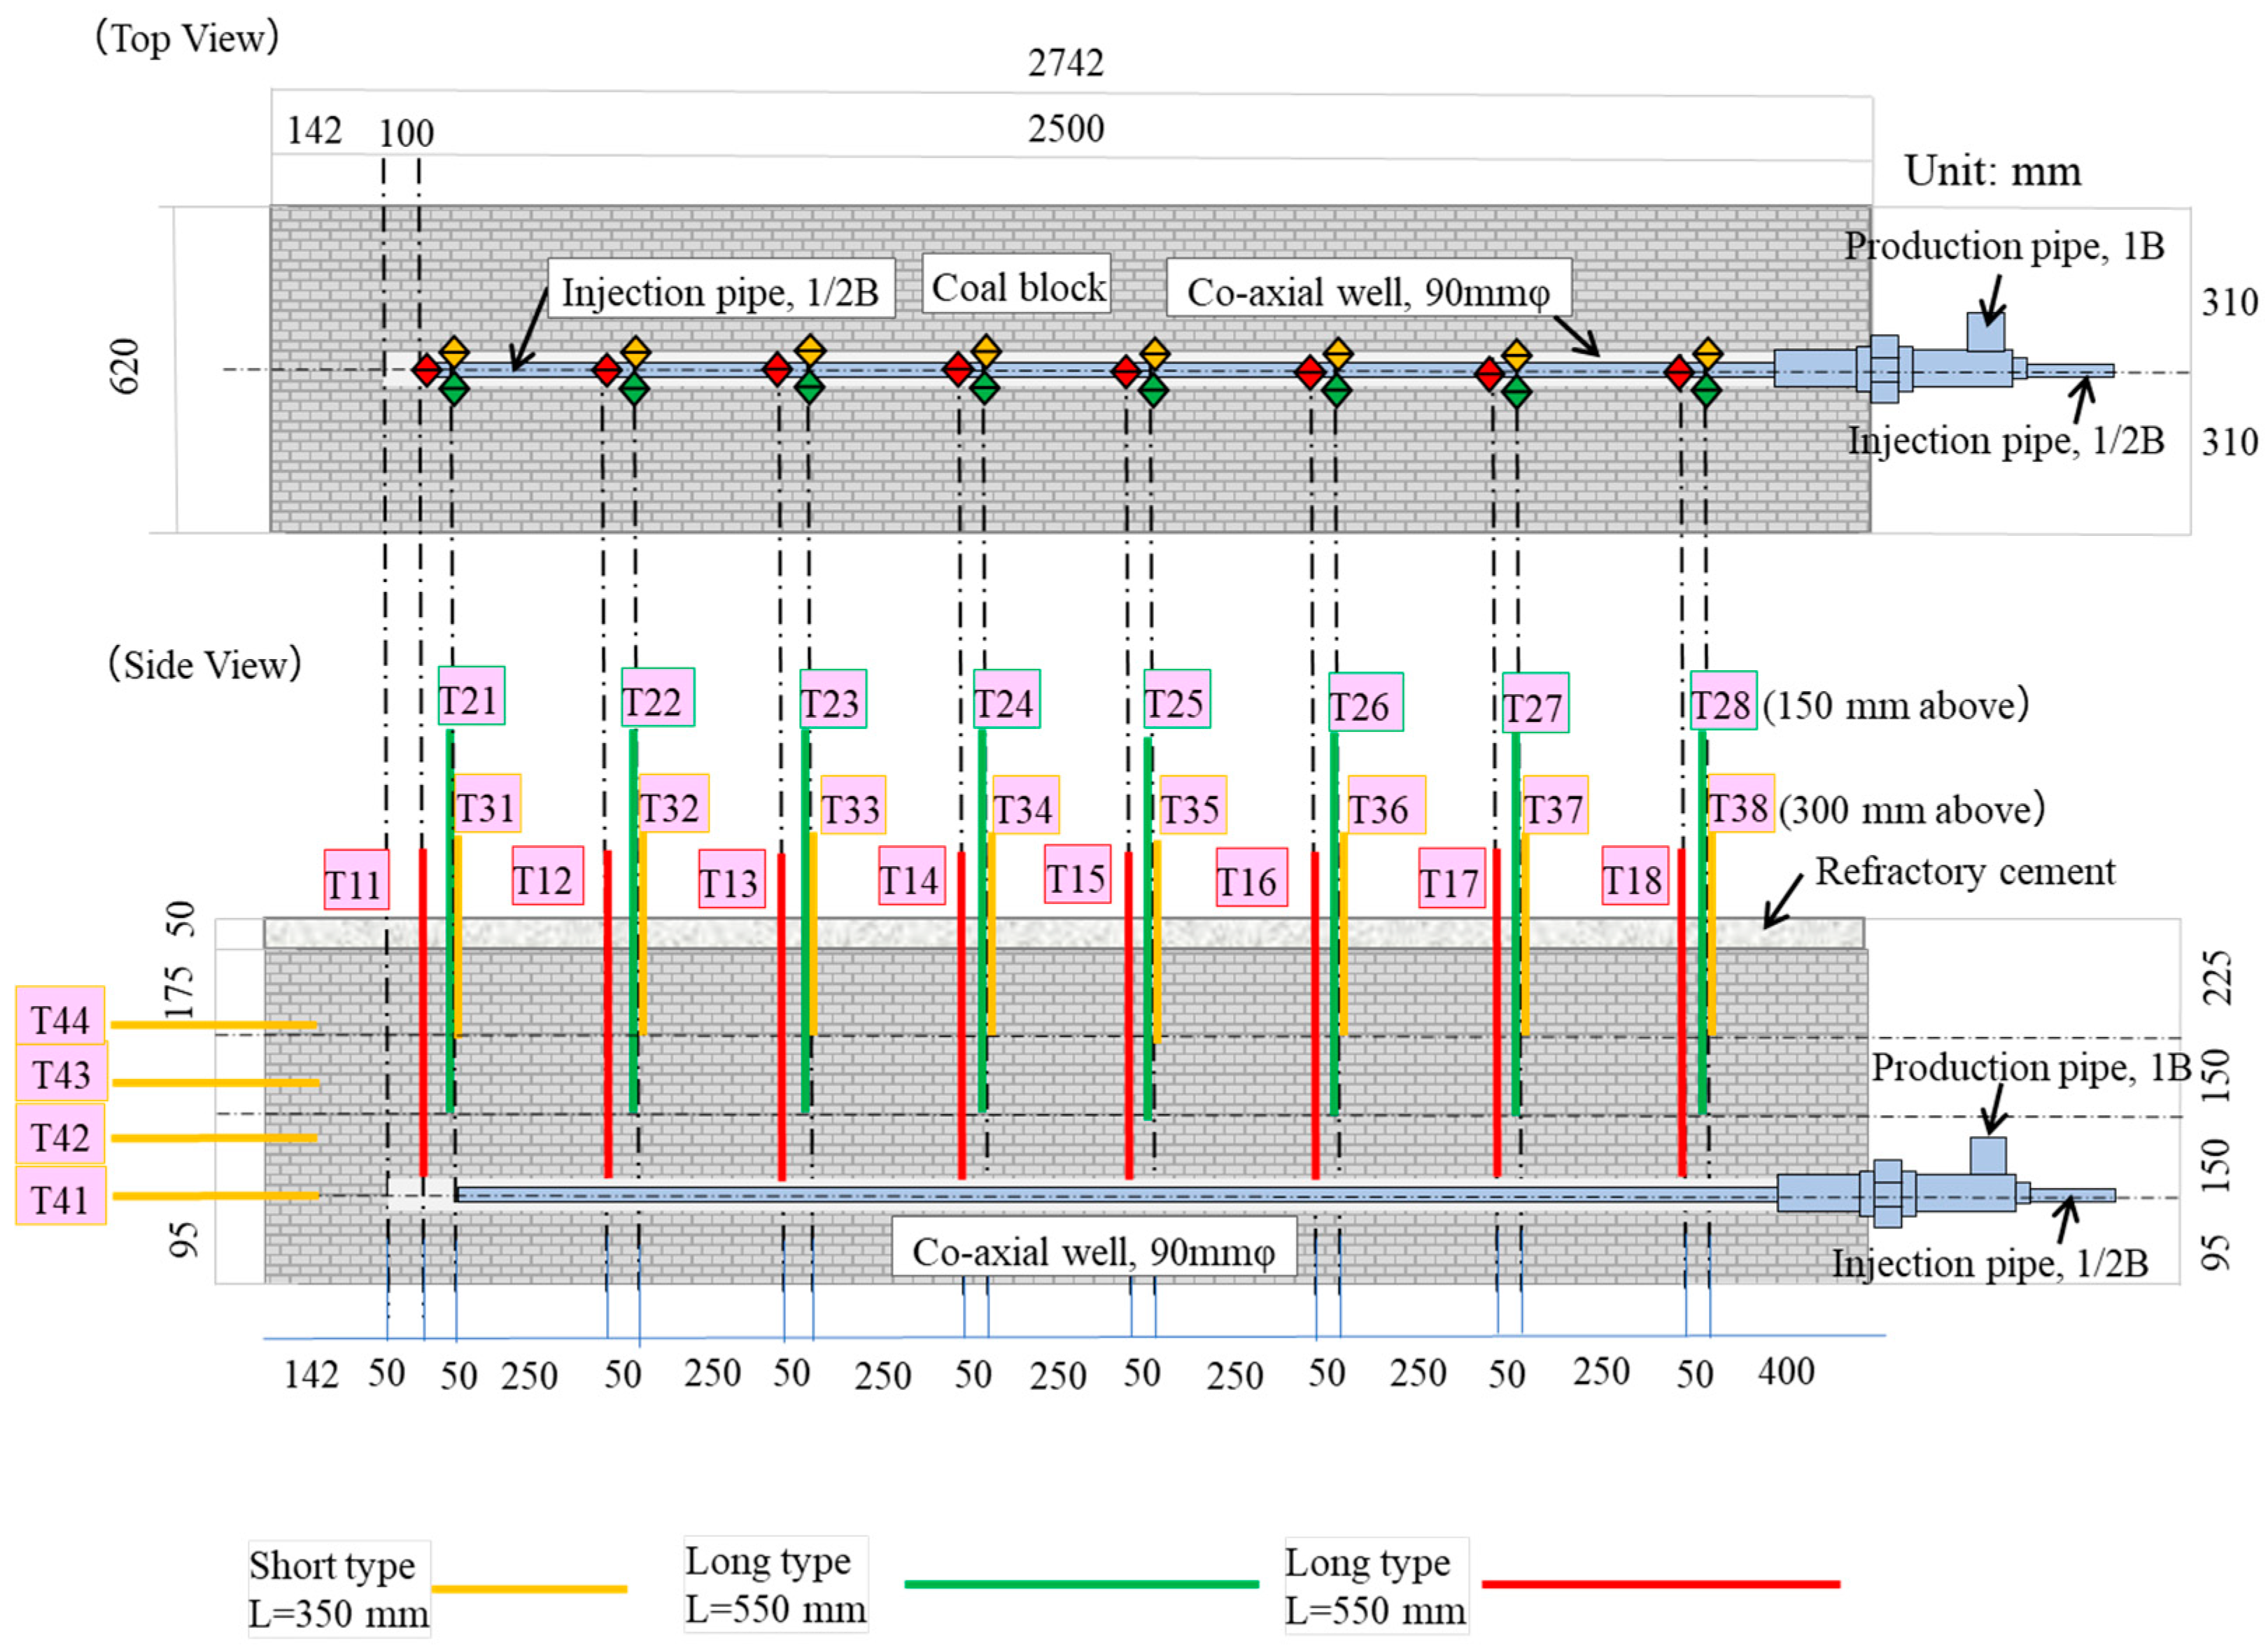
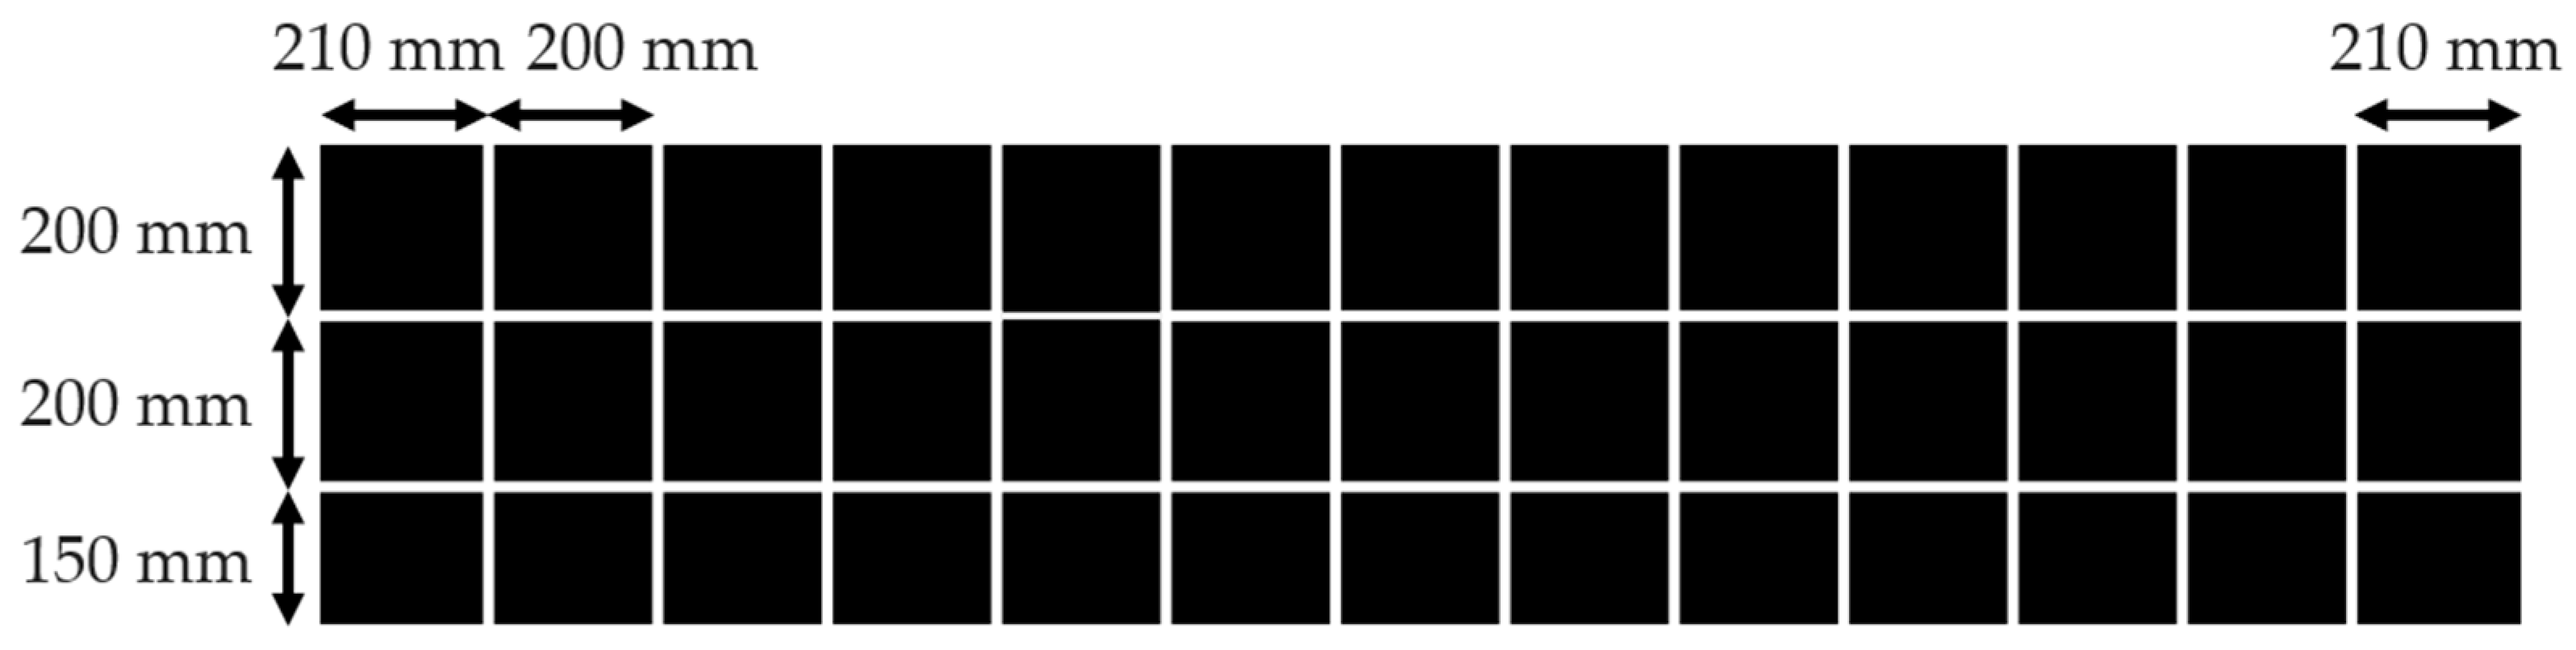
2.2. Large-Scale UCG Model Experiment
3. Results and Discussion
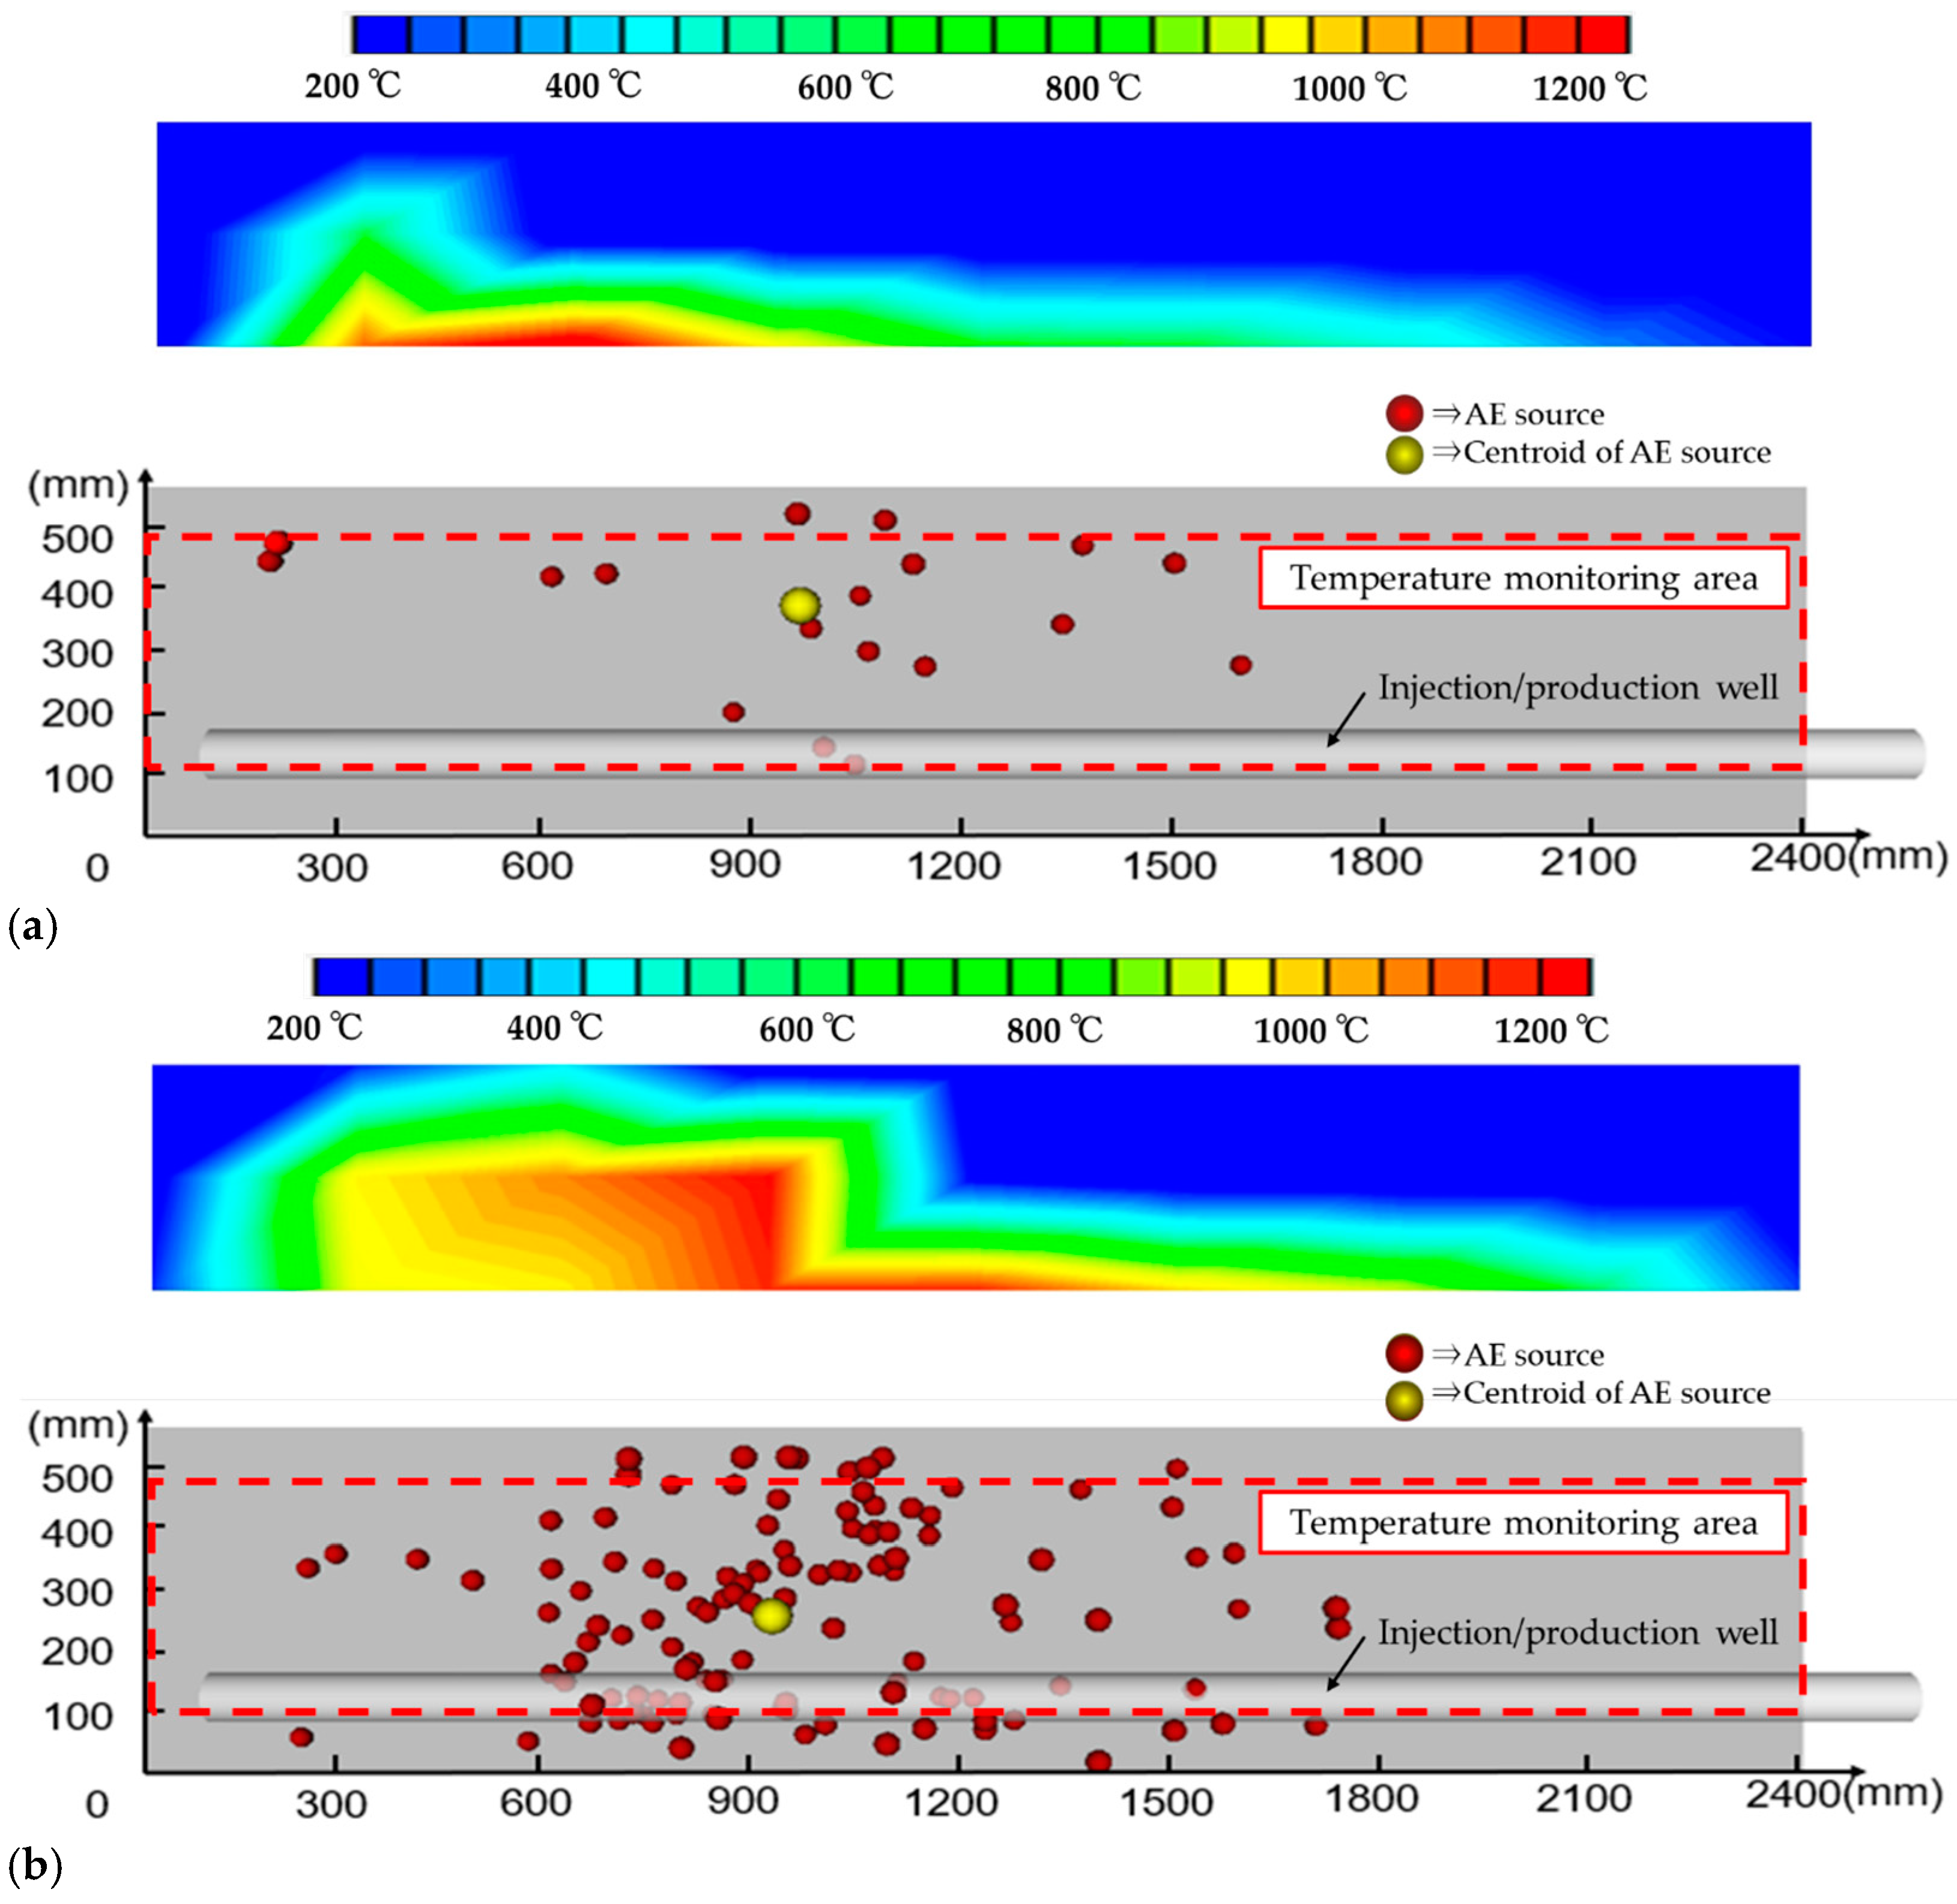
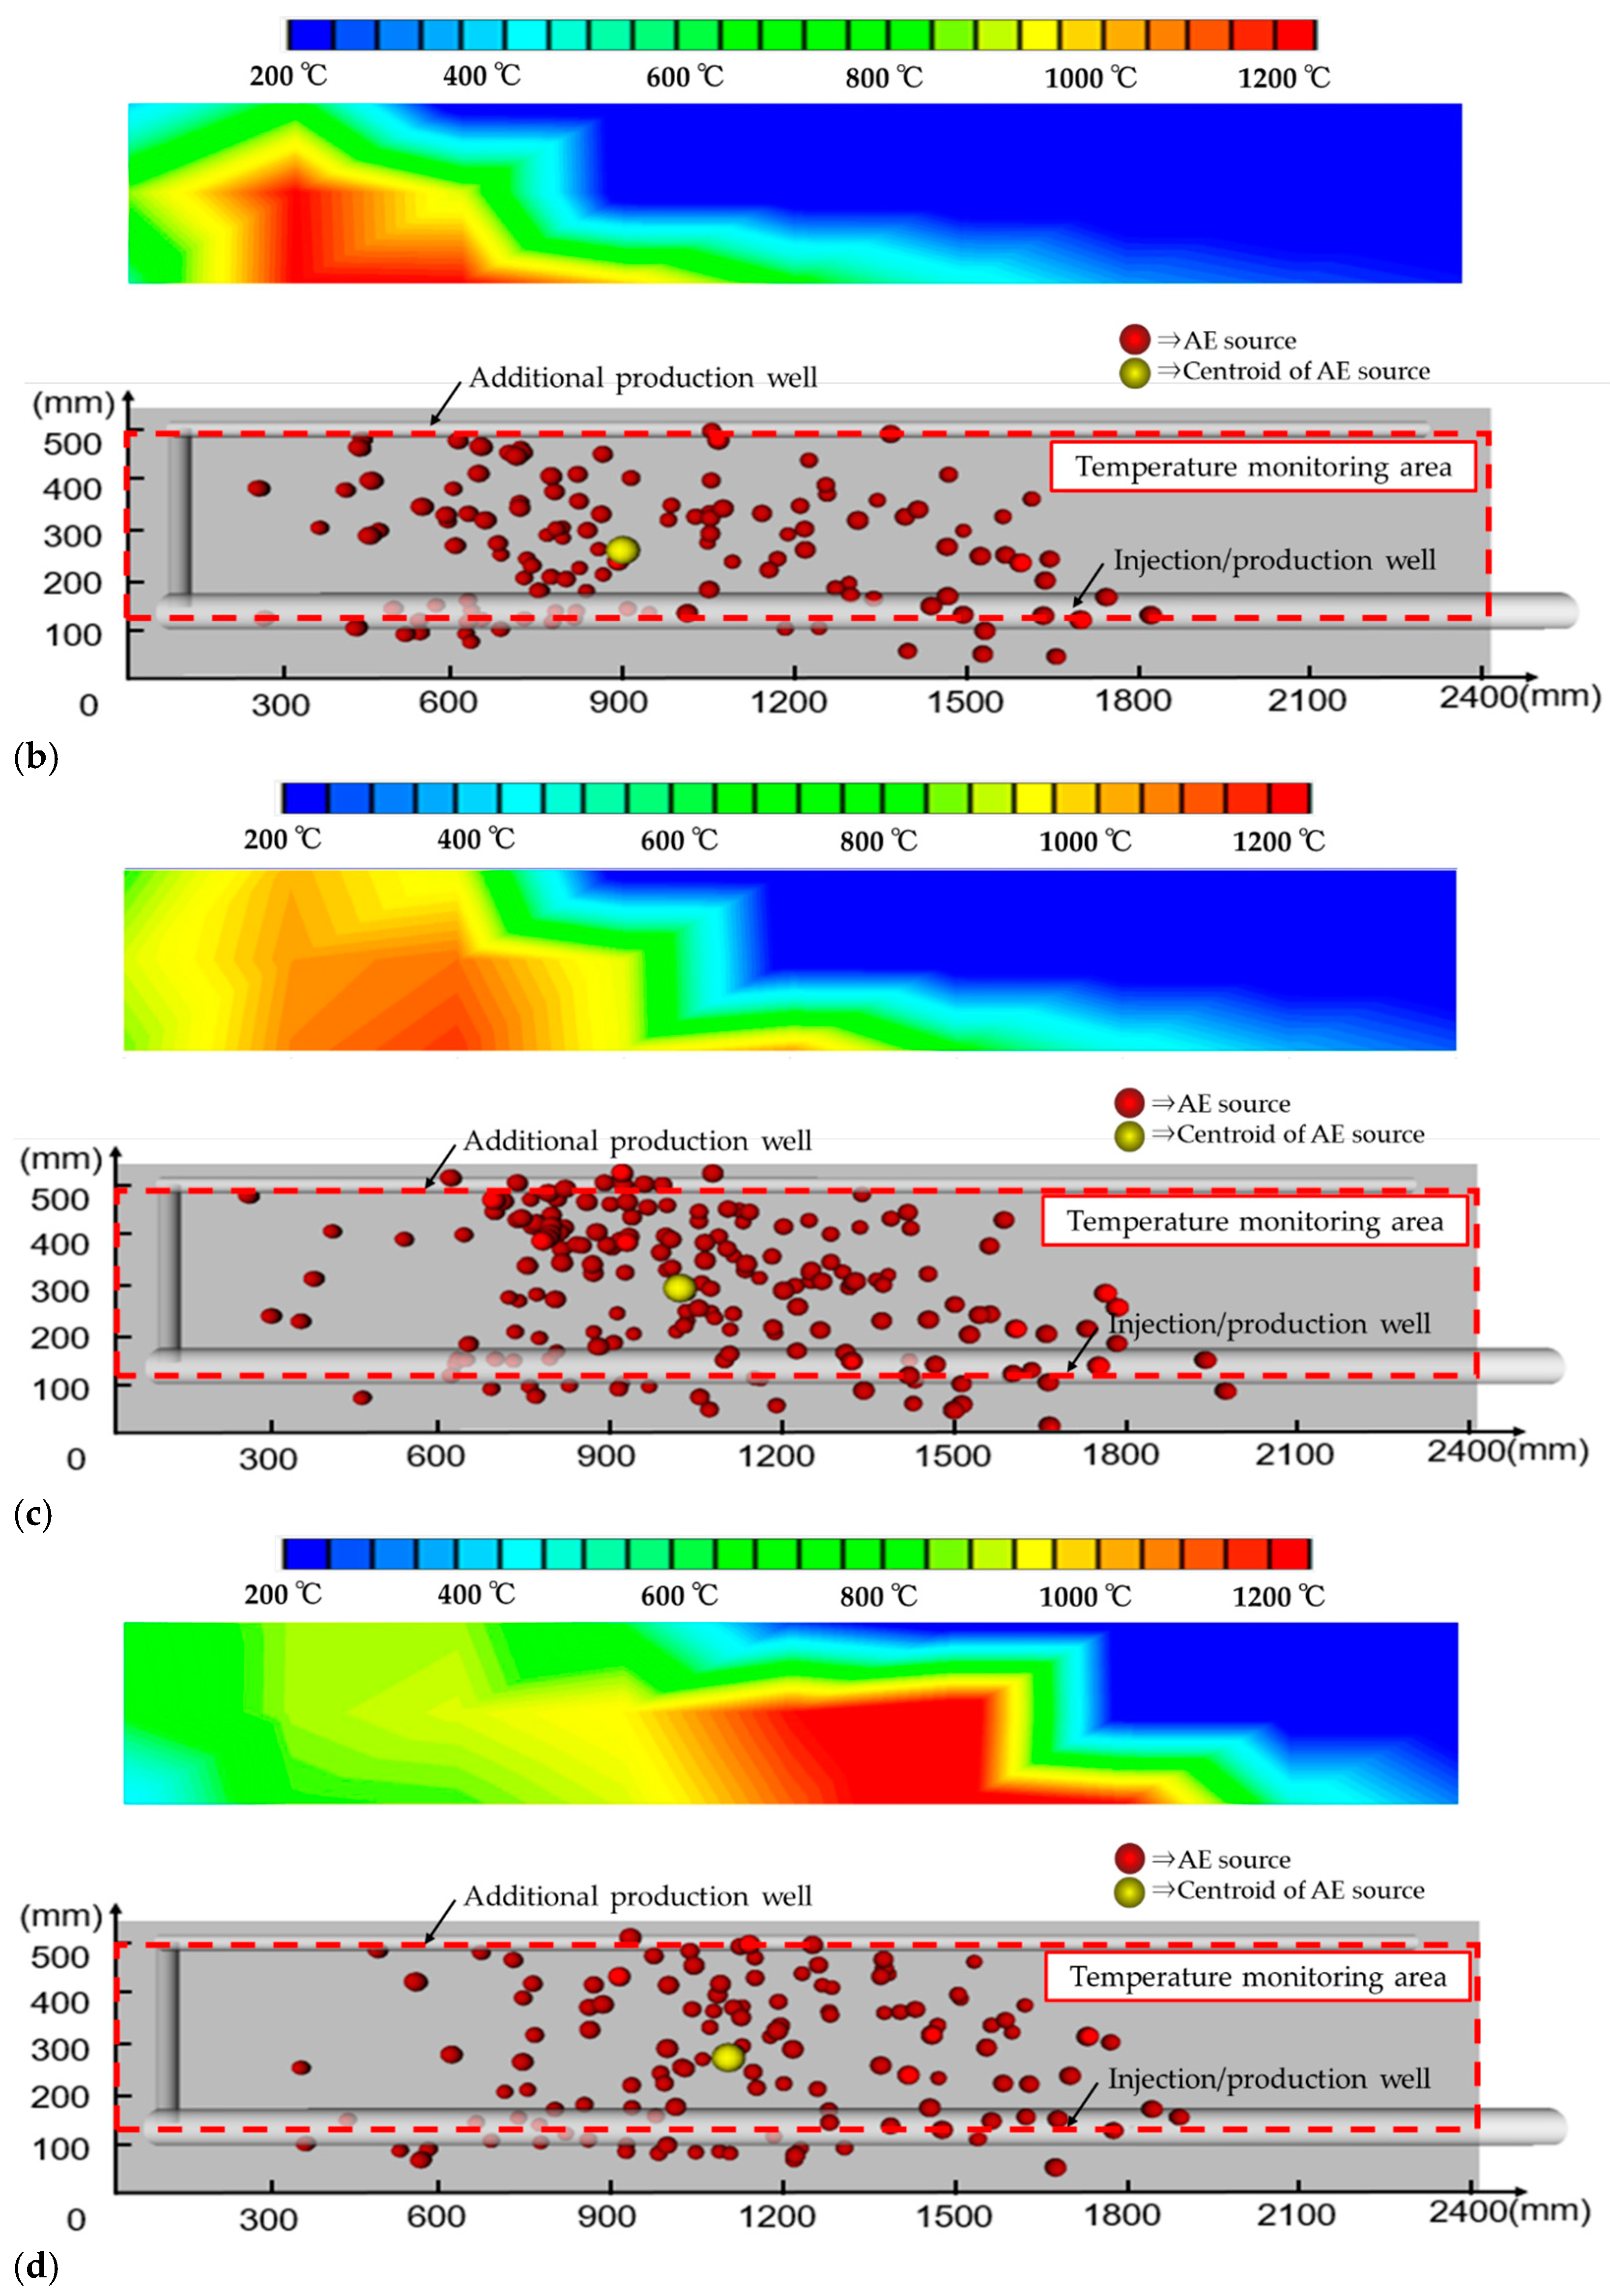
3.1. AE Source Location Analysis by Uniaxial Sensors
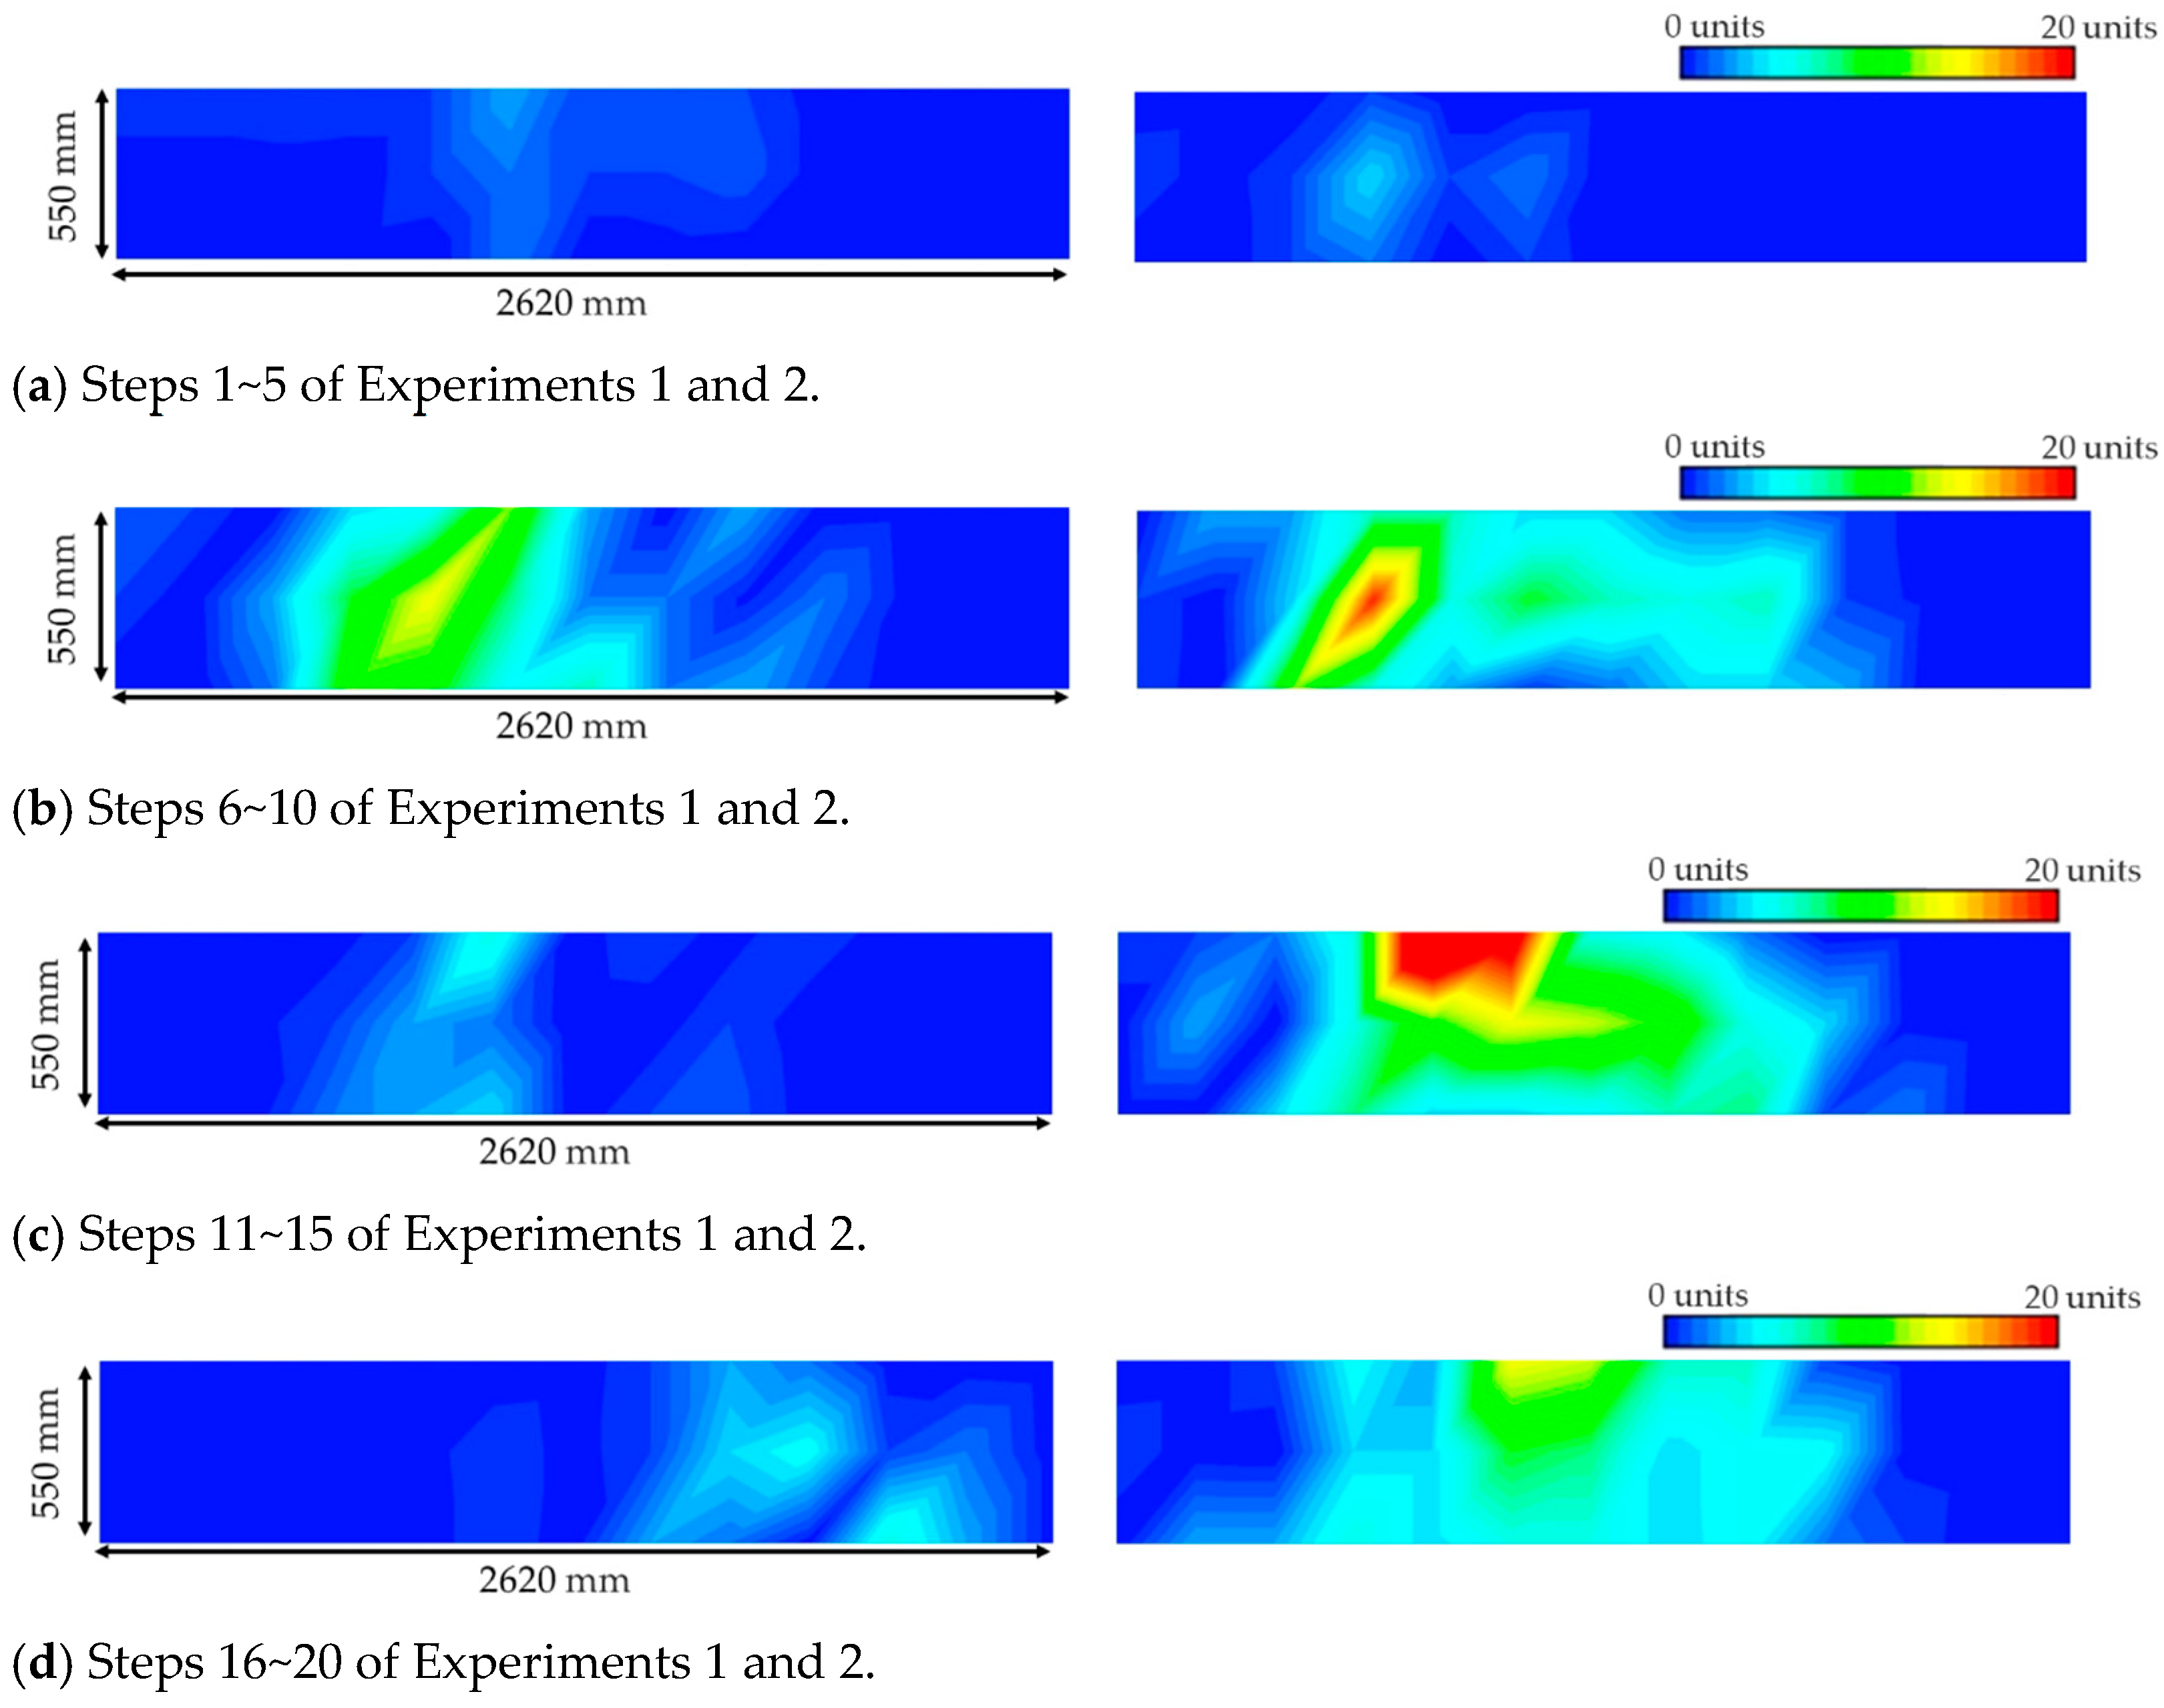
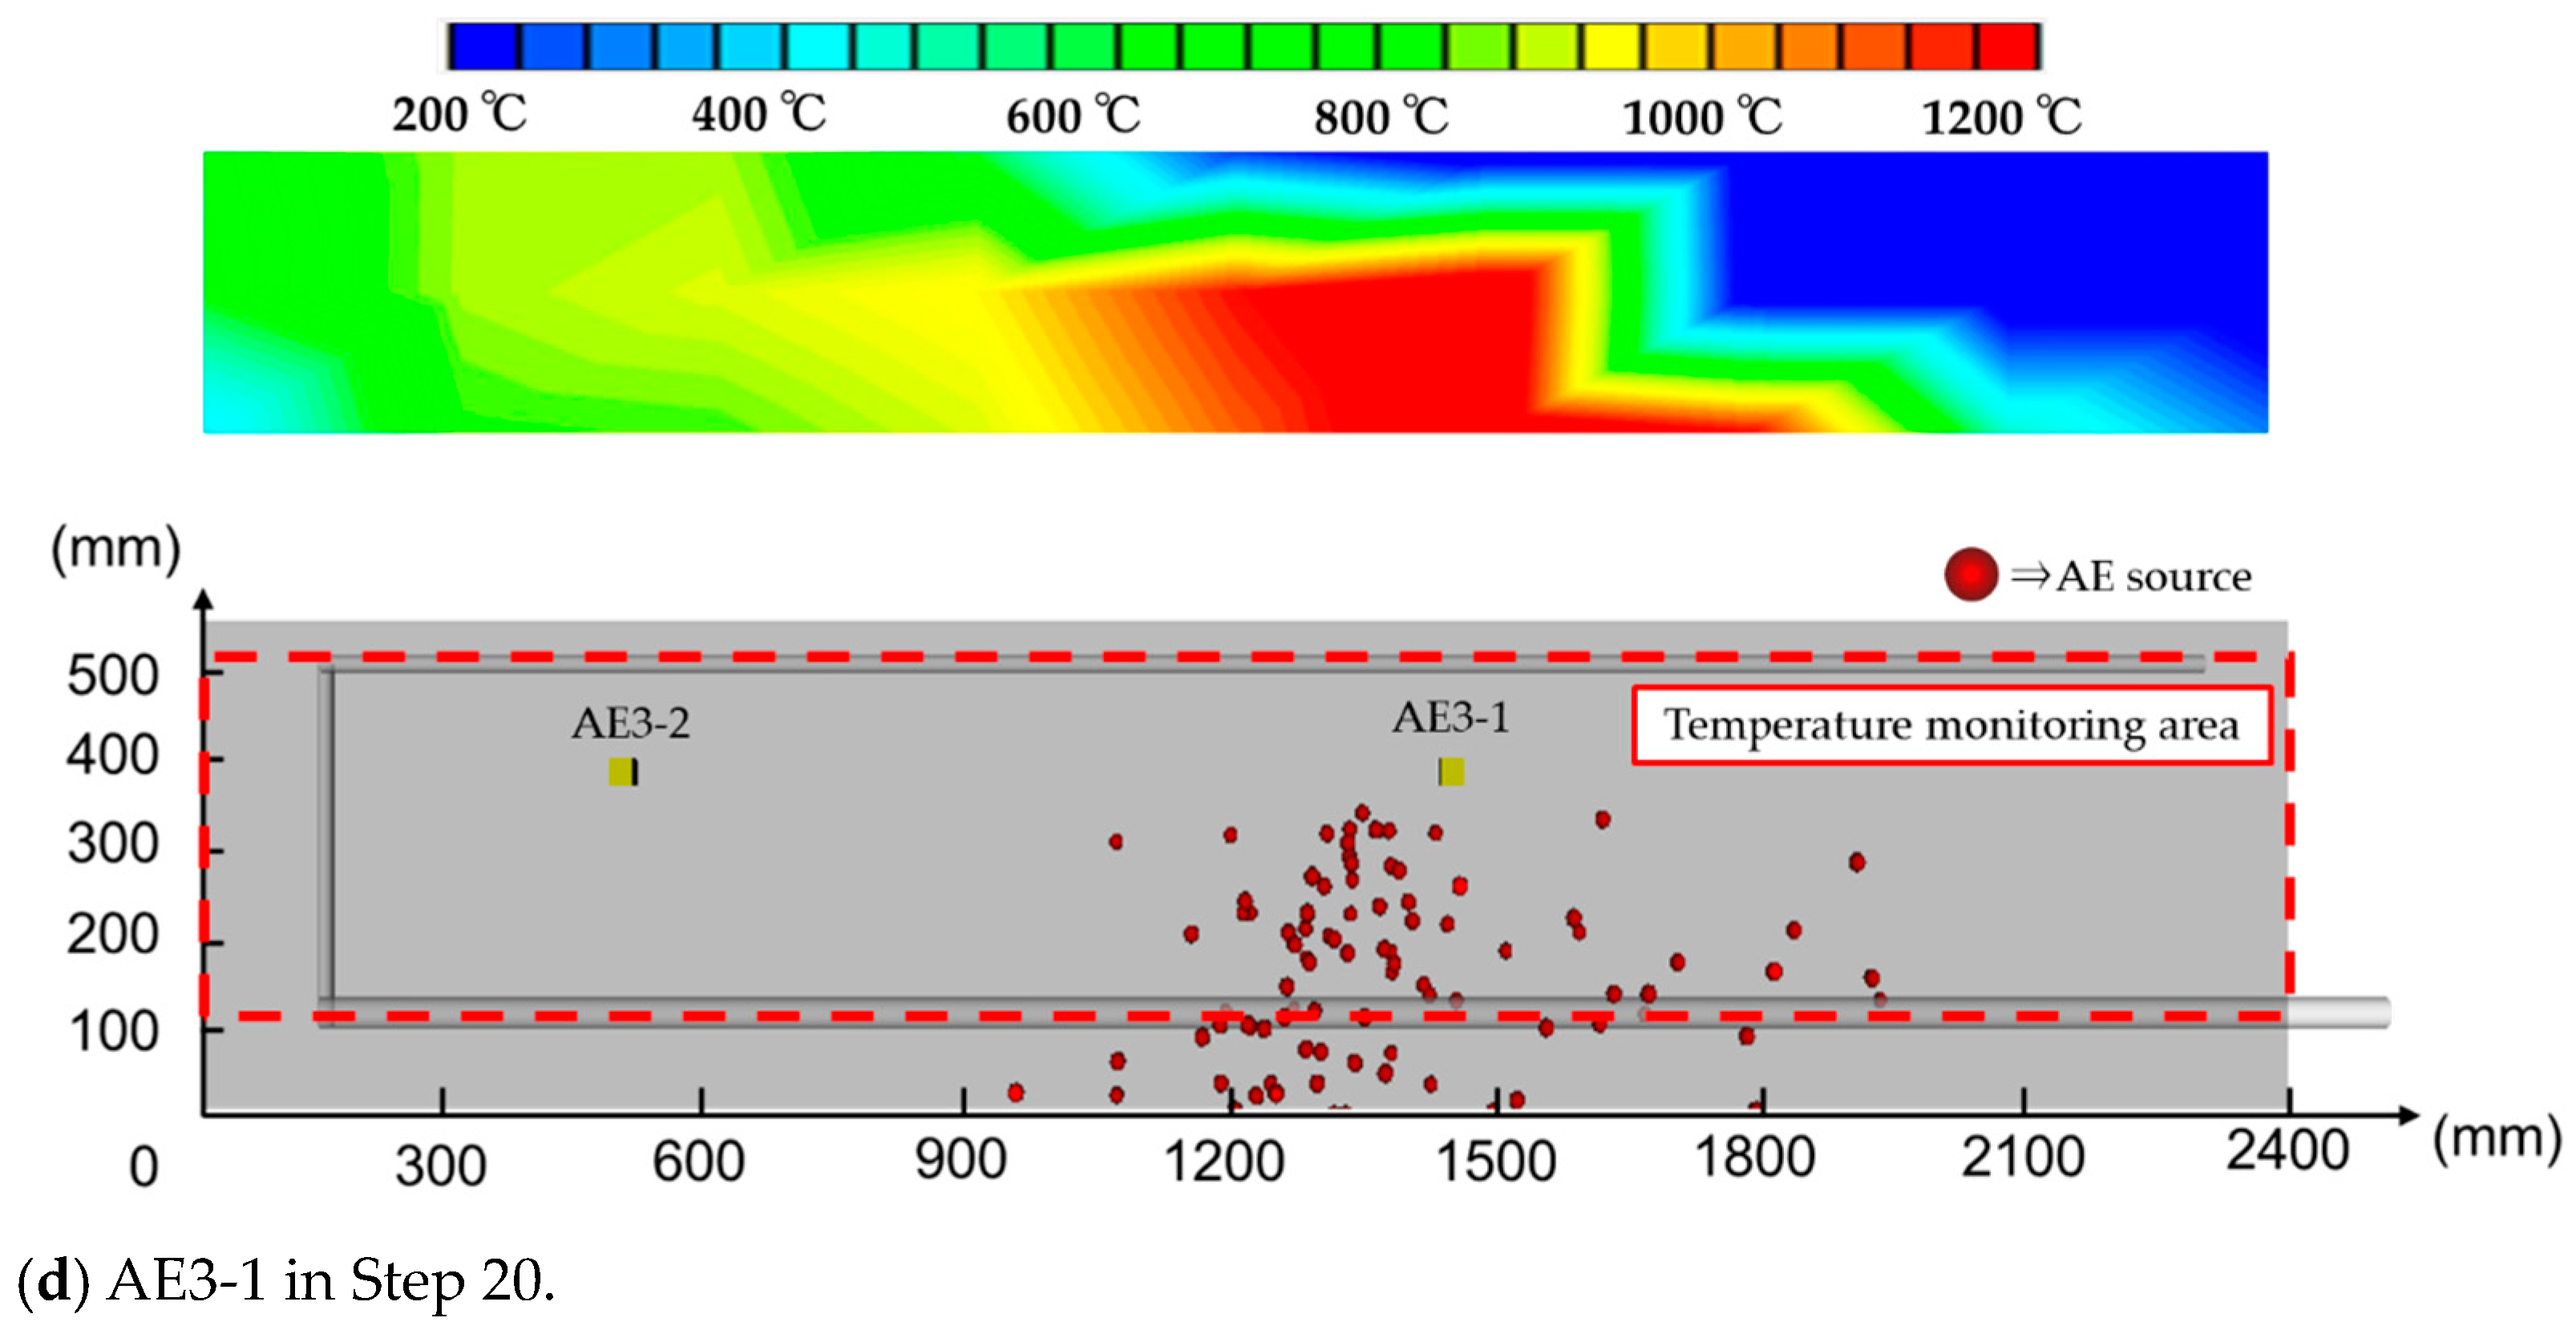
3.2. AE Source Location Analysis by Triaxial Sensor
4. Conclusions
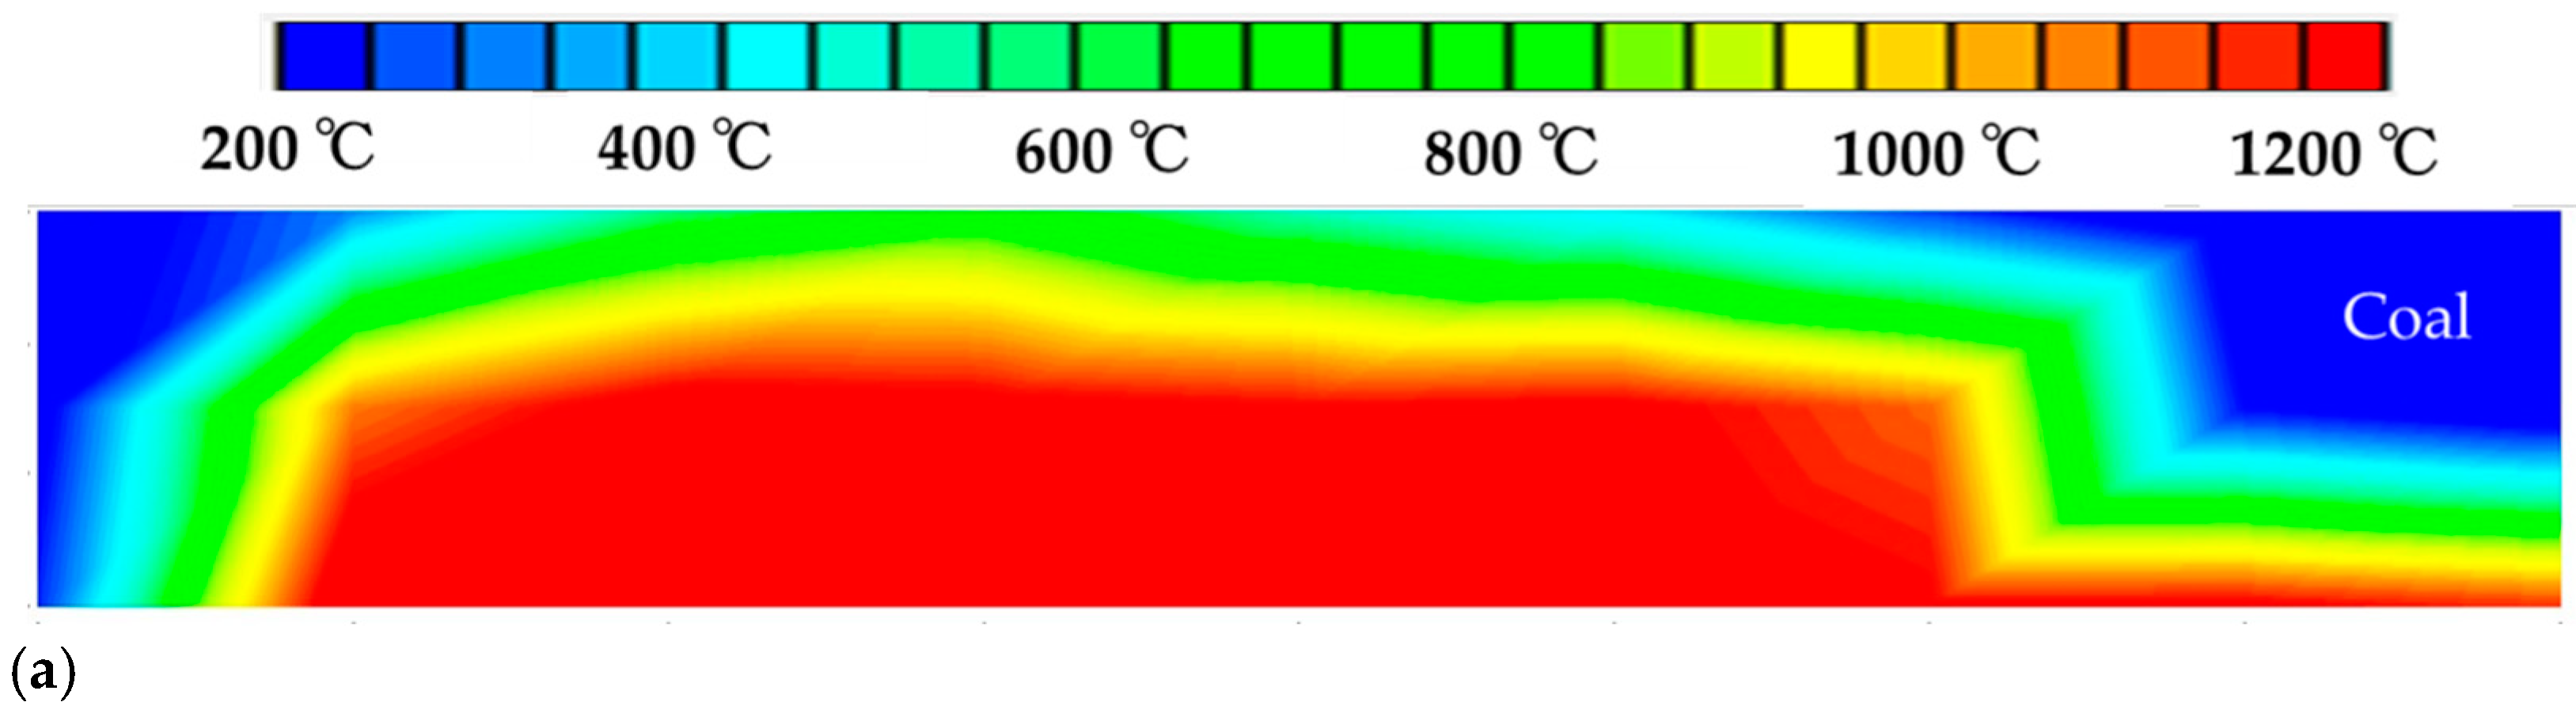
- The AE sources are located near the high-temperature zone above 1000 °C.
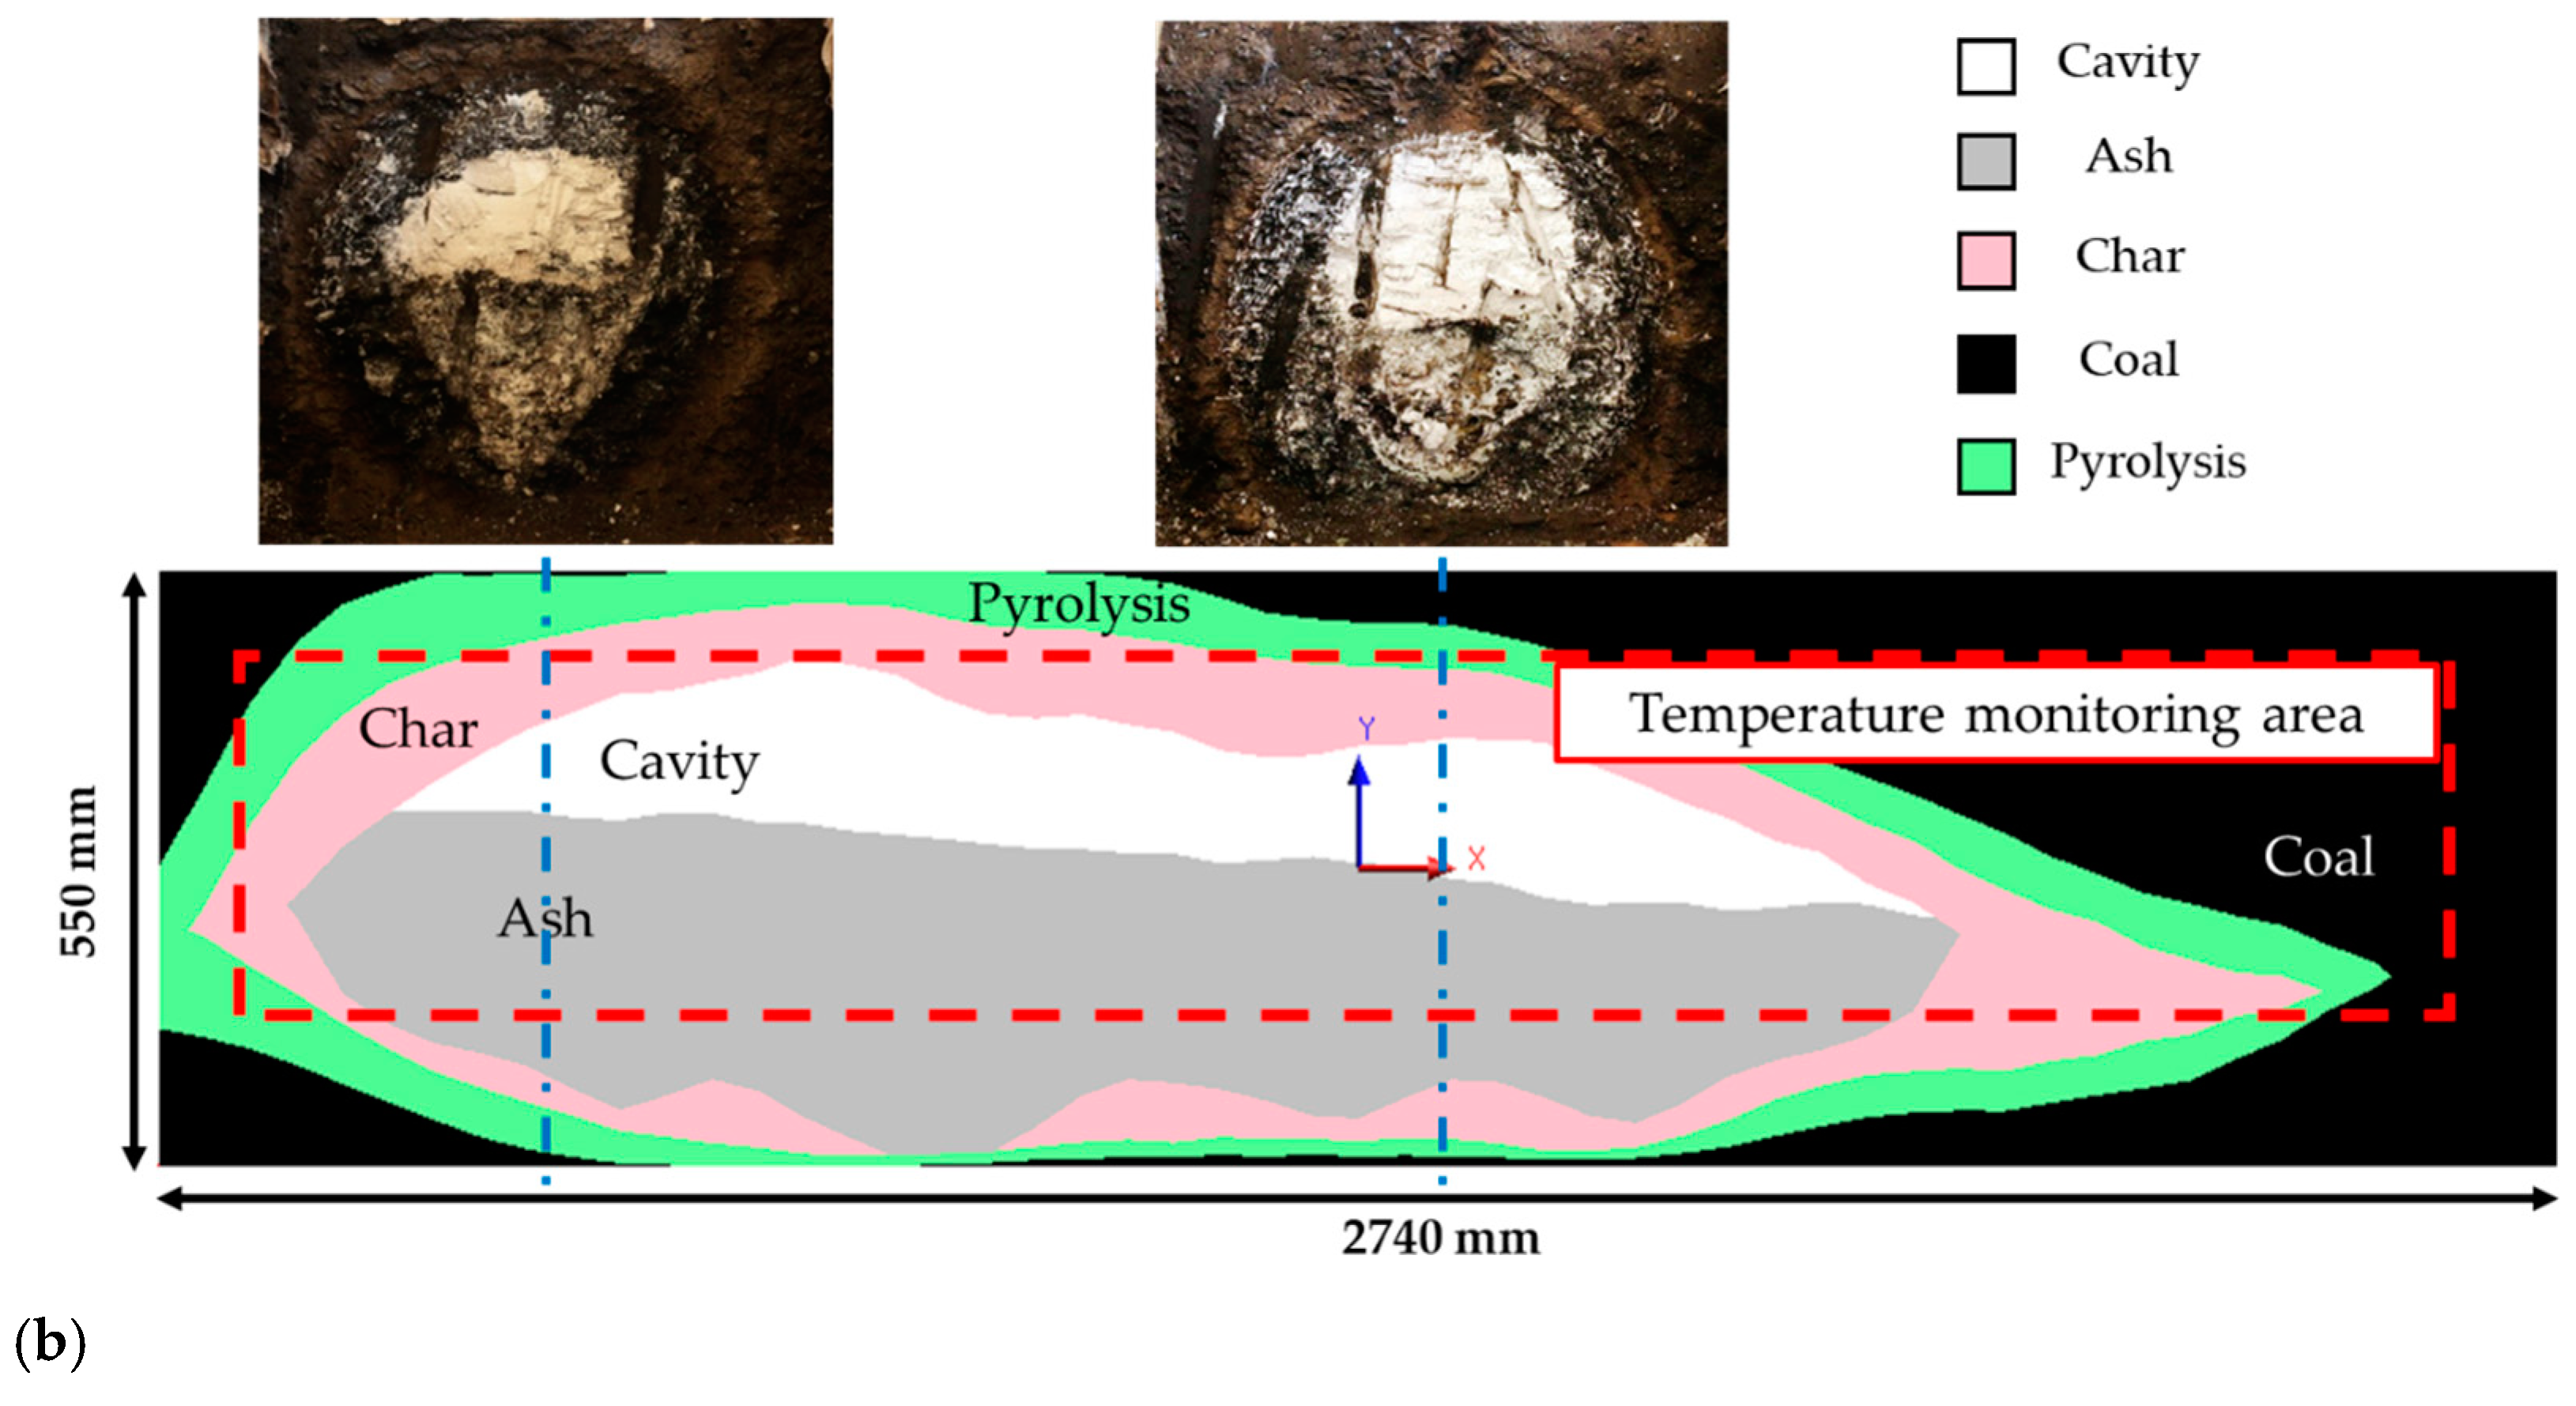
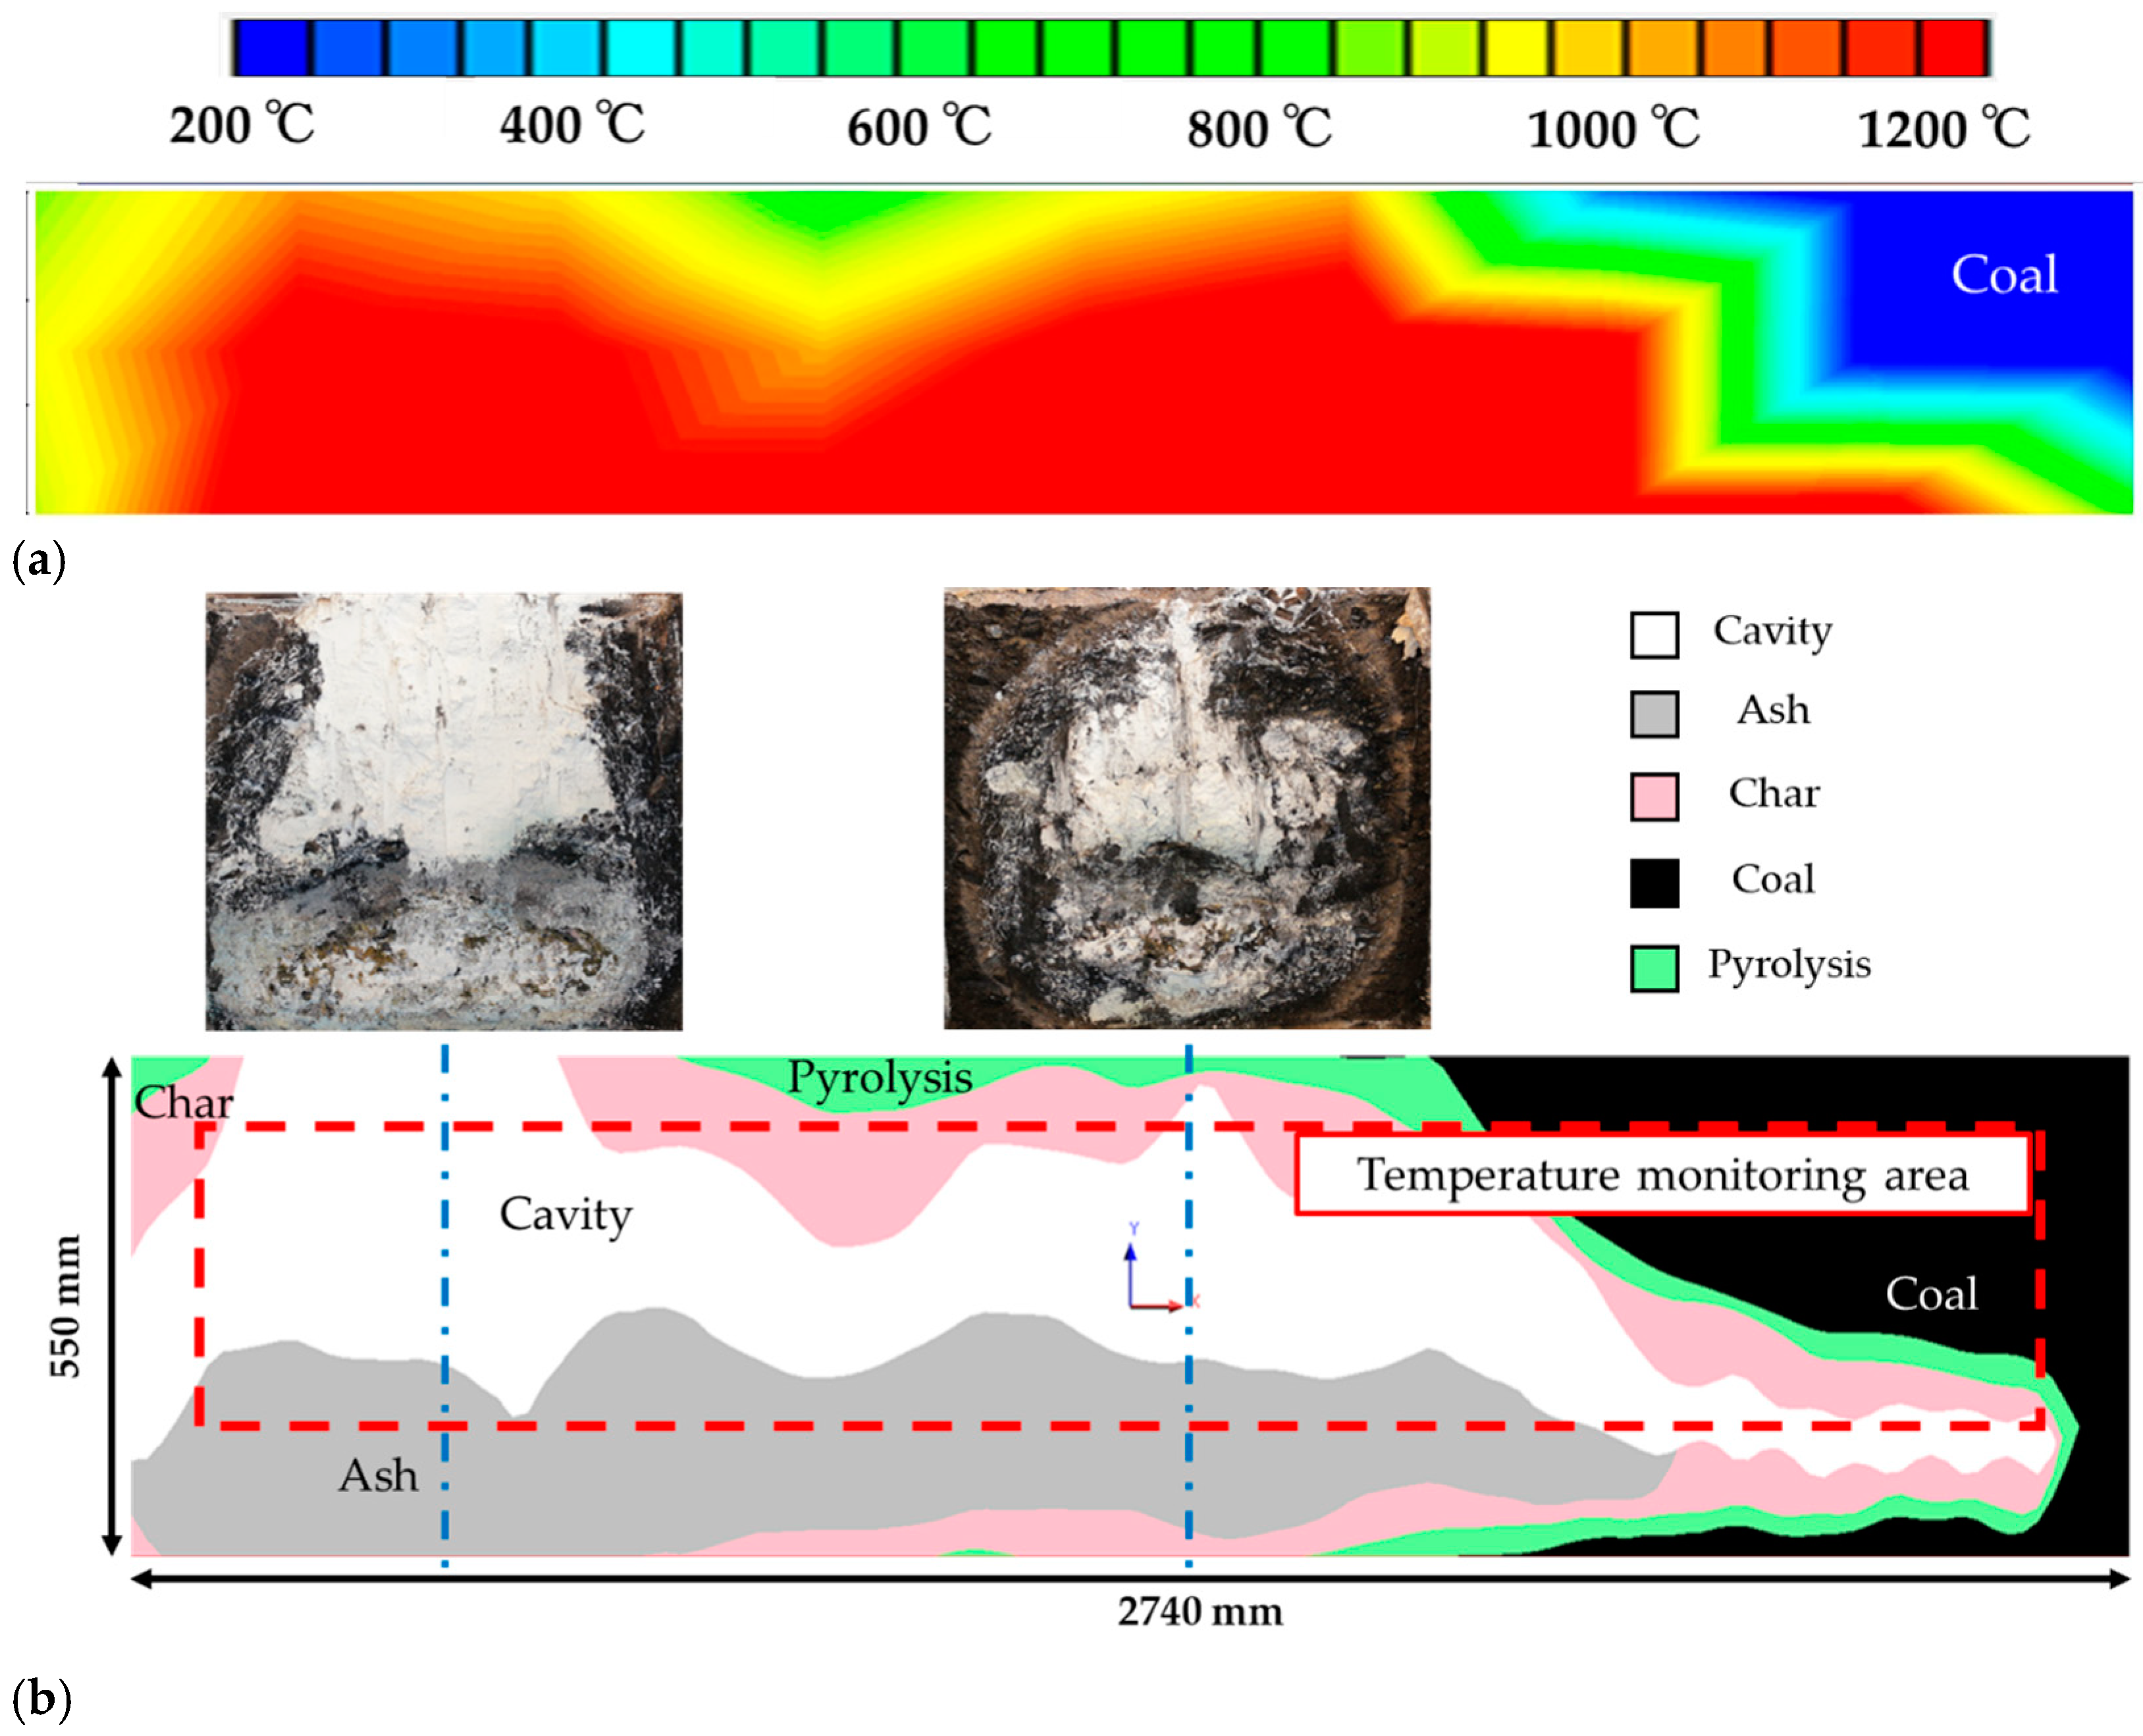
- The results of AE source location are comparable with the temperature profile; as the high-temperature zone moves and expands, the AE sources that occur around the combustion/gasification zone move and expand.
- AE profiles can be used to monitor the expansion of the coal combustion/gasification zone.
- In triaxial AE source location, the area of AE observed is limited to the area around its acceleration transducer.
- The uniaxial and triaxial AE source location can be a useful technique for monitoring the progress of the UCG reaction zone.
- It is necessary to consider the measurable range of a few triaxial acceleration transducers when applying triaxial AE source location to UCG.
- In the future, assuming a field-scale UCG system, it is necessary to develop a visualization technique for the underground coal combustion/gasification area by triaxial AE source localization, considering the measurable area of triaxial acceleration transducers.
Author Contributions
Funding
Institutional Review Board Statement
Informed Consent Statement
Data Availability Statement
Acknowledgments
Conflicts of Interest
References
- Yang, L.H.; Zhang, X.; Liu, S.Q.; Yu, L.; Zhang, W.L. Field test of large-scale hydrogen manufacturing from underground coal gasification (UCG). Int. J. Hydrogen Energy 2008, 33, 1275–1285. [Google Scholar] [CrossRef]
- Liu, S.Q.; Wang, Y.Y.; Zhao, K.; Yang, N. Enhanced-hydrogen gas production through underground gasification of lignite. Min. Sci. Technol. 2009, 19, 389–394. [Google Scholar] [CrossRef]
- Hamanaka, A.; Su, F.Q.; Itakura, K.; Takahashi, K.; Kodama, J.; Deguchi, G. Effect of Injection Flow Rate on Product Gas Quality in Underground Coal Gasification (UCG) Based on Laboratory Scale Experiment: Development of Co-Axial UCG System. Energies 2017, 10, 11. [Google Scholar] [CrossRef]
- Burchart-Korol, D.; Krawczyk, P.; Czaplicka-Kolarz, K.; Smolinski, A. Eco-efficiency of underground coal gasification (UCG) for electricity production. Fuel 2016, 173, 239–246. [Google Scholar] [CrossRef]
- Yang, D.M.; Koukouzas, N.; Green, M.; Sheng, Y. Recent development on underground coal gasification and subsequent CO2 storage. J. Energy Inst. 2016, 89, 469–484. [Google Scholar] [CrossRef]
- Khadse, A.; Qayyumi, M.; Mahajam, S.; Aghalayam, P. Underground coal gasification: A new clean coal utilization technique for India. Energy 2007, 32, 2061–2071. [Google Scholar] [CrossRef]
- Lozynskyi, V. Critical review of methods for intensifying the gas generation process in the reaction channel during underground coal gasification (UCG). Min. Miner. Depos. 2023, 17, 67–85. [Google Scholar] [CrossRef]
- Bhutto, A.W.; Bazmi, A.A.; Zahedi, G. Underground coal gasification: From fundamentals to applications. Prog. Energy Combust. Sci. 2013, 39, 189–214. [Google Scholar] [CrossRef]
- Wang, F.T.; Mead, S.W.; Stuermer, D.H. (Eds.) Groundwater Contamination Near the Hoe Creek UCG Experiments; Lawrence Livermore National Lab.: Livermore, CA, USA, 1981. [Google Scholar]
- Wang, F.T.; Mead, S.W.; Stuermer, D.H. (Eds.) Mechanisms for Groundwater Contamination by UCG—Preliminary Conclusions from the Hoe Creek Study; Sandia National Laboratories (Technical Report) SAND: Albuquerque, NM, USA, 1982. [Google Scholar]
- Perkins, G. Underground coal gasification—Part I: Field demonstrations and process performance. Prog. Energy Combust. Sci. 2018, 67, 158–187. [Google Scholar] [CrossRef]
- Lockner, D. The role of acoustic emission in the study of rock fracture. In International Journal of Rock Mechanics and Mining Sciences & Geomechanics Abstracts; Pergamon: Bergama, Turkey, 1993; Volume 30, pp. 883–899. [Google Scholar]
- Jiang, C.; Wang, Y.; Duan, M.; Guo, X.; Chen, Y.; Yang, Y. Experimental study on the evolution of pore-fracture structures and mechanism of permeability enhancement in coal under cyclic thermal shock. Fuel 2021, 304, 121455. [Google Scholar] [CrossRef]
- Naka, R.; Tatekawa, T.; Kodama, J.I.; Sugawara, T.; Itakura, K.I.; Hamanaka, A.; Deguchi, G. (Eds.) Thermal stress analysis on small-scale model experiment for development of underground coal gasification. In Proceedings of the ISRM International Symposium—10th Asian Rock Mechanics Symposium, Singapore, 29 October–3 November 2018; ARMS: Waltham, MA, USA, 2018. [Google Scholar]
- Kasani, H.A.; Chalaturnyk, R.J. Influence of High Pressure and Temperature on the Mechanical Behavior and Permeability of a Fractured Coal. Energies 2017, 10, 854. [Google Scholar] [CrossRef]
- Yangsheng, Z.; Fang, Q.; Zhijun, W.; Yuan, Z.; Weiguo, L.; Qiaorong, M. Experimental investigation on correlation between permeability variation and pore structure during coal pyrolysis. Transp. Porous Media 2010, 82, 401–412. [Google Scholar] [CrossRef]
- Liu, S.Q.; Zhang, S.J.; Chen, F.; Wang, C.H.; Liu, M.Y. Variation of Coal Permeability under Dehydrating and Heating: A Case Study of Ulanqab Lignite for Underground Coal Gasification. Energy Fuels 2014, 28, 6869–6876. [Google Scholar] [CrossRef]
- Matsudaira, K.; Nishimura, M.; Asada, S. Control of breaking strength of CO2 reacted coke by crushing operation of coal. Curr. Adv. Mater. Process. 1998, 11, 843. [Google Scholar]
- Ding, R.; Sun, Q.; Xue, S.Z.; Shi, Q.M.; Ge, Z.L.; Li, D.L. Experimental study on acoustic emission characteristics of high-temperature thermal damage in an oxygen-rich environment of long flame coal. J. Therm. Anal. Calorim. 2022, 147, 11391–11400. [Google Scholar] [CrossRef]
- Wang, Z.Q.; Xu, X.Y.; Cui, Y. Effect of Fixed and Removable Gas-Injection Patterns on the Expansion of Reaction Zones during Underground Coal Gasification. Energy Fuels 2019, 33, 4740–4747. [Google Scholar] [CrossRef]
- Wang, Z.Q.; Liang, J.; Shi, L.X.; Xi, J.F.; Li, S.; Cui, Y. Expansion of three reaction zones during underground coal gasification with free and percolation channels. Fuel 2017, 190, 435–443. [Google Scholar] [CrossRef]
- Tatiana, S.; Igor, G.; Alexey, B. Control of combustion area using electrical resistivity method for underground coal gasification. Int. J. Min. Sci. Technol. 2012, 22, 351–355. [Google Scholar]
- Mellors, R.; Yang, X.; White, J.A.; Ramirez, A.; Wagoner, J.; Camp, D.W. Advanced geophysical underground coal gasification monitoring. Mitig. Adapt Strateg. Glob Chang. 2016, 21, 487–500. [Google Scholar] [CrossRef]
- Perkins, G. Underground coal gasification—Part II: Fundamental phenomena and modeling. Prog. Energy Combust. Sci. 2018, 67, 234–274. [Google Scholar] [CrossRef]
- Samdani, G.; Aghalayam, P.; Ganesh, A.; Sapru, R.K.; Lohar, B.L.; Mahajani, S. A process model for underground coal gasification—Part-I: Cavity growth. Fuel 2016, 181, 690–703. [Google Scholar] [CrossRef]
- Su, F.Q.; Wu, J.B.; Deng, Q.C.; Yu, Y.H.; Hamanaka, A.; Dai, M.J.; Yang, J.N.; He, X.L. Study on the monitoring method of cavity growth in underground coal gasification under laboratory conditions. Energy 2023, 263, 126048. [Google Scholar] [CrossRef]
- Ohno, K.; Shimozono, Y.; Sawada, Y.; Ohtsu, M. Automatic Detection of AE First Mortion Based on AIC Picker for SiGMA Analysis. J. Jpn. Soc. Non-Destr. Insp. 2008, 57, 531–536. [Google Scholar]
- Hardy, H.R. Acoustic Emission/Microseismic Activity Volume 1, 1st ed.; CRC Press: London, UK, 2003. [Google Scholar]


| Calorific Value (MJ/kg) | Proximate Analysis (wt%) | Ultimate Analysis (wt%) | ||||||||
|---|---|---|---|---|---|---|---|---|---|---|
| Moisture | Ash | Volatiles | Fixed Carbon | C | H | N | S | O | ||
| Experiment 1 | 24.4 | 4.2 | 22.2 | 34.0 | 39.6 | 61.5 | 4.46 | 1.28 | - | 9.54 |
| Experiment 2 | 24.6 | 4.7 | 20.7 | 33.5 | 41.1 | 62.4 | 4.55 | 1.27 | 0.04 | 10.0 |
| Experiment 1 | Experiment 2 (with Auxiliary Production Well) | ||||
|---|---|---|---|---|---|
| Step | Time (h) | Injection Location (mm) | Step | Time (h) | Injection Locatione (mm) |
| 1~5 | 1~17 | 150~350 | 1~5 | 1~13 | 100~300 |
| 6~10 | 17~46 | 350~800 | 6~10 | 13~31 | 300~500 |
| 11~15 | 46~71 | 800~1300 | 11~15 | 31~56 | 500~900 |
| 16~20 | 71~91 | 1300~1800 | 16~20 | 56~81 | 900~1400 |
| Experiment 1 (without Auxiliary Production Well) | Step 0 | Steps 1~5 | Steps 6~10 | Steps 11~15 | Steps 16~20 |
|---|---|---|---|---|---|
| Location of center of gravity (mm) | 0.0 | 975.0 | 950.0 | 1100.0 | 1750.0 |
| Start time (h) | 0 | 1 | 17 | 46 | 71 |
| End time (h) | 1 | 17 | 46 | 71 | 91 |
| Intermediate time (h) | 0.5 | 9 | 31.5 | 58.5 | 81 |
| Movement rate (mm/h) | - | 115 | −1.11 | 5.56 | 28.9 |
| Experiment 2 (with Auxiliary Production Well) | Step 0 | Steps 1~5 | Steps 6~10 | Steps 11~15 | Steps 16~20 |
|---|---|---|---|---|---|
| Location of center of gravity (mm) | 0.0 | 650.0 | 950.0 | 1012.5 | 1112.5 |
| Start time (h) | 0 | 1 | 13 | 31 | 56 |
| End time (h) | 1 | 13 | 31 | 56 | 81 |
| Intermediate time (h) | 0.5 | 7 | 22 | 43.5 | 68.5 |
| Movement rate (mm/h) | - | 100 | 20.0 | 2.91 | 4.00 |
| Experiment 1 (without Auxiliary Production Well) | Step 0 | Steps 1~5 | Steps 6~10 | Steps 11~15 | Steps 16~20 |
|---|---|---|---|---|---|
| Location of temperature range above 1000 °C (mm) | 0.0 | 350.0 | 700.0 | 1850.0 | 2150.0 |
| Start time (h) | 0 | 1 | 17 | 46 | 71 |
| End time (h) | 1 | 17 | 46 | 71 | 91 |
| Intermediate time (h) | 0.5 | 9 | 31.5 | 58.5 | 81 |
| Movement rate (mm/h) | - | 41.2 | 15.6 | 42.6 | 13.3 |
| Experiment 2 (with Auxiliary Production Well) | Step 0 | Steps 1~5 | Steps 6~10 | Steps 11~15 | Steps 16~20 |
|---|---|---|---|---|---|
| Location of temperature range above 1000 °C (mm) | 0.0 | 50.0 | 350.0 | 650.0 | 1250.0 |
| Start time (h) | 0 | 1 | 13 | 31 | 56 |
| End time (h) | 1 | 13 | 31 | 56 | 81 |
| Intermediate time (h) | 0.5 | 7 | 22 | 43.5 | 68.5 |
| Movement rate (mm/h) | - | 7.69 | 20.0 | 14.0 | 24.0 |
Disclaimer/Publisher’s Note: The statements, opinions and data contained in all publications are solely those of the individual author(s) and contributor(s) and not of MDPI and/or the editor(s). MDPI and/or the editor(s) disclaim responsibility for any injury to people or property resulting from any ideas, methods, instructions or products referred to in the content. |
© 2023 by the authors. Licensee MDPI, Basel, Switzerland. This article is an open access article distributed under the terms and conditions of the Creative Commons Attribution (CC BY) license (https://creativecommons.org/licenses/by/4.0/).
Share and Cite
Iriguchi, R.; Ishii, Y.; Hamanaka, A.; Su, F.; Itakura, K.-i.; Kodama, J.-i.; Sasaoka, T.; Shimada, H.; Deguchi, G. Visualization of Movement and Expansion of Coal Reaction Zone by Acoustic Emission Monitoring in Underground Coal Gasification System. Eng 2023, 4, 2960-2977. https://doi.org/10.3390/eng4040166
Iriguchi R, Ishii Y, Hamanaka A, Su F, Itakura K-i, Kodama J-i, Sasaoka T, Shimada H, Deguchi G. Visualization of Movement and Expansion of Coal Reaction Zone by Acoustic Emission Monitoring in Underground Coal Gasification System. Eng. 2023; 4(4):2960-2977. https://doi.org/10.3390/eng4040166
Chicago/Turabian StyleIriguchi, Rika, Yuma Ishii, Akihiro Hamanaka, Faqiang Su, Ken-ichi Itakura, Jun-ichi Kodama, Takashi Sasaoka, Hideki Shimada, and Gota Deguchi. 2023. "Visualization of Movement and Expansion of Coal Reaction Zone by Acoustic Emission Monitoring in Underground Coal Gasification System" Eng 4, no. 4: 2960-2977. https://doi.org/10.3390/eng4040166
APA StyleIriguchi, R., Ishii, Y., Hamanaka, A., Su, F., Itakura, K.-i., Kodama, J.-i., Sasaoka, T., Shimada, H., & Deguchi, G. (2023). Visualization of Movement and Expansion of Coal Reaction Zone by Acoustic Emission Monitoring in Underground Coal Gasification System. Eng, 4(4), 2960-2977. https://doi.org/10.3390/eng4040166