1. Introduction
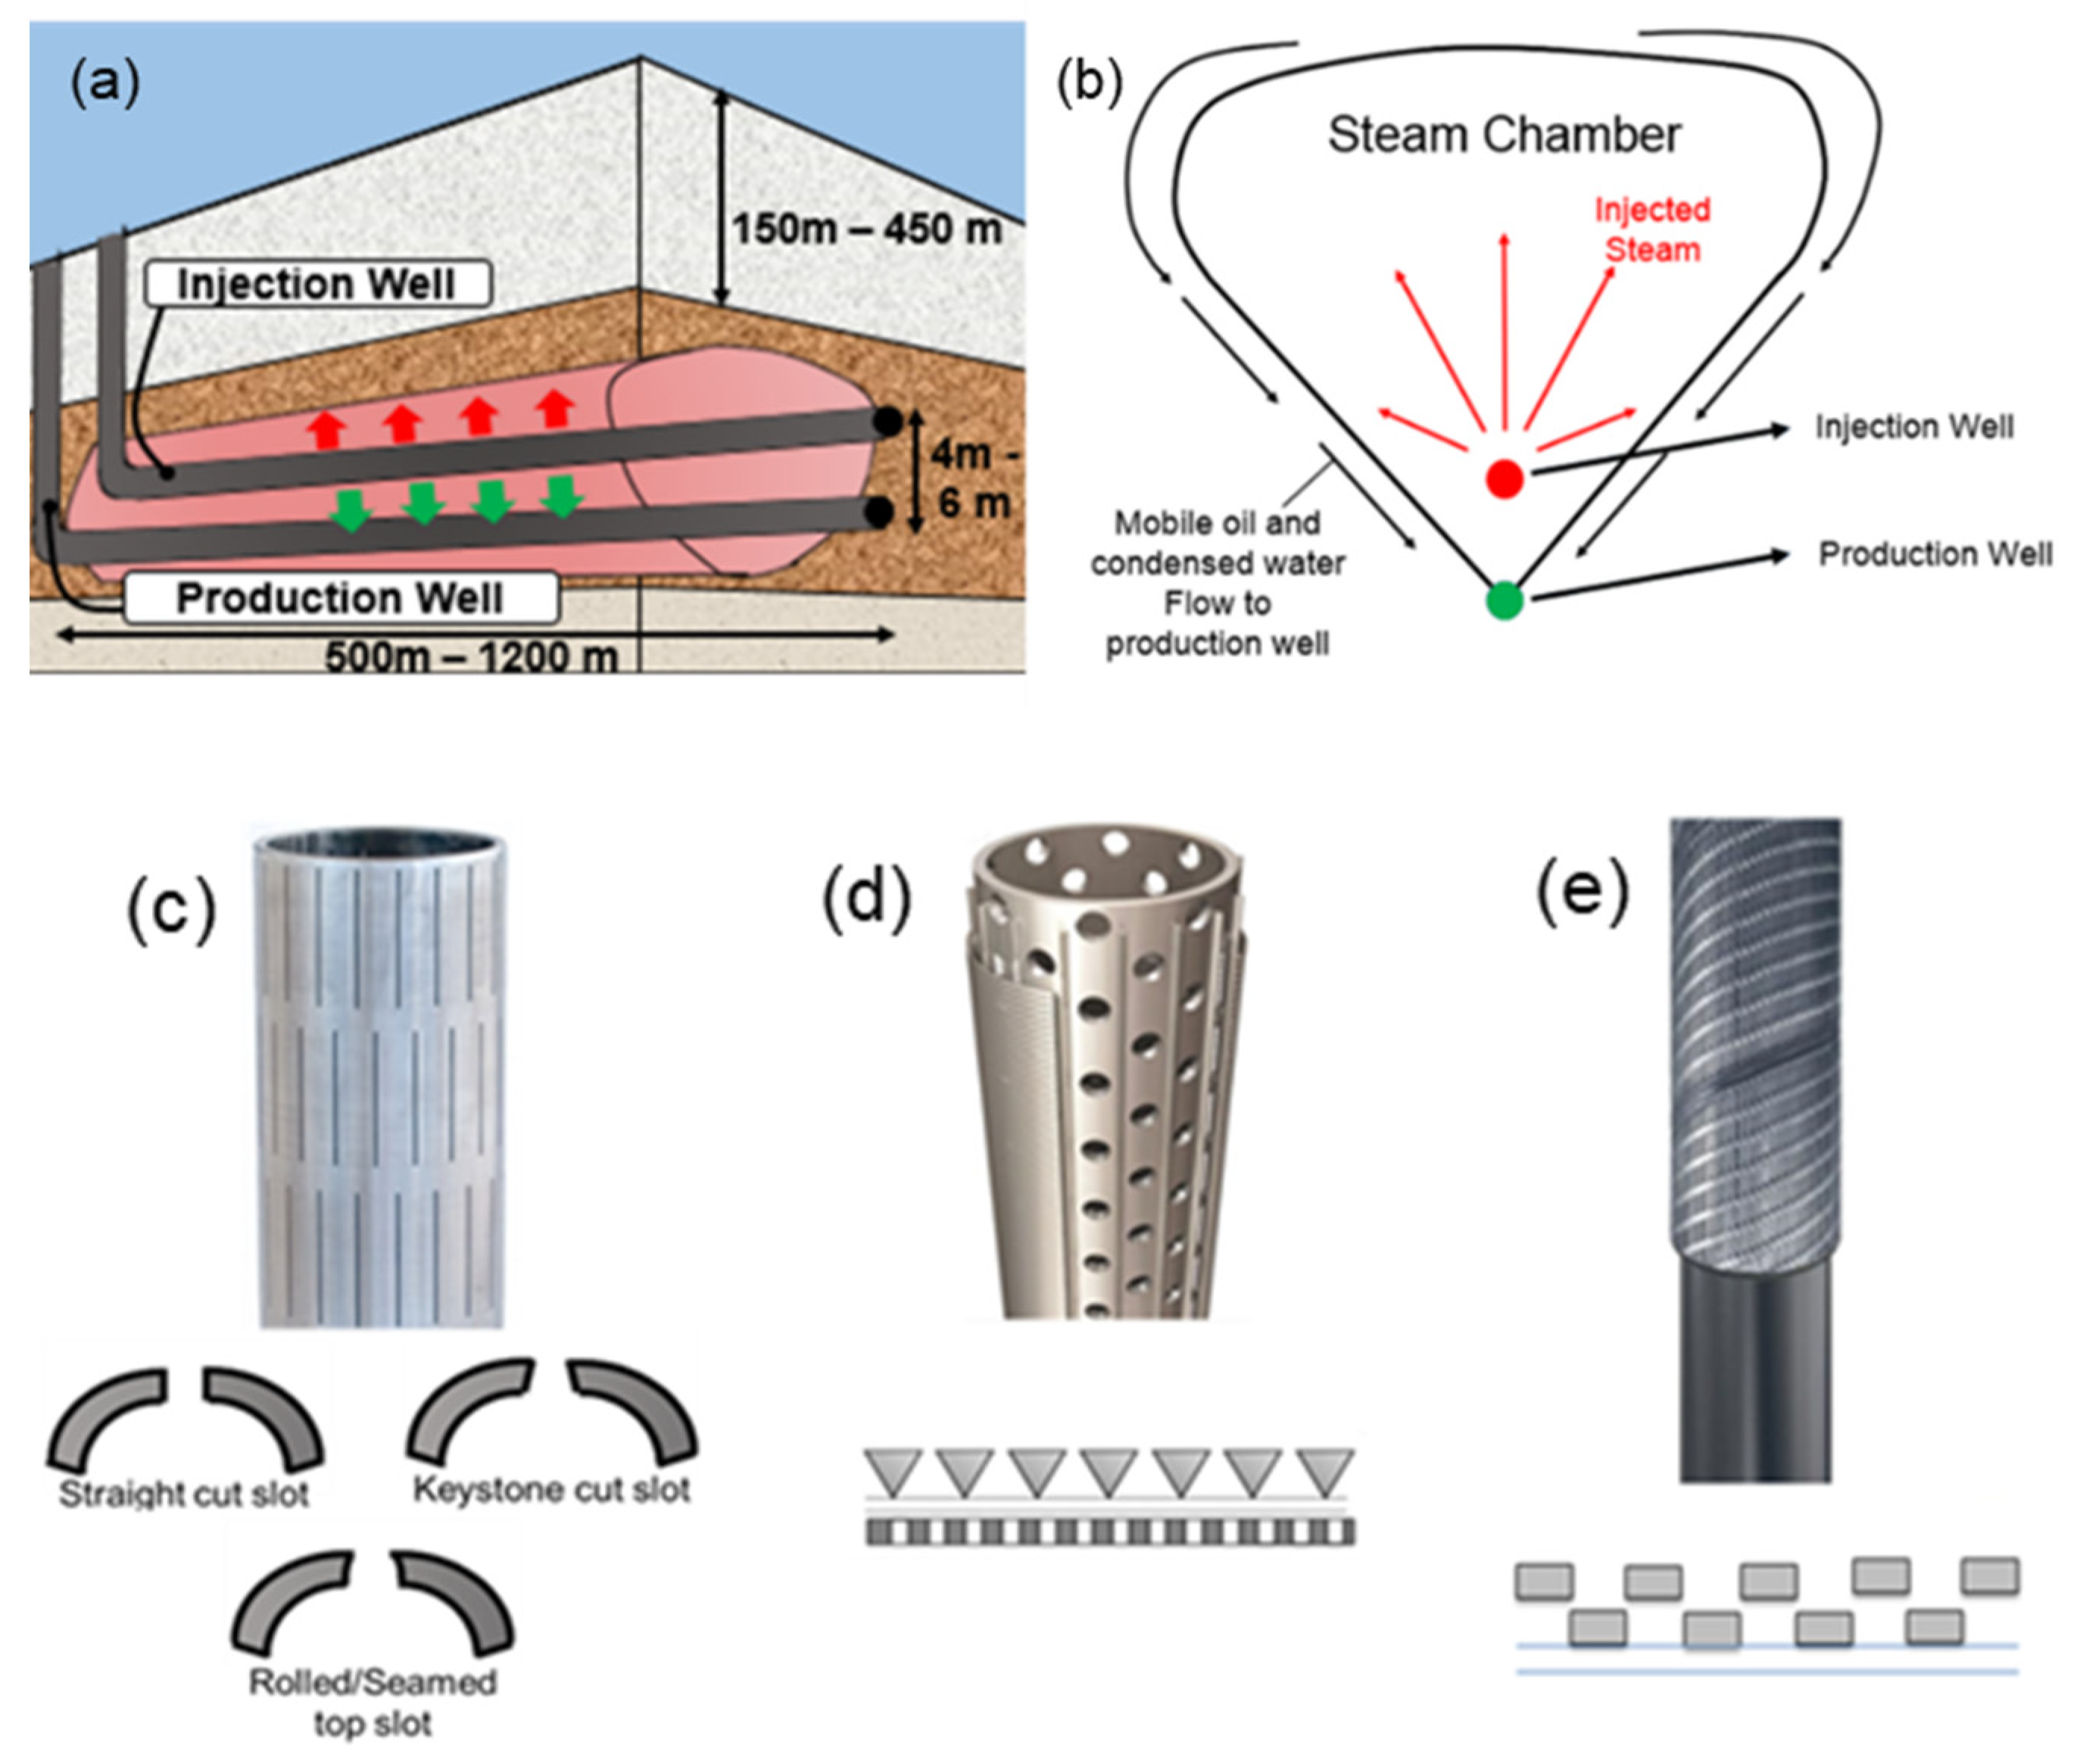
SAGD is the primary technology to extract heavy oil from oil sands. The continuous steam injection from the upper well generates a growing steam chamber that contacts and transfers heat to the bitumen. Consequently, oil viscosity is reduced, which allows the gravity-assisted flow of melted bitumen and condensed steam toward the lower production well [
1] (
Figure 1a,b).
Oil sands are geologically young formations typically found at shallow depths (up to 450 m) [
2]. The inherent loose characteristic of oil sands requires sand control methods to avoid damage in surface and downhole facilities [
3]. Sand particles are erosive at high flow velocities [
4], and their accumulation in horizontal wells can obstruct the free flow of production fluids, leading to remedial workover operations and high treatment costs [
5]. Over the years, SAGD operators have employed Standalone Screens (SAS) to provide sand control and mechanical support to the wellbore. Slotted Liner (SL), Wire-Wrapped Screen (WWS), and Punched Screens (PS) are the most common sand control devices (SCD) in SAGD wells (
Figure 1c,e).
The screen would form sand bridges over the slots, providing retention of sand grains [
6]. The relatively low flow rates in SAGD wells prompted the operators to opt for SL as a low-cost option with robust mechanical integrity [
7,
8]. However, SL may exhibit severe plugging tendencies and corrosion issues, resulting in a gradual shift from SL to higher OFA screens, such as WWS and PS [
9,
10]. WWS consists of a continuous profiled wire wrapped onto a base pipe (
Figure 1d). The wires typically have a trapezoid cross-section and are supported by ribs or rods in direct contact with a perforated pipe. The hole density on the base pipe affects the integrity and strength of the screen, which is out of the scope of the current study. WWS provides a high OFA, from 6% to 15%, compared to 2–3% for SL and 3–8% for PS [
11].
A sand control screen optimization effort minimizes sand production while keeping an acceptable flow performance throughout wellbore life [
7]. Generally, the screen aperture is the crucial parameter in sanding [
8,
12], whereas OFA dominates the flow response of the device [
13]. The lower the OFA, the faster a device can achieve severe plugging. WWS offers the benefit of high OFA and has proven more effective for low-quality sands with active clay components [
14]. Increasing the slot density for SL generates a slight increase in OFA, while varying the aperture size in WWS can drastically escalate the OFA.
This study aims to elaborate a new set of criteria using the “Traffic Light System” (TLS) method to identify the optimum aperture window for the McMurray Formation PSD classes. The criteria employ the experimental data to discretize the performance into different production scenarios, accounting for sanding and flow performance. The operational procedure incorporates various flow velocities and fluid phases to gain an insight into the WWS performance.
2. Existing Aperture Design Criteria
Over time, several authors have tried to develop criteria for the sand control screen aperture selection. Coberly [
15] introduced 2D10 as the maximum aperture at which stable bridges can form. D10 represents the sieve size that retains 10% of the material mass. Suman et al. [
6] proposed a more conservative criterion (≤D10) but still recognized the importance of larger particles on bridge stability. Initial groundwater applications of WWS followed a sizing recommendation of D40 [
16]. Subsequent criteria continued to rely on one single point of the PSD. For instance, Gillespie et al. [
17] proposed 2D50 as the upper limit for WWS aperture size based on slurry SRT for different sand classes. Ballard and Beare [
18] combined pre-packed and slurry SRT results to suggest aperture sizing on the D30 and stated that it provides better results than the D10 criteria. Likewise, Weatherford guidelines recommend D25 for WWS. Fattahpour et al. [
8] presented a rule of thumb for SAGD wells after comparing experimental data with field applications, selecting WWS with apertures 0.004 to 0.008 inches less than the equivalent SL selection for the same sand. The existing aperture design criteria for WWS do not consider operational conditions, fluid properties, stress levels, or PSD shape.
3. Experimental Setup and Procedure
The investigation employs a pre-packed SRT that emulates the high-porosity zone formed around the sand control screen after borehole collapse. The experiment mimics the conditions around SAGD production wells using reasonable flow rates, fluid ratios, and production scenarios. All tests were conducted with 60 psi of axial stress to replicate the early stages of the near-wellbore region with relatively low effective stresses [
19].
3.1. Experimental Apparatus
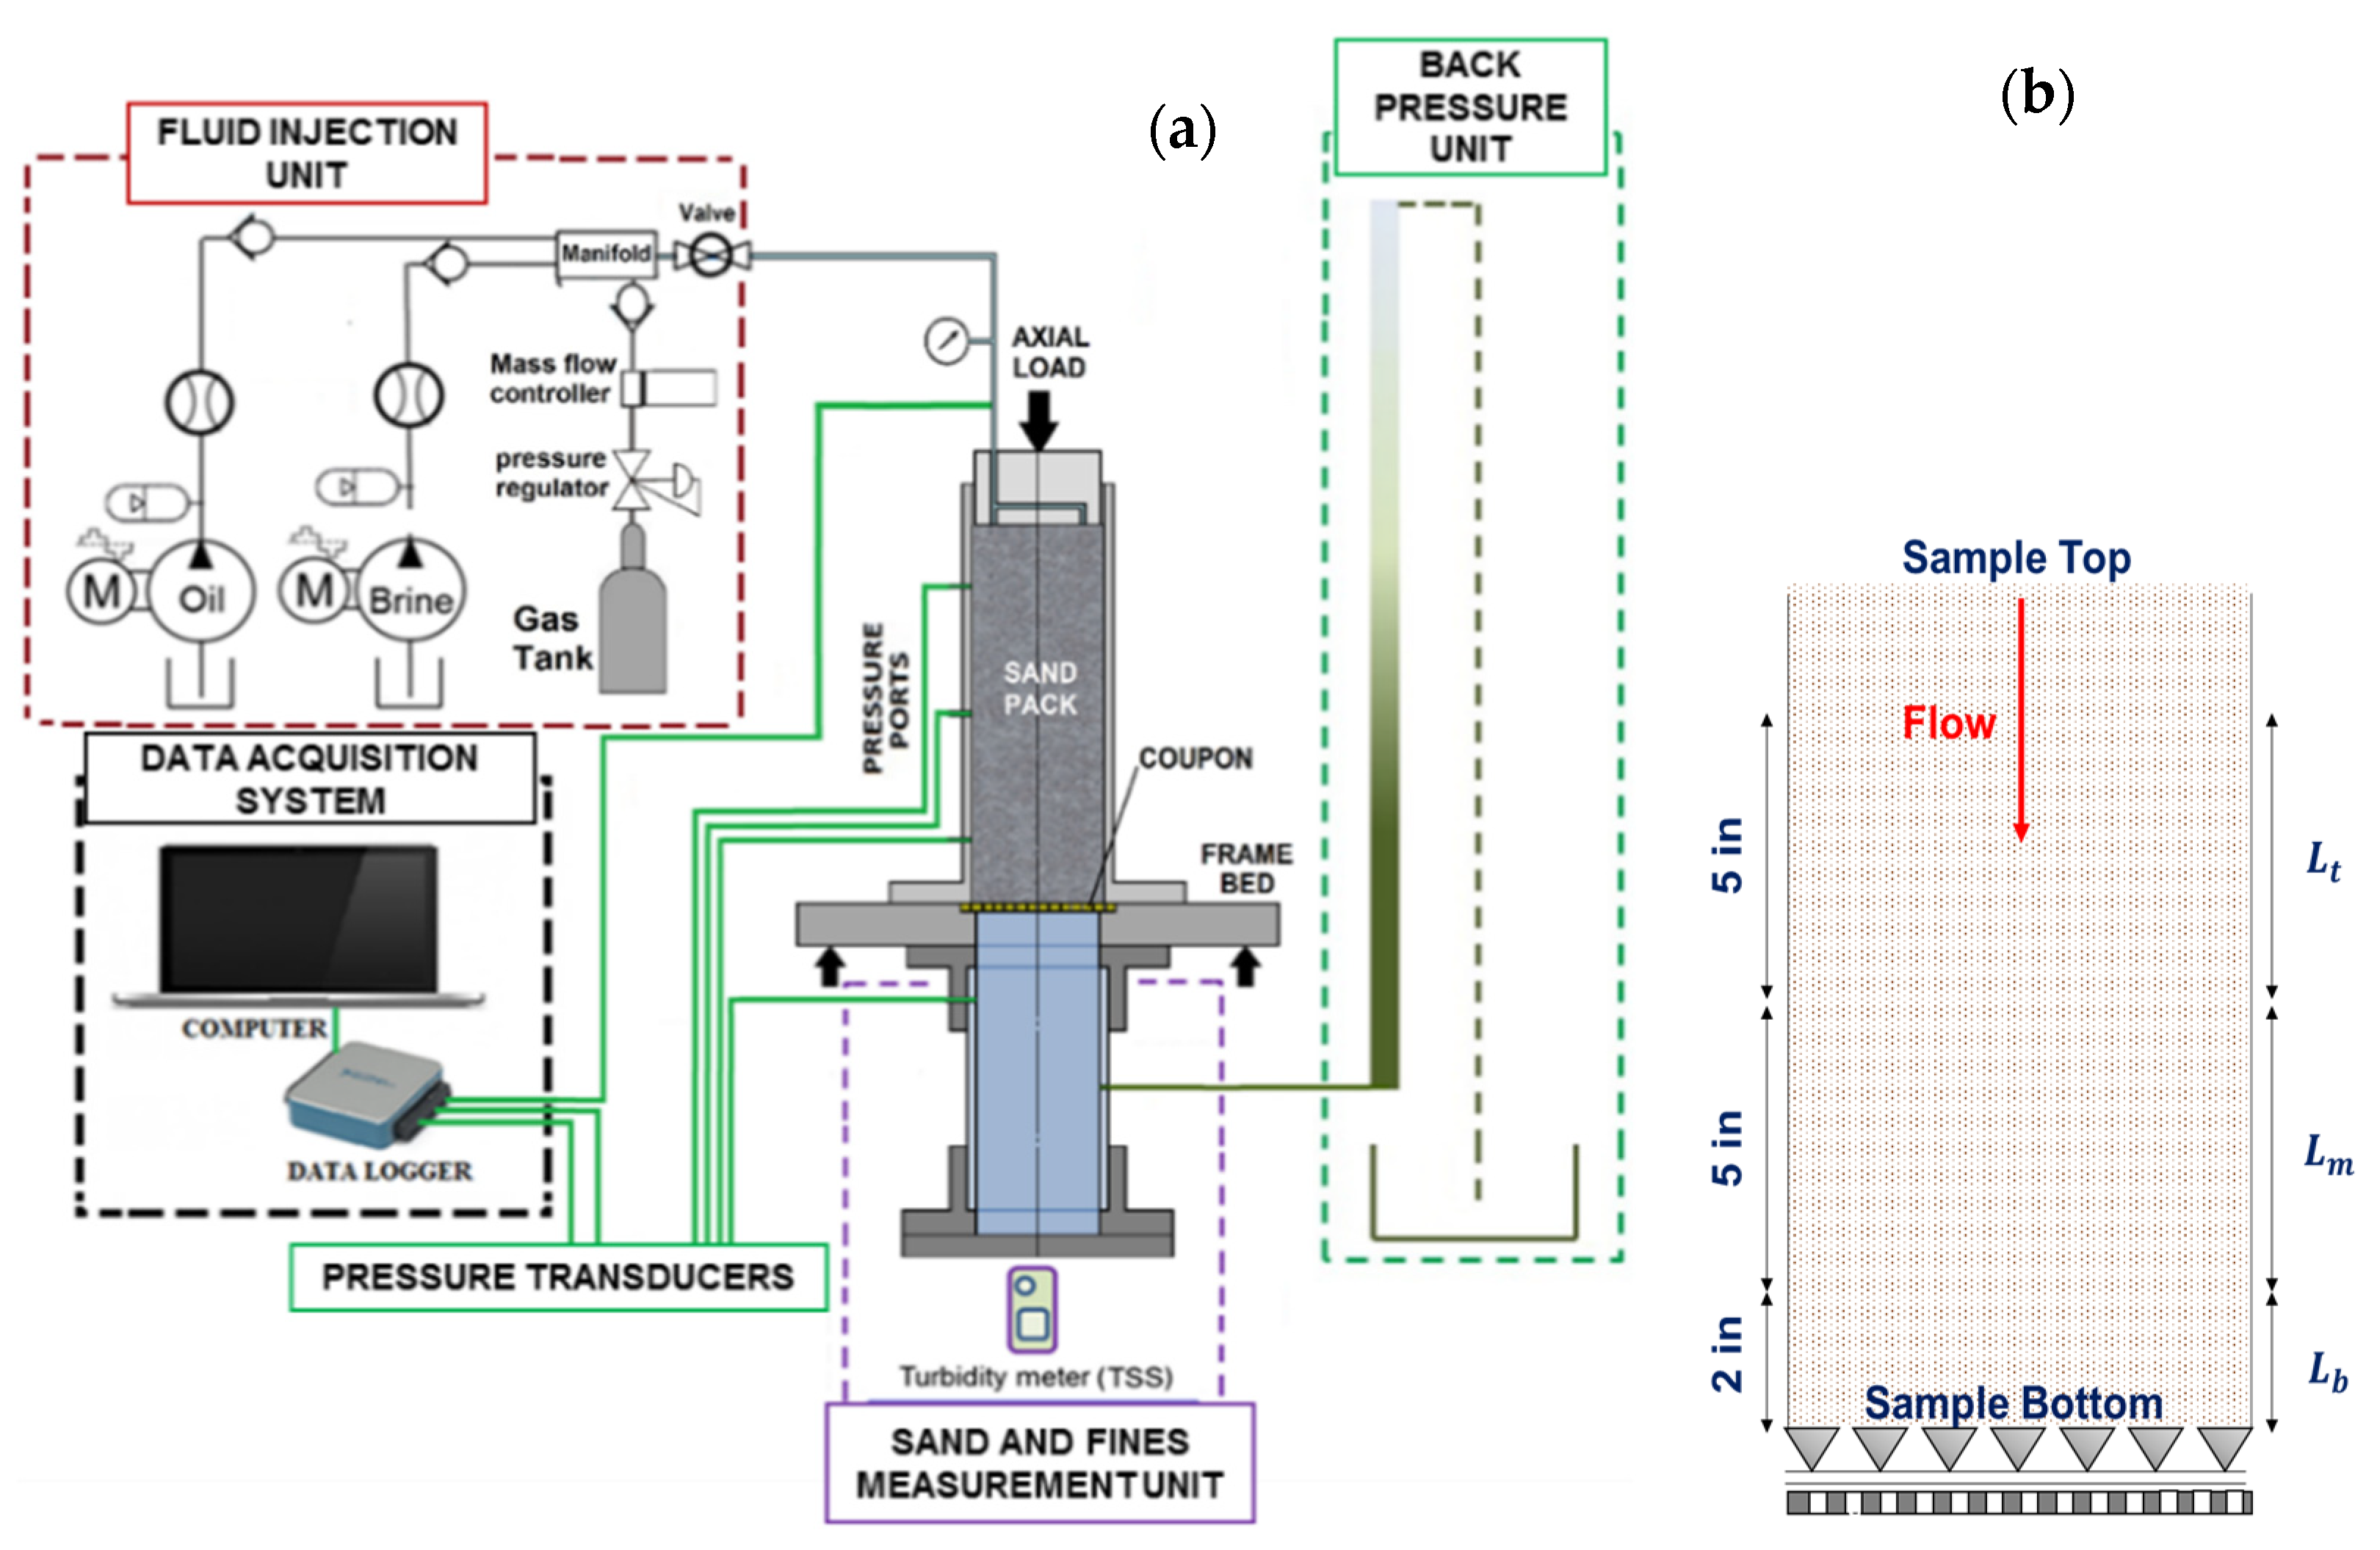
The pre-packed SRT equipment (
Figure 2a) encompasses five units: (1) cell and accessories, (2) fluids injection unit, (3) data acquisition system, (4) collection and back-pressure units, and (5) load frame.
The core holder, 6 inches in diameter and 18.5 inches in length, accommodates the sand pack sitting over the sand control screen samples. Three connection points along the cell allow recording pressure drop evolution (
Figure 2b) (differential transducers with 0.25% accuracy). The near-screen zone is defined as the 2-inch interval of sand above the screen. The other points are located 7 and 12 inches above the screen. Flow is injected from the top to the bottom of the sand pack and is then directed toward the back-pressure column, which provides 3 psi pressure at the sample bottom. Produced particles at each step are captured and accumulated in the sand trap.
3.2. Testing Materials
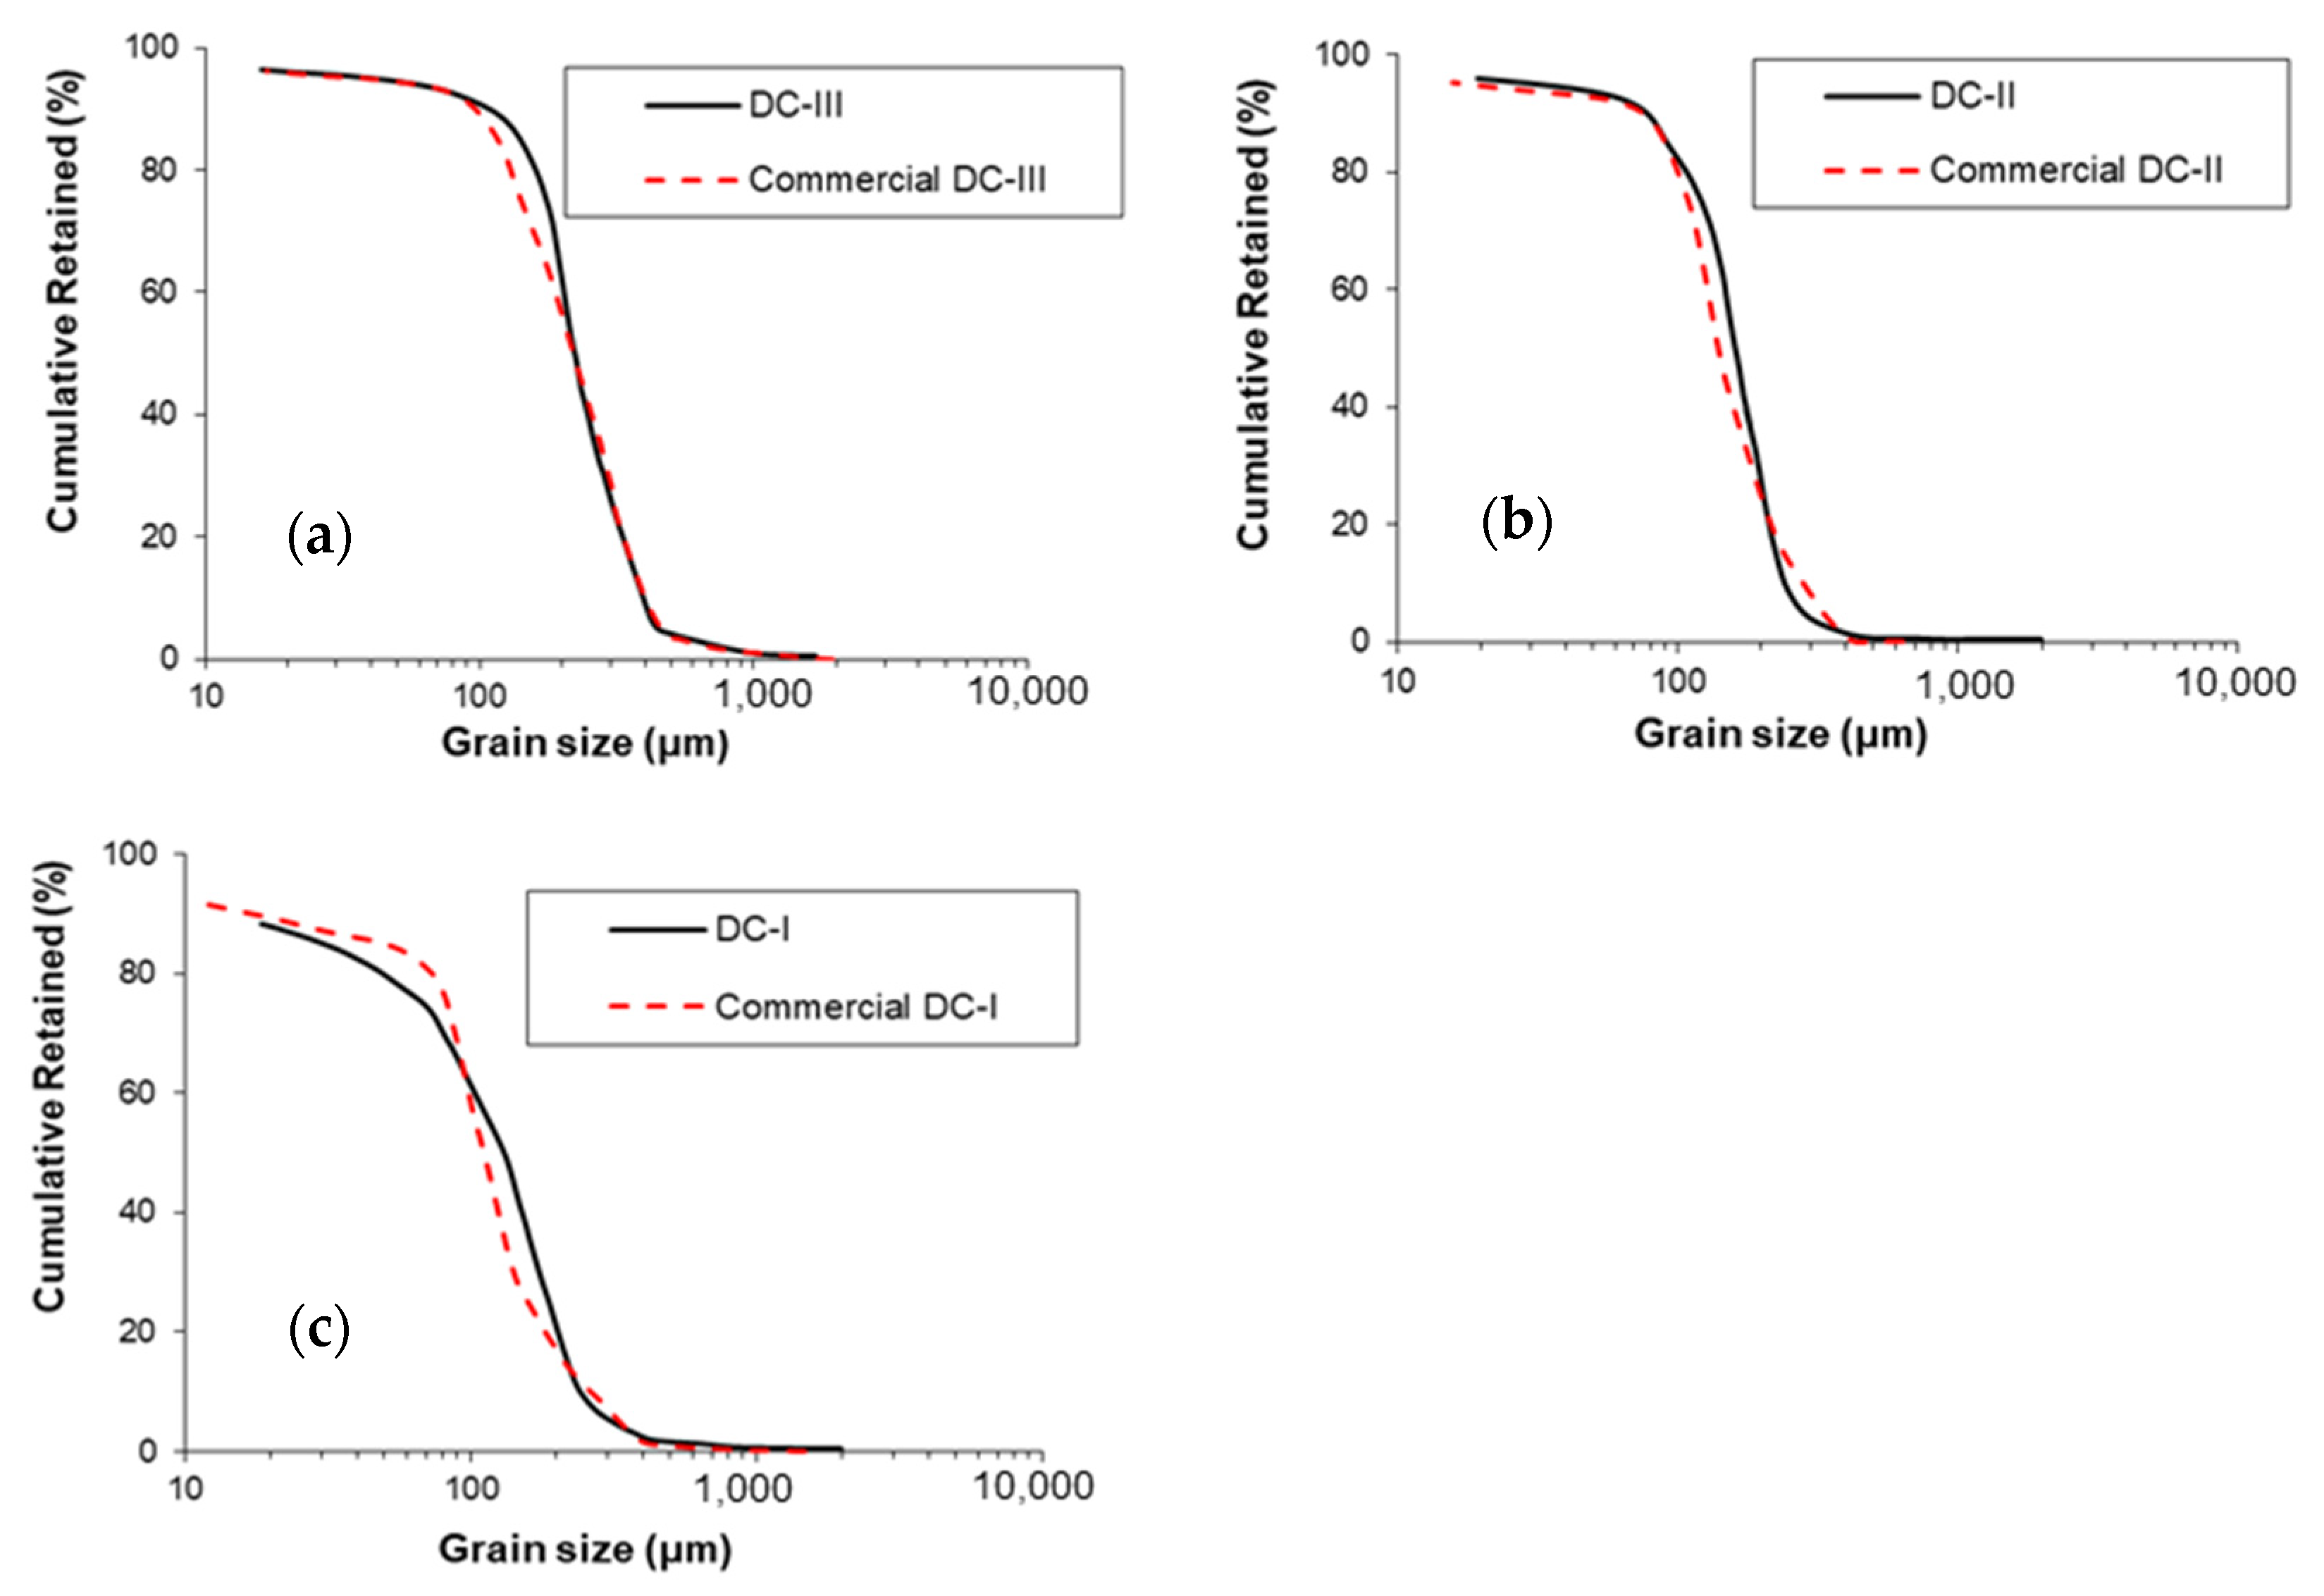
Several tests were performed on three representative PSD classes from the McMurray formation (DC-I to DC-III) to evaluate the response of WWS under different sand characteristics. DC-III is considered medium-coarse sand, while DC-II and DC-I are fine and very fine sands, respectively. The porosity of sand samples is about 35%. Synthetic sand mixtures using commercial sands, silts, and clays are employed to replicate the PSDs categorized by Abram and Cain [
20].
Figure 3 compares commercial and actual formation sands.
Table 1 describes each sample’s detailed D-values and shape factors (uniformity coefficient and sorting coefficient). Mahmoudi et al. [
21] showed that commercial mixtures also display similar strength properties and shape factors as the formation sands. Kaolinite was used as the clay mineral in the samples as it is the dominant clay in the McMurray Formation [
21].
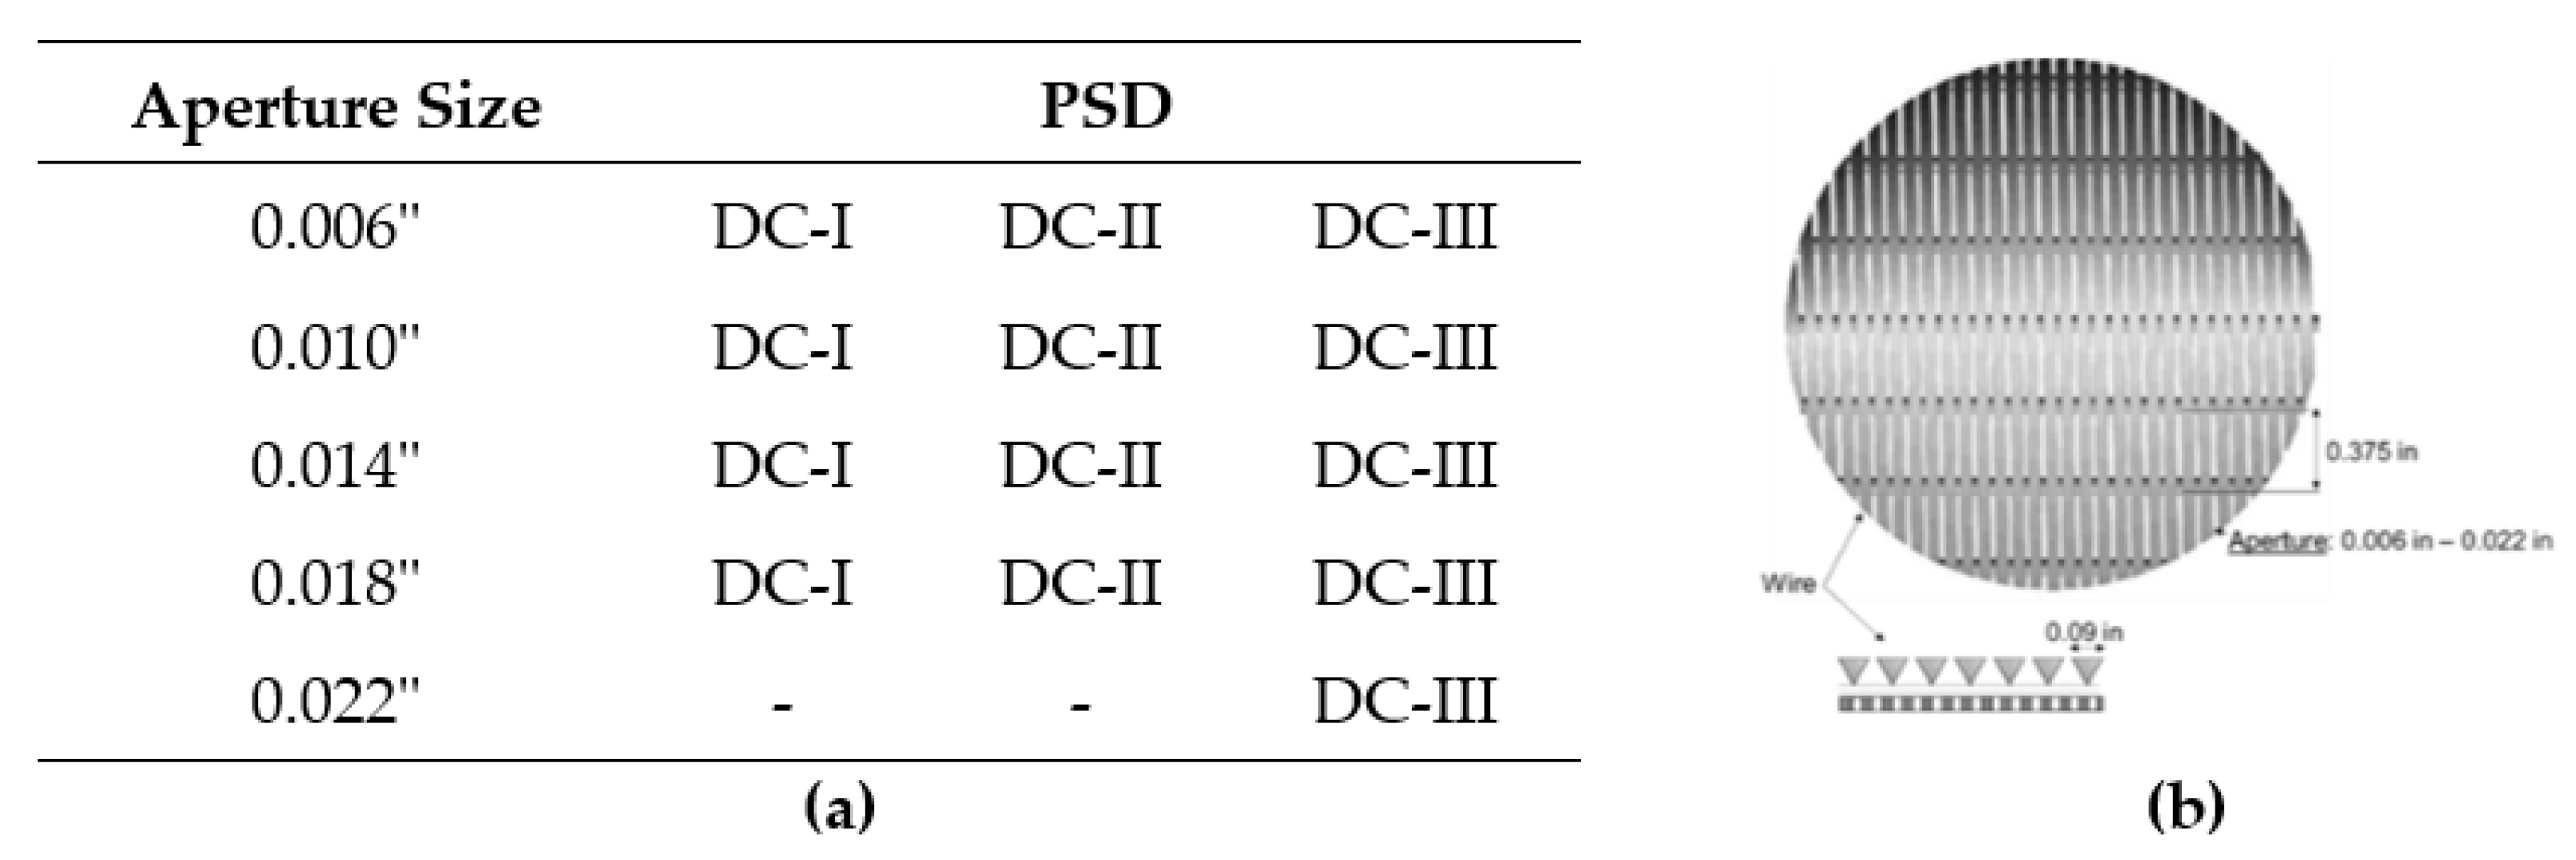
Figure 4a introduces the test matrix that covers existing criteria to incorporate both sanding and plugging conditions.
Figure 4b shows a schematic with the design parameters of WWS coupons with 6 inches diameter. WWS coupons correspond to 6-inch-diameter disks cut from the screen. The performance of each sand is evaluated for different aperture sizes.
Haftani et al. [
22] summarized the reported pH values of produced water from several SAGD projects, indicating the pH range from 7.3 to 8.8 with a wide range of salinity values. In this study, 7.9 is selected as the pH of the brine phase in all tests. Na
+ and Cl
− are the dominant ions encountered in produced water from SAGD wells, and 400 ppm was found to be the lowest value in SAGD wells [
22], representing the worst-case scenario for fines migration.
Mineral oil with 8-cp viscosity is used to emulate bitumen at downhole temperature conditions [
7]. Nitrogen is the gas phase used to represent steam-breakthrough episodes.
3.3. Testing Procedure
Sand preparation starts with the dry mixing of commercial sands, silts, and clay. Brine at 10% weight of the sand is then added and thoroughly mixed with the dry sand. The wet sand is packed inside the test cell following a layer-by-layer technique known as the moist tamping method [
23] to ensure a uniform porosity and permeability distribution along the sand pack. Once the sand-pack reaches the top, the top platen is installed, and the load piston applies 60 psi of axial stress. Next, the sand pack is saturated from bottom to top at a low flow rate to avoid permeability damage in the sample.
The absolute permeability of the sample is measured before brine displacement by oil. Three differential readings across the sample confirm an even permeability. Oil is injected from the sample top towards the coupon at 1250 cc/h to displace the brine and reach irreducible water saturation, emulating the reservoir’s initial saturation condition [
7].
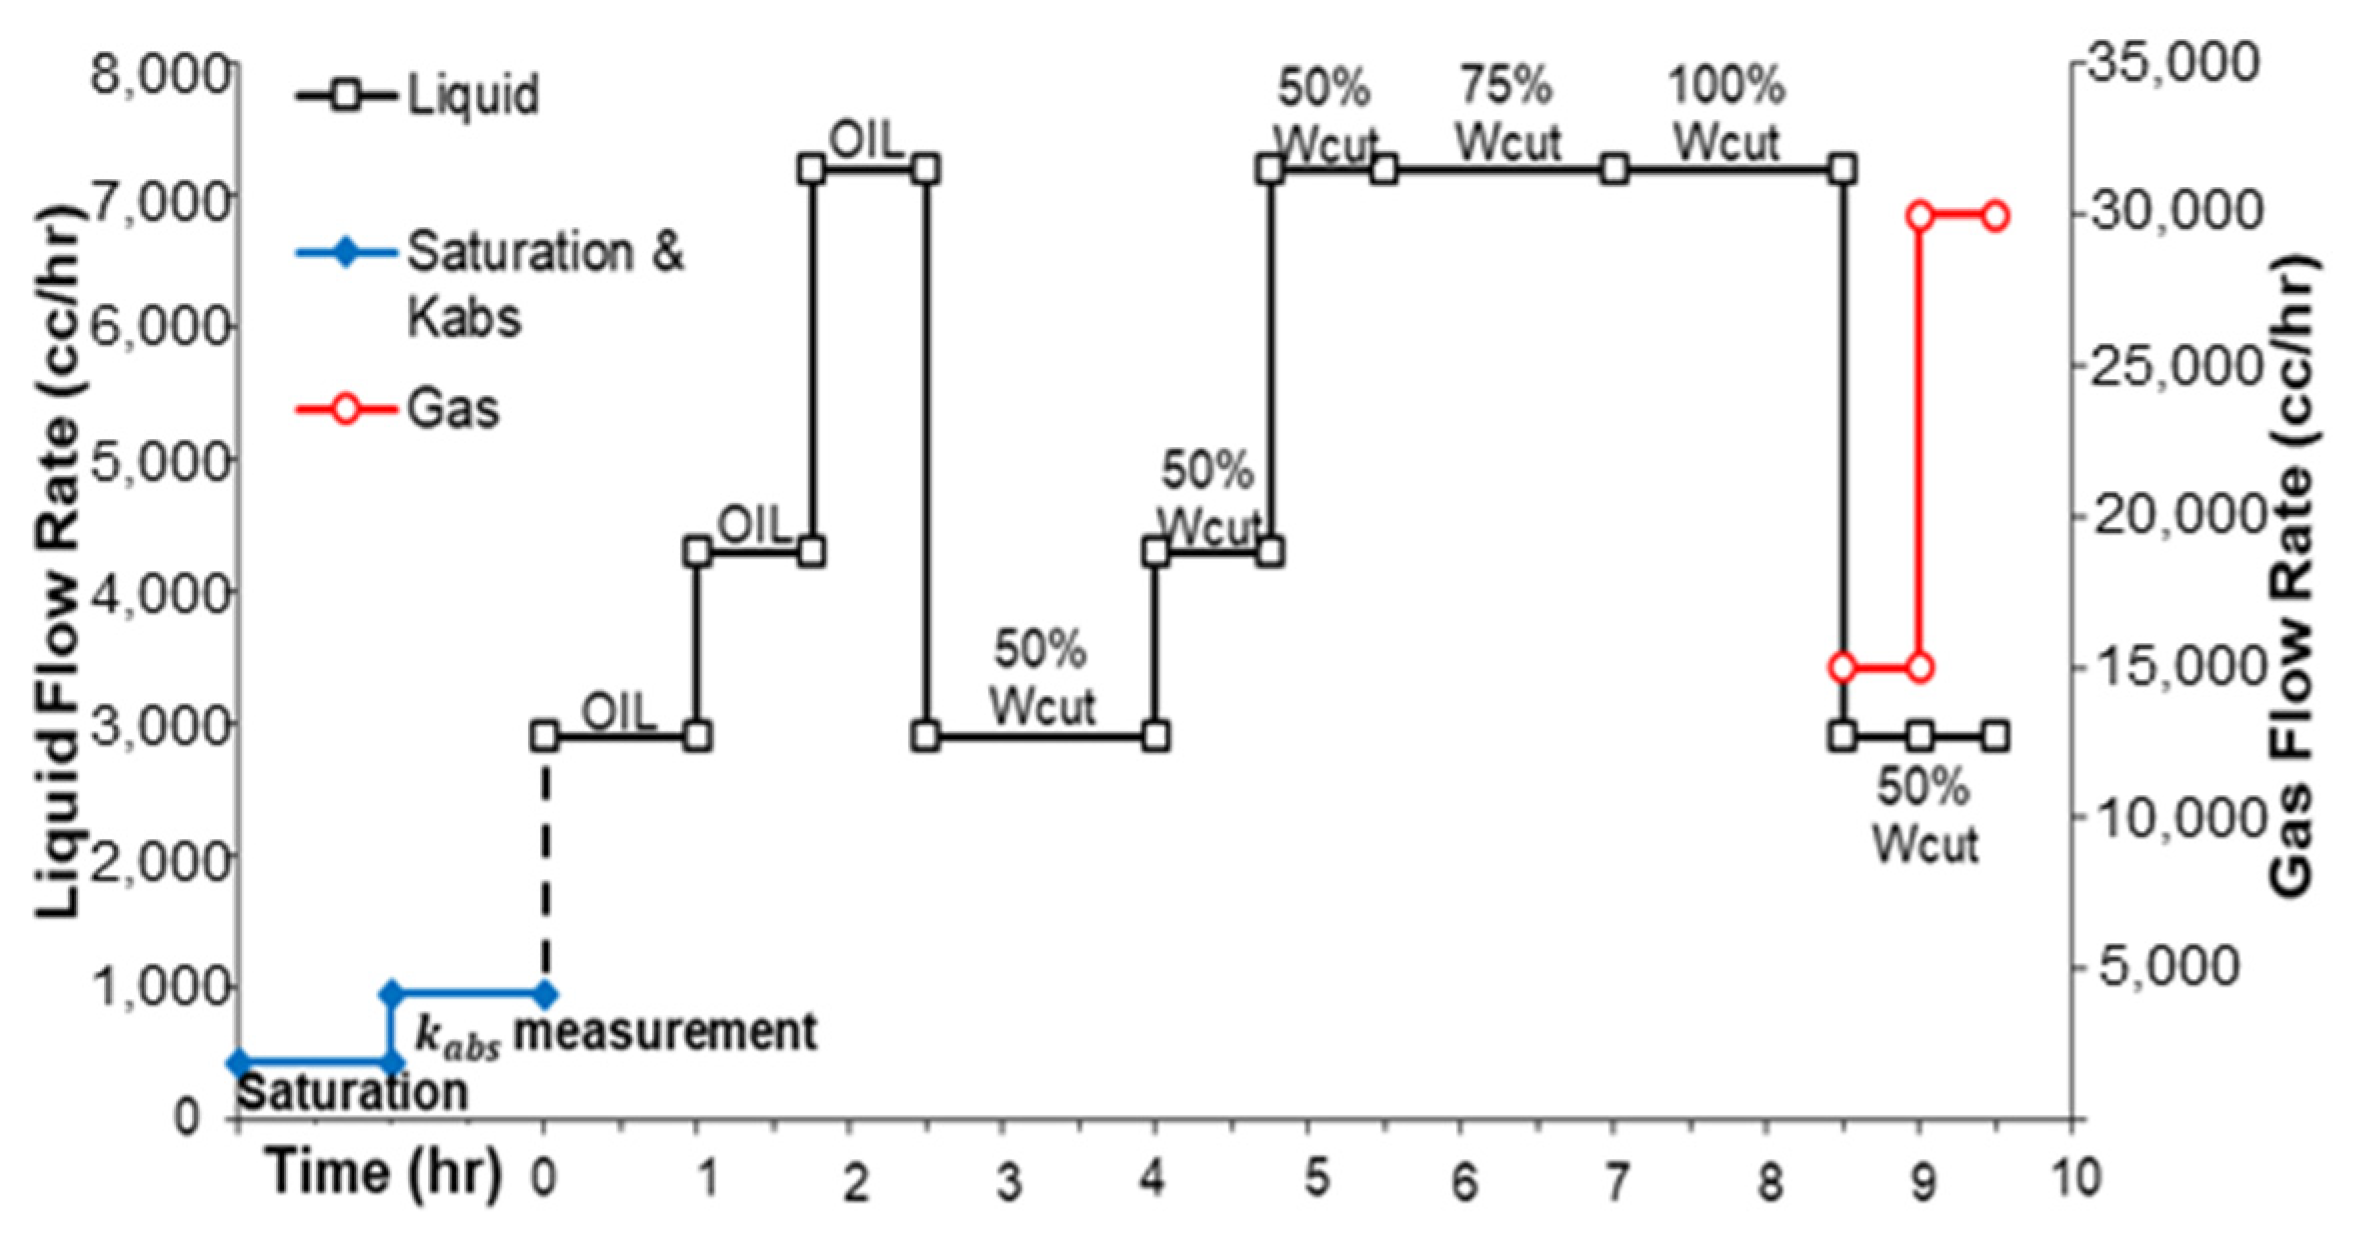
The test includes the injection of single-, two-, and multi-phase flow stages (
Figure 5). The duration of each stage depends on the distribution of flowing phases and pressure stabilization to achieve a steady-state flow. Three flow rate levels are designed to account for scenarios like reservoir heterogeneity, aperture plugging, and non-uniform flow distribution. The maximum liquid flow rate (7200 cc/h) corresponds to 4000 bbl/day of liquid production from an 800-m SAGD production well equipped with a 7-inch screen, where only 15% of the well contributes to the flow. The medium- and minimum-flow rates correspond to scenarios where 50% and 70% of the well contribute to the flow, respectively.
The three single-phase oil stages in
Figure 5 emulate sections of the well that produce high oil cuts. Next, the injection of brine and oil captures the changing conditions of SAGD wells, where different liquid rates and water cuts are experienced throughout the wellbore life [
24]. The flow scheme includes a single-phase brine stage to account for high water cuts, representing the worst-case scenario for sand production and fines migration [
25]. Lastly, two stages of co-injection gas (N
2), brine and oil, resemble the event of steam breakthrough. Although the precise influx conditions during such episodes are not known, the liquid rates are dropped to the initial level (total liquid rate of 2900 cc/h) since it is anticipated that high steam mobility may restrict liquid inflow.
4. Testing Program and Evaluation Method
Cumulative sand production and retained permeability are the sand retention and flow performance indicators, respectively. Produced sand is reported in pounds per square foot (lb/ft
2) of the coupon area. Retained permeability is evaluated after the last liquid stage (100% brine flow) as the ratio of effective permeability at the near-screen zone over initial effective permeability at irreducible oil conditions. The Wang et al. [
26] method was used in this study to obtain the retained permeability under multi-phase conditions at residual oil saturation tests (
Table 2).
5. Testing Results
5.1. Sand Retention Performance
WWS’s ability to retain the production of solid particles relies on the stability of particle bridges, which is mainly controlled by the ratio of the aperture size over the particle diameter [
27], local fluid velocity [
28], grain shape [
29], water cut [
25,
30], and flowing phases [
7].
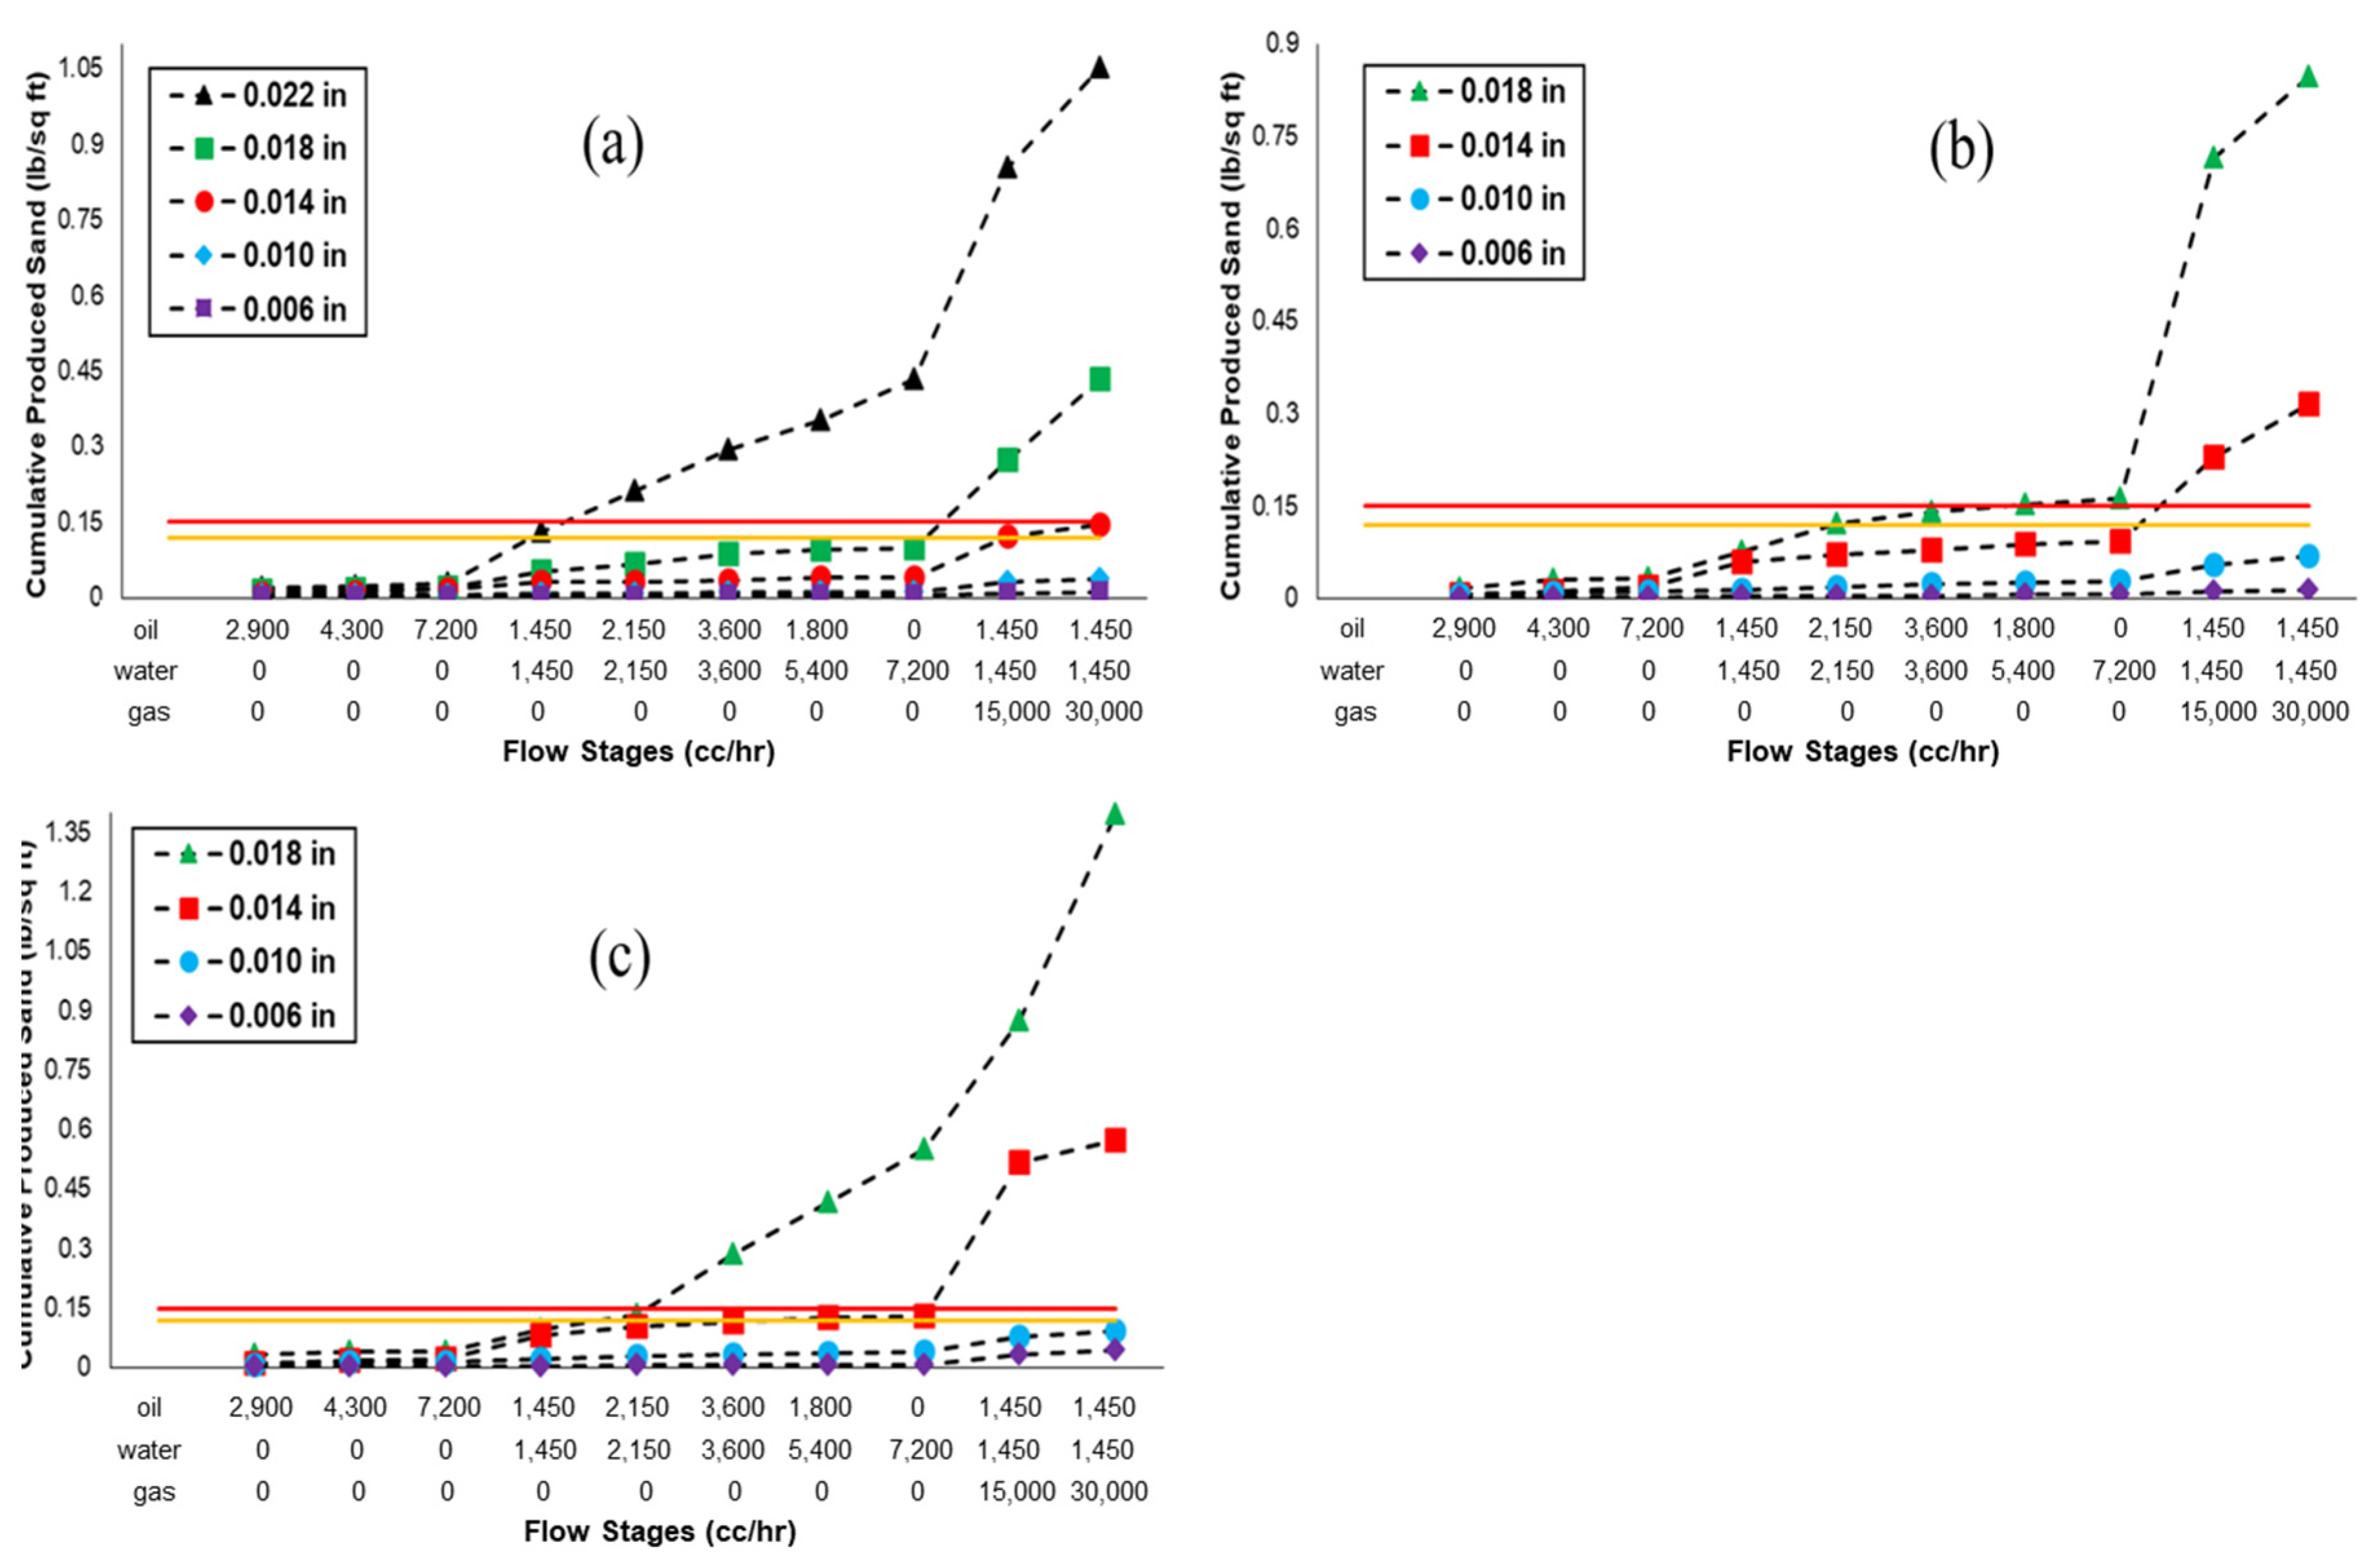
This study established sand production limits at 0.12 lb/ft
2 for moderate sanding and 0.15 lb/ft
2 as the upper threshold for cumulative sanding. These limits correspond to limiting cumulative sand to less than 1% of the liner volume [
31]. Similarly, Hodge et al. [
32] correlated laboratory performances with field data and proposed a value of 0.12 lb/ft
2.
Figure 6 shows negligible sand production during the oil stages for all sand classes, which can be attributed to the strong capillarity bonding between grains. Even at high oil flow rates and wider slots, minimal sanding is observed. After the water breakthrough, more sand production is expected due to the reduction of the capillary bonding force. However, for 0.006″ and 0.010″ coupons in DC-III, there is minimal sanding even after water breakthrough, indicating stable sand bridges are formed on the small apertures that could provide a strong capability to prevent sand production. However, wider slots exhibit transient sanding. In transient sanding, some sanding is observed upon changing the flow rate or water cut, with the rate eventually declining until stable bridges are formed at constant flow rates.
Increasing flow rates induce higher pressure gradients through the sand bridges, and the drag forces can exceed the frictional resistance of the bridge. The impact of flow rate fluctuations is more substantial for wider slots, since greater aperture size to grain size results in weaker sand bridges.
Transient sanding was also observed during the co-injection of brine, oil, and gas, but at more intense levels. Interestingly, gas–liquid flow can destabilize the bridges, even over narrow apertures such as 0.006″. Wider slots (>0.014″) displayed significant sand production. In cases like the 0.018″ test for DC-I, bridge stability is never achieved, and particles are continuously produced, known as continuous sanding.
5.2. Flow Performance
The retained permeability normalizes the final permeability of the near-screen zones against the initial permeability. This parameter allows for a better comparison of the flow performance of different sand control designs. Effective retained permeability determination uses the relative permeability values (k
rw@Sor) from
Table 2 and the pressure drop reading from the last liquid stage:
where
krw@Sor is the relative permeability to water at residual oil saturation,
kw,bottom is the final effective permeability after the last liquid stage, and
kret is the retained permeability. Δ
Pb is the pressure drop at the bottom section of the sand-pack.
qw and
µw represent the water flow rate and viscosity, respectively.
Burton and Hodge [
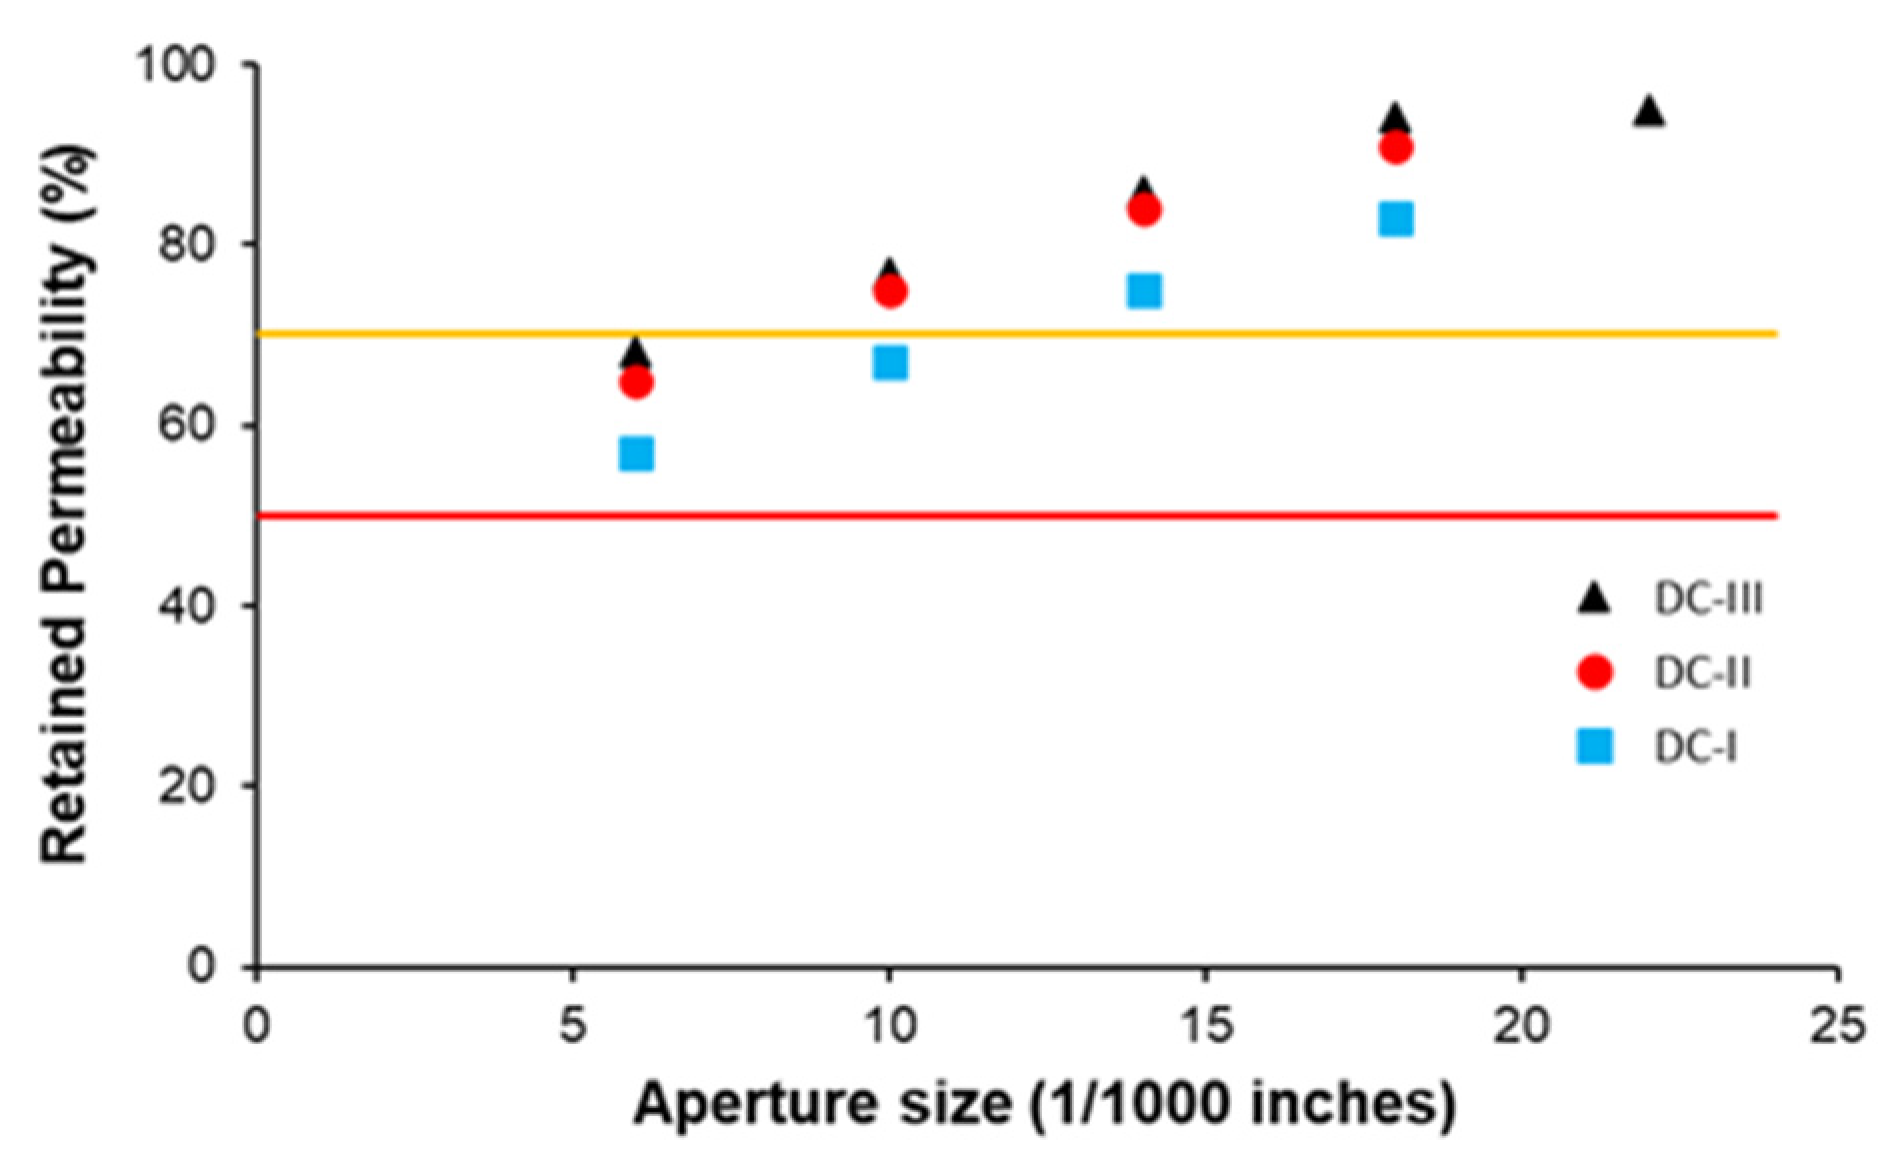
33] analytically found that a negligible impact on productivity occurs for retained screen permeability above 20% due to the high permeability of the screens compared to that of a porous medium. Later, retained permeability of 50% in the near-wellbore region was proposed to account for other formation damage sources [
12,
32]. This study considers 50% and 70% for the marginal and acceptable limits of retained permeability, respectively.
Figure 7 displays the retained permeability as a function of aperture size for the three sand classes. As expected, the fines can easily be dislodged from the sand-pack for the wider aperture size, resulting in minimal plugging. Remarkably, WWSs provide retained permeability values above 50%, even for narrow apertures such as 0.006″ in low-quality sand, i.e., DC-I. In DC-III, increasing the aperture size beyond 0.018″ does not further improve skin but results in higher sanding levels. Flow performance decreases from DC-III to DC-I, as narrow pore throats are prone to plugging.
6. Design Criteria for WWS
Flow and sand production performances obtained with the SRT are combined to elaborate a set of graphical design criteria for WWS. The proposed criteria specify an aperture size window that keeps the produced sand within an acceptable limit while minimizing plugging potentials and maintaining wellbore productivity. Unlike previous criteria, the criteria introduced here differentiate production scenarios to evaluate their influence on the safe aperture zone. The optimum aperture window provides an upper bound and a lower bound. The upper bound is governed by sand production performance, while the flow performance dominates the lower bound.
6.1. The Traffic Light System (TLS)
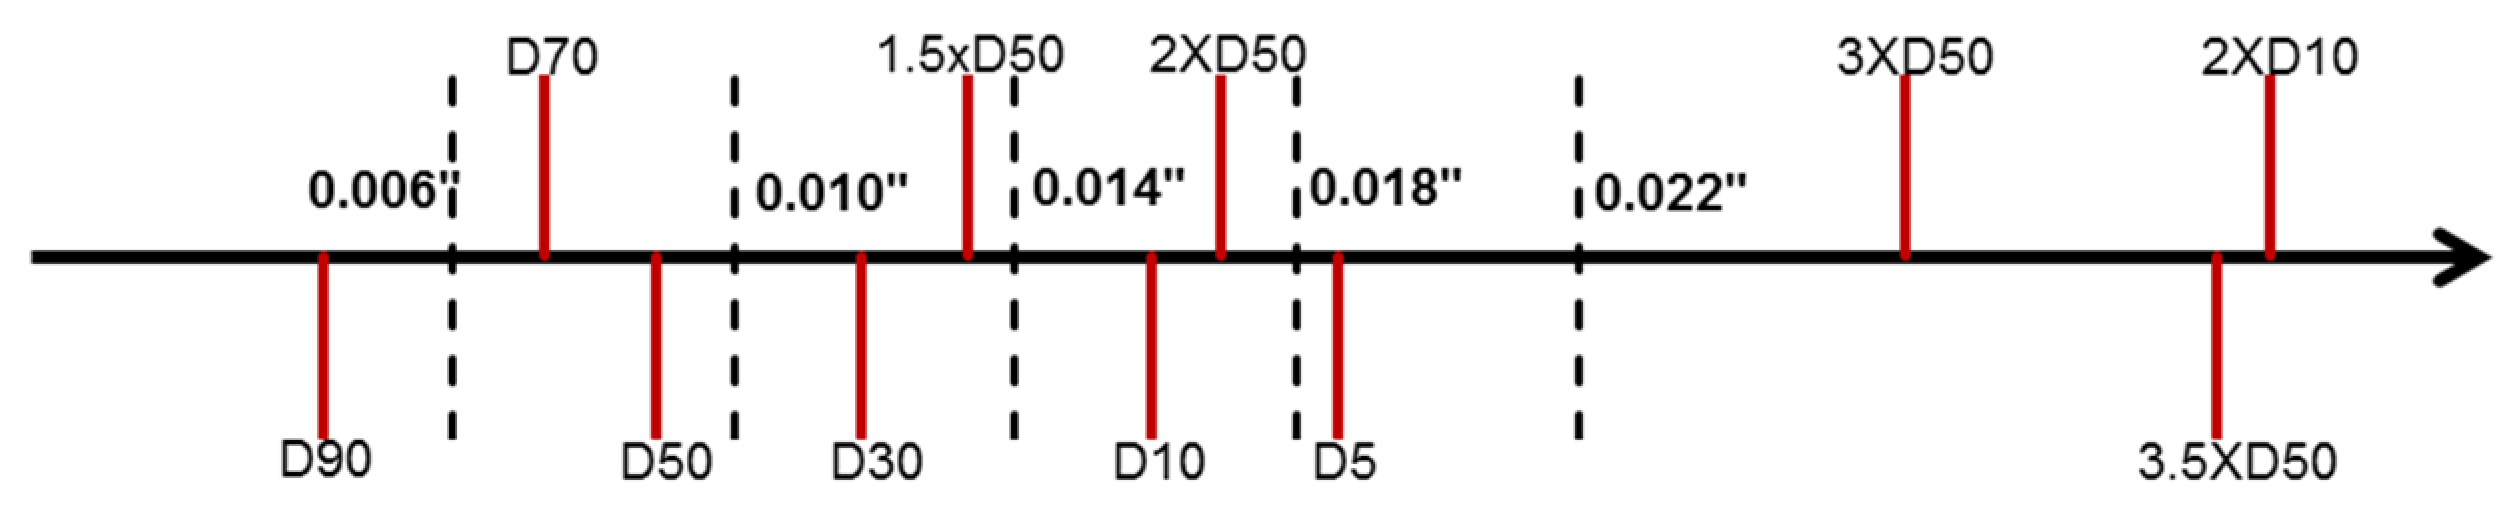
The TLS is a graphical approach to rank the performance of different aperture sizes for specific sand classes proposed by Wang et al. [
34] for slotted liners. This paper uses the same procedure for WWS. The performance is presented on an axial representation of the PSD (
Figure 8) that contains representative D-values along the axis (red lines) as well as the aperture sizes implemented in the testing (dashed lines). The performance limits are used to categorize the response of WWS as acceptable, marginal, and unacceptable for sand retention and flow performance.
Table 3 presents the color definitions for each indicator.
6.2. Design Criteria
The criteria differentiate two production scenarios, including regular and aggressive SAGD conditions. Experimental results up to the last liquid stage represent a regular SAGD case where a well exhibits changes in flow rate and water cuts throughout its life. The aggressive flow, defined as the flow during the three-phase flow condition, represents the steam breakthrough (see
Figure 5). SAGD operators strive to identify “hot spots” and control these events due to their impact on the steam-chamber growth efficiency and risks of liner damage.
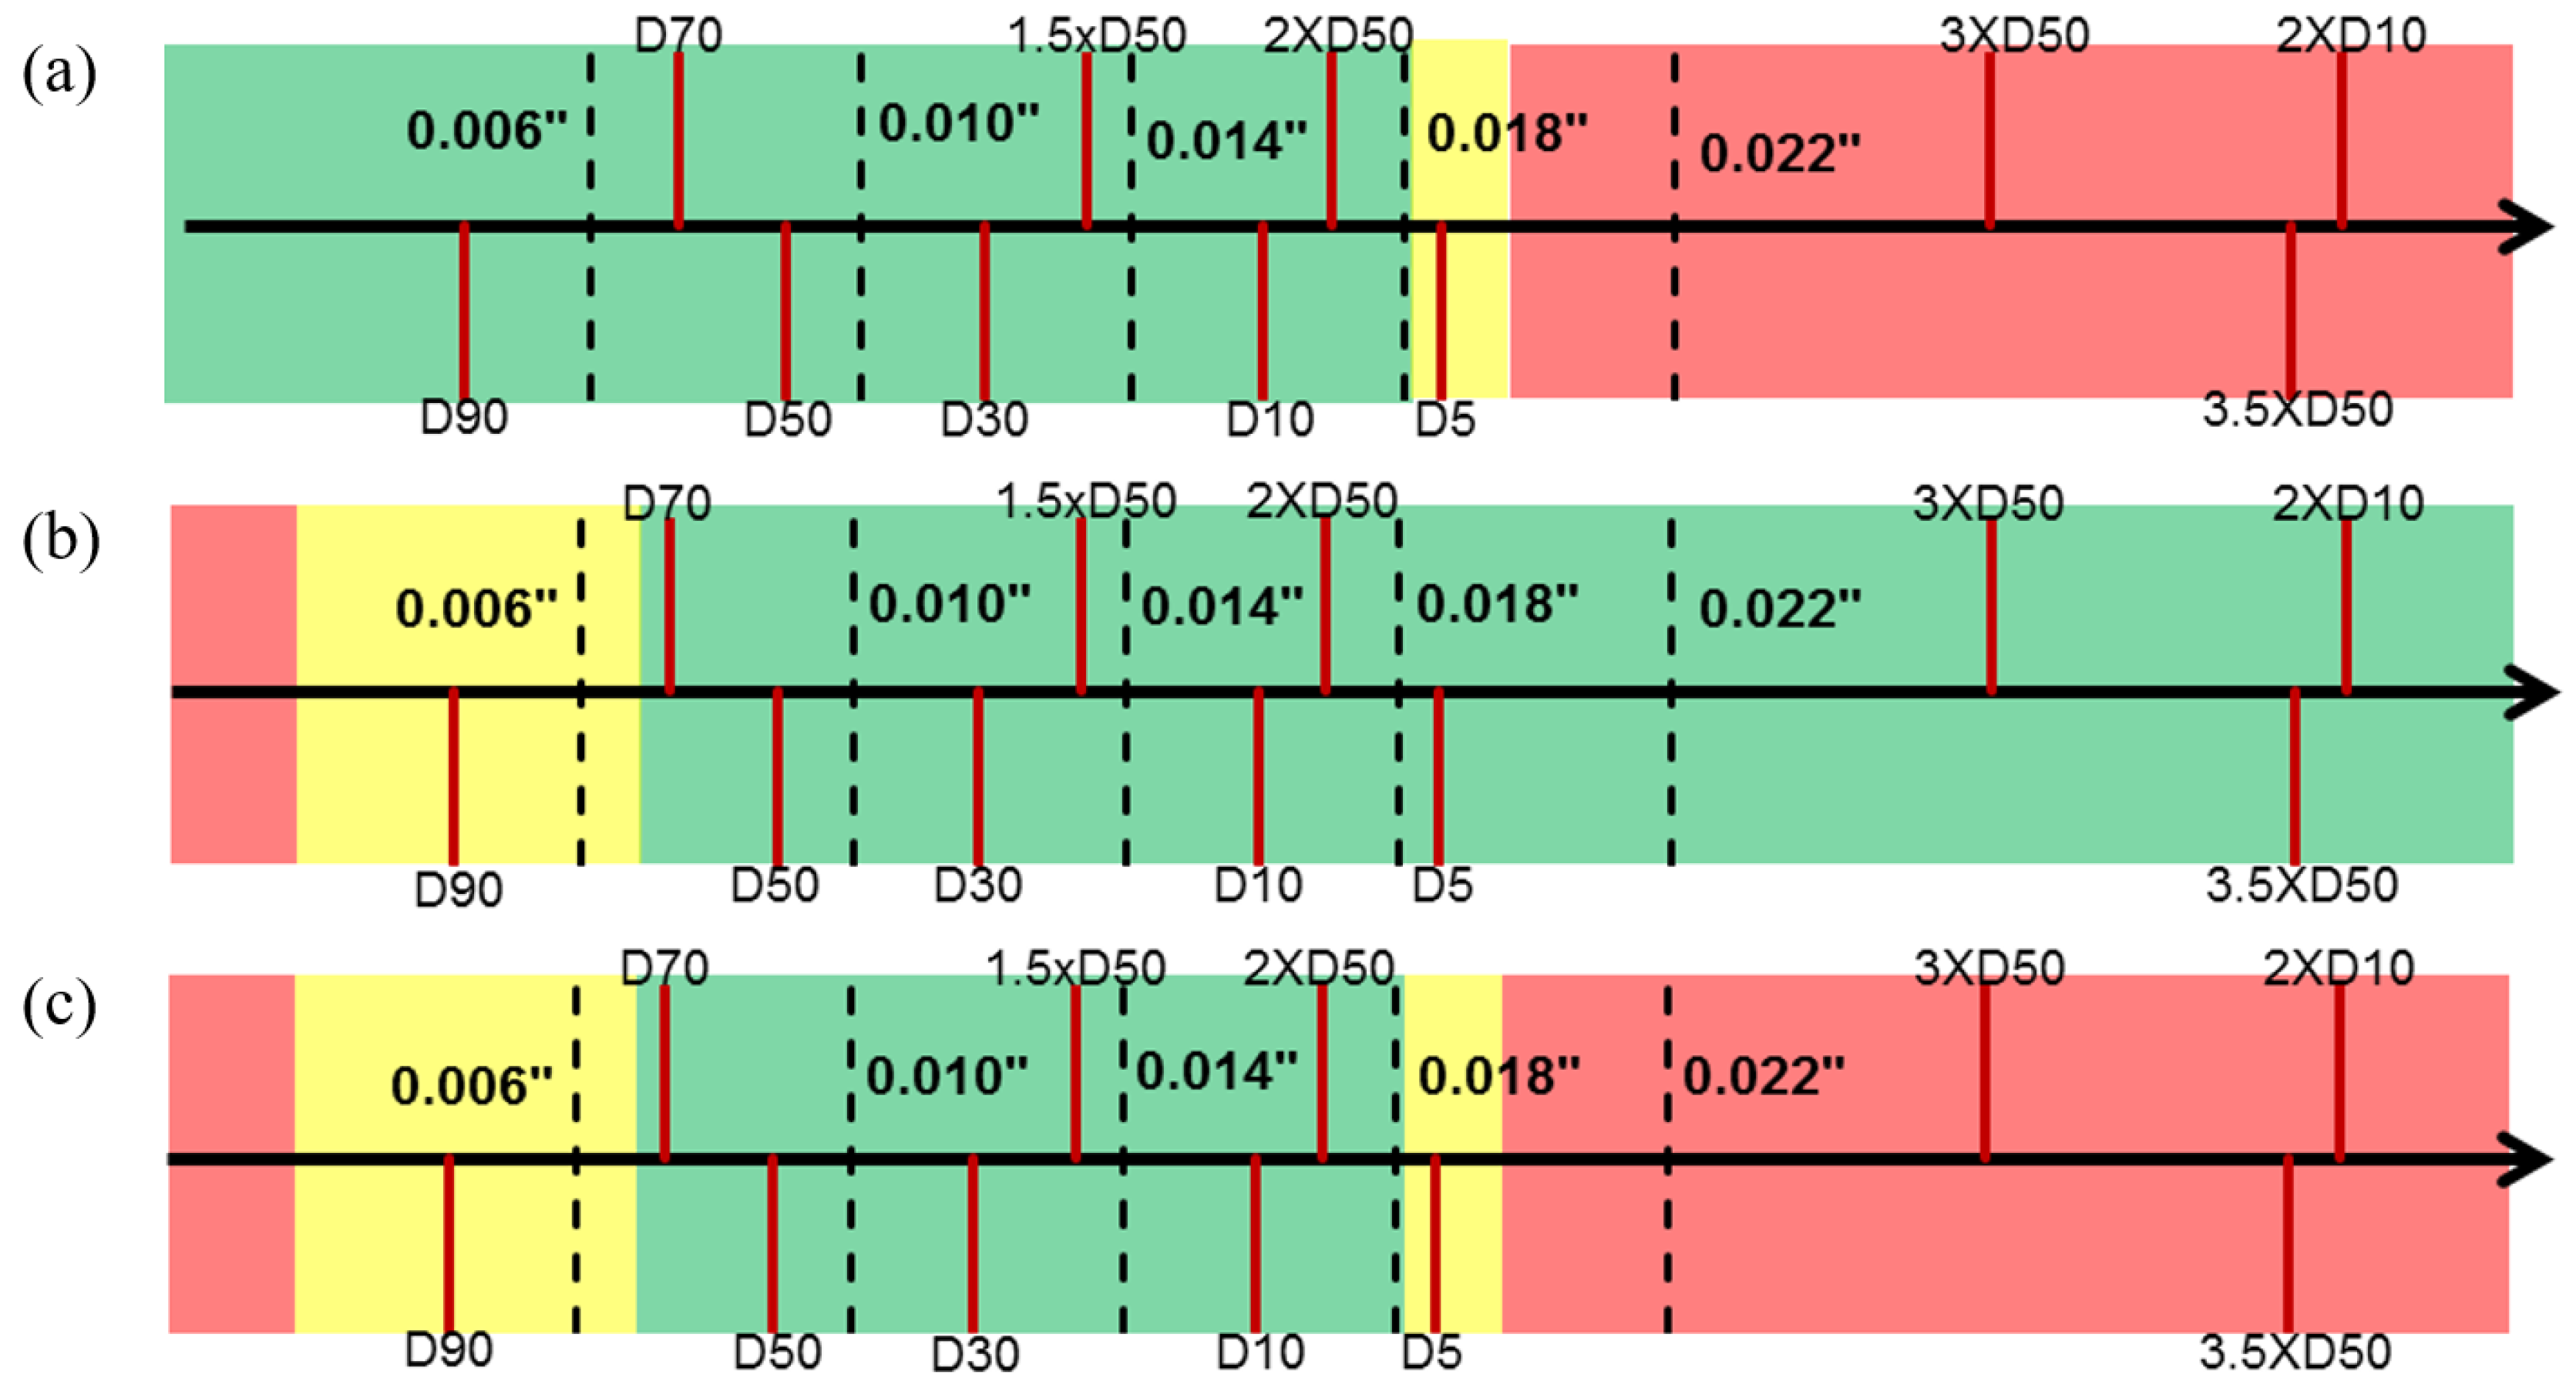
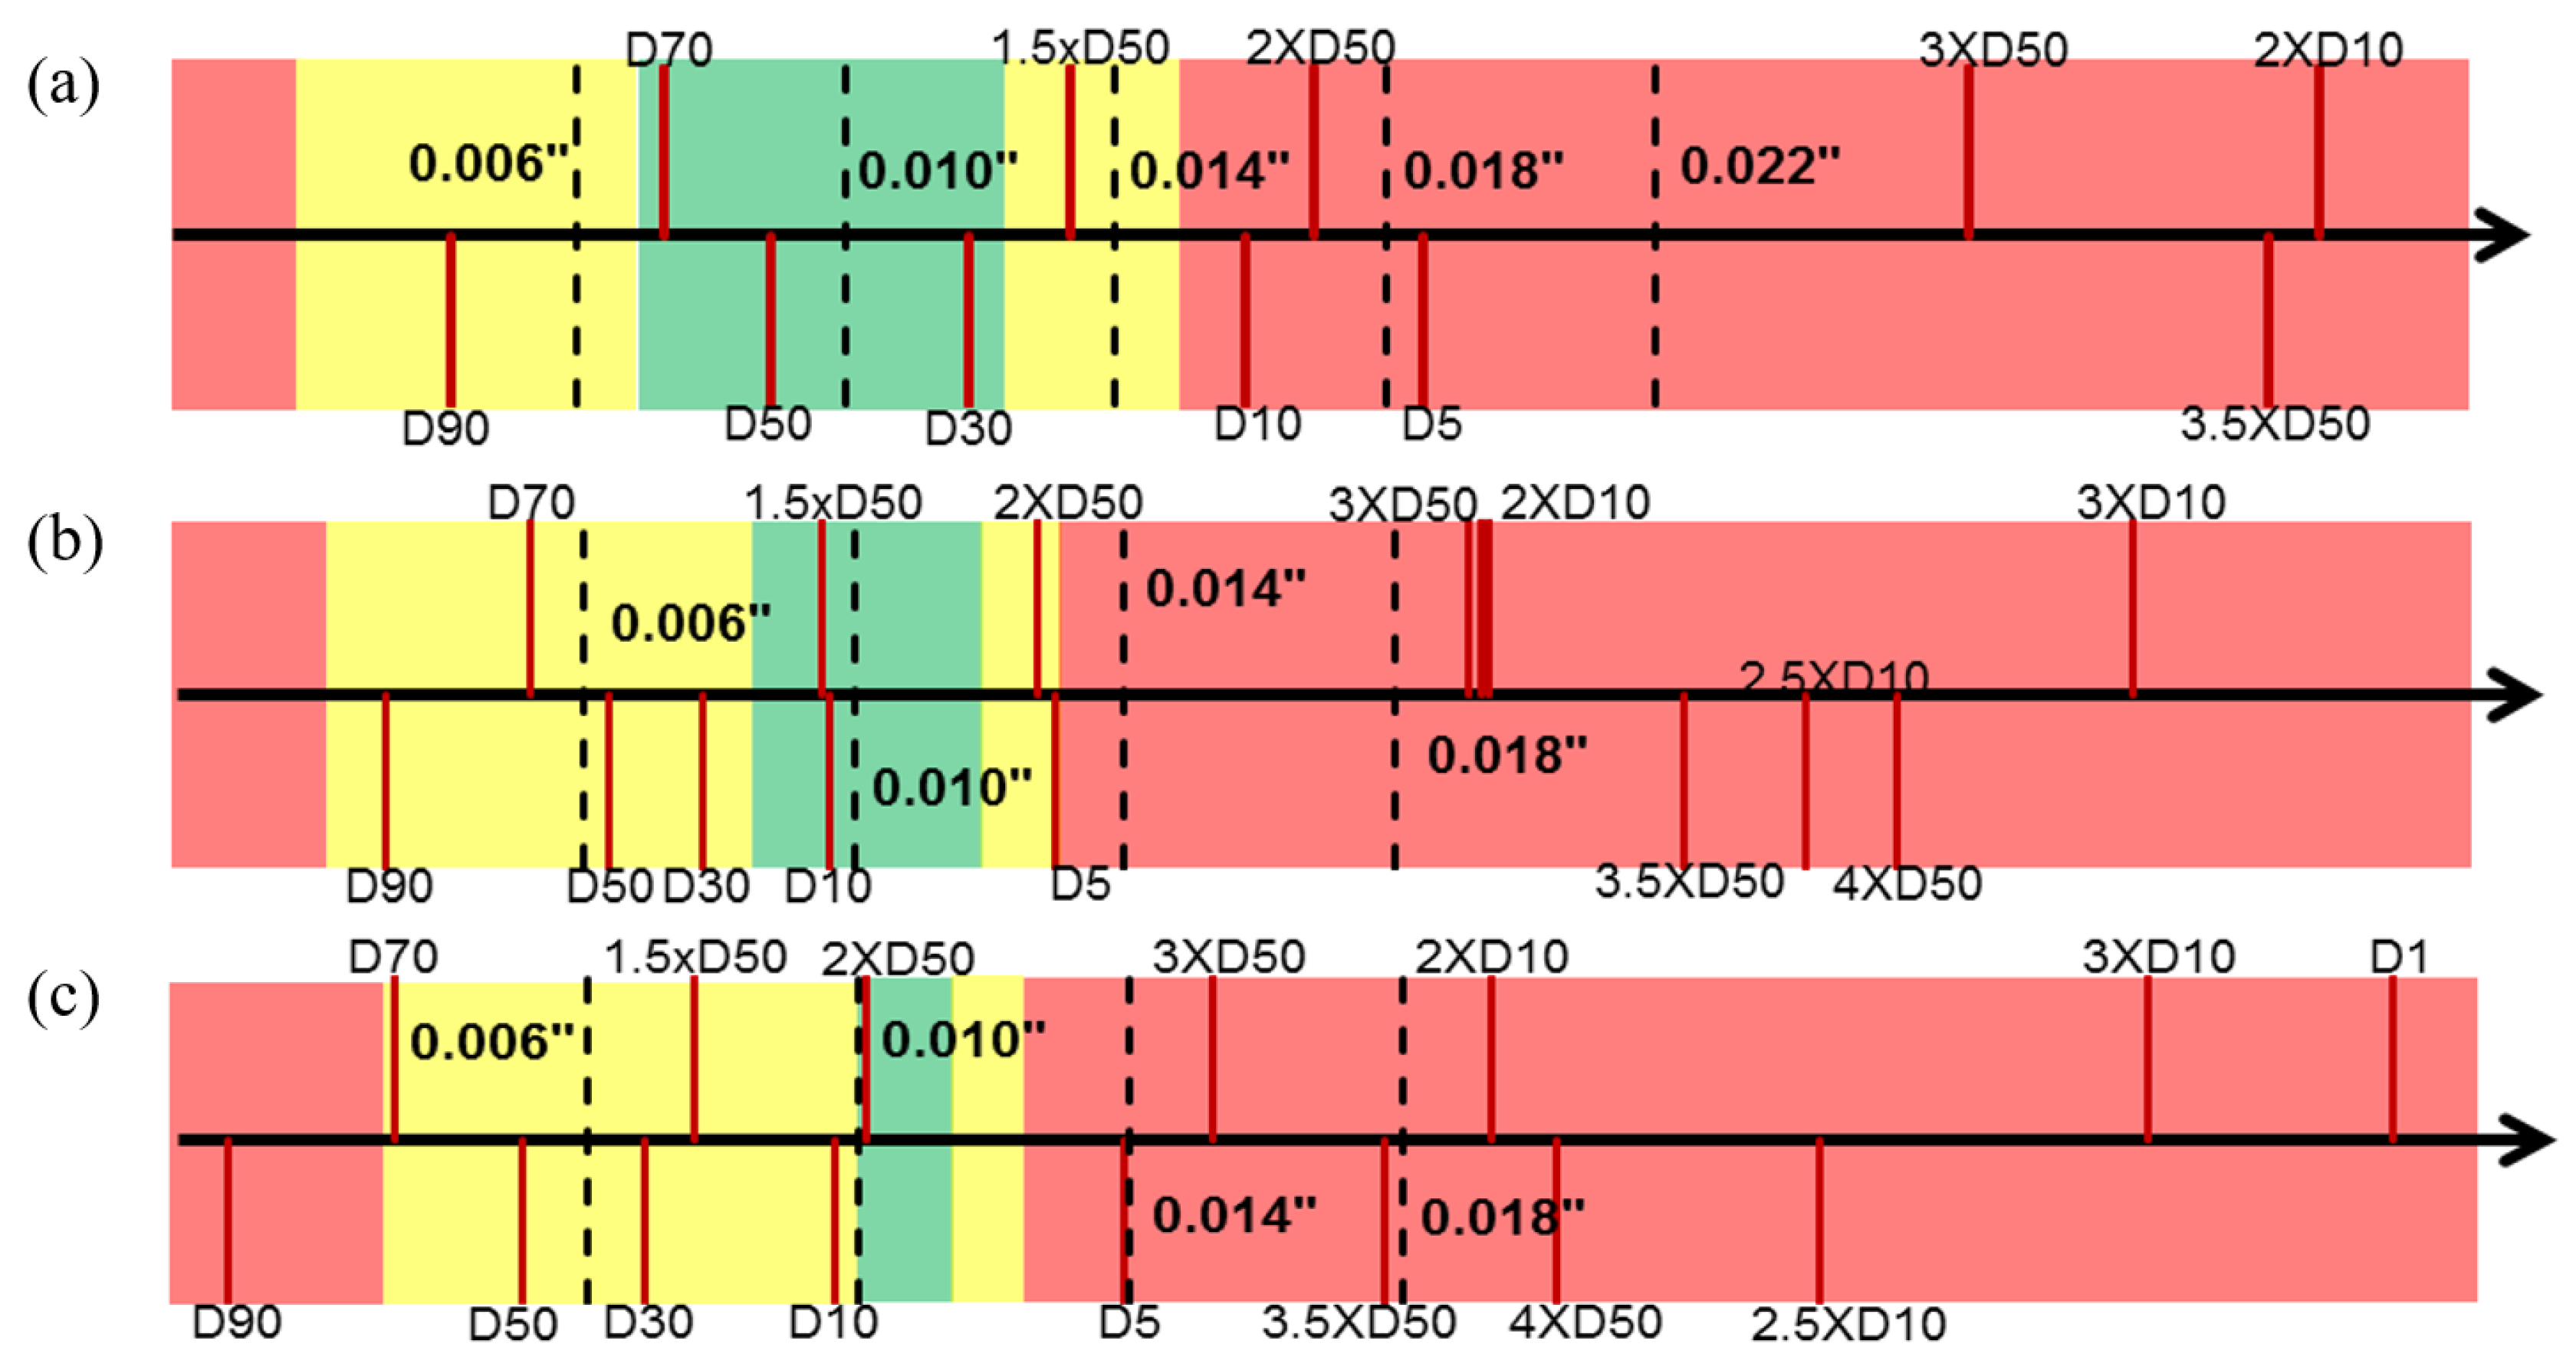
Figure 9a,b show an example of the axes for sand retention and flow performance for DC-III, respectively, under regular conditions. Combining both performance indicators generates the optimum aperture window (
Figure 9c). The same method is used to create the final aperture size window for DC-II and DC-I under regular SAGD conditions (
Figure 10). The safe aperture window narrows down from DC-III to DC-I. Fine sands produce more solids, requiring the implementation of smaller apertures. However, smaller apertures promote pore and slot plugging, reducing the range of optimum sizes.
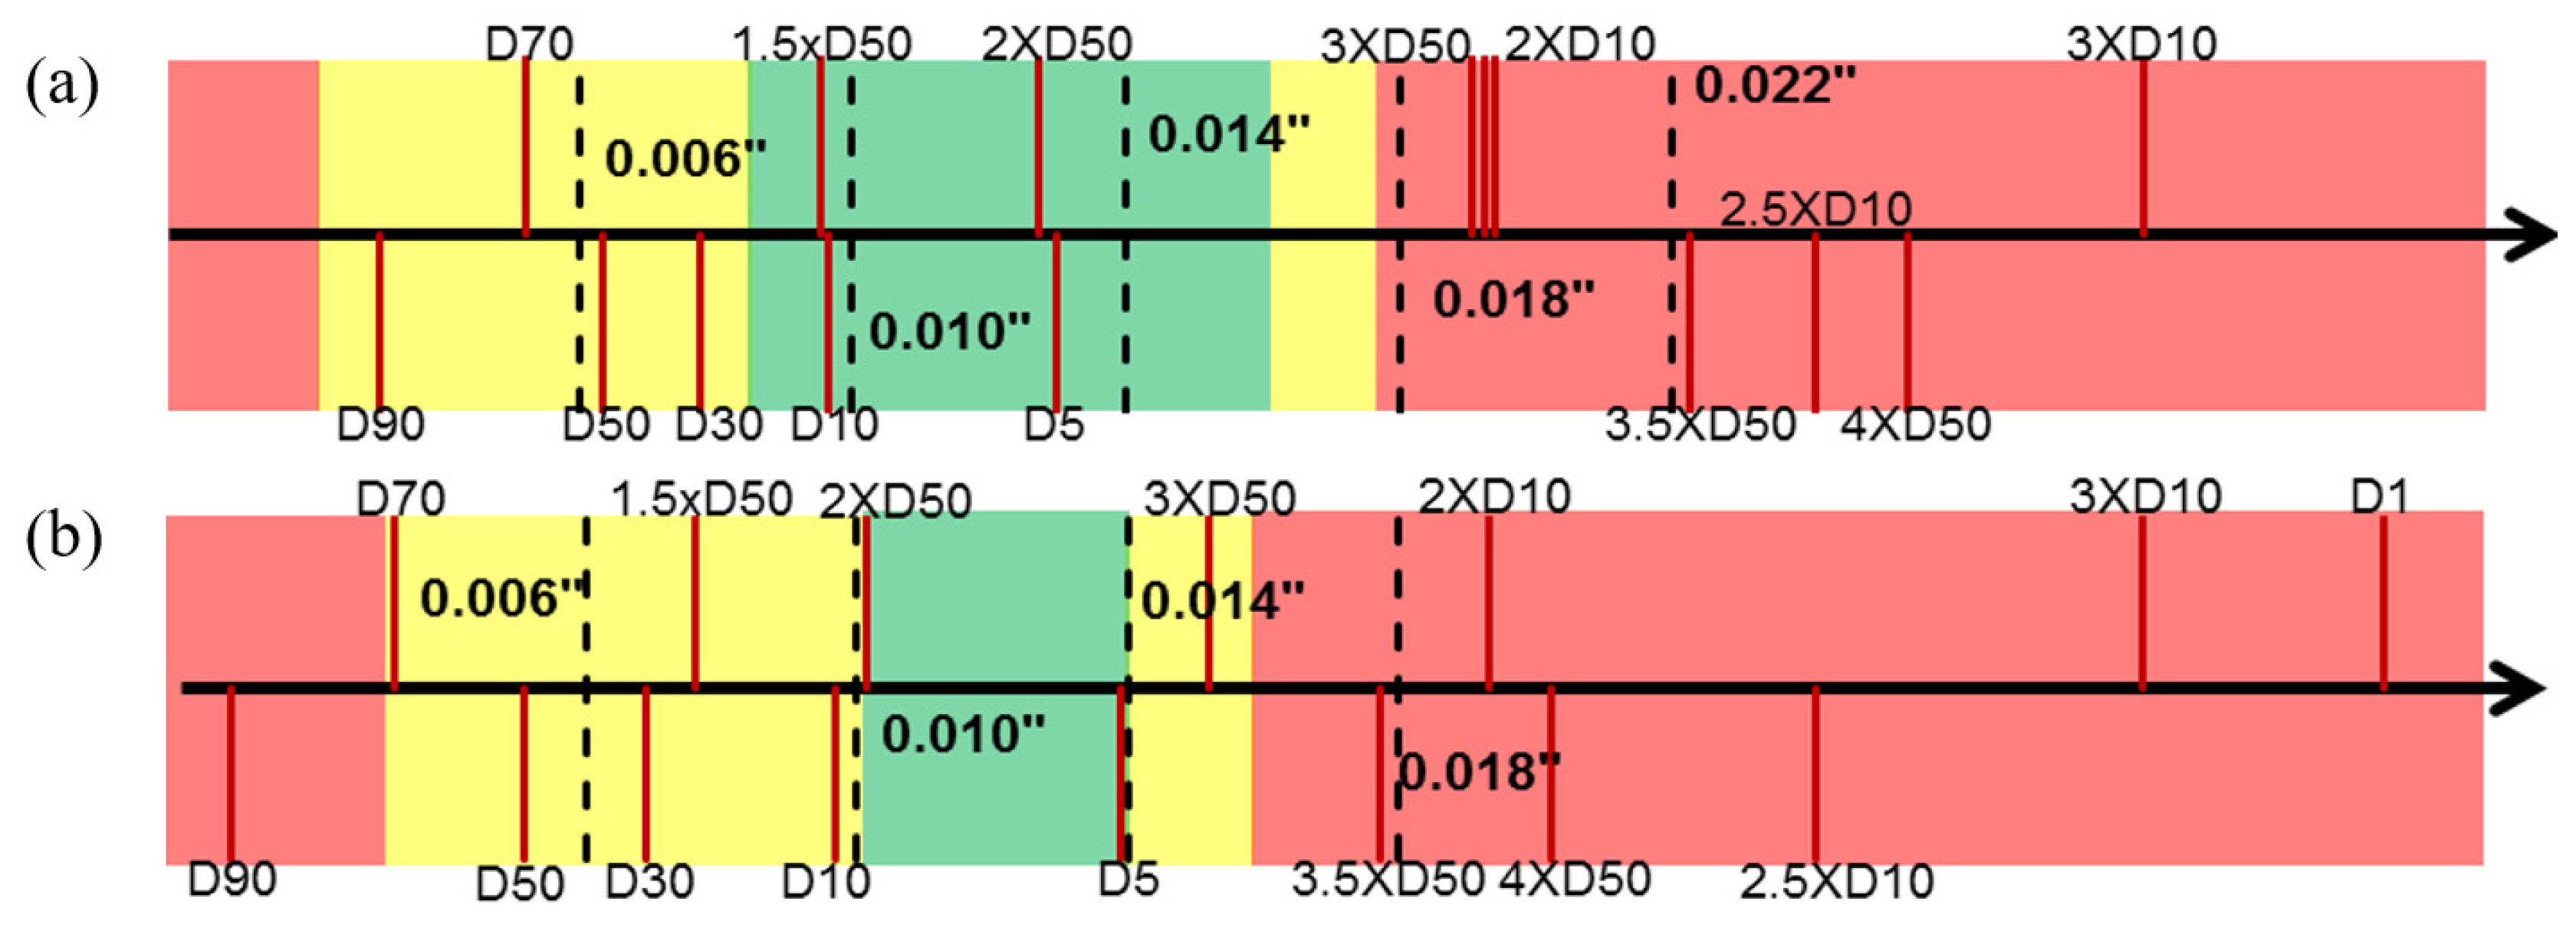
Figure 11 presents the TLS design criteria for the samples in aggressive conditions (during steam influx). By comparing the TLS criteria for regular and aggressive flow situations, it is evident that the aperture window shrinks for the aggressive condition. The reason is high levels of sanding due to strong drag forces during gas flow, shifting the upper bound to the left.
In summary, the high OFA of WWS results in low pressure gradients and high fines discharge that reduce pore plugging potential. As a benefit of high OFA, WWS allows the selection of narrow apertures that can handle a wide range of PSDs. However, for coarser sands, selecting narrow apertures may diminish the advantages of high OFA. Furthermore, the TLS shows how the adequacy of current criteria (i.e., D10, 2D50) is highly dependent on production scenarios, and that such simple criteria do not work consistently for all PSDs. Therefore, the graphical design criteria are created for each sand class, accounting for the entire shape of the PSD curve and the operating conditions.
7. Discussion
This paper presents the performance of WWS through an experimental study by including several key parameters, such as flow rate, water cut, PSD, and aperture size. Based on the sanding and flow performance, the aperture design criteria are generated for different SAGD operation conditions, which could provide some guidance to the field engineers in selecting the proper aperture size.
It should be mentioned here that there are more influential factors in the testing design that are not investigated in this study, such as temperature, paraffin deposition, etc. [
35,
36]. Thus, additional testing scenarios and field data are required to validate and calibrate the proposed aperture design criteria.
8. Conclusions
This research introduces design criteria for WWS in SAGD applications, considering the role of operational scenarios, flow rate, PSD, and aperture size on the screen performance. The results show that production scenarios strongly influence sanding intensity; wider slots exhibit extreme sanding levels during steam-breakthrough stages but respond reasonably well during liquid stages. Drag forces play a critical factor in disrupting particle bridges. A positive conclusion for WWS is that the retained permeability values stay above acceptable limits (50–70%), even for finer sands. WWS displays a substantial ability to release fines.
Sanding and flow performance results are combined to determine optimum-aperture windows for three sand classes using the TLS approach, incorporating PSD and production scenarios. Aggressive conditions shrink the safe-aperture window compared to normal SAGD conditions, which signifies the influence of operational practices in the performance of screens. Elevated flow rates and steam production significantly impact sanding and plugging and must be considered in aperture size design. For instance, for low sub-cool levels, the risk for the steam influx is more eminent, and the effect of aggressive conditions would affect the aperture sizing selection.
Author Contributions
J.D.M.P. (Conceptualization, methodology, validation, investigation, writing—original draft preparation); C.W. (methodology, validation, investigation, writing—original draft preparation); M.H. (investigation, resources, writing—review and editing, visualization); A.N. (validation, writing—review and editing, funding acquisition, supervision). All authors have read and agreed to the published version of the manuscript.
Funding
This research was funded by RGL Reservoir Management (now Variperm Energy Services) and The Natural Sciences and Engineering Research Council of Canada (NSERC) through their CRD program-Grant # NSERC CRDPJ 488486.
Institutional Review Board Statement
Not applicable.
Informed Consent Statement
Not applicable.
Data Availability Statement
Acknowledgments
The authors acknowledge the support and feedback from colleagues in the sand control lab during this research.
Conflicts of Interest
The authors declare no conflict of interest.
Abbreviations
| OFA | Open-to-Flow Area |
| PS | Punched Screens |
| PSD | Particle Size Distribution |
| SAGD | Steam Assisted Gravity Drainage |
| SAS | Standalone Screens |
| SCD | Sand Control Devices |
| SL | Slotted Liner |
| SRT | Sand Retention Test |
| TLS | Traffic Light System |
| WWS | Wire-Wrapped Screen |
References
- Butler, R.M. Gravity Drainage to Horizontal Wells. J. Can. Pet. Technol. 1992, 31, 31–37. [Google Scholar] [CrossRef]
- Collins, P.M. Geomechanical Effects on the SAGD Process. SPE Reserv. Eval. Eng. 2007, 10, 367–375. [Google Scholar] [CrossRef]
- Han, G.; Dusseault, M. Quantitative Analysis of Mechanisms for Water-Related Sand Production. In Proceedings of the International Symposium and Exhibition on Formation Damage Control, Lafayette, LA, USA, 20–21 February 2002. [Google Scholar]
- Ali, M.A.; Al-Hamad, K.; Al-Haddad, A.; AlKholosy, S.; Abu Sennah, H.; Sanyal, T.; Aniel, J. Laboratory Challenges of Sand Production in Unconsolidated Cores. In Proceedings of the SPE Kuwait International Petroleum Conference and Exhibition, Kuwait City, Kuwait, 10–12 December 2012. [Google Scholar]
- Oyeneyin, B. Integrated Sand Management for Effective Hydrocarbon Flow Assurance, Chapter 6: Sand Control Completion Strategy. In Developments in Petroleum Science Series; Elsevier: Amsterdam, The Netherlands, 2015. [Google Scholar]
- Suman, G.O.; Ellis, R.C.; Snyder, R.E. Sand Control Handbook, 2nd ed.; Gulf Publishing Company, Book Division: Houston, TX, USA, 1983. [Google Scholar]
- Bennion, D.B.; Gupta, S.; Gittins, S.; Hollies, D. Protocols for Slotted Liner Design for Optimum SAGD Operation. J. Can. Pet. Technol. 2009, 48, 21–26. [Google Scholar] [CrossRef]
- Fattahpour, V.; Mahmoudi, M.; Wang, C.; Kotb, O.; Roostaei, M.; Nouri, A.; Fermaniuk, B.; Sauve, A.; Sutton, C. Comparative Study on the Performance of Different Standalone Sand Control Screens. In Proceedings of the SPE International Conference and Exhibition on Formation Damage Control, Lafayette, LA, USA, 7–9 February 2018. [Google Scholar]
- Romanova, U.; Ma, T. An Investigation on the Plugging Mechanisms in a Slotted Liner from the Steam-Assisted Gravity Operations. In Proceedings of the SPE European Formation Damage Conference & Exhibition, Noordwijk, The Netherlands, 3–4 June 2013. [Google Scholar]
- Montero Pallares, J.D.; Wang, C.; Haftani, M.; Nouri, A. Experimental Correlations for the Performance and Aperture Selection of Wire-Wrapped Screens in Steam-Assisted Gravity Drainage Production Wells. SPE Prod. Oper. 2020, 35, 537–548. [Google Scholar] [CrossRef]
- Matanovic, D.; Cikes, M.; Moslavac, B. Sand Control in Well Construction and Operation, 1st ed.; Springer Science & Business Media: Berlin/Heidelberg, Germany, 2012. [Google Scholar]
- Markestad, P.; Christie, O.; Espedal, A.; Rorvik, O. Selection of Screen Slot Width to Prevent Plugging and Sand Production. In Proceedings of the SPE Formation Damage Control Symposium, Lafayette, LA, USA, 14–15 February 1996. [Google Scholar]
- Kaiser, T.M.V.; Wilson, S.; Venning, L.A. Inflow Analysis and Optimization of Slotted Liners. SPE Drill Complet. 2002, 17, 200–209. [Google Scholar] [CrossRef]
- Romanova, U.G.; Ma, T.; Piwowar, M.; Strom, R.; Stepic, J. Thermal Formation Damage and Relative Permeability of Oil Sands of the Lower Cretaceous Formations in Western Canada. In Proceedings of the SPE Canada Heavy Oil Technical Conference, Calgary, AB, Canada, 9–11 June 2015. [Google Scholar]
- Coberly, C.J. Selection of Screen Openings for Unconsolidated Sands. In Proceedings of the Drilling and Production Practice, New York, NY, USA, 1 January 1937. [Google Scholar]
- Driscoll, F.G. Groundwater and Wells, 2nd ed.; Johnson Filtration Systems Inc.: St. Paul, MN, USA, 1986. [Google Scholar]
- Gillespie, G.; Deem, C.K.; Malbrel, C. Screen Selection for Sand Control Based on Laboratory Tests. In Proceedings of the SPE Asia Pacific Oil and Gas Conference and Exhibition, Brisbane, Australia, 17–19 October 2000. [Google Scholar]
- Ballard, T.; Beare, S. An Investigation of Sand Retention Testing with a View to Developing Better Guidelines for Screen Selection. In Proceedings of the SPE International Symposium on Formation Damage Control, Lafayette, LA, USA, 23–24 February 2012. [Google Scholar]
- Guo, Y.; Roostaei, M.; Nouri, A.; Fattahpour, V.; Mahmoudi, M.; Jung, H. Effect of Stress Build-Up around Standalone Screens on the Screen Performance in SAGD Wells. J. Pet. Sci. Eng. 2018, 171, 325–339. [Google Scholar] [CrossRef]
- Abram, M.; Cain, G. Particle-Size Analysis for the Pike 1 Project, McMurray Formation. J. Can. Pet. Technol. 2014, 53, 339–354. [Google Scholar] [CrossRef]
- Mahmoudi, M.; Fattahpour, V.; Nouri, A.; Rasoul, S.; Yao, T.; Baudet, B.A.; Leitch, M.; Soroush, M. An Investigation into the Use of Commercial Sands and Fines to Replicate Oil Sands for Large-Scale Sand Control Testing. In Proceedings of the SPE Thermal Well Integrity and Design Symposium, Banff, AB, Canada, 28 November–1 December 2016. [Google Scholar]
- Haftani, M.; Wang, C.; Montero, J.; Mahmoudi, M.; Fattahpour, V.; Nouri, A. An Investigation into the Effect of Brine Salinity on Fines Migration in SAGD Operations. In Proceedings of the SPE Western Regional Meeting, San Jose, CA, USA, 23–26 April 2019. [Google Scholar]
- Ladd, R.S. Preparing Test Specimens Using Undercompaction. Geotech. Test. J. 1978, 1, 16–23. [Google Scholar]
- Stahl, R.M.; Smith, J.D.; Hobbs, S.; Clark, C.M. Application of Intelligent Well Technology to a SAGD Producer: Firebag Field Trial. In Proceedings of the SPE Heavy Oil Conference-Canada, Calgary, AB, Canada, 10–12 June 2014. [Google Scholar]
- Wu, B.; Tan, C.P. Effect of Water-cut on Sandstone Strength and Implications in Sand Production Prediction. In Proceedings of the DC Rocks 2001, The 38th U.S. Symposium on Rock Mechanics (USRMS), Washington, DC, USA, 7–10 July 2001. [Google Scholar]
- Wang, C.; Montero Pallares, J.D.; Haftani, M.; Nouri, A. Developing a Methodology to Characterize Formation Damage (Pore Plugging) due to Fines Migration in Sand Control Tests. J. Pet. Sci. Eng. 2020, 186, 106793. [Google Scholar] [CrossRef]
- Chanpura, R.A.; Mondal, S.; Sharma, M.M.; Andrews, J.S.; Mathisen, A.M.; Martin, F.; Marpaung, F.; Ayoub, J.A.; Parlar, M. Unraveling the Myths Associated with Selection of Standalone Screens and a New Methodology for Sand Control Applications. SPE Drill. Complet. 2013, 28, 227–236. [Google Scholar] [CrossRef]
- Muecke, T.W. Formation Fines and Factors Controlling Their Movement in Porous Media. J. Pet. Technol. 1979, 31, 144–150. [Google Scholar] [CrossRef]
- Santamarina, C. Soil Behavior at the Microscale: Particle Forces. In Proceedings of the ASCE Symposium on Soil Behavior and Soft Ground Construction, in Honor of Charles, C. Ladd, Cambridge, MA, USA, 5–6 October 2001. [Google Scholar]
- Vaziri, H.; Barree, B.; Xiao, Y.; Ian, P.; Kutas, M. What is the Magic of Water in Producing Sand? In Proceedings of the SPE Annual Technical Conference and Exhibition, San Antonio, TX, USA, 29 September–2 October 2002. [Google Scholar]
- Montero, J.; Chissonde, S.; Kotb, O.; Wang, C.; Roostaei, M.; Nouri, A.; Mahmoudi, M.; Fattahpour, V. A Critical Review of Sand Control Evaluation Testing for SAGD Applications. In Proceedings of the SPE Canada Heavy Oil Technical Conference, Calgary, AB, Canada, 13–14 March 2018. [Google Scholar]
- Hodge, R.M.; Burton, R.C.; Constien, V.; Skidmore, V. An Evaluation Method for Screen-only and Gravel-pack Completions. In Proceedings of the International Symposium and Exhibition on Formation Damage Control, Lafayette, LA, USA, 10–12 February 2002. [Google Scholar]
- Burton, R.C.; Hodge, R.M. The Impact of Formation Damage and Completion Impairment on Horizontal Well Productivity. In Proceedings of the SPE Annual Technical Conference and Exhibition, New Orleans, LA, USA, 27–30 September 1998. [Google Scholar]
- Wang, C.; Pang, Y.; Mahmoudi, M.; Haftani, M.; Salimi, M.; Fattahpour, V.; Nouri, A. A Set of Graphical Design Criteria for Slotted Liners in Steam Assisted Gravity Drainage Production Wells. J. Pet. Sci. Eng. 2020, 185, 106608. [Google Scholar] [CrossRef]
- Ilyushin, Y.V.; Fetisov, V. Experience of Virtual Commissioning of a Process Control System for the Production of High-Paraffin Oil. Sci. Rep. 2022, 12, 18415. [Google Scholar] [CrossRef] [PubMed]
- Lira-Galeana, C.; Hammami, A. Chapter 21 Wax Precipitation from Petroleum Fluids: A Review. In Developments in Petroleum Science; Elsevier: Amsterdam, The Netherlands, 2000; Volume 40, pp. 557–608. [Google Scholar]
Figure 1.
(a) A schematic of the SAGD process, (b) steam chamber, (c–e) the depiction of sand control devices and their respective slot geometry, (c) Slotted Liner, (d) Wire-Wrapped Screens, and (e) Punched Screens.
Figure 1.
(a) A schematic of the SAGD process, (b) steam chamber, (c–e) the depiction of sand control devices and their respective slot geometry, (c) Slotted Liner, (d) Wire-Wrapped Screens, and (e) Punched Screens.
Figure 2.
(a) Pre-packed SRT, schematic, (b) sand-pack sections. Lb, Lm, and Lt represent the length of near-screen, middle, and top intervals.
Figure 2.
(a) Pre-packed SRT, schematic, (b) sand-pack sections. Lb, Lm, and Lt represent the length of near-screen, middle, and top intervals.
Figure 3.
PSD of formation sands and corresponding synthetic samples; (a) DC-III, (b) DC-II, (c) DC-I.
Figure 3.
PSD of formation sands and corresponding synthetic samples; (a) DC-III, (b) DC-II, (c) DC-I.
Figure 4.
(a) Testing program and (b) schematic of WWS coupons with design specifications.
Figure 4.
(a) Testing program and (b) schematic of WWS coupons with design specifications.
Figure 5.
Fluid injection program.
Figure 5.
Fluid injection program.
Figure 6.
Cumulative sand production; (a) DC-III, (b) DC-II, (c) DC-I. Red and yellow horizontal lines represent the sanding limits of 0.15 lb/ft2 and 0.12 lb/ft2, respectively.
Figure 6.
Cumulative sand production; (a) DC-III, (b) DC-II, (c) DC-I. Red and yellow horizontal lines represent the sanding limits of 0.15 lb/ft2 and 0.12 lb/ft2, respectively.
Figure 7.
Retained permeability for different aperture sizes and sand classes. The red and yellow lines represent the retained permeability limits of 50% and 70%, respectively.
Figure 7.
Retained permeability for different aperture sizes and sand classes. The red and yellow lines represent the retained permeability limits of 50% and 70%, respectively.
Figure 8.
Example of linear x-axis representation of the PSD for DC-III.
Figure 8.
Example of linear x-axis representation of the PSD for DC-III.
Figure 9.
Aperture window for DC-III for regular SAGD conditions (red: unacceptable, yellow: marginal, green: acceptable); (a) sanding performance, (b) flow performance, (c) overall design window.
Figure 9.
Aperture window for DC-III for regular SAGD conditions (red: unacceptable, yellow: marginal, green: acceptable); (a) sanding performance, (b) flow performance, (c) overall design window.
Figure 10.
Overall aperture window in regular SAGD conditions (red: unacceptable, yellow: marginal, green: acceptable): (a) DC-II, (b) DC-I.
Figure 10.
Overall aperture window in regular SAGD conditions (red: unacceptable, yellow: marginal, green: acceptable): (a) DC-II, (b) DC-I.
Figure 11.
Overall aperture window in aggressive SAGD conditions (red: unacceptable, yellow: marginal, green: acceptable); (a) DC-III, (b) DC-II, (c) DC-I.
Figure 11.
Overall aperture window in aggressive SAGD conditions (red: unacceptable, yellow: marginal, green: acceptable); (a) DC-III, (b) DC-II, (c) DC-I.
Table 1.
PSD Characteristics of the McMurray Formation Sands.
Table 1.
PSD Characteristics of the McMurray Formation Sands.
| Sand | D90 | D70 | D50 | D40 | D10 | Uniformity
Coefficient | Sorting
Coefficient |
|---|
| DC-I | 25 | 80 | 135 | 147 | 232 | 5.9 | 9.3 |
| DC-II | 76 | 118 | 175 | 205 | 260 | 2.7 | 3.4 |
| DC-III | 110 | 187 | 215 | 264 | 341 | 2.4 | 3.1 |
| Uniformity Coefficient (UC = D40/D90), Sorting Coefficient (SC = D10/D90 |
Table 2.
Relative permeability at irreducible oil conditions.
Table 2.
Relative permeability at irreducible oil conditions.
| Sand Class | kabs (md) | krel (Fraction) at Sor |
|---|
| DC-I | 950 | 0.48 |
| DC-II | 1800 | 0.52 |
| DC-III | 2400 | 0.54 |
| Disclaimer/Publisher’s Note: The statements, opinions and data contained in all publications are solely those of the individual author(s) and contributor(s) and not of MDPI and/or the editor(s). MDPI and/or the editor(s) disclaim responsibility for any injury to people or property resulting from any ideas, methods, instructions or products referred to in the content. |
© 2023 by the authors. Licensee MDPI, Basel, Switzerland. This article is an open access article distributed under the terms and conditions of the Creative Commons Attribution (CC BY) license (https://creativecommons.org/licenses/by/4.0/).


 Unacceptable
 Marginal
 Acceptable