Abstract
Solid solutions of ceramic pigments of red shade have been synthesized based on YAlO3 perovskite structure doped with chromium by means of conventional synthesis; that is, the “ceramic route”. To optimize this synthesis, an emphasis has been made on the study of stoichiometry, calcination conditions and mineralizer incorporation. Various studies have demonstrated the high stability of perovskite structures, which ensures stable coloration at high temperatures. This is a highly important factor in the ceramic sector, given the scarcity of red glazes functional at temperatures close to those required of porcelain stoneware and their environmental constraints. Such a limitation makes it impossible in the European community to manufacture using toxic materials such as Se and Cd (cadmium sulfoselenide) that offer interesting colors at low temperatures. Pigments have been synthesized within the Y1−xCrxAlO3, YCrxAl1−xO3 and Y1−xAl1−yCrx+yO3 chromium-doped systems in molar ratios between n = 0.01 molar and n = 0.10 molar. The pigments obtained have been characterized by X-ray diffraction to identify the crystalline phases responsible for the shade; that is, the formation of the perovskite crystalline structure YAlO3 responsible for the red shade, together with lateral phases of garnet Y3Al5O12 of lower intensity. Visible ultraviolet spectrophotometry shows absorption bands corresponding to Cr(III) in octahedral position and the appearance of Cr(IV) in both octahedral and tetrahedral positions. The morphology of the samples was studied using a scanning electron microscope, obtaining information from the secondary and back scattered electrons. The viability of its use in ceramic glazes was verified after applying them mixed at 4% by weight in a glaze to an industrial porous single-firing cycle, collecting the L*a*b* chromatic coordinates using a visible ultraviolet spectrophotometer based on the CIE L*a*b* system, giving rise to red colorations.
1. Introduction
Due to the growing interest in obtaining red pigments with stability against various production processes in the ceramic industry, such as porcelain stoneware with higher demands for stability in the face of high temperatures or aggressive size reductions in inkjet technology, new pigment structures have been studied and tested, using different transition metals or rare earth metals [1,2,3,4]. One of the alternatives for red-shade pigments is based on the chromium-doped YAlO3 system [5,6]. The YAlO3 system was first studied by Goldsmith in 1927 and since then it has been considered to be an interesting compound due to its high thermal stability, optical and electrical properties. Yttrium compounds are widely used in the manufacture of luminescent substances that give red color to television picture tube pixels, such as europium-doped yttrium vanadate (YVO4) or europium-doped Y2O3, as well as applications in lenses with high-temperature resistance, infrared windows, lasers and high intensity lamps. Of great interest are pigments based on the YAlO3 system with a perovskite structure with the general formula ABO3, whose structure can be described as a compact cubic packing of anions, originating from 12-coordinated holes occupied by the larger cation A (Y(III)). The cation A (Y(III)) is surrounded by 12 oxygen ions, and a quarter of the octahedral holes are formed by cations B (Al(III) and Cr(III), which are surrounded by six oxygen ions. Cation A (Y(III)) is in the hole formed by eight neighboring octahedrons that delimit a cube. The “ideal” perovskite structure presents a cubic symmetry; however, in the yttrium (YAlO3) perovskite, the structure is distorted in orthorhombic symmetry. The incorporation of cations of different sizes can cause distortions in the network, modifying the bond angles and giving rise to the ferroelectric phenomena, which are important properties for technical applications of perovskite. The color is due to the incorporation formation of Cr(III) ions (ion radius = 0.54 Å), which replaces some Al(III) cations (ion radius = 0.62 Å) [3], causing an increase in the crystalline field on Cr(III) in octahedral coordination. This phenomenon causes electronic transitions at higher energies between d orbitals, producing red tones in the absorption spectrum. The intensity of the crystalline field on the Cr(III) chromophore ion can be controlled by decreasing the Cr–O distance by incorporating the A cation with elements of high cationic radius, such as the lanthanides. Within this group, the cation Y3+ stands out (ionic radius = 0.89 Å), whose incorporation increases the tetragonal distortion of the d orbitals of the Cr(III) ion, intensifying the crystalline field [7,8,9]. The energy levels of Cr3+ in an octahedral environment give rise to absorption bands in the visible spectrum whose position determines the perceived color, and which can be calculated according to the ligand field theory. The parameter of the crystalline field is given by the wavelength of the first allowed transition 4A2g→4T2g, whose energy difference determines the value of said field. Part of the absorbed radiation allows a second transition, 4A2g→4T1g, originating two wide absorption bands whose threshold, or minimum, between bands cause coloration depending on the crystalline field, so that in a weak crystalline field, the absorption band shows signals in the absorption of yellow and blue that are reflected in green and red, giving rise to a green coloration. In strong crystalline fields, the absorption bands move toward more energetic and shorter wavelengths, reflecting in blue, causing the perception of red or purple color [6,10,11,12]. Within the YAlO3 system, phases with a YAG garnet structure (Y3Al5O12) can originate red-brown colorations with 2 mol% chromium doping. Currently, the only pigment cataloged by the DCMA is “uvarovite Victoria green” Ca3Cr3Si2O2. In YAG garnet, Al(III) occupies both the octahedral and tetrahedral holes and Y(III) occupies the dodecahedral holes, crystallizing in a cubic habit so that each octahedron is connected with six tetrahedrons and each tetrahedron with four octahedrons. In this structure, the Cr(III) can occupy the octahedral positions and the Cr(IV) can occupy the tetrahedral positions. Enhancement of the crystalline field is achieved by doping the structure with smaller ions such as Ca(II) or Mg(II) so that Cr(IV) (ionic radius = 0.55 Å) [13] can be incorporated into the octahedral positions. Some studies report this complexity from increasing the crystalline field because the structure is originally very relaxed and the difficulty of controlling the chromium oxidation states in thermal processes, which gives rise to green shade [6,10,14].
In the present study, the synthesis conditions of the perovskite structure (YAlCrO3) are optimized in order to use it as a red ceramic pigment (Figure 1).
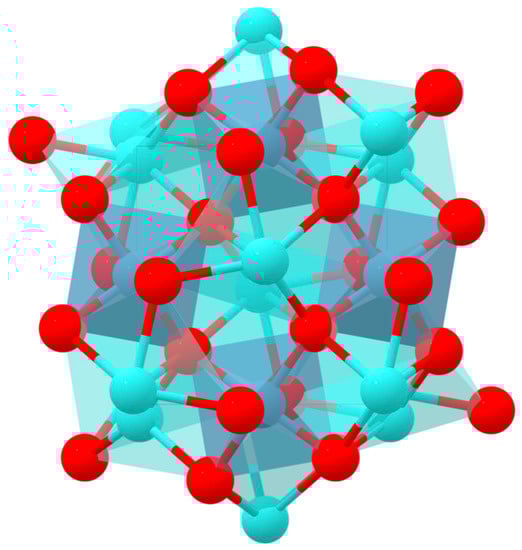
Figure 1.
Theoretical structure of YAlO3 [15]. Data retrieved from the Materials Project for YAlO3 (mp-3792) (database version v2022.10.28).
2. Materials and Methods
Ceramic pigments with a perovskite structure doped with chromium have been prepared with the goal of optimizing stoichiometry and synthesis conditions. A solid-state synthesis route has been used, using different types of flux agents and heat treatment conditions.
The reagents used in the preparation were aluminum hydroxide (Al(OH)3, 99% purity, MERCK), yttrium oxide (Y2O3, 99.5% purity, SIGMA ALDRICH) and chromium oxide (Cr2O3, 99% purity, PANREAC). Moreover, calcium fluoride (CaF2, 99.5% purity, PANREAC) [6] was added as a flux agent in 5% by weight. The nominal compositions prepared are indicated in Table 1. The reagents mixture was homogenized in a planetary ball mill with acetone dispersing medium, drying the resulting material. The powders obtained were dosed in mullite crucibles and subjected to calcination cycles in a Nanetti (Model FCN) furnace at a maximum temperature of 1500 °C with a heating rate of 10 °C/min and 360 min of dwell time at the maximum temperature [6]. The fired material was refined and washed in an agate mortar.

Table 1.
Nominal compositions prepared.
Color development of pigments prepared was tested, introducing them at 4% by weight on a transparent industrial glaze and applying a single-fired ceramic test specimen with a glaze thickness of 0.4 mm. The glazed tiles were subjected to an industrial cycle of 1100 °C with 5 min at the maximum temperature with 50 min of total firing time (cold to cold).
In the Y0.98Al0.98Cr0.04O3 system, the study was carried out using thermal treatment with the maximum temperatures between 1200 °C and 1500 °C and being at the maximum temperature for 2 and 6 h. The designated flux mix, used hereafter, was composed of 3% NaF (99.5% purity, MERCK), 2% MgF2 (99.9% purity, MERCK) and Li2CO3 (99.6% purity, SIGMA ALDRICH) [5,11] introduced at a total of 6% by weight to optimize firing conditions.
The chromatic coordinates of the pigments obtained in this study and the glazed surfaces were determined using an ultraviolet-visible spectrophotometer based on the CIE L∗a∗b∗ system (KONICA MINOLTA, CM-3600A, SpectraMagicNX d65 illumination and 2° observer). The crystalline phases present were obtained by X-ray diffraction (BRUKER AXS, EndeavorD4, determination angles 5–70° 2θ with acquisition time 2 s. 0.05° 2θ). The absorption spectra at defined wavelengths were determined using model ultraviolet-visible spectrophotometry using the UV-Vis-NIR Jasco V670 spectrophotometer measured in the range of 200 nm and 800 nm.
3. Results
3.1. Crystalline Characterization of Systems Y1−xCrxAlO3 and YCrxAl1−xO3
X-ray diffractions of the samples fired at 1500 °C, using CaF2 as a flux agent (Figure 2, Figure 3, Figure 4 and Figure 5) within the Y1−xCrxAlO3 system to show the formation of the YAlO3 perovskite structure as the predominant phase responsible for the red coloration [6,10,11,12,13,14] together with signals of minor garnet phase intensity Y3Al5O12.
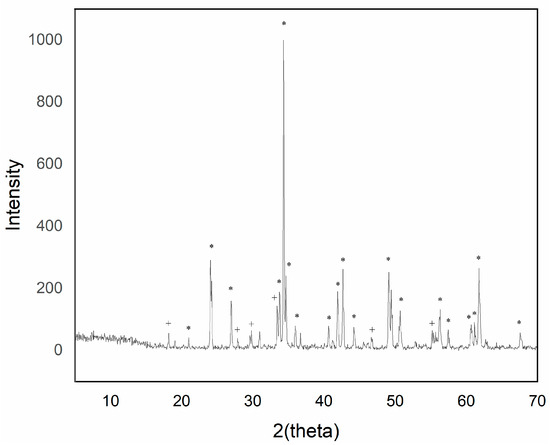
Figure 2.
XRD of sample Y0.99AlCr0.01O3 1500 °C/6 h with 5% w/w CaF2 addition (+ garnet Y3Al5O12 phase; * perovskite YAlO3 phase).
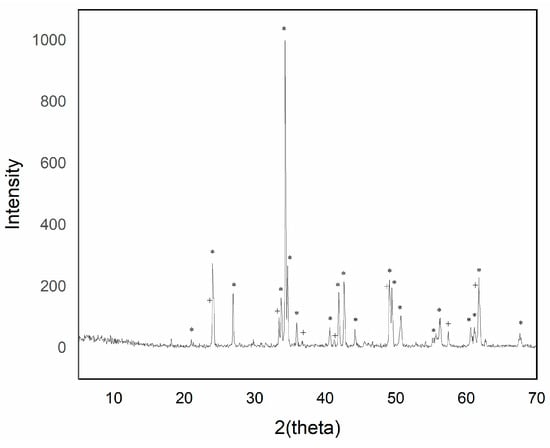
Figure 3.
XRD of sample Y0.97AlCr0.03O3 1500 °C/6 h with 5% w/w CaF2 addition (+ garnet Y3Al5O12 phase; * perovskite YAlO3 phase).
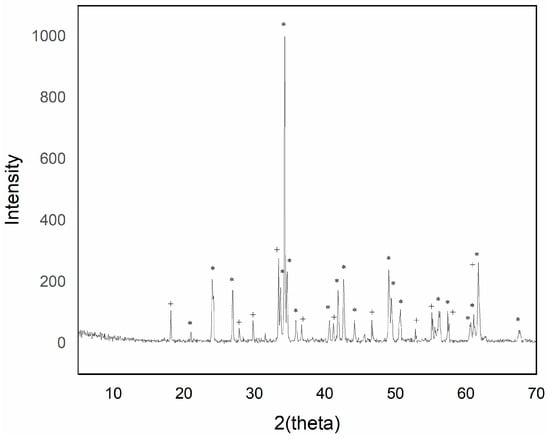
Figure 4.
XRD of sample Y0.95AlCr0.05O3 1500 °C/6 h with 5% w/w CaF2 addition (+ garnet Y3Al5O12 phase; * perovskite YAlO3 phase).
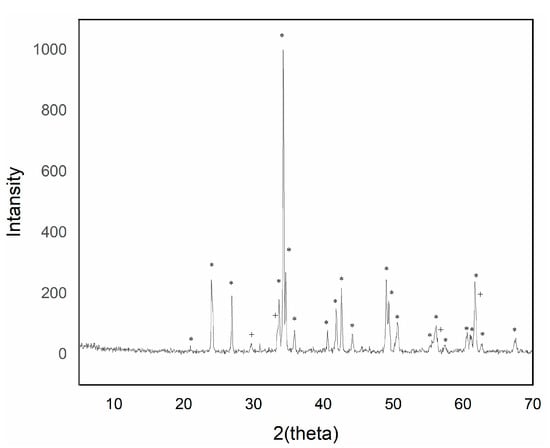
Figure 5.
XRD of sample Y0.90AlCr0.10O3 1500 °C/6 h with 5% w/w CaF2 addition (+ garnet Y3Al5O12 phase; * perovskite YAlO3 phase).
The intensity of the YAlO3 signal in the diffraction peaks increased as the introduced chromium content increased up to a maximum of 0.05 molar chromium. Higher additions of chromium exhibited a greater presence of phase Y3Al5O12, although of low intensity.
Visible ultraviolet spectrophotometry (Figure 6) showed the evolution of the absorption bands detected in the studied pigments, which gave rise to broad bands in the range of wavelengths between 380 nm and 560 nm: the range associated with red coloration of the pigment. The absorption spectra presented similar bands that differed in intensity with the introduction of the chromophore ion.
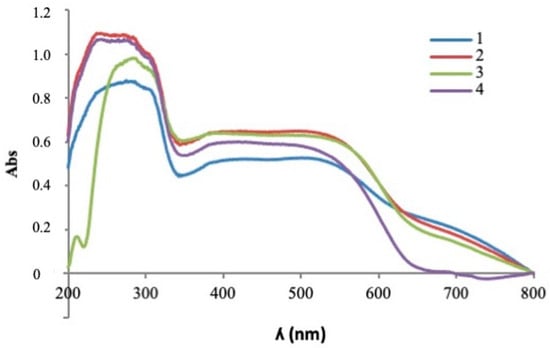
Figure 6.
UV-Vis spectrophotometry of fired pigment 1500 °C/6 h with 5% w/w CaF2 addition. 1. Y0.99AlCr0.01O3; 2. Y0.97AlCr0.03O3; 3. Y0.95AlCr0.05O3; 4. Y0.90AlCr0.10O3.
A greater signal intensity was observed in the red zone of the visible spectrum with chromium doping in molar ratios of x = 0.03 molar and x = 0.05 molar. In the ultraviolet-visible spectroscopy, signals appeared simultaneously with the presence of chromium in different oxidation states, which shows the existence of several crystalline phases that coexist together. Signals around 400 nm and 500 nm may be indicative of the presence of Cr(III) in an octahedral environment with electronic transitions 4A2g(4F)→4T1g(4F) and 4A2g(4F)→4T2g(4F), respectively, within the perovskite structure as it reflected in red in turn as signals close to 700 nm presented spin-forbidden electronic transitions: 4A2g (4F)→2T1g(2G). This signal could indicate the coexistence of Cr(IV) in tetrahedral coordination in the garnet structure with 3A2g (3F)→3T1g(3F) transitions, which were also being reflected in signals close to 480 nm with 3A2g (3F)→3T1g(3P) transitions. The presence of Cr(IV) in an octahedral environment could be indicative of signals close to 480 nm with 3T1g(3F)→3T1g(3P) electronic transitions to 380 nm signals with 3T1g(3F)→3T1g(3P) transitions and at 530 nm with transitions 3T1g (3F)→3T2g(3F). A broad band between 400 nm and 550 nm is indicative of the presence of Cr(IV) in the garnet structure superimposed on Cr(III) signals, indicating the simultaneity of signals and coexistence of perovskite and garnet crystalline phases. The transition 3A2→3T2 appears as a band in the visible spectrum between 600 and 700 nm. The latter is responsible for the brown hue of systems with high concentrations of Cr(IV) in the garnet structure [6,13,14,16].
The determination of the chromatic coordinates of the glazed tiles displayed a better color development with a lower L* value (greater intensity) and a higher a* value (red coloration) with chromium doping in molar ratios between x = 0.03 molar and x = 0.05 molar in the studied systems of Y1−xCrxAlO3 (Figure 7) and YAl1−xCrxO3 (Figure 8). The successive molar additions of chromium doped in the studied structures gave rise to colorations ranging from light pink to red-brown tones. The turn toward brown stands out more in the case of the Y1−xCrxAlO3 system, resulting in a completely brown sample (for x = 0.1), while in the case of the YAl1−xCrxO3 system, the reddish tone was maintained for higher chrome values before turning brown. Chromatic coordinates values are shown in Table 2.
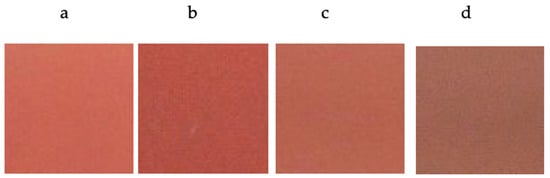
Figure 7.
Color development of glazed tiles with fired pigment 1500 °C/6 h with 5% w/w CaF2 addition. (a) Y0.99AlCr0.01O3; (b) Y0.97AlCr0.03O3; (c) Y0.95AlCr0.05O3; (d) Y0.90AlCr0.10O3.
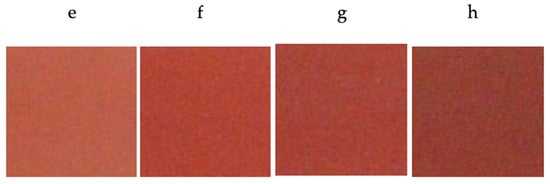
Figure 8.
Color development of glazed tiles with fired pigment 1500 °C/6 h with 5% w/w CaF2 addition. (e) YAl0.99Cr0.01O3; (f) YAl0.97Cr0.03O3; (g) YAl0.95Cr0.05O3; (h) YAl0.90Cr0.10O3.
Table 2.
Chromatic coordinates values of glazed tiles in the Y1−xCrxAlO3 and YCrxAl1−xO3 systems.
3.2. Crystalline Characterization of System Y1−xAl1−yCrx+yO3
Chromium ratios in molar percentages between 0.02 molar and 0.04 molar have been studied in the Y1−xAl1−yCrx+yO3 system, whose stoichiometries and chromatic coordinates are shown in Table 3. The samples tested have been synthesized with firing cycles at 1500 °C/6 h by using CaF2 at 5% by weight, resulting in red-colored glazed tiles. In subsequent studies detailed below, the firing conditions and the use of different flux agents had been optimized to favor the reactivity of the solid-solid reactions in the stoichiometric ratio Y0.98Al0.98Cr0.04O3, whose chromatic coordinates offer a more intense red color (Table 3 and Figure 9).
Table 3.
Chromatic coordinates values of glazed tiles in the Y1−xAl1−yCrx+yO3 system.
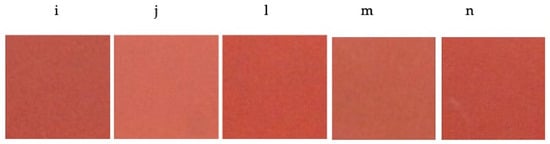
Figure 9.
Color development of glazed tiles with fired pigment 1500 °C/6 h with 5% w/w CaF2 addition. (i) Y0.99Al0.99Cr0.02O3; (j) Y0.99Al0.98Cr0.03O3; (l) Y0.98Al0.99Cr0.03O3; (m) Y0.98Al0.98Cr0.04O3; (n) Y0.97Al0.99Cr0.04O3.
3.2.1. Firing Temperature
The chromatic coordinates of the glazed tiles with pigments synthesized at temperatures of 1300 °C, 1400 °C and 1500 °C displayed pink colors at low temperatures and intense red at 1500 °C (Table 4 and Figure 10).
Table 4.
Chromatic coordinates values of glazed tiles in the Y0.98Al0.98Cr0.04O3 system at different firing temperatures.
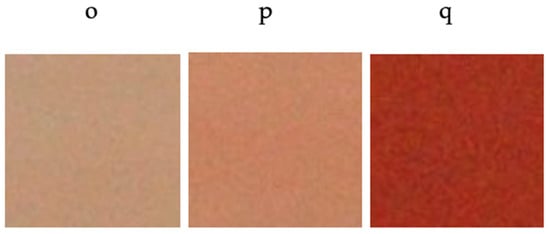
Figure 10.
Color development of glazed tiles with pigment Y0.98Al0.98Cr0.04O3 fired at different temperatures (o) 1300 °C; (p) 1400 °C; (q) 1500 °C.
X-ray diffractograms exhibited a greater synthesis reaction with temperature, a greater appearance of the YAlO3 perovskite structure and a less intense garnet signal (Figure 11).
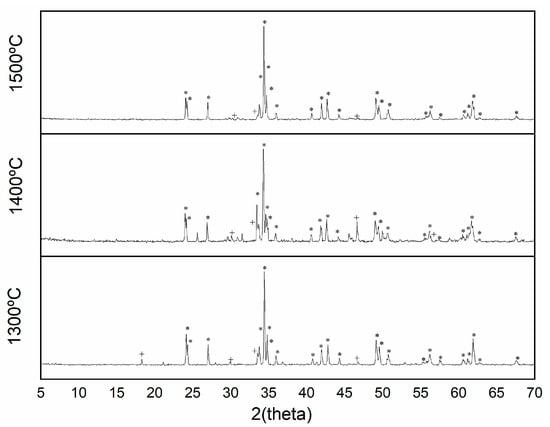
Figure 11.
XRD pattern of pigment Y0.98Al0.98Cr0.04O3 fired at different temperatures 1300 °C; 1400 °C; 1500 °C (+ garnet Y3Al5O12 phase; * perovskite YAlO3 phase).
Perovskite crystalline phase formation with temperature on ultraviolet-visible plots can be identified by an absorption band around 500 nm, which is indicative of the presence of Cr(III) in octahedral coordination (Figure 12). This absorption band increased its intensity from an absorbance value of 0.55 for 1300 °C to 0.6 for 1400 °C to 1.3 for 1500 °C. From 330 nm to 600 nm, a broad band was observed in which different chromium oxidation states may have intervened, which could indicate the coexistence of Cr(IV) signals between 380 nm, 400 nm and 520 nm, indicating the presence of a garnet structure.
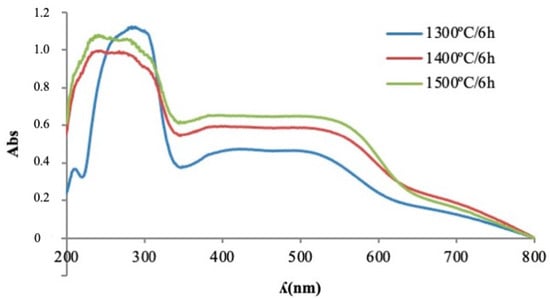
Figure 12.
UV-Vis spectrophotometry of pigment Y0.98Al0.98Cr0.04O3 fired at different temperatures.
SEM micrographs showed the morphology of the fired pigment at 1500 °C, which was crystallized in a cubic shape (Figure 13) and whose size ranged from slightly less than 1 µm to 2 µm. Results obtained through the signal of backscattered electrons (Figure 14) displayed a compositional homogeneity of high molecular weight throughout the sample.
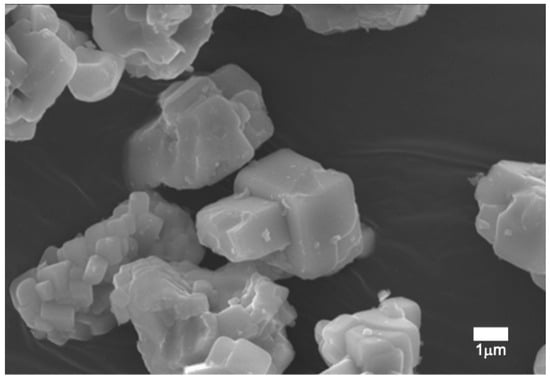
Figure 13.
SEM micrography of pigment Y0.98Al0.98Cr0.04O3 fired at 1500 °C.
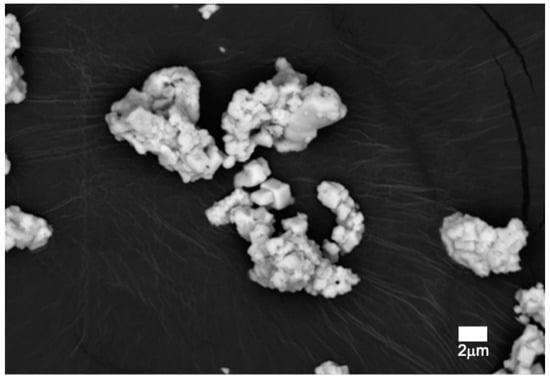
Figure 14.
SEM micrography with backscattered detector of pigment Y0.98Al0.98Cr0.04O3 fired at 1500 °C.
3.2.2. Flux Agent Mix Change
The pigments prepared with a mixture of flux agents made up of 3% NaF, 2% MgF2 and 1% Li2CO3 have been heat treated with firing cycles between 1200 °C and 1500 °C with dwell time at the maximum temperature from 2 h to 6 h. The chromatic coordinates of the glazed tiles (Table 5) showed the correct development of color at lower temperatures, offering intense colors from 1200 °C (Figure 15) and even with shorter retention times, with similar color development at 1300 °C (Figure 16). From the colorimetric point of view, it is the sample calcined at 1400 °C for 6 h that presented the most interesting color (Figure 17). At 1500 °C, the melting of the material had taken place and it had not been possible to use it as a ceramic pigment.
Table 5.
Chromatic coordinates values of glazed tiles in the Y0.98Al0.98Cr0.04O3 system at different firing temperatures and retention times.
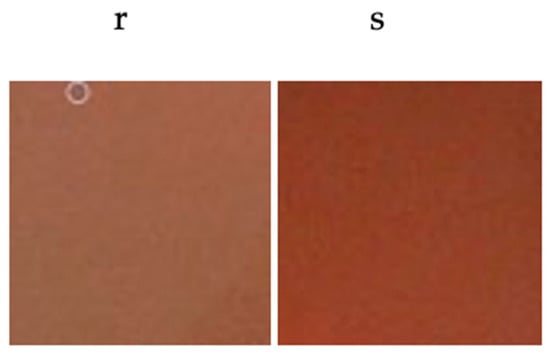
Figure 15.
Color development of glazed tiles with pigment Y0.98Al0.98Cr0.04O3 with flux agent mixture fired at (r) 1200 °C/2 h; (s) 1200 °C/6 h.
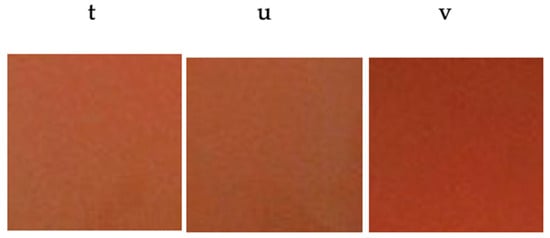
Figure 16.
Color development of glazed tiles with pigment Y0.98Al0.98Cr0.04O3 with flux agent mixture fired at (t) 1300 °C/2 h; (u) 1300 °C/4 h; (v) 1300 °C/6 h.
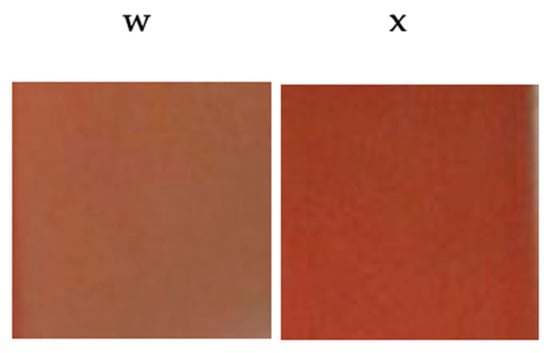
Figure 17.
Color development of glazed tiles with pigment Y0.98Al0.98Cr0.04O3 with flux agent mixture fired at (w) 1400 °C/2 h; (x) 1400 °C/6 h.
X-ray diffraction displayed the formation of the predominant perovskite phase with high signal intensity (Figure 18).
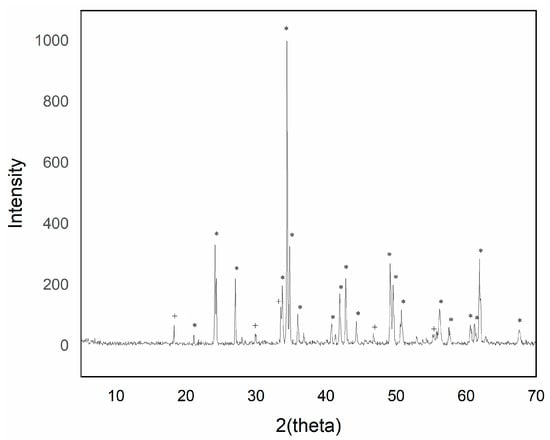
Figure 18.
XRD pattern of pigment Y0.98Al0.98Cr0.04O3 with flux agent mixture fired at 1400 °C/6 h (+ garnet Y3Al5O12 phase; * perovskite YAlO3 phase).
Visible ultraviolet spectrophotometry (Figure 19) displayed broad absorption bands in the range between 400 nm and 600 nm that were very similar in intensity.
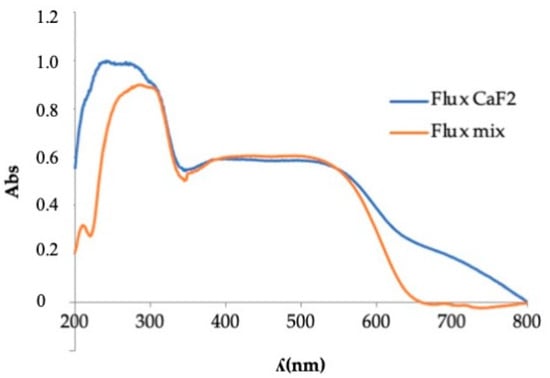
Figure 19.
UV-Vis spectrophotometry of pigment Y0.98Al0.98Cr0.04O3 fired with different flux agents.
4. Conclusions
Red-colored ceramic pigments were synthesized and optimized within the chromium-doped YAlO3 system. After studying various stoichiometries, red-shades were observed in Y1−xAlCrxO3, YAl1−xCrxO3 and Y1−xAl1−yCrx+yO3 systems with chromium additions between n = 0.03 molar and n = 0.05 molar. Lower chromium doping showed pink colors, and higher doping offered shades that turned toward brown. The samples were applied in an industrial firing tile cycle and their L*a*b* chromatic coordinates were read in an ultraviolet-visible spectrophotometer following the CIE L*a*b* model. By X-ray diffraction, two crystalline phases of perovskite YAlO3 (responsible for the red coloration) and garnet Y3Al5O12 appeared, the latter being a minority phase. In the Y1−xAlCrxO3 system, where x took the values of (0.01, 0.03, 0.05 and 0.10), the X-ray diffraction showed predominant peaks of perovskite with the presence of garnet that increased in intensity and signals as the amount of chromium introduced increased until x reached 0.05 as the phase decreased; finally, x reached 0.10 as the intensity decreased. This, in turn, increased the garnet phase and gave rise to a more brownish color. Through exploration with UV-Vis, octahedral Cr(III) signals belonging to the perovskite structure were revealed, as well as Cr(IV) signals in the tetrahedral position and Cr(IV) in the octahedral position, as belonging to the garnet structure. To favor solid-solid reactions and lower calcination temperatures, the addition of fluxes was necessary. The colorimetric results showed that as the calcination temperature increased, the color intensity increased, decreasing the value of L* (luminosity) and increasing the value of a* (red), with the best color development offered by the addition of CaF2 as the flux was fired at 1500 °C/6 h and optimized at temperatures of 1400 °C/6 h with the incorporation of the mixture of flux mix. With a progressive increase in the firing temperature, a greater sintering of the pigment originated, giving rise to an increase in its crystallinity, which was identified by the peaks of greater intensity of the perovskite phase in the X-ray diffraction and progressive decreasing in the garnet phase. This phenomenon was also observed in the ultraviolet-visible absorption bands, which exhibited identical signals that increased as the temperature of the calcinate increased. Scanning electron microscopy (SEM) micrographs showed particle sizes below 1 µm to 2 µm, with crystalline formations of cubic morphology that may be indicative of the presence of perovskite with a distorted cubic to orthorhombic structure together with the garnet phase crystallized in the cubic form.
Author Contributions
Investigation, E.M.; project administration, J.B.C.C. and I.N.-D.; supervision, J.B.C.C. and I.N.-D.; writing—review & editing, E.M. and I.N.-D. All authors have read and agreed to the published version of the manuscript.
Funding
This research received no external funding.
Institutional Review Board Statement
Not applicable.
Data Availability Statement
Not applicable.
Conflicts of Interest
The authors declare no conflict of interest.
References
- Zheng, J.; Li, Z.; Zheng, Y.; Zhao, W.; Tan, F.; Yang, F.; Chen, H.; Xue, L. A novel rare-earth high entropy RE6MoO12 with high near-infrared reflectance as a promising inorganic Cool-pigment. Ceram. Int. 2023, 49, 558–564. [Google Scholar] [CrossRef]
- Enríquez, E.; Reinosa, J.J.; Fuertes, V.; Fernández, J.F. Advanced and challenges of ceramic pigments for inkjet printing. Ceram. Int. 2022, 48, 31080–31101. [Google Scholar] [CrossRef]
- Molinari, C.; Conte, S.; Zanelli, C.; Ardit, M.; Cruciani, G.; Dondi, M. Ceramic pigments and dyes beyond the inkjet revolution: From technological requirements to constraints in colorant design. Ceram. Int. 2020, 46, 21839–21872. [Google Scholar] [CrossRef]
- Ke, S.; Wang, Y.; Pan, Z. Synthesis of Nd2Si2O7 ceramic pigment with LiCl as a mineralizer and its color property. Dye. Pigment. 2014, 108, 98–105. [Google Scholar] [CrossRef]
- Ahmadi, S.; Aghaei, A.; Yerta, B.E. Synthesis of Y(Al,Cr)O3 red pigments by co-precipitation method and their interactions with glazes. Ceram. Int. 2009, 35, 3485–3488. [Google Scholar] [CrossRef]
- Bucko, M.M.; Stobierska, E.; Lis, J.; Molasy, B. Pigments in the Y2O3-Al2O3-Cr2O3 System. Ceram. Mater. 2010, 4, 62. [Google Scholar]
- Cotton, F.A.; Wilkinson, G. Química Inorgánica Avanzada, 4th ed.; Limusa: Balderas, México, 1993; pp. 47–69. [Google Scholar]
- Sánchez-Muñoz, L.; Pavlov, R.; Carda Castelló, J.B. Materias primas y aditivos cerámicos. In Ceramic Enciclopedy, 1st ed.; Sánchez-Muñoz, L., Carda Castelló, J.B., Eds.; Faenza Editrice Ibérica, S.L.: Castellón, Spain, 2022; Volume 2.1, p. 80. [Google Scholar]
- Casabó-Gispert, J. Estructura Atómica y Enlace Químico 1st ed; Editorial Reverté, S.A.: Barcelona, Spain, 1999; pp. 29–31. [Google Scholar]
- Monrós, G.; Badenes, J.; García, A.; Tena, M. El Color de la Cerámica: Nuevos Mecanismos en Pigmentos para los Nuevos Procesados de la Industria Cerámica, 1st ed.; Jaume I University: Castellón, Spain, 2003; p. 147. [Google Scholar]
- Marinova, Y.; Hohemberger, J.M.; Cordoncillo, E.; Escribano, P.; Carda, J. Study of solid solutions, with perovskite structure, for apllication in the field of the ceramic pigments. J. Eur. Ceram. Soc. 2003, 23, 213–220. [Google Scholar] [CrossRef]
- Glasser, F. Vidriados y Pigmentos. In Nuevos Productos y Tecnologías de Esmaltes y Pigmentos Cerámicos, 1st ed.; Carda Castelló, J.B., Ed.; Faenza Editrice Iberica, S.L.: Castellón, Spain, 1992; pp. 111–120. [Google Scholar]
- López-Navarrete, E.; Orera, V.M.; Lázaro, F.J.; Carda, J.B.; Ocaña, M. Preparation thourgh Aerosols of Cr-Doped Y2Sn2O7 (Pyrochlore) Red-Shade Pigments and Determination of the Cr Oxidation State. J. Am. Ceram. Soc. 2004, 87, 2018–2113. [Google Scholar]
- Pavlov, R.; Blasco, V.; Cordoncillo, E.; Carda, P.E.J.B. Síntesis de nuevos pigmentos cerámicos de color rojo mediante el método de Pechini. Boletín De La Soc. Española De Cerámica Y Vidr. 2000, 39, 609–616. [Google Scholar] [CrossRef]
- Available online: https://materialsproject.org/materials/mp-3792 (accessed on 22 December 2022).
- Lyubenova, T.S.; Carda, J.B.; Ocaña, M. Synthesis by pyrolysis of aerosols and ceramic application of Cr-doped CaYAlO4 red-orange pigments. J. Eur. Ceram. Soc. 2009, 29, 2193–2198. [Google Scholar] [CrossRef]
Disclaimer/Publisher’s Note: The statements, opinions and data contained in all publications are solely those of the individual author(s) and contributor(s) and not of MDPI and/or the editor(s). MDPI and/or the editor(s) disclaim responsibility for any injury to people or property resulting from any ideas, methods, instructions or products referred to in the content. |
© 2023 by the authors. Licensee MDPI, Basel, Switzerland. This article is an open access article distributed under the terms and conditions of the Creative Commons Attribution (CC BY) license (https://creativecommons.org/licenses/by/4.0/).