Article

Interaction of Particles and Filter Fabric in Ultrafine Filtration

Karlsruhe Institute of Technology (KIT), Strasse am Forum 8, 76131 Karlsruhe, Germany
*
Author to whom correspondence should be addressed.
Eng 2021, 2(2), 126-140; https://doi.org/10.3390/eng2020009
Submission received: 8 March 2021 / Revised: 22 March 2021 / Accepted: 29 March 2021 / Published: 1 April 2021

Abstract

:
Filter fabrics are frequently used in the separation of particle-laden process streams. Especially for low-concentration and fine particles in the micrometer range, separation on filter fabrics offers considerable advantages over alternative processes. In this process, the inflowing particles are prevented from flowing through the meshes of the fabric. This interaction results in the initial resistance of the filtration not corresponding to the pure water resistance of the filter fabric. Knowledge of this increase in resistance is rare, but it leads to a significant increase in flow resistance, and thus a strong reduction in the hydraulic load on the filter apparatus. Within the scope of this investigation, measurements for 30 filter fabrics and their interaction with 3 particle systems is presented and their effect on the flow behavior is discussed. The knowledge allows an improved design of filter apparatus by correcting the pure water resistance to the resistance with particle interaction and improve the performance of ultra-fine filtration process.

1. Introduction

The separation of finest particles in the one to two-digit micrometer range (and smaller) is a challenging task in mechanical process engineering. Particles which are dispersed in the gaseous medium of air have attracted public interest in recent times. This problem has become known due to the fine dust pollution in cities which is a cause for many researching areas in the experimental and computational field [1]. The separation of such fine particles from the liquid phase (e.g., water) is also challenging from a process engineering point of view. The flow of a pure liquid phase through wovens has long been part of simulations [2]. However, the filtration is determined by the interaction between filter fabric and particle system, which then has a direct effect on the performance of the filtration (particle concentration in the filtrate, throughput, etc.) [3]. If the fabric is unsuitable, there is a continuous flow of particles through the fabric and fixed limits for particle load cannot be reached [4,5]. One possibility to determine the interaction is a simulation of the process. Such simulations often require high computational effort. Therefor real filtration structures are simulated with only one particle or flat surfaces [6,7]. The intension of this procedure is to provide valid increasing factor of filter resistances due particle interaction.
In addition to the quality of the filtration, the size and variation of the filtrate volume flow is important. It depends strongly on the interaction between the fabric and the particles and decreases because of the built-up filter cake (at constant filtration pressure). The basis of this fact is the filtration equation based on the Darcy’s law. It states that the pressure drop can be calculated from the specific cake resistance αH multiplied by the filter cake thickness HFC and the filter media resistance RFM (Equation (1)). It also applies that the filter media resistance at the beginning of the filtration is the main resistance until the first filter cake layer has built up. Observations from some scientific studies have shown, however, that even the first flow of a particle-loaded suspension through the fabric influences this resistance. For this reason, this resistance is also called initial resistance RF.0 or an interference resistance RIR is introduced, which describes the increase in the filter medium resistance [8,9].
Figure 1 shows an example of the interaction of the resistances, consisting of filter cake resistance RFC, fabric resistance RFM and resistance of the supporting fabric RSupport. While the cake resistance can be calculated as the product of specific cake resistance and filter cake thickness, the filter mean resistance RFM is determined based on expected values. In connection with this paper, research has shown that the difference in fabric resistance with pure water and with particle interaction varies by several powers of ten (Morris). This would lead to a strong misjudgment of the actual effective tissue resistance.
Δp = (αH ∙ HFC + RFM) ∙ ηf ∙ V̇F/A
The content of this investigation relates precisely to this interaction between fabric and particles and the increase in initial resistance caused by particle loading. Therefore, the filtration of selected plain weave (10; 3 plastic-based monofilaments, 2 plastic-based multifilament, and 5 metal-based filaments), twill weave (15; 6 plastic-based monofilament, 5 plastic-based multifilament, and 4 metal-based filaments), and satin weave (6; 6 plastic-based monofilament) with mesh sizes ≤ 25 µm for 3 standard particle systems, which clearly differ in shape, is described. The aim is to broaden the understanding of the interference resistance according to the particle shape and the possibility of estimating the initial resistance for ultra-fine filtration. The results of these investigations can be applied, for example, in the filtration of other fine particle systems (filtration of tailings, etc.).

2. Mechanisms of Filtration

The mathematical description of filtration was first described by Darcy in the middle of the 19th century and was based on the observation of the flow through a sand filter. Darcy found a linear relationship between volume flow and the height of the fill [10]. This equation could then be further developed by assigning different resistance values to the form commonly used today, according to Equation (1). Examples are the Carman–Kozeny equation and the Ergun equation for the flow through porous systems [11,12,13]. The investigation of Hermans and Bredée at the beginning of the 20th century also paved the way for this. In this study, the observation was written down for the first time that it is possible to differentiate between different filtration mechanisms and that these can also be described mathematically (see Equation (2)). This equation is based on a differential equation with two variables K and q. [14]
d2t/dVF2 = K ∙ (dt/dVF)q
Depending on which filtration process prevails, the exponent q differs. According to [14], the filtration mechanisms can be distinguished as follows:
  • Cake filtration (q = 0);
  • Standard filtration (depth filtration; q = 1.5);
  • Intermediate filtration (q = 1);
  • Clogging filtration (q = 2).
Of technical relevance for the filtration of finer particle systems is cake filtration with q = 0, where the relationship between Equations (1) and (2) becomes clear. This is because the variable K is equivalent to (αH ∙ HFC + RFM) ∙ ηf/A.
In addition to the integral description of the filtration process, in recent years there has also been a description of the macroscopic and microscopic separation process within and on the meshes of the filter fabric. Rushton differentiate into three possible principles of interaction between fabric and particle systems [9], which, at a constant concentration, depends largely on the ratio of the mesh and the yarn size to the particle diameter. The basis of this distinction is the observation that the resistance of the filter medium with pure water RFM,0 is always smaller than during filtration with suspension RFM. It is noted that the increase depends on the size of the particle system and is exemplarily shown in Figure 2 [5,9].
In the “Bleeding” area, in which the particle size is ≤ 65% of the mesh of the fabric, a moderate increase in the resistance value has been observed. A large turbidity surge is to be expected. The largest increase is in the “Clogging/Pore Penetration” area, where the particle size in the range 65% < x50,3 ≤ 130% of the mesh of the fabric. Here, the free cross-section of the filter medium is reduced by clogging particles, which leads to an increase in the resistance value. In the “Surface Deposition” area, this increase decreases again to a stationary area. Here, the particles are > 130% of the mesh size leading to a clear interface between the fabric and the particle layer. The free cross-section of the fabric is maintained. The consideration of the “interference resistance” was firstly done by Rushton (1970). According to [9], a quantitative numerical value for the increase of the filter medium resistance RFM compared to the pure water value RFM,0 in the range of factor 5 is given. Tests have shown that especially in fine filtration, this numerical value is clearly too small. A more general differentiation is therefore provided by [8], which adheres to the usual form of resistances (RFC, RFM) and extends this to include further resistances. He describes the increase in tissue resistance as a function of the suspension to be filtered as interference resistance (RIR). The naming by “interference resistance” was then introduced by Tichy (2007). In this work, the mesh size is reduced further, but this also does not extend to the finest filtration <25 µm. Accordingly, the factor is only found up to a maximum of less than 102. In general, however, the forming pore is seen as the cause of the flow resistance.
In the context of this paper, both models are discussed to describe the interaction and it is attempted to transfer this to the filtration results.

3. Method

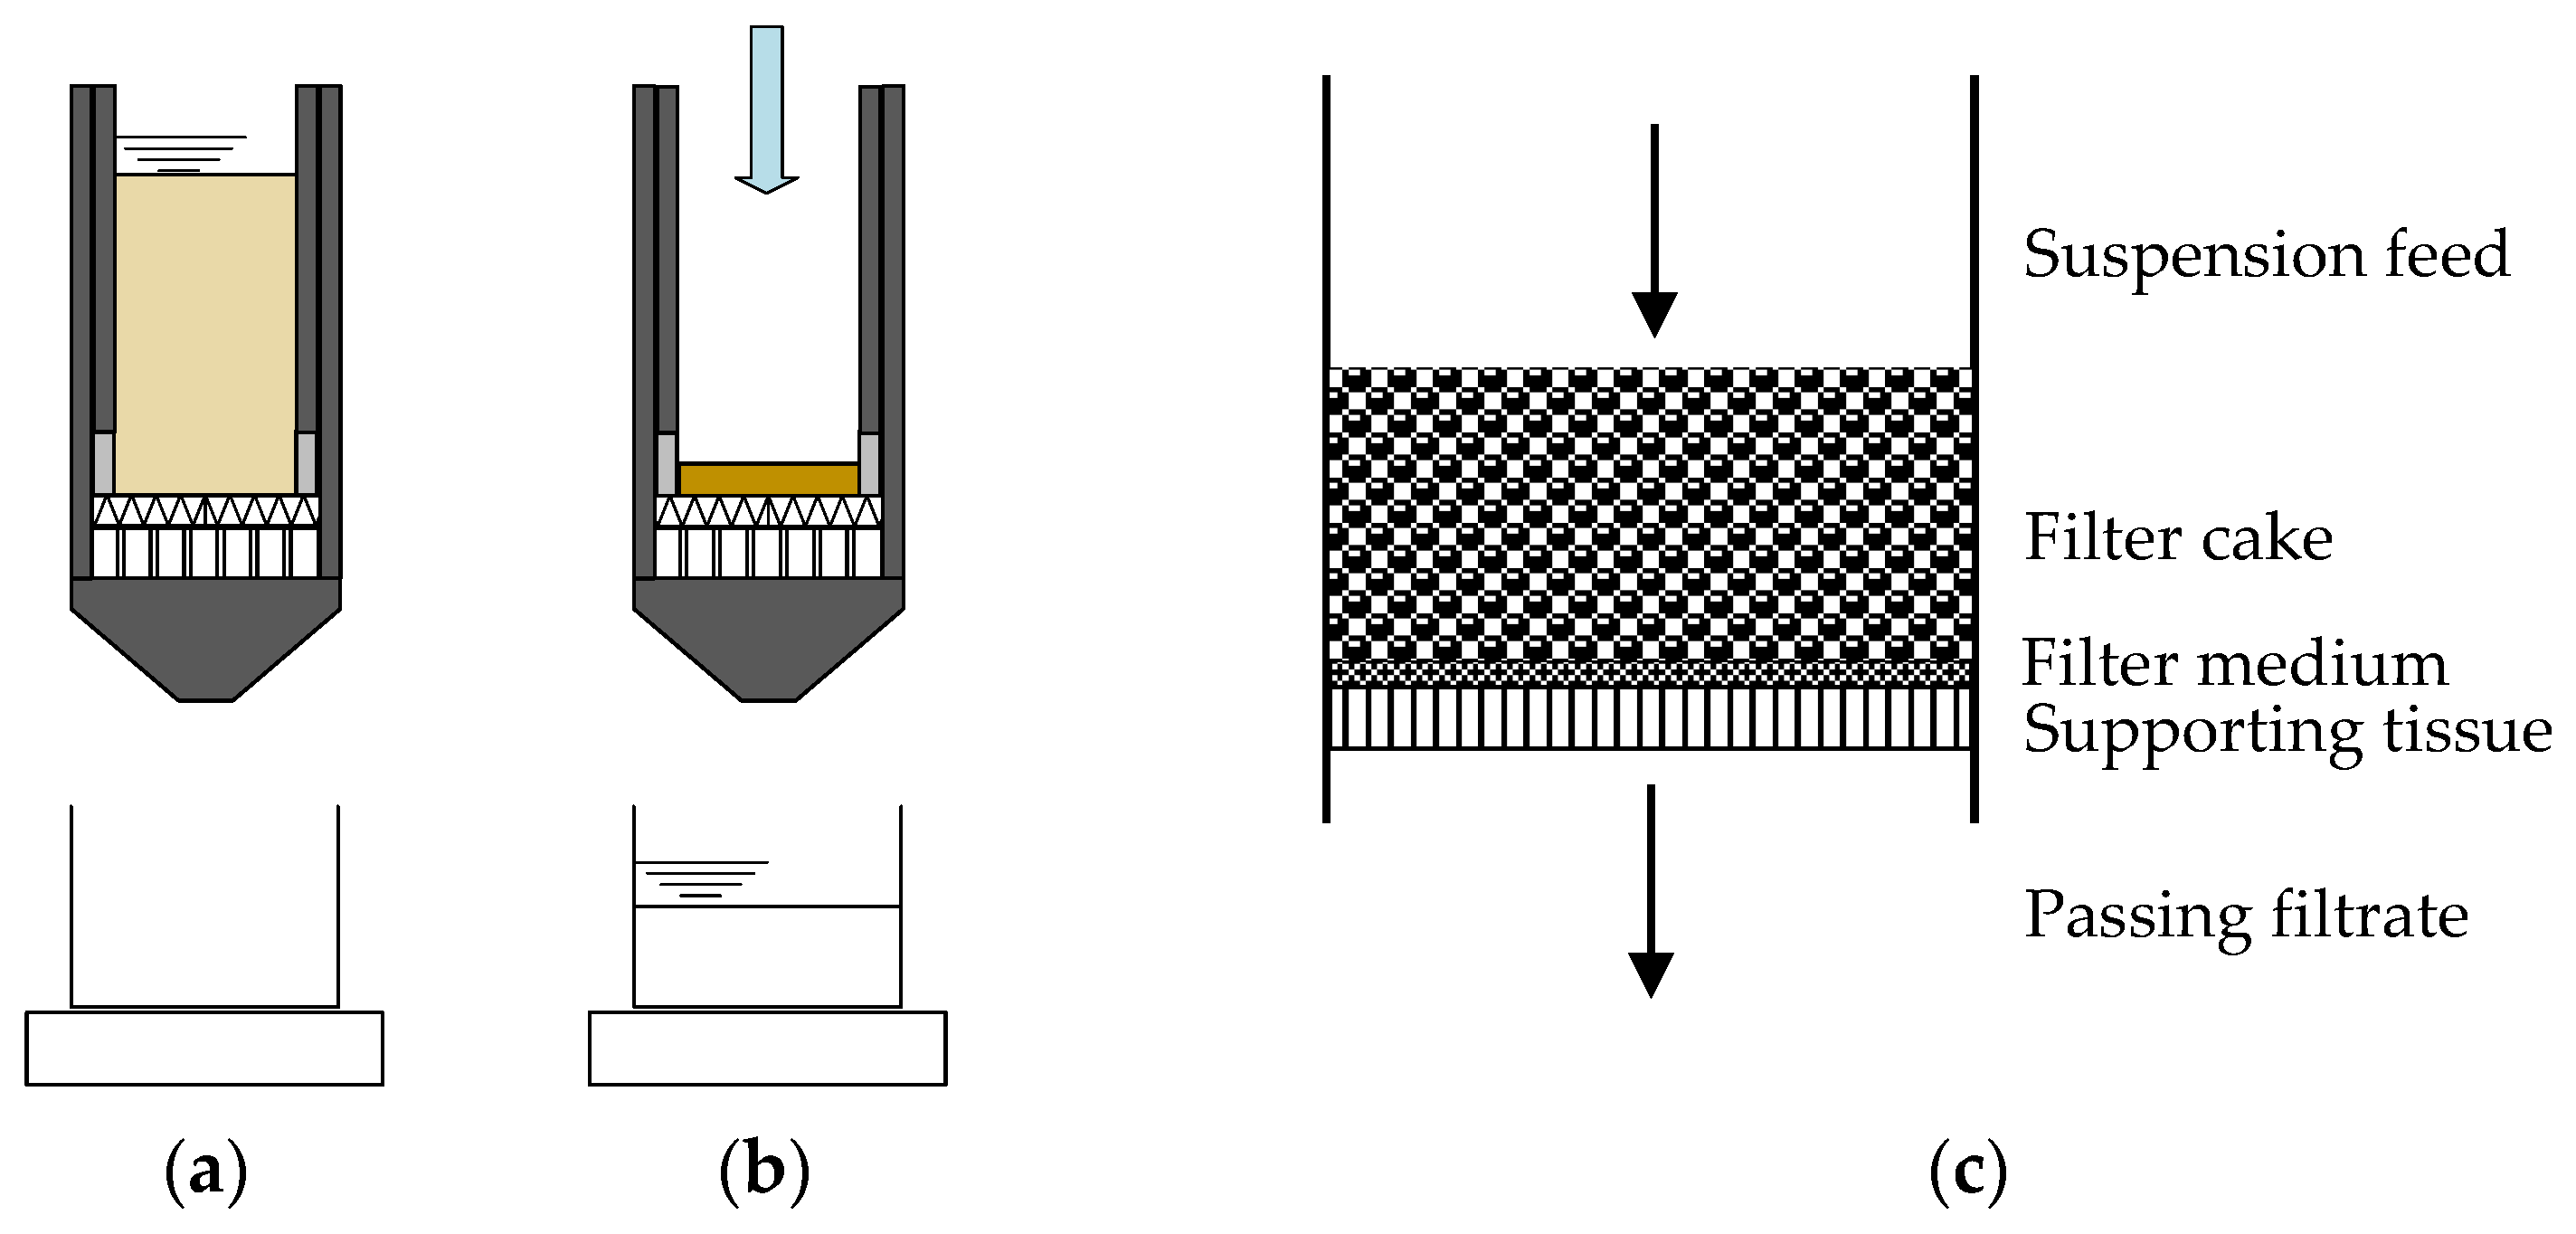
The basis of this investigation is the filtration by means of a pressurized filter cell as described in VDI Guideline 2762-2. The procedure is shown schematically in Figure 1. First, the process chamber is equipped with a selected filter fabric for filtration. Then the suspension is fed into the pressure chamber (Figure 3a). The filtration is carried out by means of compressed air, which presses the suspension through the fabric at constant pressure and separates it into almost particle-free filtrate and filter cake (Figure 3b). The recording of the filtrate over time allows the assignment of a specific filter cake resistance for the filter cake and a filter media resistance for the filter fabric. The evaluation of these parameters is done by the usual application of the “Time/Volume-Volume-Chart” to determine these parameters according to Equations (3) and (4). Based on the transformation and integration of Equation (1) for filtration at constant pressure, the respective parameters can then be calculated via the slope and the ordinate section.
αH = 2 ∙ Δp ∙ A2/(χ ∙ ηf) ∙ Slope
RFM = Δp ∙ A/ηf ∙ Ordinate Section
For each filter media filtrations are carrying out using three standard particle systems according to [11] for characterizing the interferential resistances. The aim is to gain a deeper understanding of the increase of the flow resistance at the beginning of the filtration process by the adhesion of the particles on and into the meshes of the filter fabric. For this purpose, the respective particle systems are dispersed in regular water at a concentration of 50 g ∙ L−1 and used for filtration in the pressurized filter cell. Each test requires a sample volume of 300 mL of this suspension. The influence of the water on the cake structure is not the focus of the investigation and is neglected at this point due to the same test preparation of the particle systems [15].
The characterization of the filter fabrics is based on manufacturer’s specifications, gravimetric measurements and optical investigations using a laser scanning microscope.

4. Materials

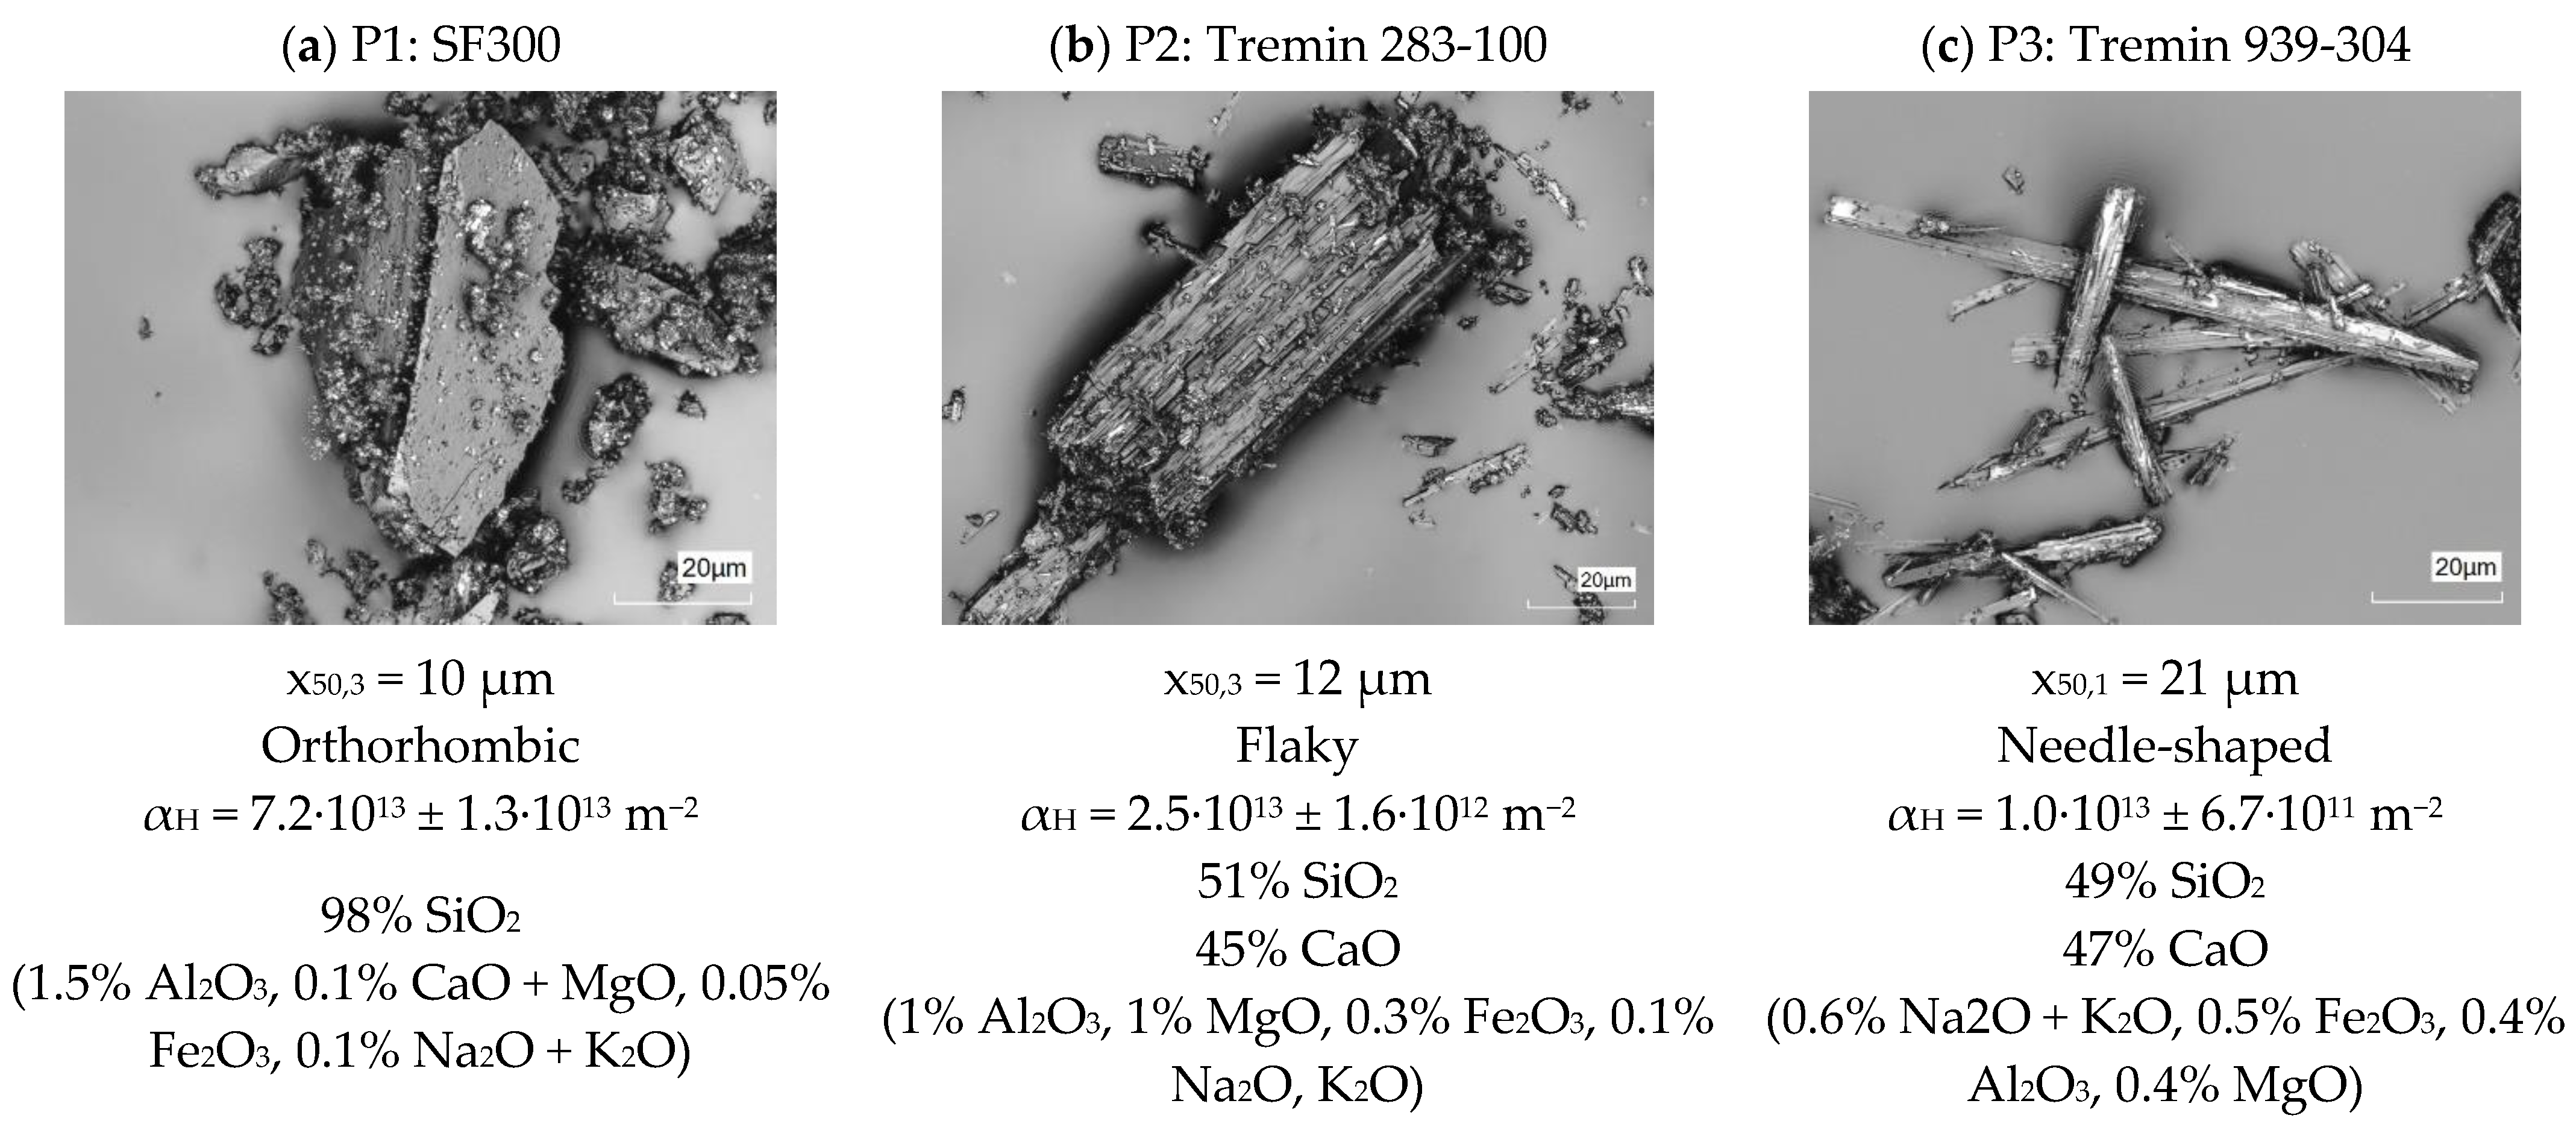
The investigation is essentially based on the particle systems shown in Figure 4. These particle systems are also the subject of a study on backwashing filtration [16] and will now be used for evaluation of the interaction between cloth and particle system. This is an orthorhombic quartz with the designation SF300 (P1), which mineralogically consists of 98% SiO2 (Figure 4a). The modal value x50,3 is 10 µm according to the manufacturer’s specifications. The second particle system P2 is a box-shaped mixed mineral consisting of 51% SiO2 and 45% CaO as main components with the designation Tremin 283-100 and a x50,3 value of 12 µm (Figure 4b). The last particle system P3 is a needle-shaped particle system with the designation Tremin 939-304, which also consists of SiO2 and CaO, although with the composition 49% and 47%. The average needle length of an image evaluation is x50,1 = 21 µm, while an average particle size x50,3 of approximately 8 µm can be determined with a laser diffractometer. Here the effect of the measuring method on the determined size becomes clear. For the other two particles a measurement with a laser diffractometer results in an average particle size of x50,3 = 10.8 µm (P1) and x50,3 = 10.3 µm (P2) [11]. For the investigation of the filter cake only the specific cake resistance as a sum parameter of porosity, shape etc. is of importance. The different size and shape of the particles should also produce a different separation behavior on and in the fabric according to [9].
In order to obtain the broadest possible information about the effect of particles on fabric resistance, the investigation is carried out on a large number of fabrics, which were selected on the basis of weave, material, and mesh size. The aim is to separate particles ≤ 25 μm, so all fabrics have a correspondingly smaller pore size. The problem is that there are many different fabrics available. These fabrics differ in repeat, fiber thickness, material, and other characteristic sizes. For this reason, the summary of the cloths is based on elaborated aspects which are classified as “important” by the authors and which are used as the basis for the assessment. The distinction of the filter fabrics is made in three groups, which are defined in more detail in the following sections:
  • Polymer-based monofilament fabrics (plain, twill, and satin weave)
  • Polymer-based multifilament fabrics (plain and twill weave)
  • Metal-based monofilament fabrics (plain and twill weave)
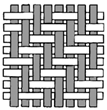
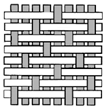
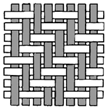
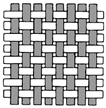
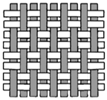
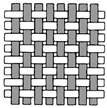
For the polymer-based monofilament fabrics, the characteristic features of the individual fabrics are shown Table 1. The classification of the table is based on relevant fabric data and starts with the classification into the 3 fabric groups “Plain”, “Twill”, and “Satin”, followed by the mesh size and the material. The table is then followed by a more detailed description of the weave according to DIN ISO 9354, which includes a numerical code consisting of the fabric type (1st number), the number of warp raising and lowering operations (2nd and 3rd number), the number of threads that pass through this sequence (4th number), and the number of offsets until the pattern is repeated (5th number). A twill weave (20), with 4 warp lifts and one warp sink (04 01), which is passed through by one thread (01) and an offset, which in the case of the twill weave corresponds to that of the warp lifts (04), leads to the code 20-04-01-01-04 (see 5 µm Twill weave in Table 1). This is followed by important values such as the number of meshes per unit area, the specific weight, the roughness according to ISO 25178 and the thickness of the fibers and the fabric based on microscopic investigations. In sum, the table presented here provides a good overview of the respective fabrics and allows an effective categorization.
It is noticeable here that the fabric thickness does not correspond to the sum of warp and weft thread. This is due to a calendering of all fabrics, which reduces the fabric thickness and thus the pore size. Pore sizes smaller than 20 μm are not possible using monofilament fibers without calendering. The difference between twill and satin fabrics is mainly the offset of the adjacent warp yarn. A distinction is not always easy to make. This becomes clear with the satin fabric with 6 μm and 18 μm pore size, which can also be assigned to the group of twill fabrics according to DIN 9354.
To cover fabric types of different fiber types, the fabrics under investigation have been extended by the group of “polymer-based fabrics, woven from multifilament yarns”. These also have a pore size ≤ 25 μm and are represented with a plain and twill weave. A multi-filament fiber consists of many individual fibrils, and therefore has a large surface in which particles can adhere. According to [5], part of the flow passes through the fiber itself, whereby particles are also deposited within the fiber and thus reduce the longevity of the fabric. In contrast, the residual contamination of the filtrate is theoretically lower. Table 2 shows the characteristic features of the fabrics used. The large thread diameters measured with a laser scanning microscope are striking. With multifilament fibers, the individual fibrils of the fibers can move towards each other, which causes the thread to be compressed during weaving due to the tension. The thread is therefore not round but having an oval shape. This can occur in different orders of magnitude and explains why the thickness of some fabrics is smaller than the measured thread diameter. The mechanical properties of the fabric depend largely on the material and weave. The same also applies to the filtration performance, because of the number of meshes per unit area. Due to the fibrils, the stability of these fabrics can be rated as very good compared to other types of fibers.
The last group of the investigated fabrics includes metal-based plain and twill weaves with monofilament fibers and a pore size of again ≤ 25 μm. These are summarized in Table 3. Metals as a material have a higher temperature resistance, which makes them suitable for use at high temperatures, such as in the exhaust air purification of a combustion process. Metallic filter fabrics also have the advantage that considerably finer threads can be woven according to their mechanical properties. This enables finest mesh sizes up to 6 μm without calendering. Due to the finer threads used metal cloths have a larger free filter surface for the same mesh size compared to plastic-based media. This can be seen from the high number of meshes per unit area in Table 3, which is two powers of ten higher than for woven plastic fabrics with the same pore diameter. In addition, the use of thinner yarns results in lower surface roughness. The improved filtration performance is therefore offset by a correspondingly higher price, which is why the use of metal filter cloths is also an economic decision. In addition to a higher price, metal filter fabrics are usually more susceptible to oxidation, which is why they are avoided in chemical applications.

5. Interpretation

Due to the large number of measurements on a variety of tissues, the evaluation is carried out within the three tissue categories from the chapter “Materials”. Based on this, a cross-group evaluation is carried out to change the filtration properties by adding particles. In the following chapter “Conclusion” these findings are summarized, and practice-relevant recommendations are made.

5.1. Polymer-Based Monofilament Fabrics

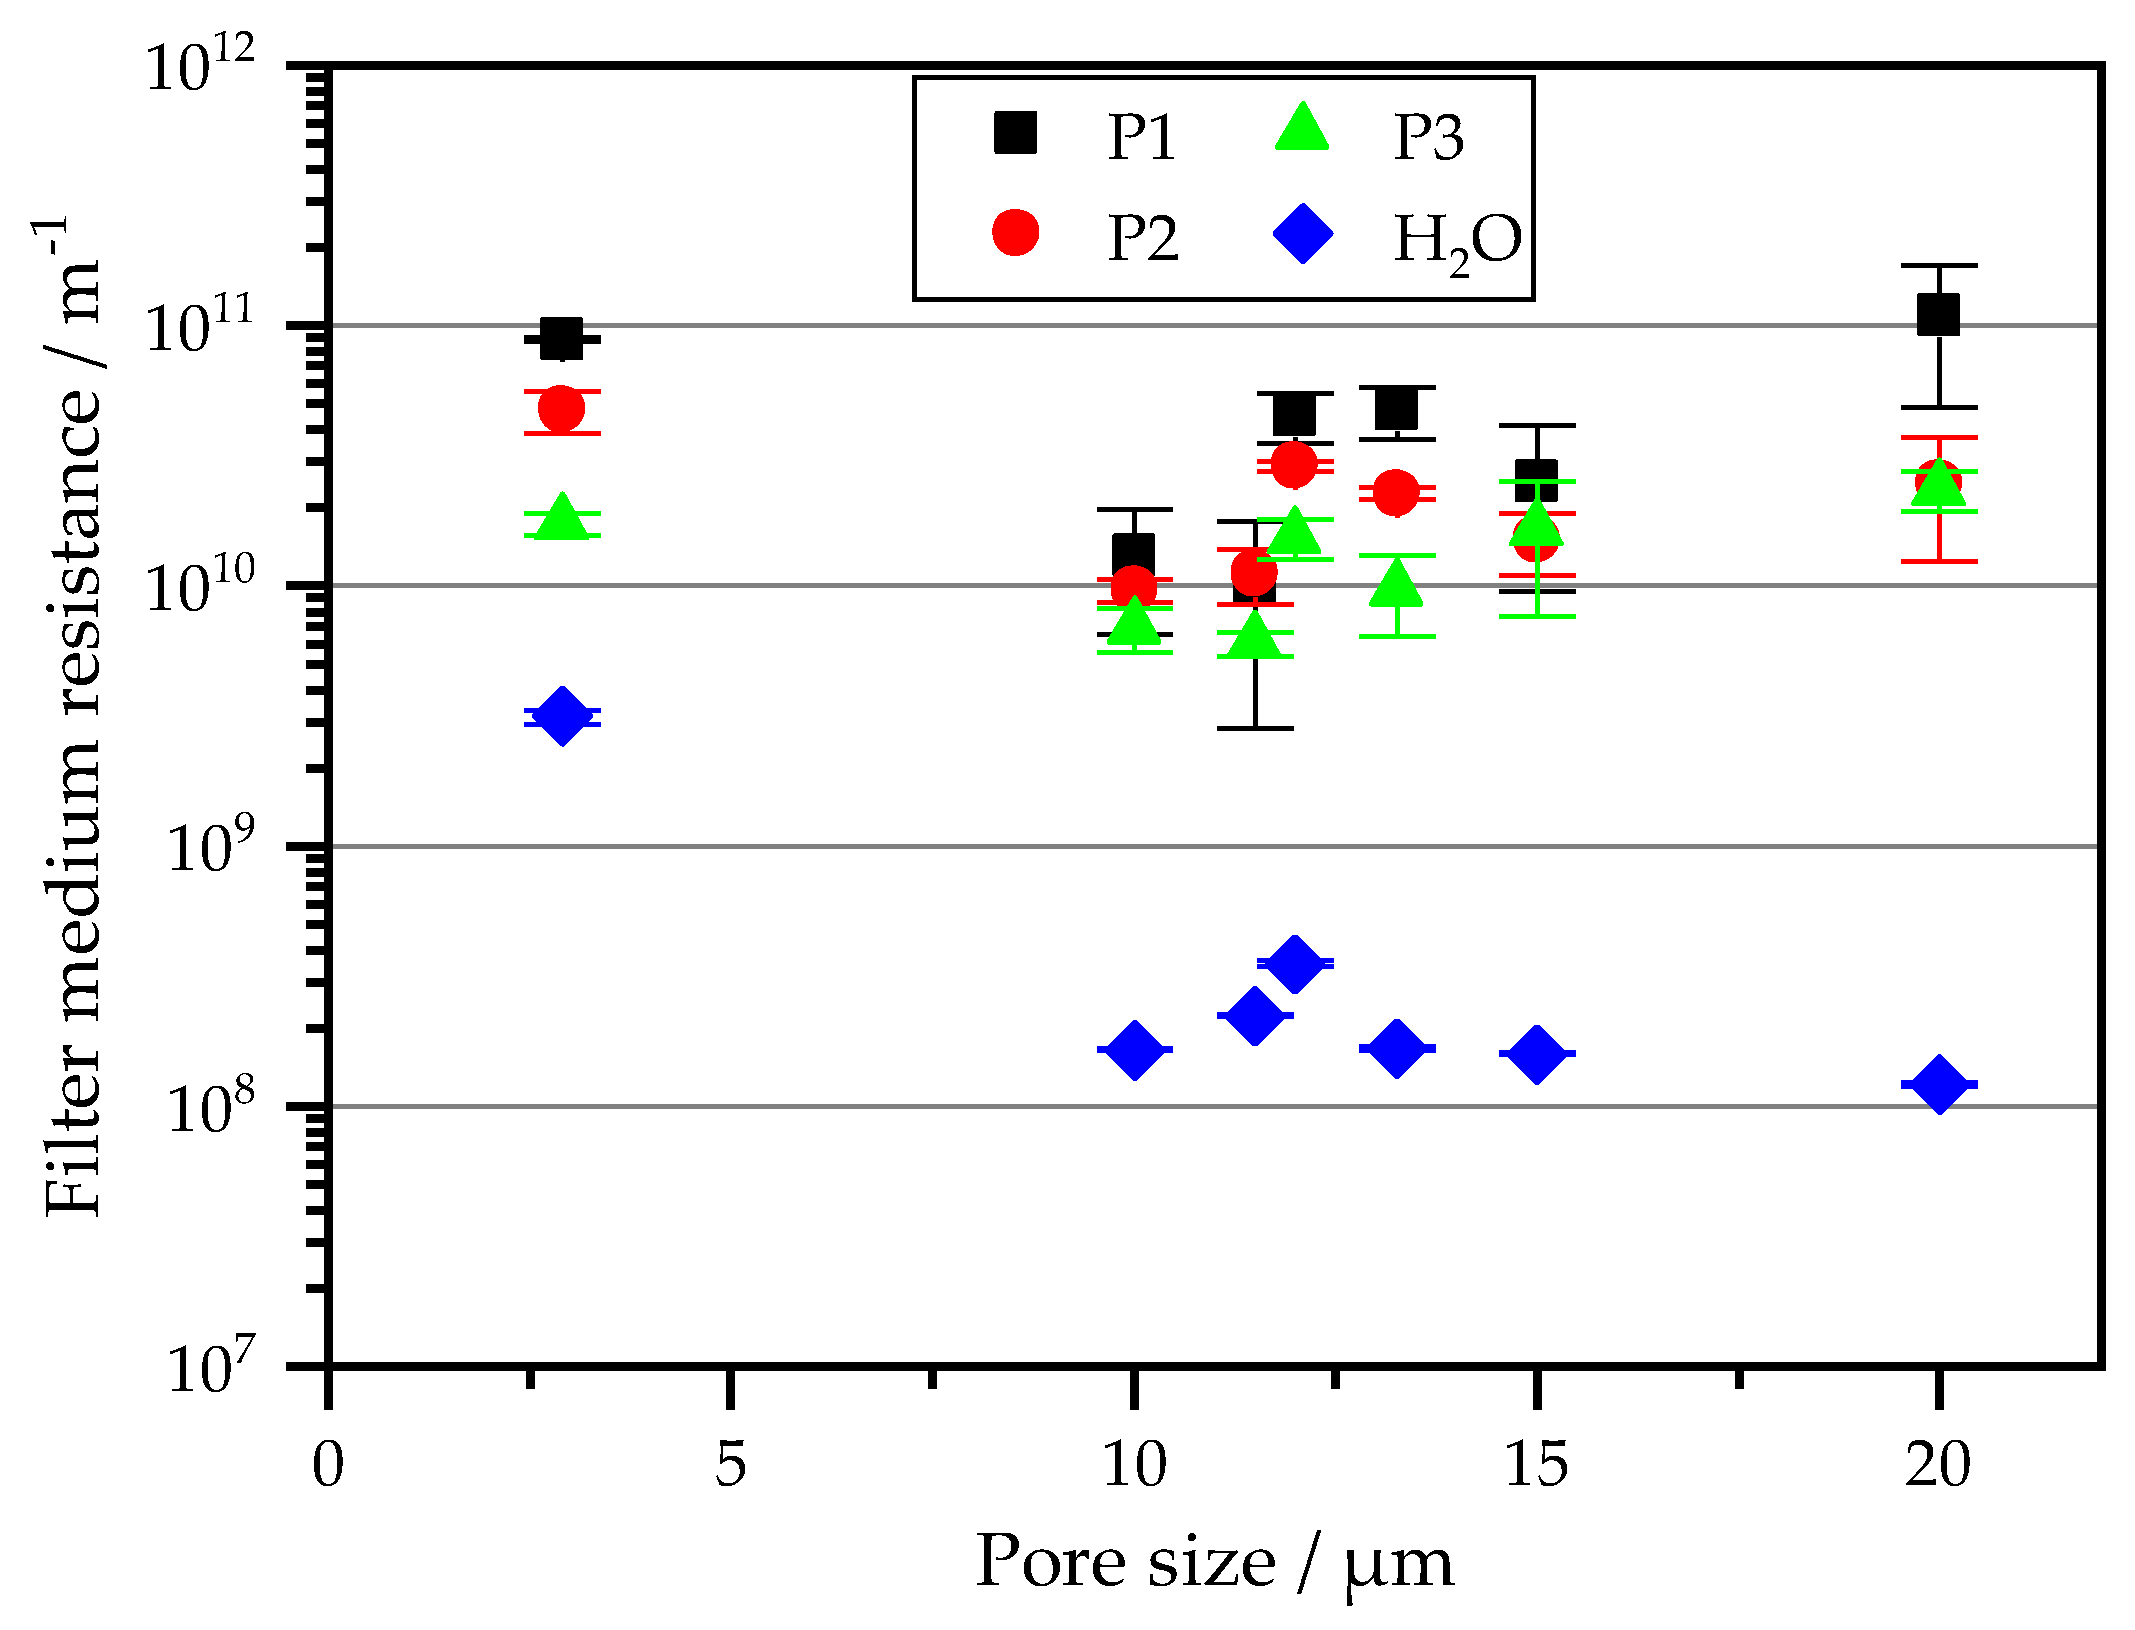
As already listed in Table 1, the group of plastic-based monofilament fabrics is represented by different weave types and mesh sizes. As described in the chapter Methodology, all fabrics are filtered with the particle systems presented in Figure 2. The filter medium resistances of this interaction of particles with the filter fabric are shown in Figure 5. Further included there are the specially determined filter medium resistances with pure water. Regarding the measured pure water resistances, a decrease of the resistance value can be observed with increasing pore size. When filtering the fine particle system P1 with a specific cake resistance of 7.2∙1013 m−2, at x50,3 = 12 µm particle size, the 12 µm fabric achieves an initial resistance of approximately 4∙1010 m−1, while the 14 and 22 µm fabrics have ~1∙1010 m−1. Here, no further decrease of the resistance value is observed with increasing mesh size from 14 to 22 µm. By including the theory according to [4] of different deposition processes in and on the fabric, this was not to be expected, since the fine particles of P1 should clearly penetrate the meshes and flow through the 22 µm fabric. Noteworthy also is the increase in resistance to the particle-free resistance by water. Regarding potency, an increase by a factor of 102 can be observed. This is significantly greater than factor 5, which was published after [4]. For finer tissues it can therefore be assumed that the expression of the interference resistance increases considerably. This statement must be verified by the other tissues and particle systems. In the case of the platelet-shaped particle system P2, the tendency expected from P1 can also be seen. Compared to the pure water resistance, an increase by a factor of 102–103 is also valid. In the case of the needle-shaped P3, no significant difference can be observed in all three tissues. Only the minimum at 14 µm is noteworthy, but this can be explained by the standard deviation of the same order of magnitude. All three particle systems are in the middle to upper range of 109 m−1. Here, a “surface deposition” is present, which has a clear interface between tissue and particle systems because of the significantly larger particles compared to the meshes of the tissue. Accordingly, the increase in the filter medium resistance is due to “covering” free meshes (sphere-hole model according to [5]) and is in the order of 102. In total, the filter medium resistance has increased by a factor of 102–103 due to the interaction of particles to mesh. Orthorhombic particles exhibit less spherical obstruction when flowing through the mesh than, for example, needle-shaped particles. As a rule, a particle which has significantly larger deviations from the ideal sphericity (a sphere has a sphericity of one) has an increasing spherical obstruction compared to the meshes of tissues. When penetrating into the pore, a narrowing occurs, which reduces the hydraulic cross-section and leads to an increase in resistance in terms of process technology.
In addition to the plain fabrics, the twill fabrics are represented by six fabrics with mesh sizes from 5 to 25 µm. Analogous to the plain weave, a decrease in the filter medium resistance with the particle systems can be observed in the twill weave, starting with the orthorhombic P1, via the plate-shaped P2 to the needle-shaped P3. Only the 20 µm fabric has an exception in that the filter medium resistances of both particle systems P1 and P2 are similar. Regarding the relationship between mesh size and particle diameter, the area of “bleeding” and “clogging” must be assumed here. An explanation for this behavior is therefore pure conjecture, since a comparison with fabrics of similar behavior is not possible in this study. Another special feature of the twill fabrics is the course of the filter medium resistance of 5 to 25 µm within the filtration with P1. Here, a steady decrease of the resistance value can be observed. Only the 20 µm fabric has a local minimum of 1.9∙1010 m−1. In initial attempts to interpret this behavior, an interaction of the large number of meshes in combination with the larger mesh size (bleeding and clogging) must therefore be mentioned as a possible cause. Here, the flow velocity within the meshes is lower, which makes it easier to deposit particles and reduce the mesh size. A measurement of the pore size distribution using porometry confirms this assumption. Regarding the two other particle systems P2 and P3, a deviation from the expected behavior can also be assumed. For P2 and P3, the largest resistance value within this group can be observed for the 5 µm mesh. As expected, this decreases at 11 µm. For the following fabrics with 14 to 25 µm, however, a quasi-stationary resistance value of ~ 2∙1010 m−1 for P2 and ~ 8.2∙109 for P3 can be observed. The smallest values are achieved by the fabrics with the largest number of meshes within this group. The assumption of the interaction between mesh size and mesh number is confirmed here. By extending the observation to surface roughness, it can be observed that the fabrics with lower roughness down to below 30 µm show the greatest increase in filter medium resistance, while fabrics with ≥ 30 µm show the smallest increase. Particularly with resistance values in the order of 109 m−1, a larger measurement variation can be observed here, which can falsify the sequence. The surface roughness can therefore only be evaluated in connection with the number of meshes. Statements based on surface roughness alone are not possible. In total, the filter medium resistance has increased by a factor of 102–103 for four of five filter cloths due to the interaction of particles to fabric. The 11 µm filter cloth shows an increase of 101 when interacting with P3. Otherwise, an increase of 102 can also be seen here with interaction with P1 and P2. What becomes clear is that the increase in resistance is independent of the mesh size.
The group of plastic-based satin fabrics is represented by five fabrics with mesh sizes from 6 to 22 µm. With a focus on the weave, satin fabrics are like twill fabrics, except for the larger offset number and the large number for warp lifting, which is evident from the high pure water resistance. This is the highest of all the 6 µm fabrics with 7.8∙109 m−1 and even for the 22 µm satin fabric in the 3.9∙108 m−1 range it is still very high compared to the twill fabrics. A special feature of this group of fabrics is that two fabrics have the same mesh size (18 µm). While one fabric has a filter mean resistance of 6.7∙108 m−1, the other fabric has a value of 3.6∙108 m−1. This also corresponds to the meshes per unit area, in the first case three meshes per mm2, while the other, with four meshes per mm2, has an assumable larger free filter area, and accordingly has a lower resistance. In these fabrics, the fabric with the larger specific number of meshes per unit area is also slightly rougher (13 µm) than the other fabric (7 µm).
When evaluating the influence of particle interaction, it is noticeable that for all three particle systems the trend “Decreasing resistance value with increasing mesh size” is given in the case of satin fabrics, considering the standard deviation. The increase corresponds to 101–102 and leads to the conclusion that for fabrics with a high resistance value, in the case of the pure water value, a smaller increase in the resistance value with particle interaction can be expected. The absolute value of satin fabrics, for example, is in the same order of magnitude of potency as that of twill fabrics like the weave, although the prefix differs slightly. Regarding Table 1, an 18 µm fabric should also be mentioned which, contrary to the manufacturer, is to be classified as twill fabric according to DIN ISO 9354. A clear distinction between satin and twill fabrics is questioned here, not only in terms of weaving technology but also in terms of process technology.
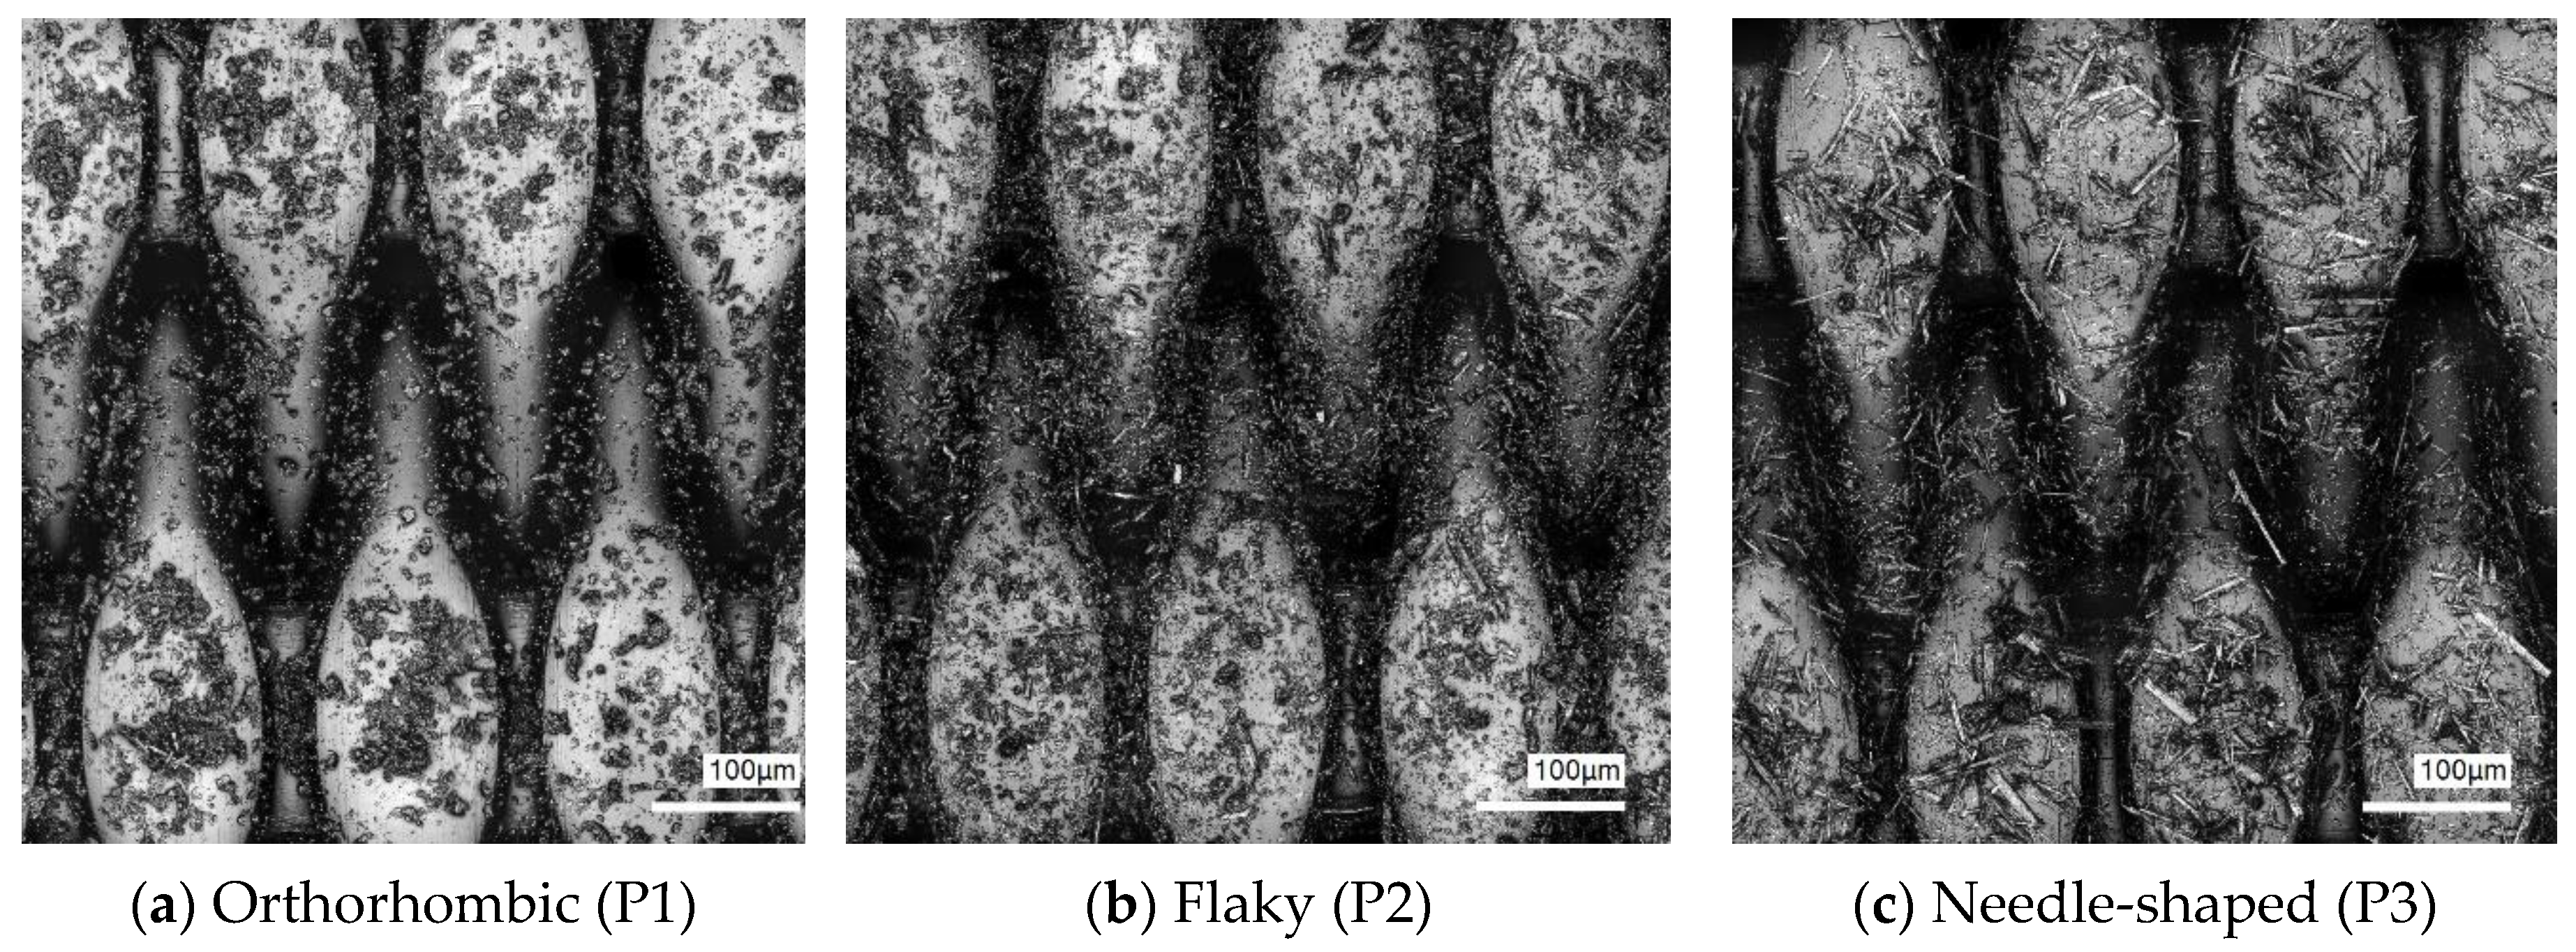
The increase in flow resistance shown in the previous illustrations results from the separation mechanism within the hydraulic diameters of the tissues. This can be seen by the microscope image in Figure 6. While the orthorhombic particle system can penetrate deeply into the three-dimensional structure of the fabric due to its scaliness and block the meshes there, this characteristic is less pronounced with the flaky particle system. With increasing particle size and/or deviation from the ideal sphericity, as is the case with the needle-shaped particle system, the deposition within the fabric and in the meshes becomes more appropriate and the increase in flow resistance is smaller.

5.2. Polymer-Based Multifilament Fabrics

The second group of plastic-based filter fabrics are the multifilament fabrics, which are divided into twill and linen fabrics. The summary of the fabrics is shown in Figure 7. In contrast to the monofilament fabrics, this group of fabrics allows particles to flow through, and thus be deposited in, the multifilament fibers [4]. The characteristic of this flow through the fibers is also based on the treatment of the fibers (twisting, calendering, etc.). A look at the water resistance of these fabrics shows that with decreasing mesh size the pure water resistance with twill weave shows almost no change. Only the two plain fabrics show a higher resistance value, which is greater by a factor of 10 for the 2.9 µm mesh width than for the twill weave. One explanation for the constant resistance value is the increasing flow through the fibers, instead of the very fine meshes, with finer weaving. Regarding the resulting filter medium resistances due to interaction with the particle system, the trend is not met by monofilament fabrics. A larger mesh is not the same as a smaller filter medium resistance. Like pure water, all three particle systems have hardly any change in the filter medium resistance over the mesh size variation. Again, the two plain fabrics with the highest values in the filter mean resistance are conspicuous. This is where the influence of particle interaction is most obvious. The twill woven fabrics with a mesh width of 13.25 µm have the highest filter mean resistance within the multifilament fabrics and this is of the same order of magnitude as that of the 12 µm plain fabric. This also applies to the other particle systems in both fabrics. In this case, a correlation between the mesh size and the filter medium resistance can be observed, depending on the type of weave. While the plain of monofilaments has the lowest resistance within the plastic-based fabrics, multifilaments, and plain fabrics tend to have a higher filter medium resistance. This is also because, based on a bubble-point investigation, the fabrics have finer meshes due to the manufacturing process. The interaction with particles, however, causes the resistance of plain fabrics to increase more strongly than that of twill fabrics. A higher filter resistance for plain weaves is also calculated by Tung et al. which proofs similar trends between CFD simulations and our experiments [18].
In general, it can be stated that the filter medium resistance has increased by a factor of 101–102 due to the interaction of particles with fabric [19]. The multifilament fabrics also show a lower dependence of the measured mesh size and the filter medium resistance. The different separation mechanisms in the meshes (P3), on the multifilament fibers (P2) and both (P1) are shown for the three particle systems in Figure 3 for the 20 µm twill fabric.

5.3. Metall-Based Monofilament Fabrics

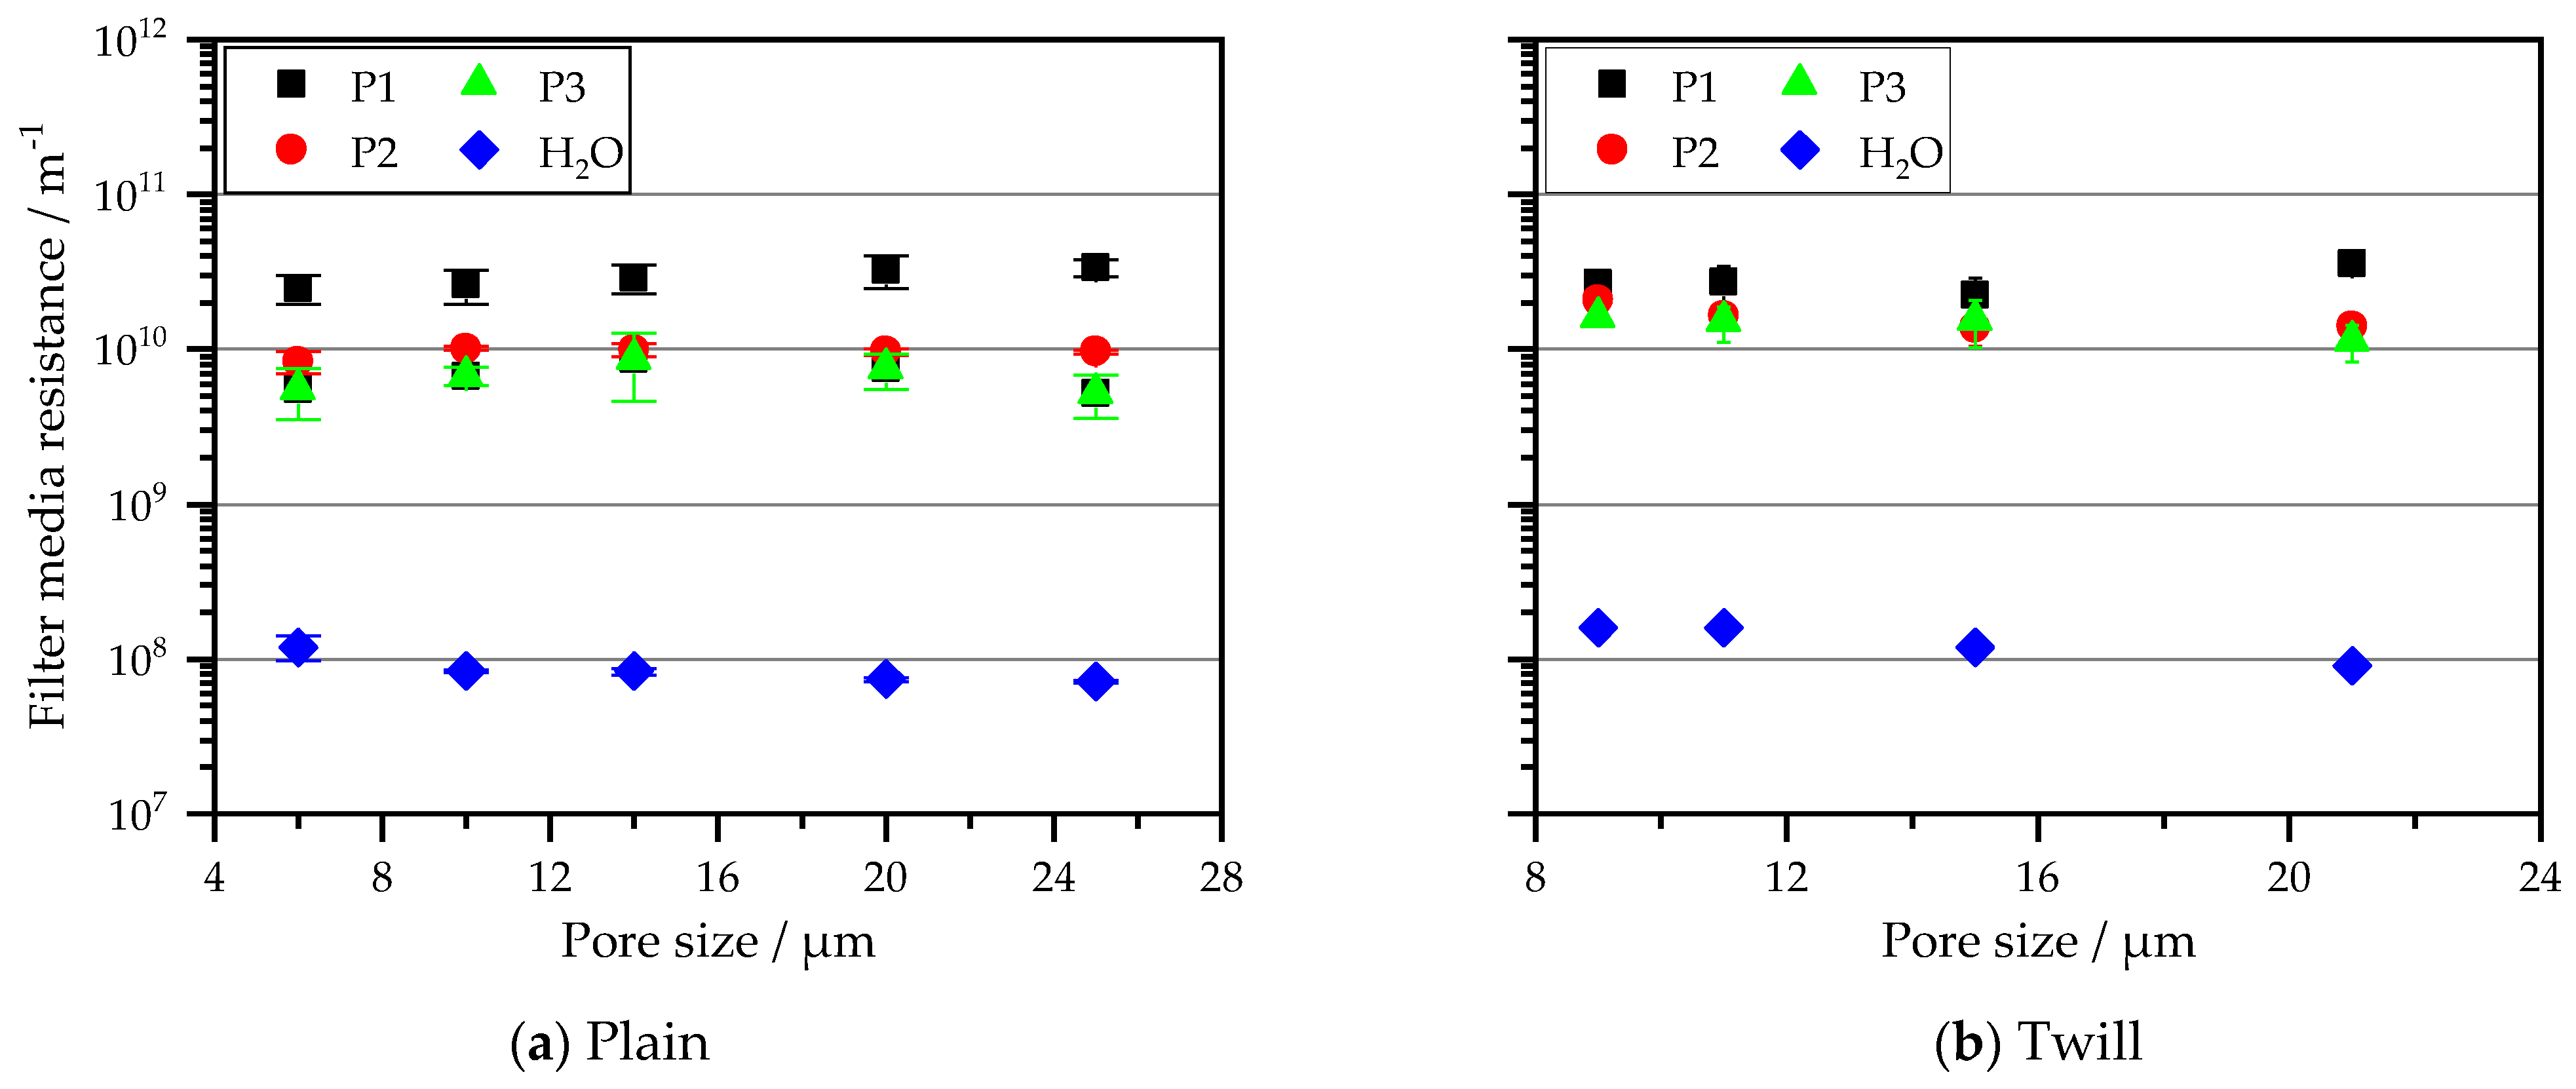
The last group of tissues includes metal-based tissues. Like the multifilament fabrics, these are divided into twill and plain fabrics. The twill fabrics are represented by four variations from 9 to 21 µm, while the plain fabrics are represented by five variations from 6 to 25 µm (see Figure 8 and Figure 9). A special feature of this group of fabrics is the finer weaving of metal-based filter fabrics without the need for pore reduction by calendering. This is illustrated by the fabric thickness, which almost corresponds to the addition of the weft thread with double warp thread (see Table 3 Measurement inaccuracy causes existing deviations). The fibers can thus be judged as “almost round” and no flattening was caused by calendering. Regarding the water resistance of the 9 to 21 µm twill fabrics, a steady decrease of the resistance value can be observed, whereby the difference between the 9 µm and 11 µm fabric is only slight. This behavior is in line with expectations, since the pressure drop decreases due to the larger meshes, with a simultaneous moderate increase in fiber diameters (see Table 3). In the case of plain fabrics, the course of the water resistance decreases with increasing mesh size, analogous to the other fabrics used.
If we now look at the particle interaction in the metal-based fabrics, deviations from the expected behavior are noticeable. In the case of P1, the observed trend is broken by the polymer-based monofilament fabrics. In Figure 5 and Figure 7 it can always be observed that with increasing mesh size, despite interaction with particles, the filter medium resistance decreased. This no longer applies to the metal-based monofilament fabrics with the “twill” and “plain” weave. Here, the resistance value is constant or tends to increase slightly with increasing mesh size. It must be assumed that the particles of P1 are deposited in the pores of the fabric and this leads to the highest measured filter mean resistance of the group of metal-based fabrics. Regarding the other particle systems P2 and P3, a tendency towards increasing filter mean resistance can also be observed. However, by taking the standard deviation into account, no significant difference can be said to exist between the twill and plain fabrics and the fabrics with different mesh sizes. The filter mean resistance of the plain fabrics is like that of the twill fabrics. Metal woven wire cloth tends to have a lower resistance value for similar mesh sizes than the plastic-based woven fabrics. Calendering is a possible cause of the differences to the polymer-based fabrics, which has a direct influence on the pore size and geometry.
A transfer into the form according to [3] is not appropriate, since the diagram does not show a concentration dependence, which according to [20] is a parameter not to be neglected. The concentration of the tests was based on [11].

6. Conclusions

Within the scope of this investigation 30 filter fabrics of different materials, fiber types, and fabric types were examined for their filter medium resistance with particle interaction. All fabrics have mesh sizes ≤25 µm and are therefore suitable for ultra-fine filtration. For the characterization, the fabrics have been divided into three groups. The subdivision is based on the weave (plain, twill, satin), the fibers used (monofilament, and multifilament), as well as the material category used (polymer, and metal). The tests were carried out based on regular pressurized filter cell tests according to VDI guideline 2762-2 with focus on the filter medium resistance. The aim was to investigate the order of magnitude of the filter medium resistance through interaction with an orthorhombic (P1), a flaky (P2) and a needle-shaped (P3) particle system. This is based on publications according to [5,19], which have already dealt with similar topics in another mesh size range.
The result of this study is that the filter mean resistance for fabrics ≤25 µm is independent of the mesh size, increases by a factor of 101–102. This increase is independent of the weave and could be observed for plain weave as well as twill and satin fabrics. The former showed a tendency towards 101, whereas fabrics tend to increase by a factor of 102 with increasing warp lift and offset number. The course according to [5] is not appropriate, since the diagram does not show a concentration dependence, which is an important parameter for the formation of solid bridges on the pores after [12]. If the increase in the filter medium resistance due to particle interaction is now transferred to the reduction of the hydraulic load V̇f/A = Δp ∙ ηf−1 ∙ Rtot−1 of the filter medium, a reduction in the hydraulic load of 90–99% (Based on Rtot = 108 m−1 as reference) is shown. This can be seen from the Darcy equation, where the hydraulic load decreases because of the increase in filter medium resistance and thus an increase in pressure drop through the filter. This example shows that the choice of filter medium at 109 m−1 (0.1 m3 ∙ m−2 ∙ s−1; for example (Δp = 105 Pa: ηf = 10−3), Pas the 6 µm metal-based plain fabric, instead of the 6 µm polymer-based satin fabric) can significantly improve the hydraulic load. Effects on subsequent regeneration steps also depend on fabric type and mesh size [21,22].
An additional conclusion is that the increase of the filter medium resistance shows a structure dependence of the particles. Thus, orthorhombic particles (P1) generate the greatest resistance in all tissues. This is due to the interaction of the particles which, due to their structure, can penetrate deep into the tissue and only slightly obstruct each other spatially. With the plated-shaped particles (P2), the filter medium resistance is always below the particles P1 by a factor of 2–5. One explanation is again the spatial structure, which at P2 obstruct the penetration of the particles into the tissue, and thus inhibits the interference resistance. With the needle-shaped particles (P3) this trend becomes even clearer. The needle-shaped structure prevents many particles from interacting with the fabric and thus ensures the lowest filter resistance in all measurements. So, the resistance is below particle system P1 by a factor of 5 up to 10.
A result is that particle interaction has a significant effect on the filtration properties of filter fabrics. This influence becomes apparent with decreasing mesh size, and thus particle size and can lead to a strong reduction of the hydraulic load capacity or the overall performance of the filter apparatus.

Author Contributions

Conceptualization, P.M.; Data curation, V.B.; Formal analysis, V.B.; Funding acquisition, M.G. and H.N.; Investigation, V.B. and B.F.; Methodology, V.B., P.M. and B.F.; Project administration, P.M.; Resources, P.M.; Software, V.B., P.M. and B.F.; Supervision, P.M., M.G. and H.N.; Validation, V.B.; Visualization, V.B.; Writing—original draft, V.B. and P.M.; Writing—review & editing, B.F., M.G. and H.N. All authors have read and agreed to the published version of the manuscript.

Funding

This research received no external funding.

Institutional Review Board Statement

Not applicable.

Informed Consent Statement

Not applicable.

Data Availability Statement

Not applicable.

Acknowledgments

The authors would like to thank the German Federation of Industrial Research Associations (AiF) for the financial support (IGF number 18591 N). The authors would also like to thank all colleagues and students for the support in writing this paper. Furthermore, the authors express their thanks to GKD-Gebrüder Kufferrath AG (Germany), especially Markus Knefel and Dominik Herper for supplying the used metallic fabric samples. An additional gratitude applies to Chwolka and Hoffmann from Sefar AG (Switzerland) and Markus Süsser from Müller AG (Switzerland) for their supply with polymeric filter cloths. We acknowledge support by the KIT-Publication Fund of the Karlsruhe Institute of Technology.

Conflicts of Interest

The authors declare no conflict of interest.

Abbreviations

SymbolDescriptionUnit
AFilter surfacem2
dMeshMesh size of filter cloth based on a bubble-point-testm
HFCFilter cake heightm
KParameter Filter equation-
qParameter Filtration mechanism according to [14]-
RFCFilter cake resistancem−1
RF.0Initial resistance at the beginning of the Filtration m−1
RFMFilter medium resistancem−1
RFM,0Clear water resistance of the filter fabricm−1
RIRInterference resistance [19]; Interaction between filter fabric and particlesm−1
RSupportResistance of the supporting fabric; Tends to 0 compared to the filter fabric.m−1
VFFiltrate volumem3
FFiltrate volume flowm3 ∙ s−1
x50,3Mass/volume related modal valuem
αHSpecific filter cake resistancem−2
ΔpPressure differencePa
ηfViscosityPa ∙ s
χ = A ∙ HFC/VFSpecific cake volume/filtrate volumem3 ∙ m−3

References

  1. Rocha, S.M.S.; Bacelos, M.S.; Damasceno, J.J.R.; Vieira, L.; Aguiar, M.L. The Effect of the Dust Cake Resistance on Fluid Flow Passing through the Filter Media. MSF 2012, 727–728, 758–763. [Google Scholar] [CrossRef]
  2. Jaganathan, S.; Tafreshi, H.V.; Pourdeyhimi, B. A realistic approach for modeling permeability of fibrous media: 3-D imaging coupled with CFD simulation. Chem. Eng. Sci. 2008, 63, 244–252. [Google Scholar] [CrossRef]
  3. Wakeman, R. The influence of particle properties on filtration. Sep. Purif. Technol. 2007, 58, 234–241. [Google Scholar] [CrossRef]
  4. Rushton, A.; Griffiths, P.V.R. Role of the cloth in filtration. Chem. Eng. 2004, 4, 47–54. [Google Scholar]
  5. Rushton, A. Effect of Filter Cloth Structure on Flow Resistance, Bleeding, Blinding and Plant performance. Chem. Eng. 1970, 273, 88–94. [Google Scholar]
  6. Zhang, Q.; Horst, D.; Schmidt, E. Modellierung der Oberflächenstruktur von Nadelfilz-Filtermedien zur Simulation der kuchenbildenden Staubfiltration. Chem. Ing. Tech. 2020, 92, 275–281. [Google Scholar] [CrossRef]
  7. Zhang, Q.; Schmidt, E. Simulation der Partikelschichtablösung unter Beachtung transienter kinetischer Effekte. Chem. Ing. Tech. 2008, 80, 587–592. [Google Scholar] [CrossRef]
  8. Ripperger, S.; Puga, J.F.; Tichy, J.W. Einfluss des Filtermittelwiderstandes und der Strömungswiderstände im Filtratablaufb bbei kontinuierlich betriebenen Filtern mit hohem Feststoffdurchsatz. Filtr. Sep. 2005, 19, 58–62. [Google Scholar]
  9. Purchas, D.B.; Sutherland, K. Handbook of Filter Media; Elsevier Advanced Technology: Oxford, UK, 2002. [Google Scholar]
  10. Darcy, H. Les Fontaines Publiques de la Ville de Dijon: Exposition et Application des Principes à Suivre et des Formules à Employer dans les Questions de Distribution d’eau; Victor Dalmont: Paris, France, 1856. [Google Scholar]
  11. Ergun, S. Fluid flow through packed columns. Chem. Eng. Prog. 1952, 48, 89–94. [Google Scholar]
  12. Kozeny, J. Über kapillare Leitung des Wassers im Boden. Sitz. Akad. Wiss. Wien. 1927, 136, 271–306. [Google Scholar]
  13. Carman, P.C. Fluid flow through granular beds. Trans. Inst. Chem. Eng. 1937, 15, 150–166. [Google Scholar] [CrossRef]
  14. Hermans, P.H.; Bredée, H.L. Zur Kenntnis der Filtrationsgesetze. Recl. Travaux Chim. Pays-Bas. 1935, 54, 680–700. [Google Scholar] [CrossRef]
  15. Erk, A. Rheologische Eigenschaften Feindisperser Suspensionen Während ihrer Fest-Flüssig-Trennung in Filtern und Zentrifugen; Shaker: Aachen, Germany, 2006. [Google Scholar]
  16. Morsch, P.; Ginisty, P.; Anlauf, H.; Nirschl, H. Factors influencing backwashing operation in the liquid phase after cake filtration. Chem. Eng. Sci. 2020, 213, 115372. [Google Scholar] [CrossRef]
  17. Heymann, J.; Böttner, P. Textile Filtermedien—Beschaffenheit und Eigenschaften. Filtr. Sep. 1997, 11, 43–51. [Google Scholar]
  18. Tung, K.-L.; Li, Y.-L.; Lu’, K.-T.; Lu, W.-M. Effect of calendering of filter cloth on transient characteristics of cake filtration. Sep. Purif. Technol. 2006, 48, 1–15. [Google Scholar] [CrossRef]
  19. Tichy, J.W. Zum Einfluss des Filtermittels und der Auftretenden Interferenzen Zwischen Filterkuchen und Filtermittel bei der Kuchenfiltration. Ph.D. Thesis, Technische Universität Kaiserslautern, Kaiserslautern, Germany, 2007. Available online: https://kluedo.ub.uni-kl.de/frontdoor/index/index/docId/1856 (accessed on 22 May 2007).
  20. Anlauf, H. Filtermedien zur Kuchenfiltration—Schnittstelle Zwischen Suspension und Apparat. Chem. Ing. Tech. 2007, 79, 1821–1831. [Google Scholar] [CrossRef] [Green Version]
  21. Morsch, P.; Ginisty, P.; Anlauf, H.; Nirschl, H. Influence of regeneration variables during backwashing treatment into gas-phase after liquid filtration. Sep. Purif. Technol. 2020, 249, 11707. [Google Scholar] [CrossRef]
  22. Morsch, P.; Kühn, J.; Werner, R.; Anlauf, H.; Geier, D.U.; Becker, T.; Nirschl, H. Influence of the filter cloth and nozzles type on the in-situ cleaning procedure of filter presses. Chem. Eng. Sci. 2020, 226, 115889. [Google Scholar] [CrossRef]
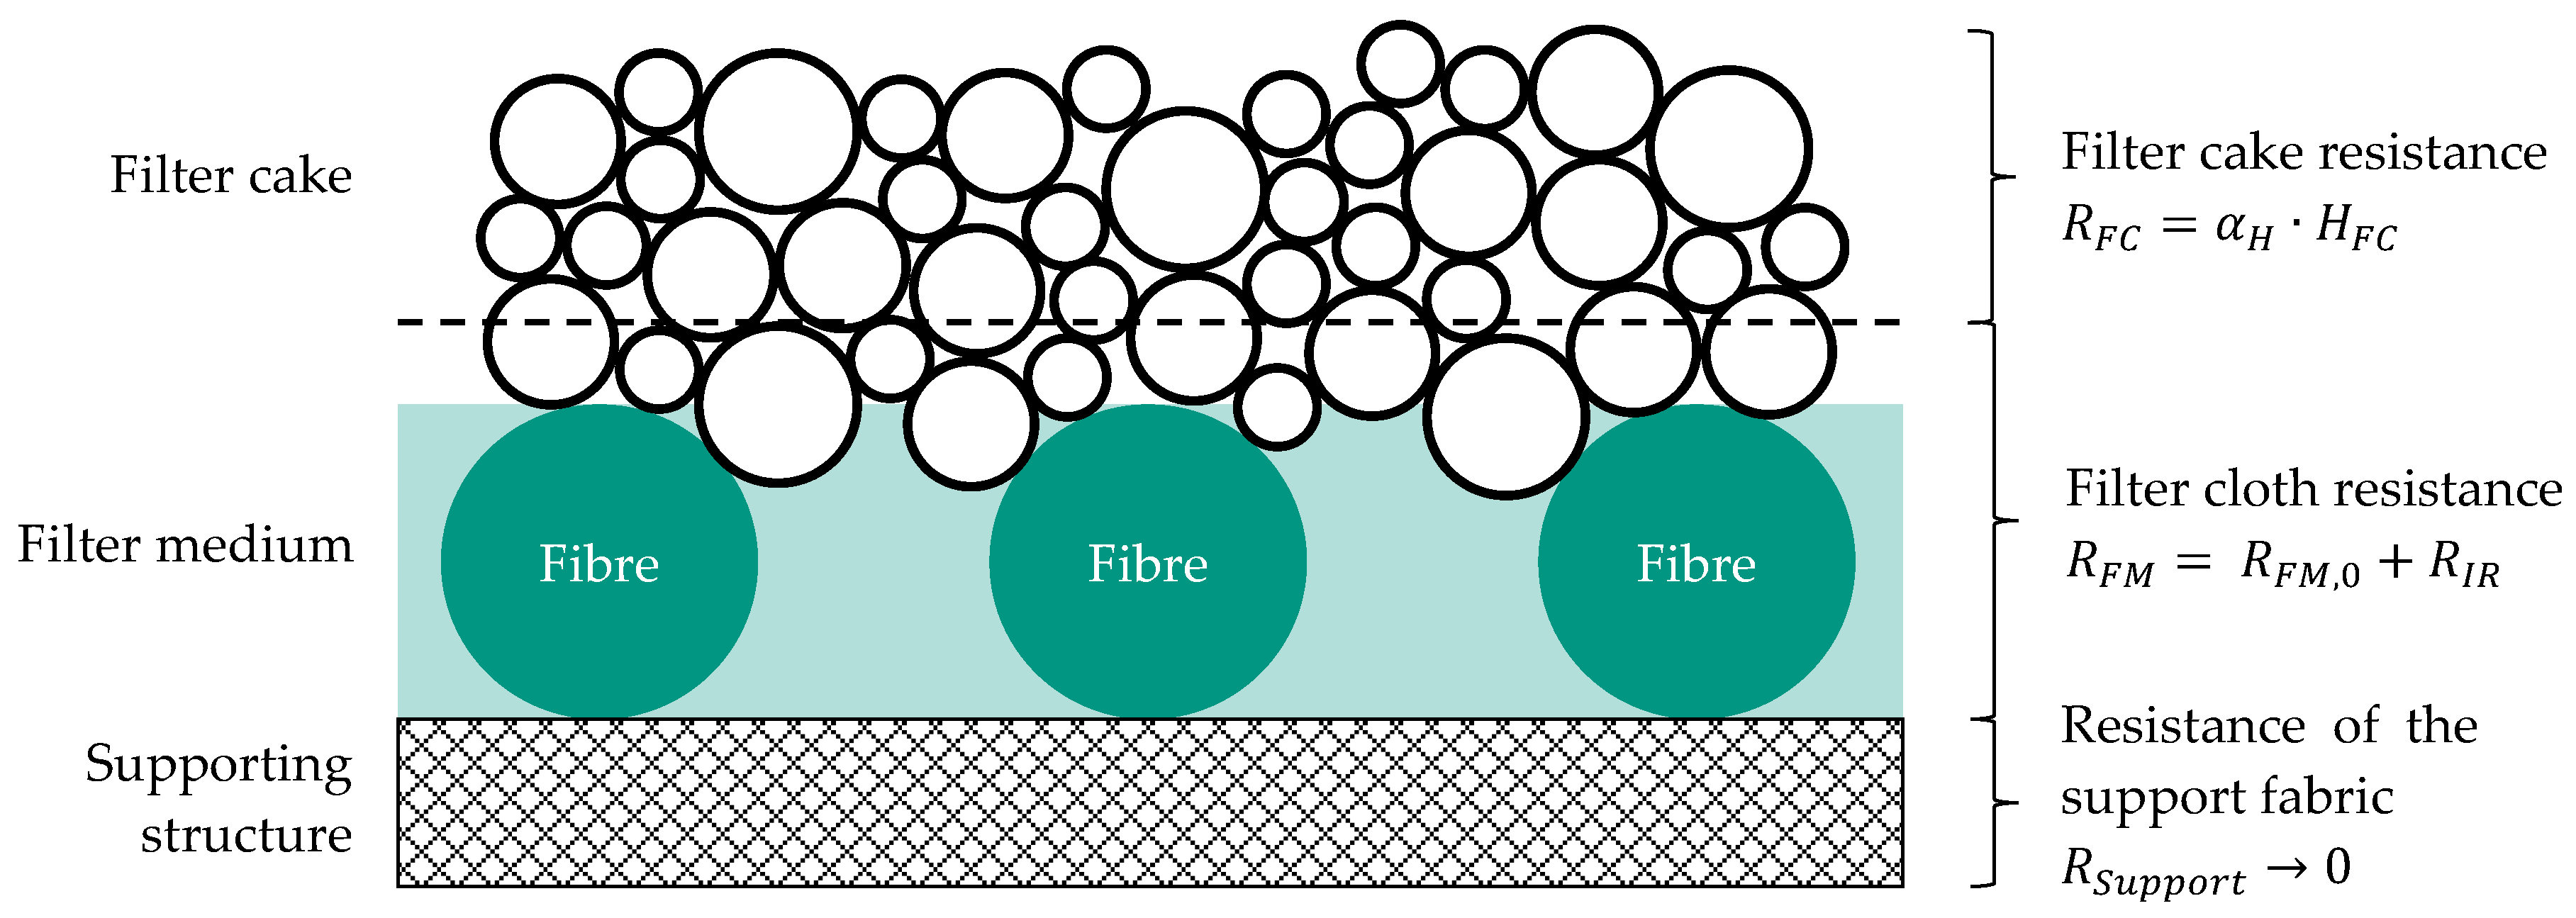
Figure 1. Schematic representation of the effective resistances in the cross-section of a filter cake (RFC), including filter (RFM) and support fabric (Rsupport).
Eng 02 00009 g001
Figure 2. Schematic representation of the separation mechanisms within a fabric mesh/pore as a function of particle size and shape according to [9].
Eng 02 00009 g002
Figure 3. Schematic representation of pressure filtration by means of pressurized filter cell for the suspension feed (a), after filtration (b) and the schematic structure of the filtration process (c). The suspension is separated by a fabric into filter cake and particle-free filtrate.
Eng 02 00009 g003
Figure 4. (ac) Microscopic image of the investigated particle systems with orthorhombic (P1), flaky (P2) and needle-shaped (P3) particle shape.
Eng 02 00009 g004
Figure 5. Overview of the tissue resistances for plain (a), twill (b) and satin fabrics (c) in m−1 of the plastic-based monofilament tissues (Table 1) with interaction of the particles from Figure 2.
Eng 02 00009 g005
Figure 6. (ac) Separation of the different particle systems (P1–P3) for the 22 µm monofilament fabric (plain wave).
Eng 02 00009 g006
Figure 7. Overview of the fabric resistances in m−1 of the plastic-based multifilament fabrics (Table 2) with interaction of the particles from Figure 2.
Eng 02 00009 g007
Figure 8. Overview of the fabric resistances in m−1 of monofilament metal-based plain (a) and twill (b) fabrics (Table 3) with interaction of the particles from Figure 2.
Eng 02 00009 g008
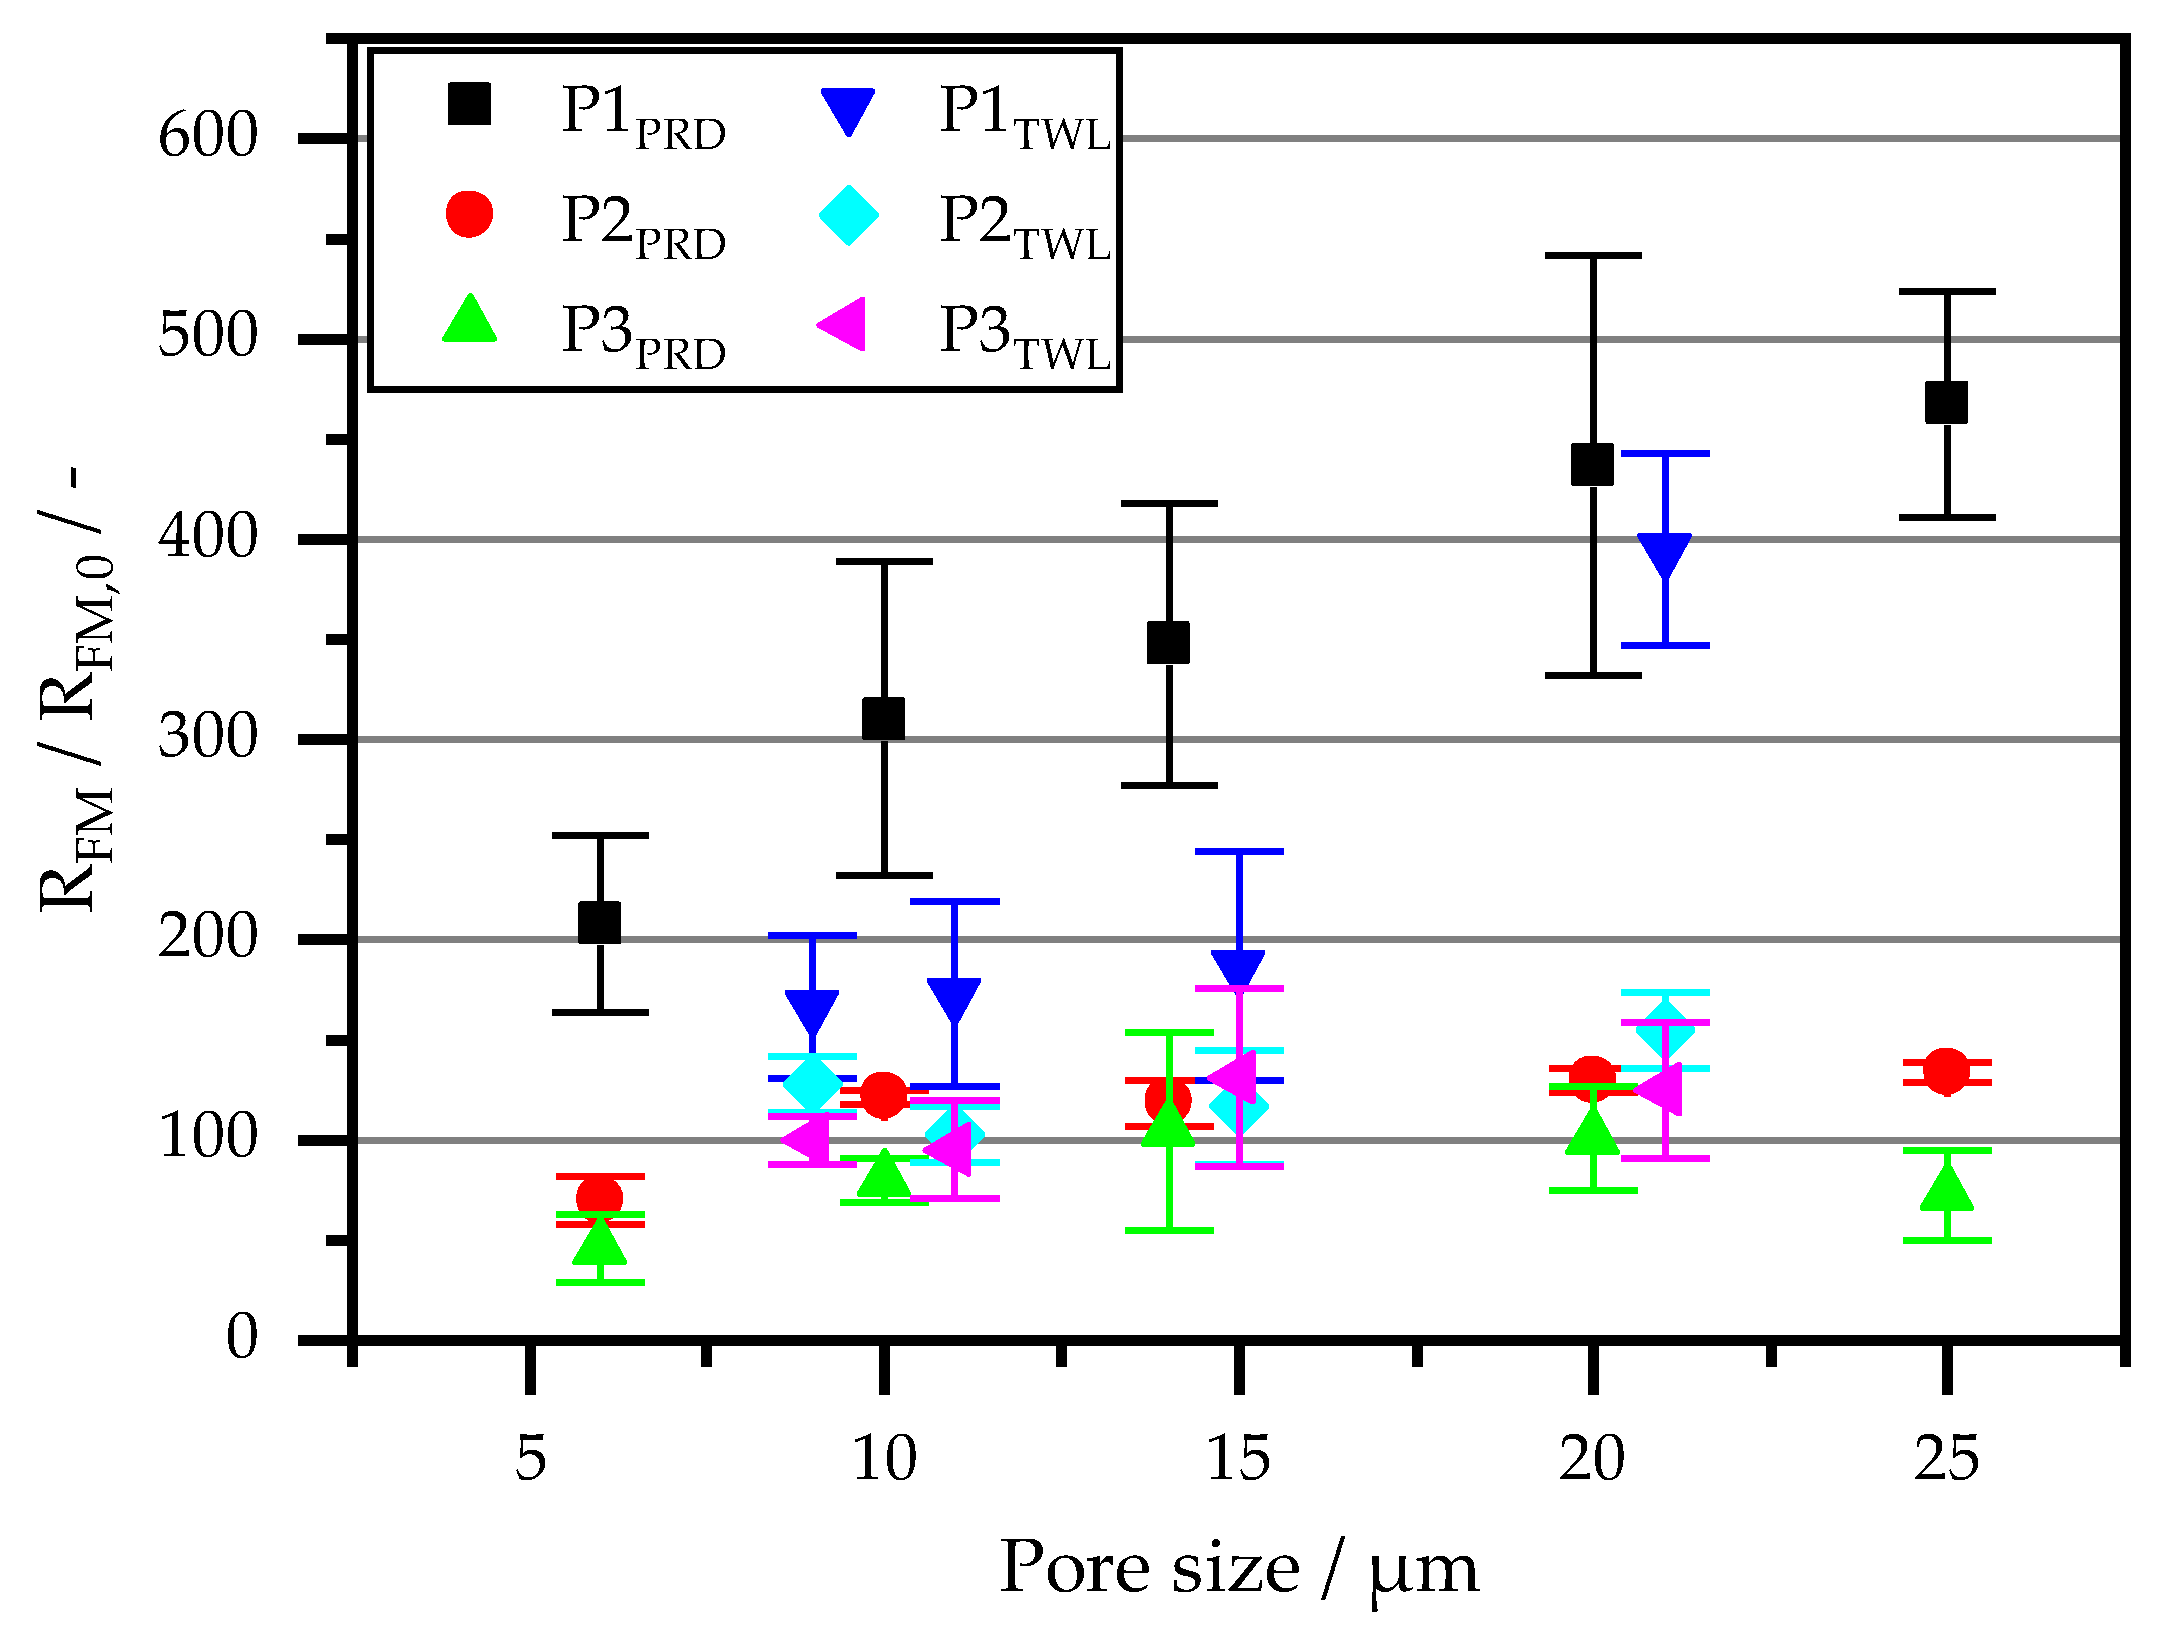
Figure 9. Relative change of the filter medium resistance with particle interaction RFM, related to the clear water resistance RFM,0, over the mesh size of metal-based plain weave and twill weave.
Eng 02 00009 g009
Table 1. Overview of polymer-based monofilament fabrics.
Fabric Type/Mesh Size in µm / MaterialWeave According to DIN ISO 9354Mesh per Filter Area
in mm−2
Weight per Unit Area
in g m−2
Surface Roughness
(ISO 25178)
in µm
Thread Thickness Warp/Weft
in µm
Fabric Thickness (ISO 5084) in µmSchematic Weaving Patterns, Based on [17]
Plain12PET10-01 01-01-00241709100/4580 Eng 02 00009 i001
14PA6.68812090100/75160
22PET6417531126/176185
Twill5PP20-04 01-01-0452953212/822420 Eng 02 00009 i002
11PET20-03 01-01-032924029132/429265
14PP20-02 01-01-024013640168/161200
15PET20-03 01-01-02262358175/283265
20PET20-03 01-01-033523530128/160260
25PP20-02 01-01-02112102461/187320
Satin6PP20-02 01-02-01643511164/898590 Eng 02 00009 i003
11PP30-04 01-01-02533013371/572400
18PP20-08 02-02-04337013269/294500
18PP30-04 02-02-0244477227/443714
22PET30-06 02-01-03539511235/604380
Table 2. Overview of polymer-based multifilament fabrics.
Fabric Type/Mesh Size in µm /MaterialWeave According to DIN ISO 9354Mesh per Filter Area
in mm−2
Weight per Unit Area
in g m−2
Surface Roughness
(ISO 25178)
in µm
Thread Thickness Warp/Weft
in µm
Fabric Thickness (ISO 5084) in µmSchematic Weaving Patterns, Based on [17]
Multi Twill10PP20-02 03-01-04828079146/654560 Eng 02 00009 i004
11,5PVDF20-02 03-01-04755082111/738550
13,25PPS20-02 01-01-01640811325/323670
15PPS20-02 02-02-03224815141/882350
20PP20-02 02-01-031317043106/428390
Multi Plain2,9PPS10-01 01-01-00338116275/431690 Eng 02 00009 i005
12PPS10-01 01-02-00225420181/922370
Table 3. Overview of metal-based multifilament fabrics.
Fabric Type/Mesh Size in µm /MaterialWeave According to DIN ISO 9354Mesh per Filter Area
in mm−2
Weight per Unit Area
in g m−2
Surface Roughness
(ISO 25178)
in µm
Thread Thickness Warp/Weft
in µm
Fabric Thickness (ISO 5084) in µmSchematic Weaving Patterns, Based on [17]
Twill91.440420-02 02-01-02834343419/3066 Eng 02 00009 i006
111.4404455425620/3182
151.4404206757721/64144
211.4306171692644/47142
Plain61.4404/1.430110-01 01-01-001452188413/3665 Eng 02 00009 i007
101.4404869287519/4594
141.4404407444826/60132
201.4404309437927/61145
251.4404260450929/60150
Publisher’s Note: MDPI stays neutral with regard to jurisdictional claims in published maps and institutional affiliations.