Article

Evolution Law of the Thermal Field of Surrounding Rock in High Rock Temperature Tunnels Under Varying Heat Sources

1
School of Qilu Transportation, Shandong University, Jinan 250061, China
2
Shandong Provincial Key Laboratory of Smart Construction & Operation and Maintenance of Highway Infrastructure, Jinan 250357, China
3
Interdisciplinary Center, Shandong University, Jinan 250100, China
4
Shandong Research Institute of Industrial Technology, Jinan 250098, China
*
Author to whom correspondence should be addressed.
CivilEng 2026, 7(2), 36; https://doi.org/10.3390/civileng7020036
Submission received: 24 February 2026 / Revised: 13 May 2026 / Accepted: 15 May 2026 / Published: 9 June 2026
(This article belongs to the Section Geotechnical, Geological and Environmental Engineering)

Highlights

(1)
A model for the evolution of the surrounding rock temperature field, grounded in model tests, has been developed, quantitatively characterizing the approximately linear temperature attenuation trend within the tested range of the surrounding rock temperature under the influence of localized heat sources.
(2)
Defined 8 m3 as the critical saturation volume for heat sources, beyond which the incremental thermal contribution efficiency drops by 25%.
(3)
The cooling influence of conventional ventilation was mainly concentrated within approximately 0.35 m under the present test conditions for conventional ventilation, revealing a significant “ventilation shielding effect” within the deep surrounding rock.
What are the main findings?
  • The temperature field of surrounding rock with high rock temperature exhibits an approximately linear attenuation trend in the far field region, rather than the traditional exponential or logarithmic distribution.
  • The temperature of the surrounding rock and its thermal influence range exhibit a positive linear correlation with both the temperature and size of the heat source.
  • The position of the heat source is linearly related to the temperature field of the surrounding rock, but it has little significant effect on the thermal influence range of the heat source.
What are the implications of the main findings?
  • The deviation of the traditional point source model in predicting heat damage in deep tunnels has been corrected, and a more accurate attenuation gradient has been established.
  • It reveals the ventilation shielding effect of shallow surrounding rock, indicating that relying solely on wall monitoring will underestimate the extent of heat damage in deep rock masses.
  • The cooling limit of conventional ventilation has been clarified, and it is proposed that cooling of combined measures such as insulation, active heat extraction, or thermal-control grouting may be required for persistent deep heat accumulation.

Abstract

High rock temperature (HRT) and its associated thermal hazards, alongside secondary mechanical risks such as swelling pressures induced in clay layers, pose severe threats to the construction safety of deep-buried tunnels. This study aims to quantitatively reveal the evolution laws of the surrounding rock temperature field under varying heat source conditions. A combined approach of physical model testing and numerical analysis was adopted. Utilizing an independently developed test system with a 1:13 geometric similarity ratio, the coupled rock-heat-ventilation environment was simulated. A transient conduction-convection 3D numerical model was established in COMSOL and verified against experimental data under benchmark conditions. The research confirms that under the influence of localized block heat sources, the temperature field in the far-field region follows a significant linear attenuation law rather than the traditional exponential distribution, with a prototype-equivalent gradient of approximately 0.69 °C/m. Furthermore, the study quantitatively identifies 8 m3 as the critical volume for heat source geometric saturation, beyond which the incremental temperature rise efficiency decreases by 25%. It is further revealed that the effective cooling depth of conventional ventilation is only approximately 0.35 m, indicating a significant “ventilation shielding effect” within the deep surrounding rock.

1. Introduction

With the continuous advancement of underground engineering construction, high-temperature thermal hazards have become a critical factor restricting the safe construction of tunnels. The formation of these hazards is profoundly influenced by regional geological structures and hydrogeological conditions [1], particularly in complex geological regions such as Southwest China, exhibiting significant characteristics of multifactorial complexity and diverse disaster forms [2]. When tunnels traverse ultra-high-temperature fault fracture zones and high-pressure water inrush areas, the extreme thermo-hydro coupling environment poses even more severe challenges to construction technology [3].
Accurate prediction of the surrounding rock temperature field must be established on a rigorous foundation of heat transfer theory. For deep-buried tunnels, researchers have proposed convective heat transfer models under non-constant wall temperatures [4] and their three-dimensional analytical solutions [5], analytical solutions for heat transfer in heating sections considering insulation layers [6], and three-dimensional heat transfer models induced by lining heat exchangers [7]. Furthermore, research such as transient measurements of pulsating flow heat transfer under complex flow fields [8] and simplified calculation methods for the comprehensive heat exchange of subway tunnel shave further enriched the thermo-physical description framework under various engineering backgrounds [9].
It is noteworthy that the evolution of the surrounding rock temperature field is not driven by a single geothermal source but is rather the result of the dynamic coupling of multiple heat sources. The hydration heat released by concrete linings during the construction phase exhibits significant nonlinearity, directly affecting the initial temperature field distribution [10]. Simultaneously, mechanical ventilation alters the thermal boundary conditions of the surrounding rock surface by strengthening convective heat exchange [11], which in turn affects the formation and migration of the heat-regulating circle [12,13]. For TBM-constructed tunnels, the coupled equilibrium between rock heat transfer and ventilation systems must also be considered [14]. Spray cooling technology indirectly intervenes in convective heat exchange efficiency by adjusting ambient humidity [15,16]. In high-speed railway tunnels, piston wind induced by train operations creates periodic disturbances to the temperature field [17]. Furthermore, energy tunnel technology facilitates active energy exchange by embedding heat exchange pipes in the surrounding rock [18,19], utilizing porous media models to simulate the 3D fluid-solid coupling process [20], which disrupts the original geothermal equilibrium within the rock and causes the evolution logic of the temperature field to exhibit strong non-steady-state controlled patterns. The evolution of the temperature field directly triggers changes in material and structural performance. Under thermal shock, grain-scale thermo-mechanical coupling simulations of heterogeneous granite have revealed micro-damage mechanisms [21]. High-temperature environments in deep strata significantly deteriorate the strength of surrounding rock [22], making weak areas such as fault fracture zones prone to face instability [23]. Therefore, conducting hierarchical research on support structure systems for high-rock-temperature tunnels [24] and systematically exploring the collaborative evolution laws of the rock-support structure [25,26] are crucial for ensuring long-term engineering stability.
To regulate the evolution of the temperature field, research into thermal insulation materials has become a major direction. From traditional calcium silicate-substituted cement-based materials [27] to eco-friendly insulation materials developed from natural fibers like reed and straw [28], and high-performance carbon-fiber-modified aerogel composites [29], the material system continues to expand. Simultaneously, novel insulation schemes such as boron-hybrid silicone rubber and hollow microspheres [30], combined with numerical analysis of airflow temperature fields with insulation layers [31], provide technical support for effectively blocking heat transfer from the surrounding rock to the interior.
In summary, although significant progress has been made in the mechanisms of tunnel thermal hazards and cooling strategies, existing results predominantly focus on qualitative analysis, making it difficult to quantitatively reveal the influence range of HRT zones or provide systematic geothermal prediction methods. To address these deficiencies, this paper employs a combination of a self-developed model test system and multi-physics numerical simulations. The study focuses on the quantitative effects of heat source temperature, size, and position on the evolution of the surrounding rock temperature field under coupled conditions of initial geothermy and convective ventilation, aiming to provide scientific theoretical support for refined thermal prediction and the design of heat-resistant linings in high-temperature tunnels.
It should be noted that this study does not aim to experimentally optimize all available cooling technologies. Instead, it focuses on the temperature-field response of surrounding rock under conventional ventilation and localized heat-source conditions. Other thermal-control methods, such as spray cooling, insulation layers, cooling pipes, and thermal grouting, are discussed later only from the perspective of engineering applicability.

2. Model Test of High Rock Temperature Heat Source

2.1. Experimental Device

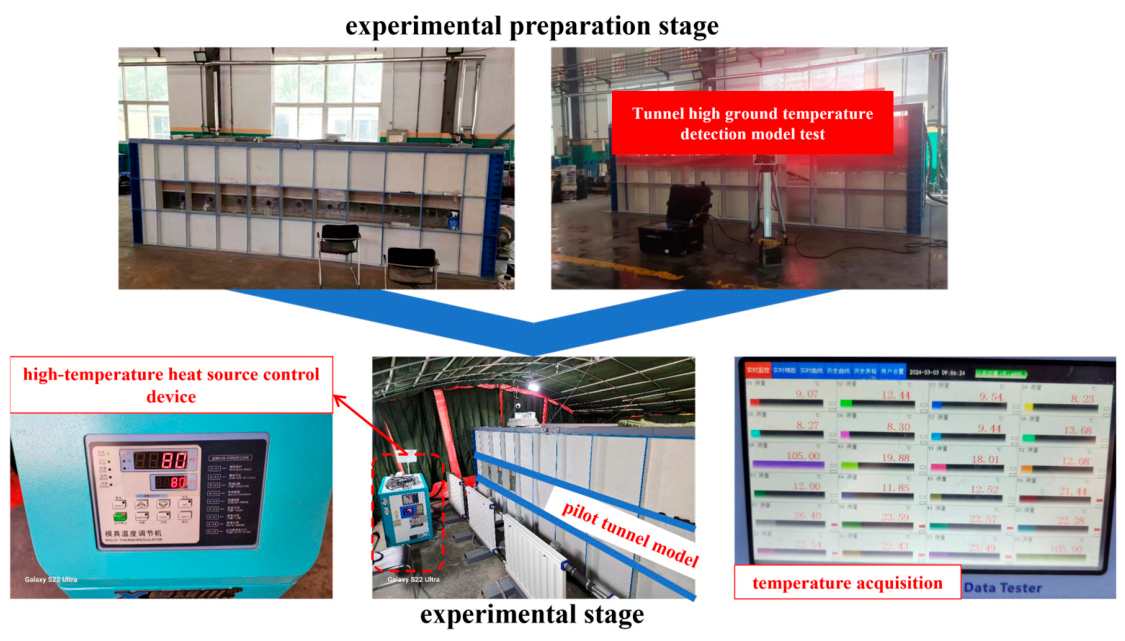
To investigate the distribution laws of the initial rock temperature field under the action of a local heat source, and the cooling effects on the surrounding rock temperature field under tunnel excavation and ventilation conditions, a multi-application scenario tunnel temperature model test system was independently developed in this study. The model test apparatus consists of four parts: the model frame structure, the temperature control system, the ventilation system, and the monitoring system, as shown in Figure 1.
Owing to the constraints of limited experimental space, the model framework employs a steel skeleton filled with high-density thermal insulation material to emulate a “semi-infinite body” environment. This approach is intended to guarantee that the observed evolution of the temperature field is solely propelled by internal localized heat sources and convective heat transfer, without being influenced by temperature variations in the laboratory setting. Acrylic panels are mounted on the front face of the model for observational purposes, and adiabatic boundaries are established around the model to replicate the thermal conditions of deeply buried, infinitely extending surrounding rock. The ventilation device is installed at the portal of the parallel pilot tunnel, with an adjustable wind speed range of 0.2 to 10 m/s, designed to simulate forced or exhaust ventilation during the tunnel construction period. The monitoring system employs high-precision Pt1000 temperature sensors (error ≤ 0.5 °C) and a paperless recorder. The sensors are densely arranged along preset monitoring lines (longitudinal, transverse, and key cross-sections) to capture the fine variations of the temperature field. Due to the finite number of embedded sensors, the measured temperature curves were used to characterize the overall attenuation trend rather than to establish a universal statistical law.
Taking a specific railway tunnel as the prototype, the model test was designed with a geometric similarity ratio of 1:13. The similarity ratios for various parameters are listed in Table 1.

2.2. Experimental Materials

Based on the engineering conditions of a high-rock-temperature railway tunnel, similar materials were prepared using orthogonal tests, with thermal conductivity, specific heat capacity, and density selected as the primary control parameters. The optimal mix proportion was determined as Water:Lime:Gravel:Soil:Sand = 7.5:4.3:12.9:43:32.3 (shown in Table 2). Although the measured thermal conductivity (approx. 1.551 W/(m·K)) deviates from the target prototype value (approx. 2.474 W/(m·K)), the two values remain consistent in terms of order of magnitude (shown in Table 3). The difference in thermal conductivity between the model material and the prototype rock might influence the absolute temperature level; therefore, the analysis focused mainly on relative temperature variation, attenuation trend, and cooling influence range. The model was constructed using a layered compaction method; each loose layer was filled to a height of 50 cm and compacted to approximately 30 cm. Multiple scale markers were set inside the model box to ensure the uniformity and levelness of the filling.

2.3. Sensor Deployment

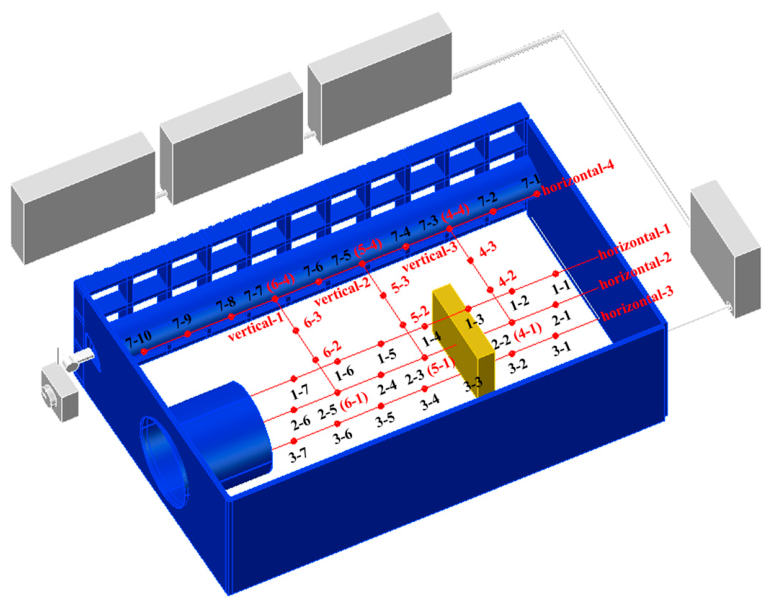
This experiment investigates the physical laws governing the distribution of the initial virgin rock temperature field and the temperature field under pilot tunnel ventilation. Under the condition of a constant heat source temperature, the evolution characteristics of the rock temperature field during these two stages were analyzed respectively. The spatiotemporal variations of the temperature field were monitored using Pt1000 sensors. Given the finite deployment density of the sensors, their specific layout and installation method are illustrated in Figure 2.

2.4. Test Steps

(1)
Model construction
The model was constructed using a layered filling and compaction method. Each loose layer of 50 cm was compacted to a thickness of 30 cm. During this process, sensors and heat sources were embedded, and a waterproof thermal insulation layer was installed.
(2)
Establishment of initial geothermal field
The heat source was activated and set to 80 °C. Heating continued until the temperatures at all monitoring points within the model reached a steady state. This phase simulates the distribution of the virgin rock temperature field under the influence of a local geological heat source prior to tunnel excavation.
(3)
Simulation of excavation and ventilation
During the test, the cooling intake air was ambient air at 20 °C, and the temperature set in the numerical model was kept consistent with this value. The thermal insulation material at the designated tunnel position was then removed, and the ventilation system was activated. The dynamic response of the surrounding rock temperature field under the convective effect of the cold air was monitored and recorded in real time until a new dynamic equilibrium was achieved.

3. Numerical Simulation of Temperature Transfer in High-Temperature Heat Damage

3.1. Numerical Model

To address the limitations imposed by the finite number of measurement points in the physical model and to conduct a broader parametric sensitivity analysis, a three-dimensional (3D) numerical model corresponding to the physical experiment was developed using COMSOL Multiphysics 6.3 software. The numerical model was constructed strictly based on the geometric dimensions of the physical model (at a 1:1 scale) to eliminate validation errors associated with scale effects. An unstructured tetrahedral mesh was employed; to accurately capture the steep temperature gradients near the tunnel walls, boundary layer mesh refinement was applied at the fluid-solid conjugate heat transfer interfaces. The model coupled the “Heat Transfer in Solids” and “Non-Isothermal Pipe Flow” modules. The solid domain was defined by an isotropic thermal conduction model.
In the present numerical model, the ventilation process was simplified as an equivalent convective heat-transfer boundary rather than a fully resolved turbulent airflow field. The main objective of the model was to reproduce the heat conduction and temperature attenuation characteristics of the surrounding rock under ventilation-induced cooling, rather than to resolve the detailed velocity fluctuation and turbulence structure inside the tunnel. Therefore, an equivalent simplified airflow treatment was adopted, and its applicability was evaluated by comparison with the physical model test.

3.2. Boundary Condition

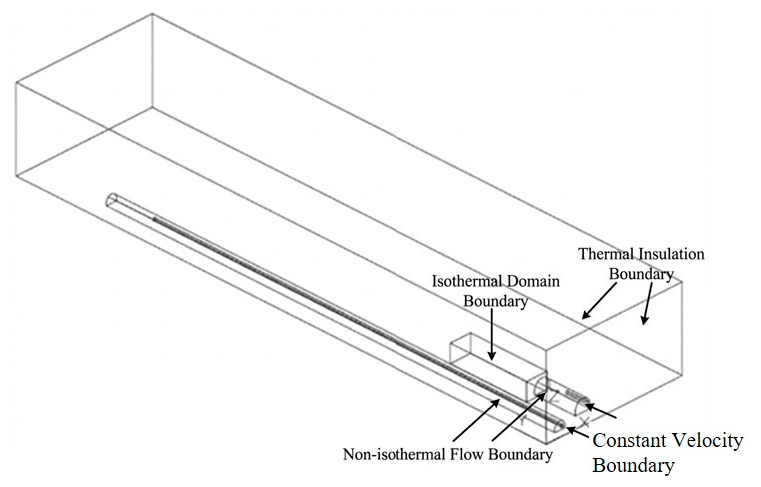
As shown in Figure 3, the numerical model employs adiabatic boundaries on all sides. An isothermal domain is selected as the heat source to ensure precise variable control, setting the heat source boundary as isothermal. Ventilation ducts are established at the entrances of the pilot and main tunnels, with a fixed velocity inlet set to 4 m/s based on site data. The inner linings of the tunnels are assigned a non-isothermal flow boundary, effectively coupling the heat conduction and convection mechanisms.

3.3. Physical Parameter

Table 4 and Table 5 present the physical and mechanical parameters as well as thermodynamic parameters of the surrounding rock and fluid.

3.4. Numerical Calculation Conditions

Based on the validated model tests, 750 simulation scenarios were designed by taking the temperature, position, and dimensions of the heat source as variables. The specific details are listed in Table 6.

3.5. Accuracy Verification of Numerical Calculation

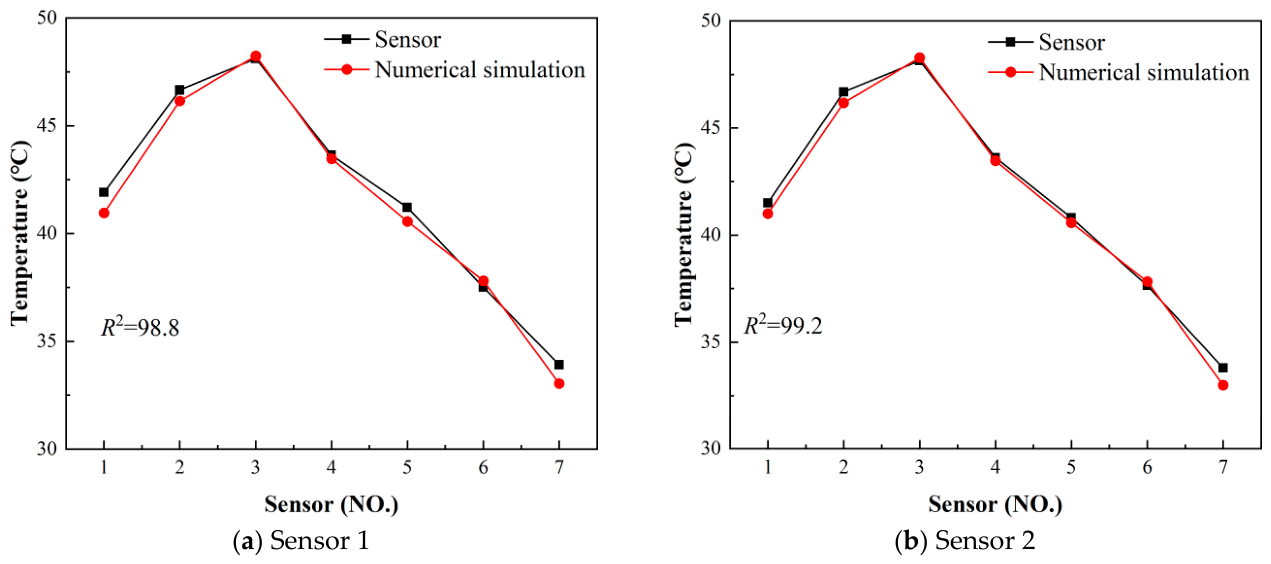
The domain point probe is incorporated into the numerical model as a monitoring point. Comparison between the monitoring data and numerical simulation outcomes yields an error margin of less than 2% (Figure 4). The numerical model was validated under a baseline condition of an 80 °C heat source and a 4 m/s airflow. Owing to the large volume of data generated from 750 simulation cases and the paper’s focus on the experimentally derived evolutionary model, the complete dataset is not presented here due to space constraints. By substituting the measured parameters into the numerical model and achieving high agreement with experimental results, the physical model’s effectiveness in capturing the temperature field evolution is validated, ensuring that parameter fluctuations arising from scale effects do not distort the core conclusions.
It should be noted that the actual ventilation airflow in the tunnel may exhibit turbulent characteristics. However, this study focuses on the temperature response of the surrounding rock rather than the detailed airflow structure. The simplified airflow model mainly affects the near-wall convective heat-transfer intensity, whereas the temperature evolution in the deeper surrounding rock is primarily governed by heat conduction. In this study, the numerical model was verified against the physical model test under the same heat-source and ventilation conditions, with a comparison error of less than 2%. Therefore, the simplified ventilation treatment is considered acceptable for identifying the general temperature attenuation trend and the limited cooling influence range of conventional ventilation. Nevertheless, the lack of a fully resolved turbulence model is acknowledged as a limitation, and future work will incorporate turbulence models to further improve the prediction of near-wall heat transfer.

4. Model Test Results

4.1. Spatial Distribution Pattern of Temperature Field

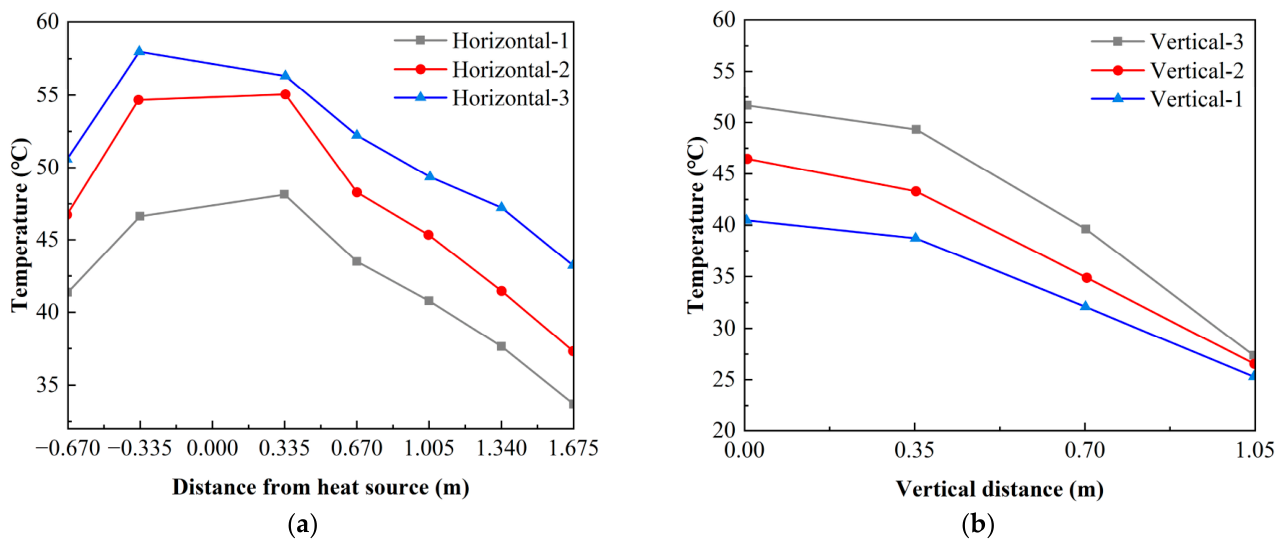
The spatial distribution results of the model test are illustrated in Figure 5. The study revealed a significant phenomenon distinct from traditional point source diffusion theory: under the action of a localized block heat source, the internal temperature of the surrounding rock exhibited a distinct decay pattern with increasing distance. As observed from the figure, for both longitudinal and transverse spatial distributions, the temperature along the same monitoring line attenuated as the distance from the heat source increased, demonstrating a strong characteristic within a certain range.
In the near-field zone within 0.335 m from the heat source, the temperature was directly controlled by the localized heat source and remained relatively stable, with a fluctuation of less than 2 °C. Therefore, this region was not used to infer the far-field attenuation behavior. In the region farther than 0.335 m from the heat source, the measured temperature decreased with increasing distance and showed an approximately linear attenuation trend within the tested range. Based on the available monitoring data, the attenuation gradient was 8.96 °C/m at the model scale, corresponding to approximately 0.69 °C/m at the prototype scale according to the geometric similarity ratio of 1:13. Considering the limited number of monitoring points, this relationship is interpreted as an empirical linear approximation under the present test conditions.

4.2. Time Evolution Law of Temperature Field

(1)
Temporal evolution characteristics of surrounding rock ahead of the main tunnel face
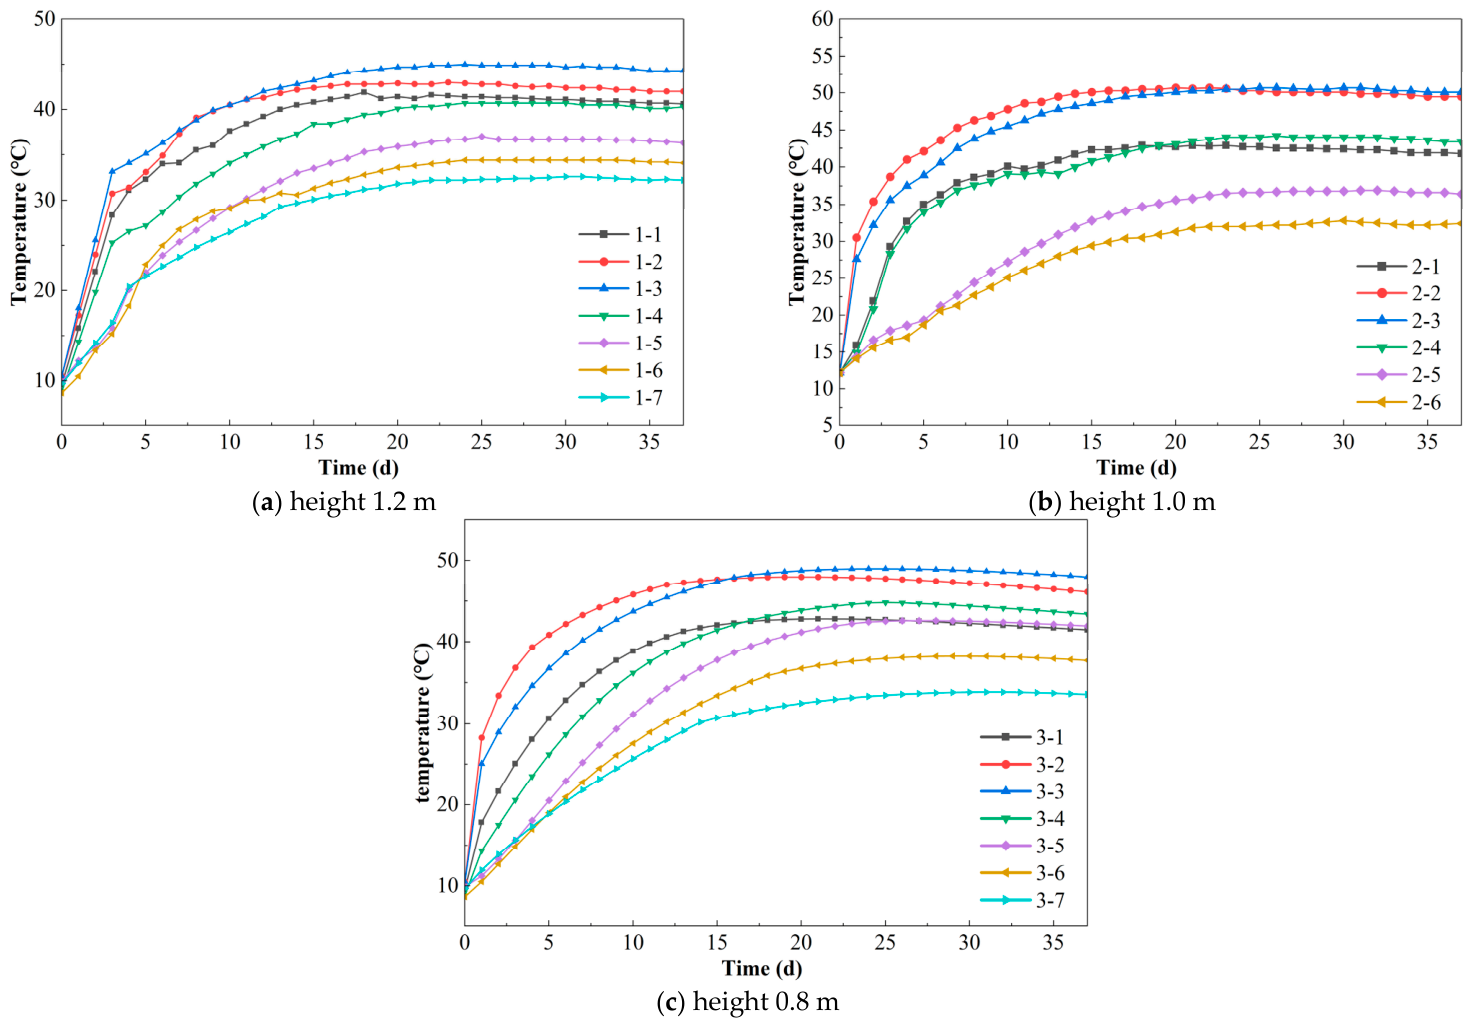
After establishing a stable initial state, the temperature evolution was monitored, as shown in Figure 6, which presents the temporal evolution of the internal model temperature at varying heights along the main tunnel direction. Based on the temperature variations at different distances within the same elevation, it was observed that regardless of the height (1.2 m, 1.0 m, or 0.8 m), the internal temperature consistently exhibited an increasing trend followed by stabilization. By the 20th day of heating, temperatures at all locations reached their peak and stabilized. Notably, the proximity to the heat source was inversely proportional to the time required to reach a stable value (i.e., locations closer to the heat source stabilized faster). For instance, sensors 1-2, 2-2, and 3-2 all reached a steady state after 16 days of heating.
On the 22nd day, when ventilation cooling was initiated, the internal temperature along the main tunnel decreased slightly, with a drop of less than 1.5 °C. The analysis suggests that the distance from the heat source significantly influenced the time required to reach thermal equilibrium. Under the present heat-source and ventilation conditions, the cooling response was mainly concentrated within approximately 0.35 m from the ventilation boundary, while the deeper surrounding rock showed a much weaker temperature decrease.
(2)
Temperature evolution laws in the lateral direction of the main tunnel
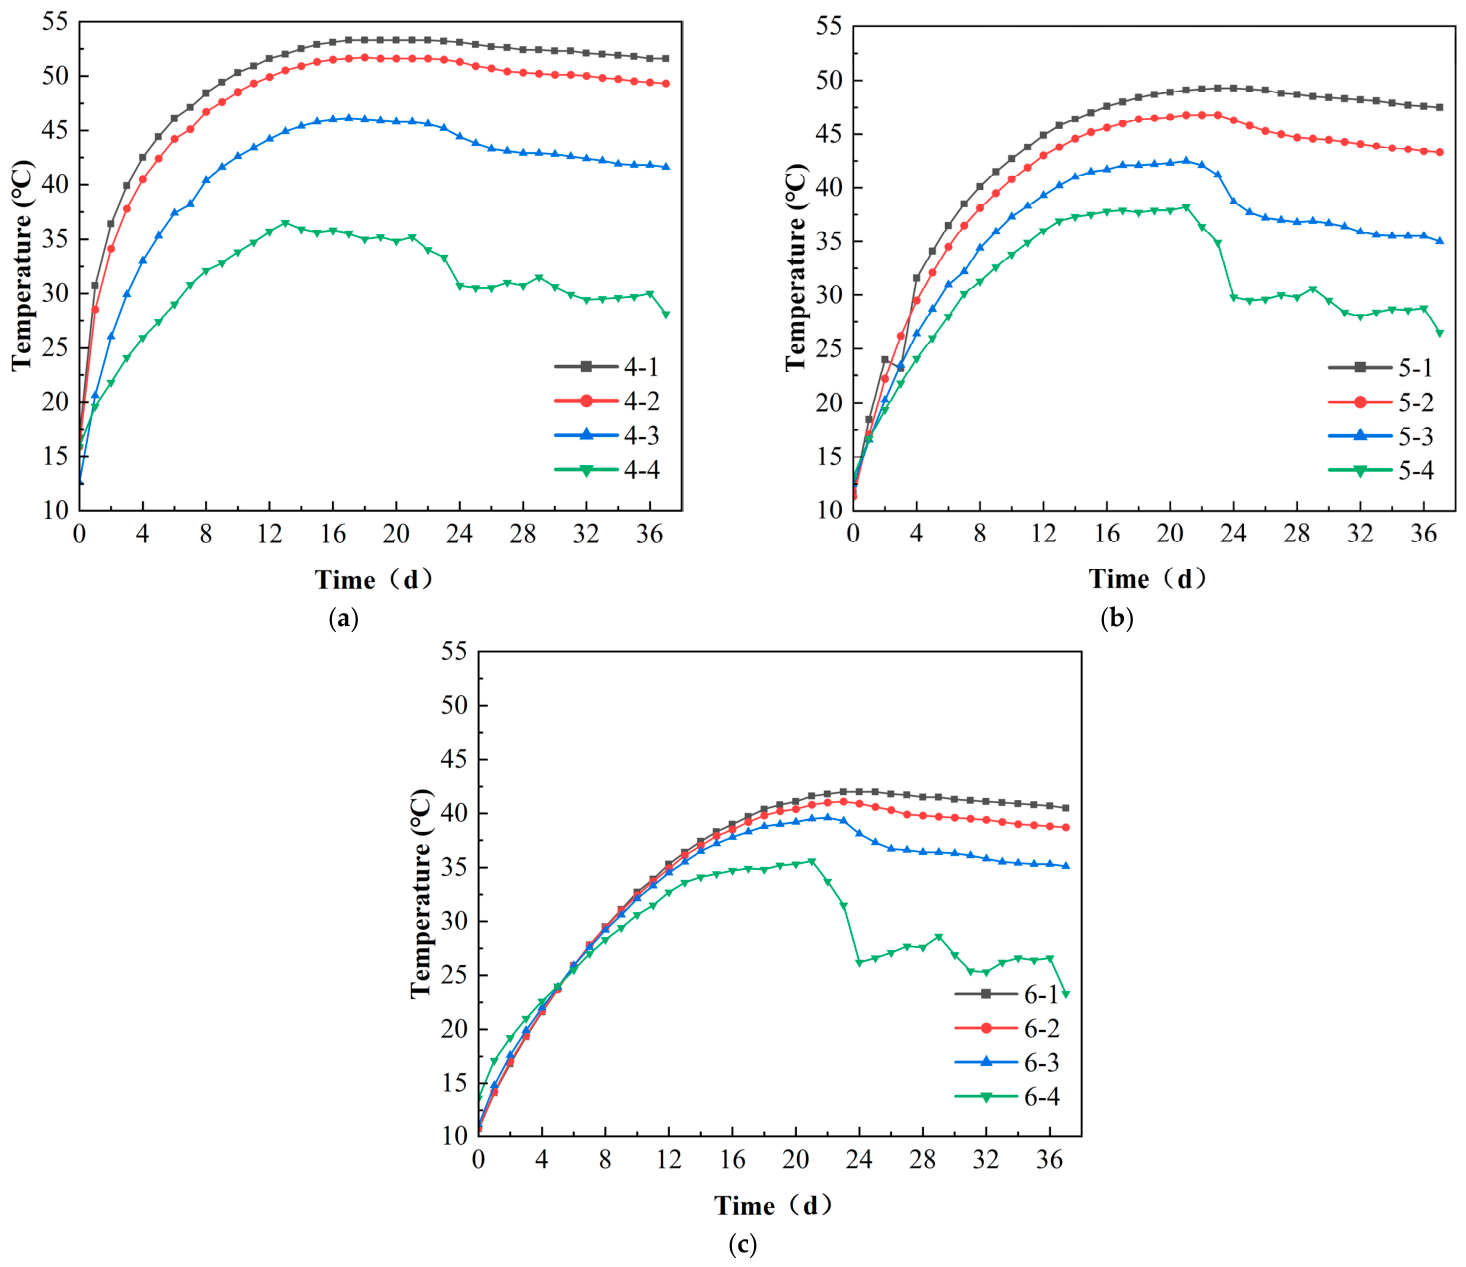
Figure 7 illustrates the temporal evolution of the internal model temperature at various distances perpendicular to the main tunnel. It was observed from the temperature variations at different distances that regardless of the distance (0.35 m, 0.67 m, or 1.34 m), the internal temperature consistently exhibited a trend of increasing, stabilizing, and subsequently decreasing. By the 20th day of heating, temperatures at all locations reached their peak and achieved stability. Upon the initiation of ventilation cooling on day 22, the temperature at distances of 0.7 m and 1.05 m perpendicular to the main tunnel decreased significantly, with a daily drop exceeding 1.2 °C. In contrast, at distances of 0 m and 0.35 m, the temperature decreased slightly, with a daily drop of less than 0.7 °C. The analysis suggested that ventilation cooling only influenced the internal temperature within a limited zone. While the cooling effect on the tunnel wall was excellent, the temperature decrease in the deep surrounding rock was extremely slow. Specifically, within an effective radius of 0.35 m from the pilot tunnel ventilation, the internal temperature dropped significantly. However, beyond this effective radius (>0.35 m), the heat accumulated in the region could not be rapidly dissipated by the airflow, which constituted a long-term heat source during the tunnel operation period.
(3)
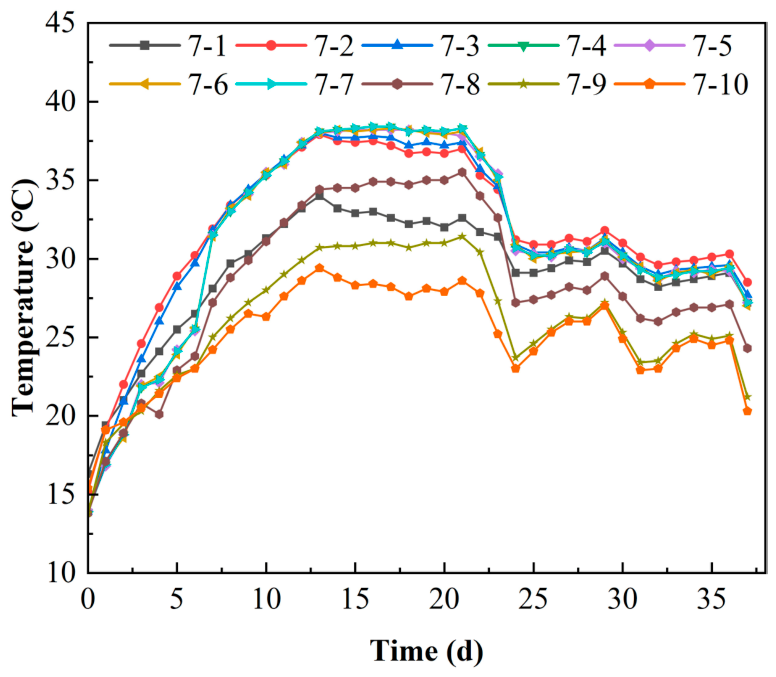
Temperature evolution laws of surrounding rock at the pilot tunnel sidewall
Figure 8 illustrates the temporal evolution of temperature at various positions along the direction of the pilot tunnel. It was observed from the figure that the temperature at the pilot tunnel sidewall exhibited a trend of increasing, stabilizing, and subsequently decreasing. Under conditions without ventilation cooling, the temperatures of sensors uniformly distributed along the pilot tunnel all reached stability on the 14th day. Following the initiation of ventilation cooling, temperatures at different positions on the pilot tunnel sidewall exhibited varying degrees of reduction. The maximum temperature increment occurred at point 7-4. Since this point had the shortest linear distance to the heat source, it received the most heat via conduction, resulting in a maximum increase of 24 °C. The temperature increments at sensor 7-3 and 7-5 were the second highest, increasing by 23 °C. The temperature increments of the remaining sensors decreased in accordance with their distance from the heat source; specifically, the temperature increment decreased by 2.5 °C for every 0.335 m increase in distance. The minimum temperature increment was observed at point 7-10, with an increase of 17 °C. After ventilation cooling, sensors 7-1 through 7-10 all reached their minimum temperatures on the 24th day, indicating that the cooling process was completed within 4 days. The temperatures reached by sensors 7-4, 7-5, 7-6, and 7-7 were basically consistent, all settling at 30.5 °C. Sensor 7-8 experienced the largest temperature reduction (8.3 °C), while sensor 7-10 experienced the smallest reduction (4.9 °C). The analysis suggested that under ventilation conditions, the difference in temperature reduction among the sensors arranged along the pilot tunnel did not exceed 1 °C. This indicated that the influence of ventilation cooling on the pilot tunnel sidewall was minimally affected by the position of the heat source.

5. Influence Mechanism of High-Temperature Thermal Hazard Propagation

5.1. Influence of Heat Source Temperature on the Surrounding Rock Temperature Field

(1)
Influence of heat source temperature on the internal temperature field of surrounding rock
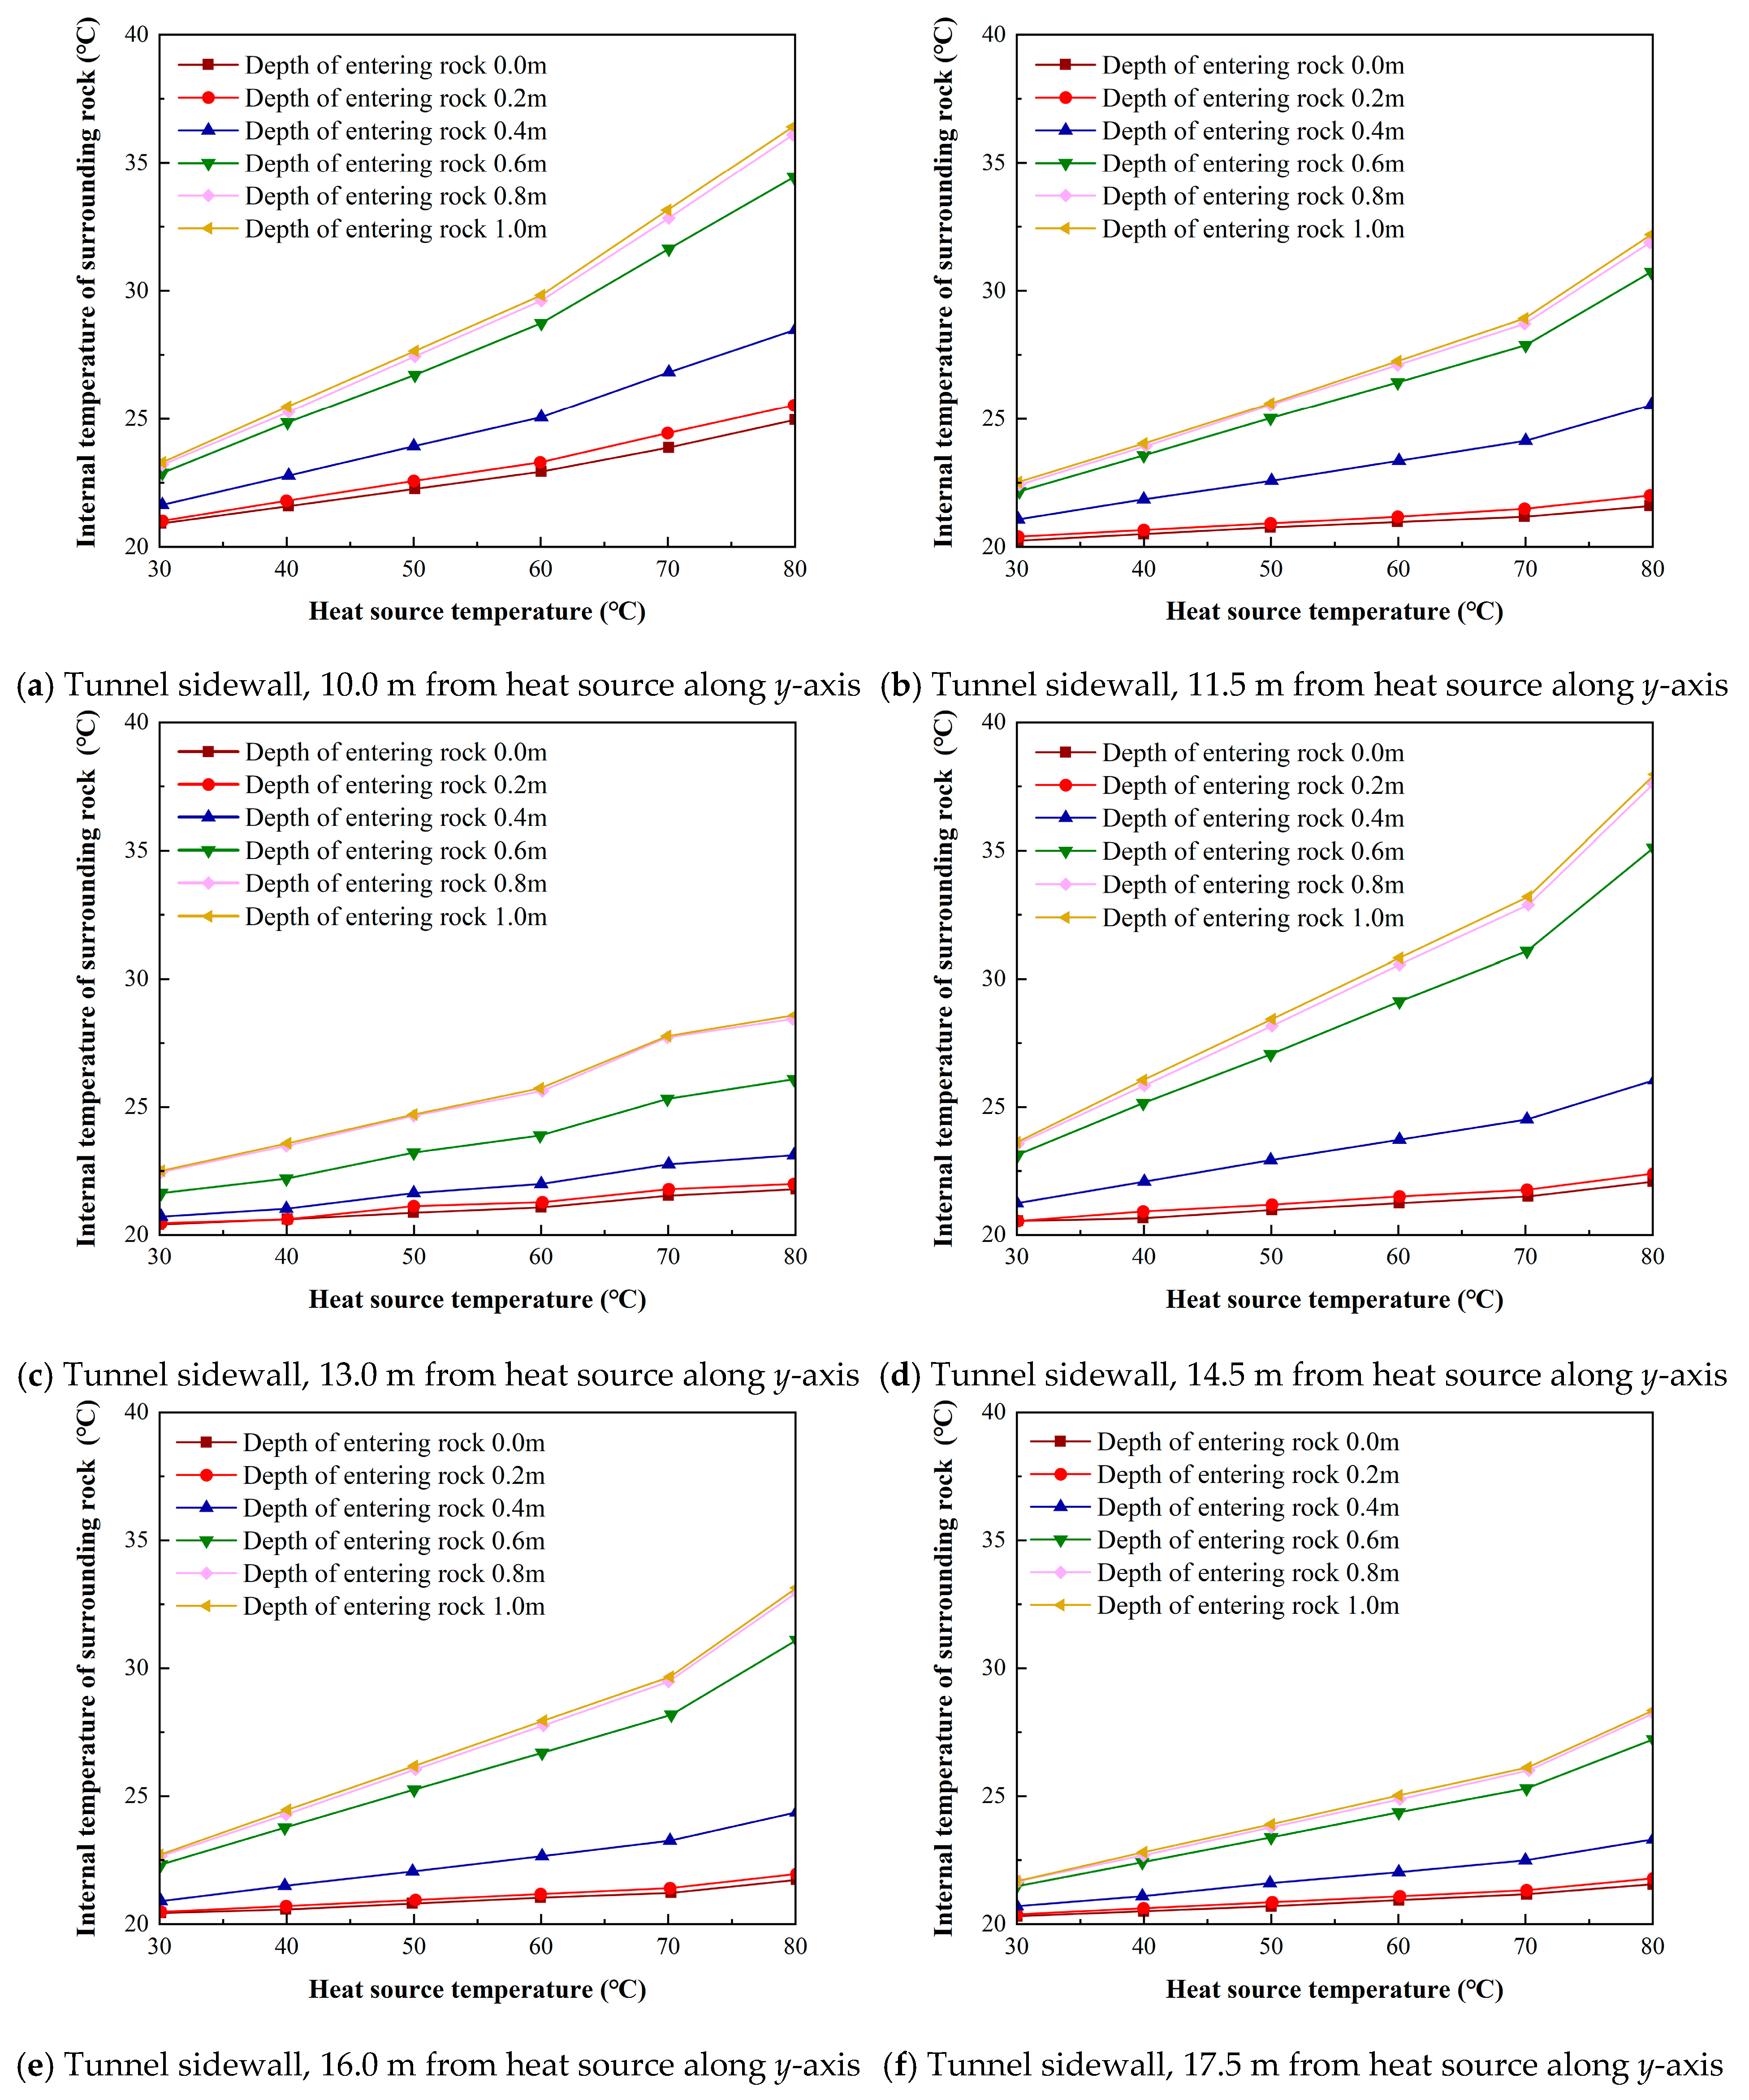
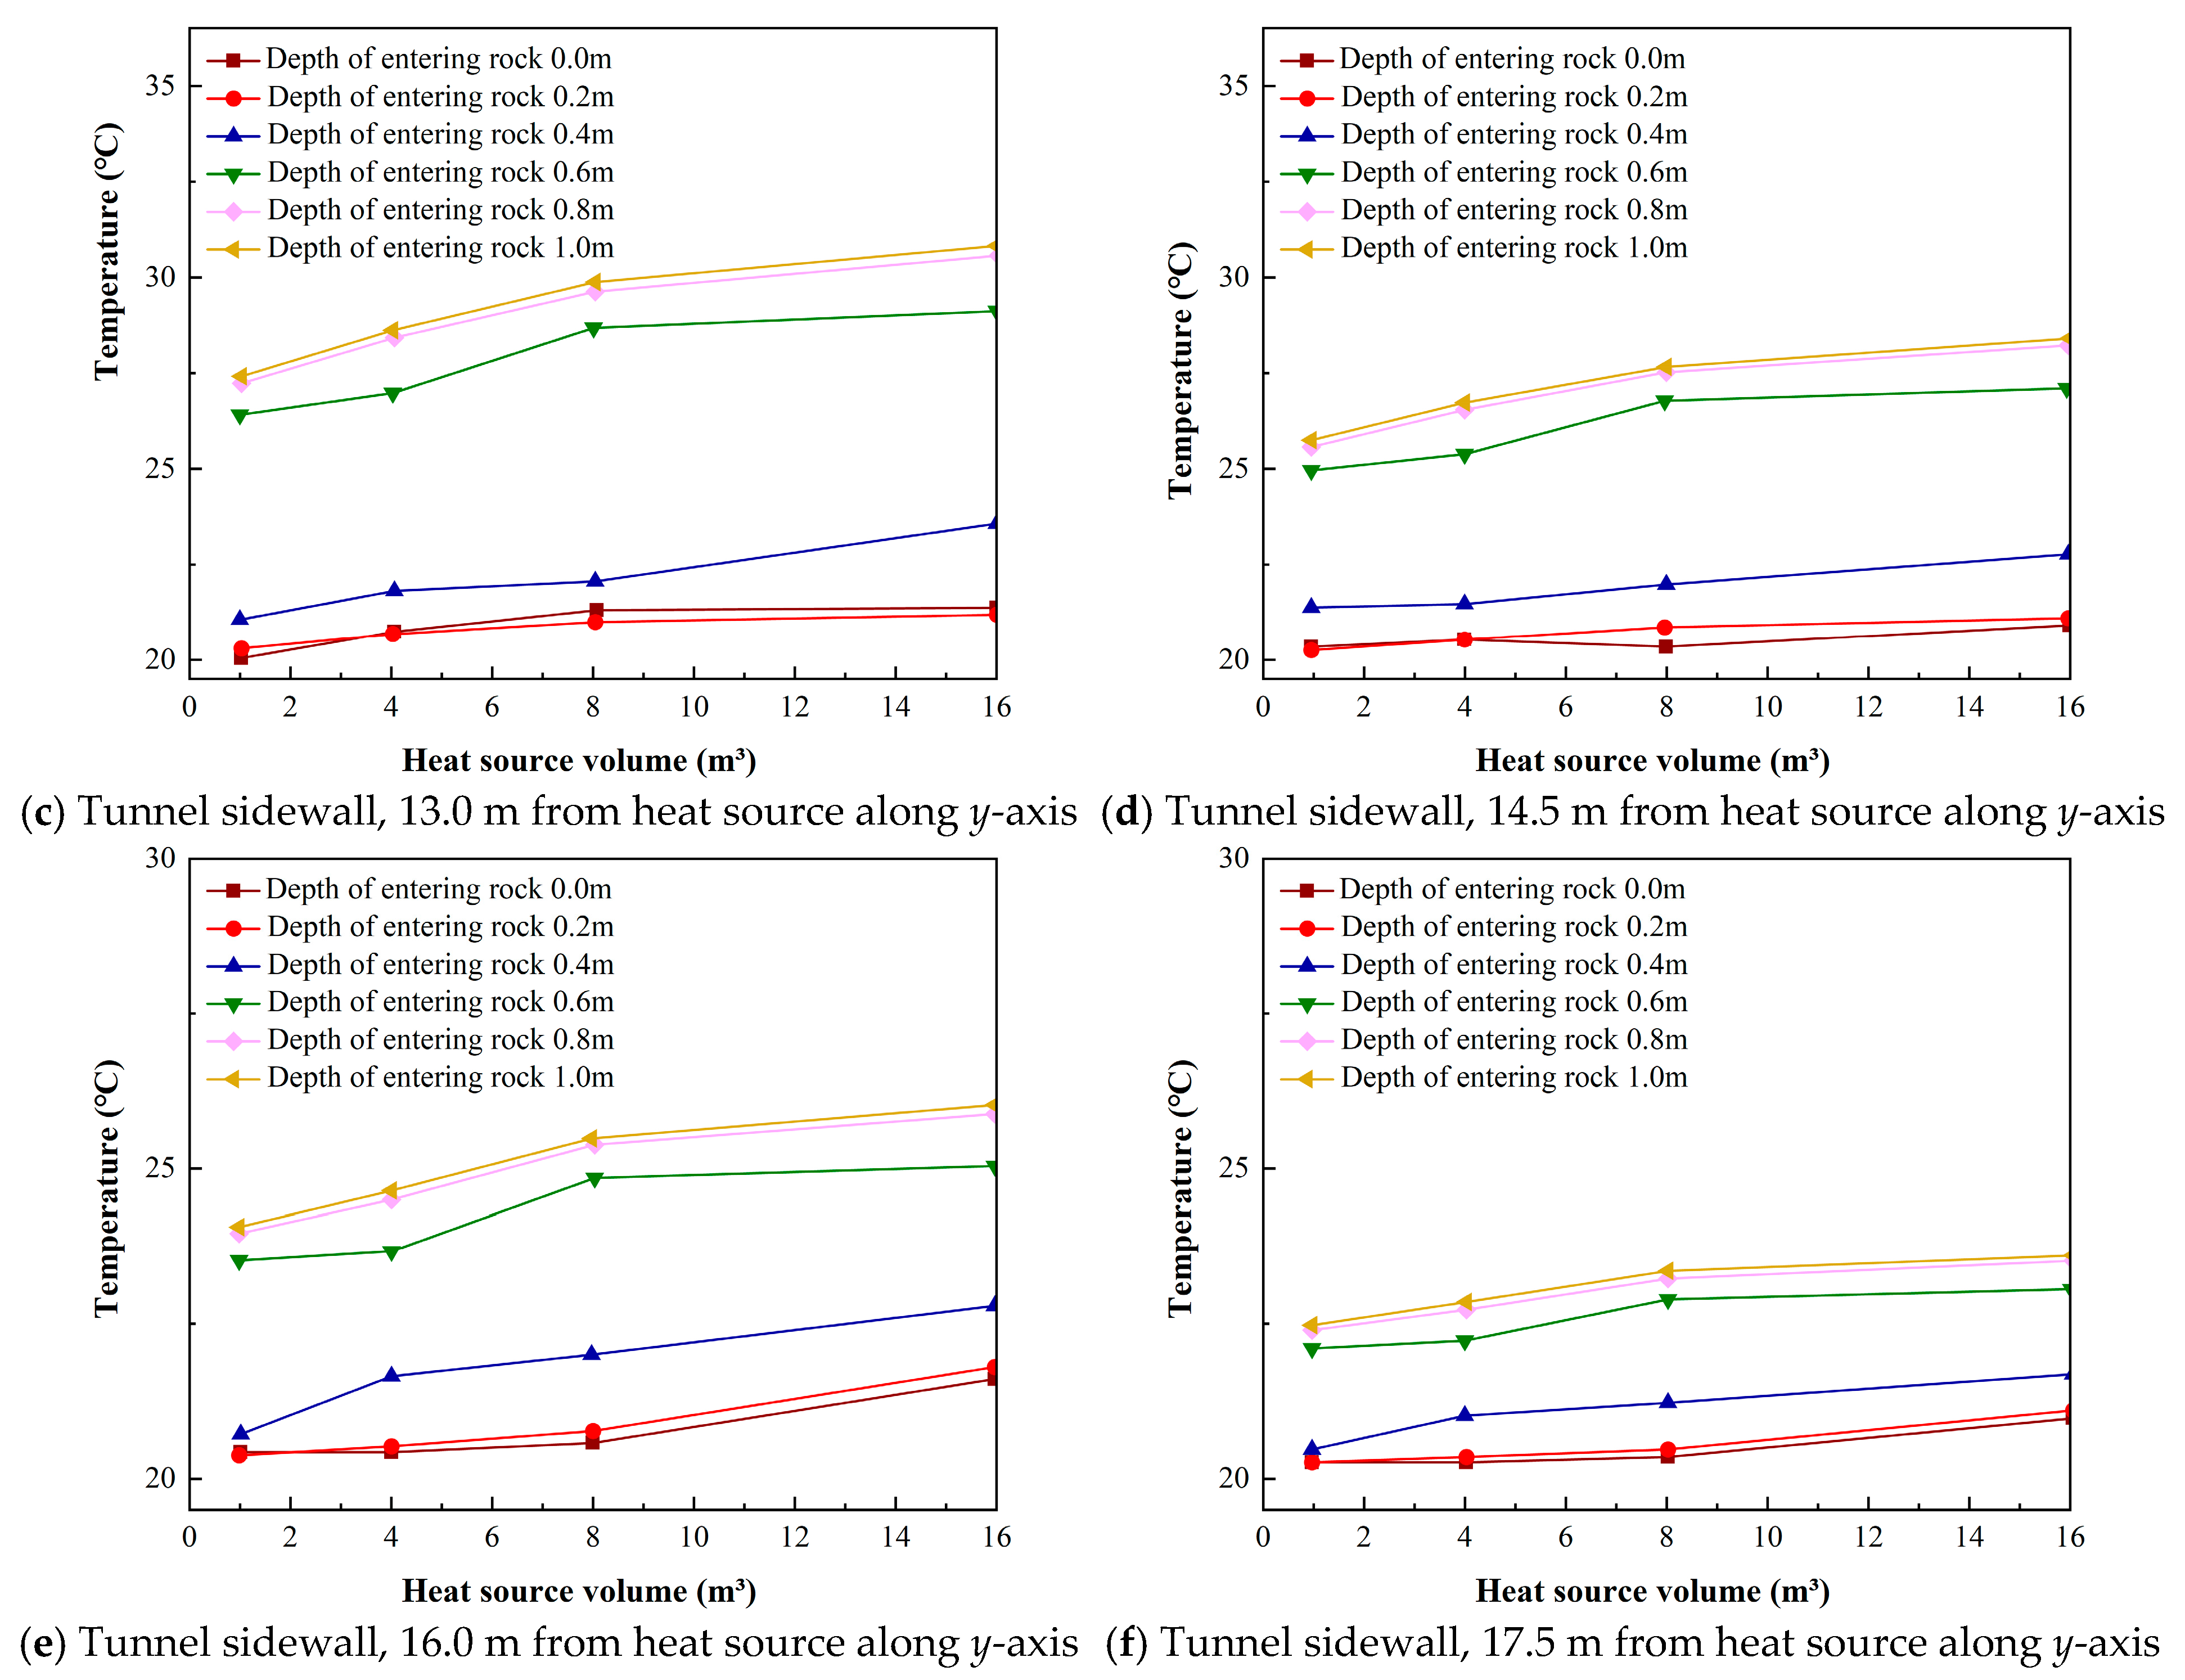
Figure 9 illustrates the variations in the internal temperature field of the surrounding rock under different heat source temperature conditions. It was observed from the figure that under all conditions, the internal temperature of the surrounding rock increased with the rise of the heat source temperature, exhibiting a distinct linear pattern. However, significant differences were noted in the temperature changes at various depths into the rock. Specifically, at a depth of 0.6–1.0 m, the rock temperature increased significantly as the heat source temperature rose. At a depth of 0.2–0.6 m, the temperature increased slightly, with a difference within 3 °C. Conversely, at a depth of 0–0.2 m, the rock temperature remained basically unchanged despite the increase in heat source temperature. Analysis attributed this phenomenon to the dual influence of two competing processes on the internal temperature field: convective heat dissipation caused by tunnel ventilation, and heat conduction resulting from the thermal contact between the internal heat source and the surrounding rock. When the depth was within 0–0.2 m, the rock was located in the surface layer where the effect of convective heat dissipation was dominant, while the heat conduction effect was weak. In this range, the heat dissipated by tunnel ventilation exceeded the heat conducted from the internal source; therefore, the rock temperature was basically unaffected by variations in the heat source temperature. When the depth was within 0.2–0.6 m, the intensities of heat convection and heat conduction were essentially balanced. In this range, the surrounding rock acted as a thermal insulation layer, functioning as a “heat resistance ring” within the rock mass. Finally, when the depth exceeded 0.6 m, the rock was barely affected by convective heat dissipation. As the depth increased (moving closer to the heat source), the heat conduction effect intensified. Consequently, with increasing depth, the sensitivity of the rock temperature to the rise in heat source temperature increased significantly.
(2)
Influence of heat source temperature on the apparent temperature field of surrounding rock
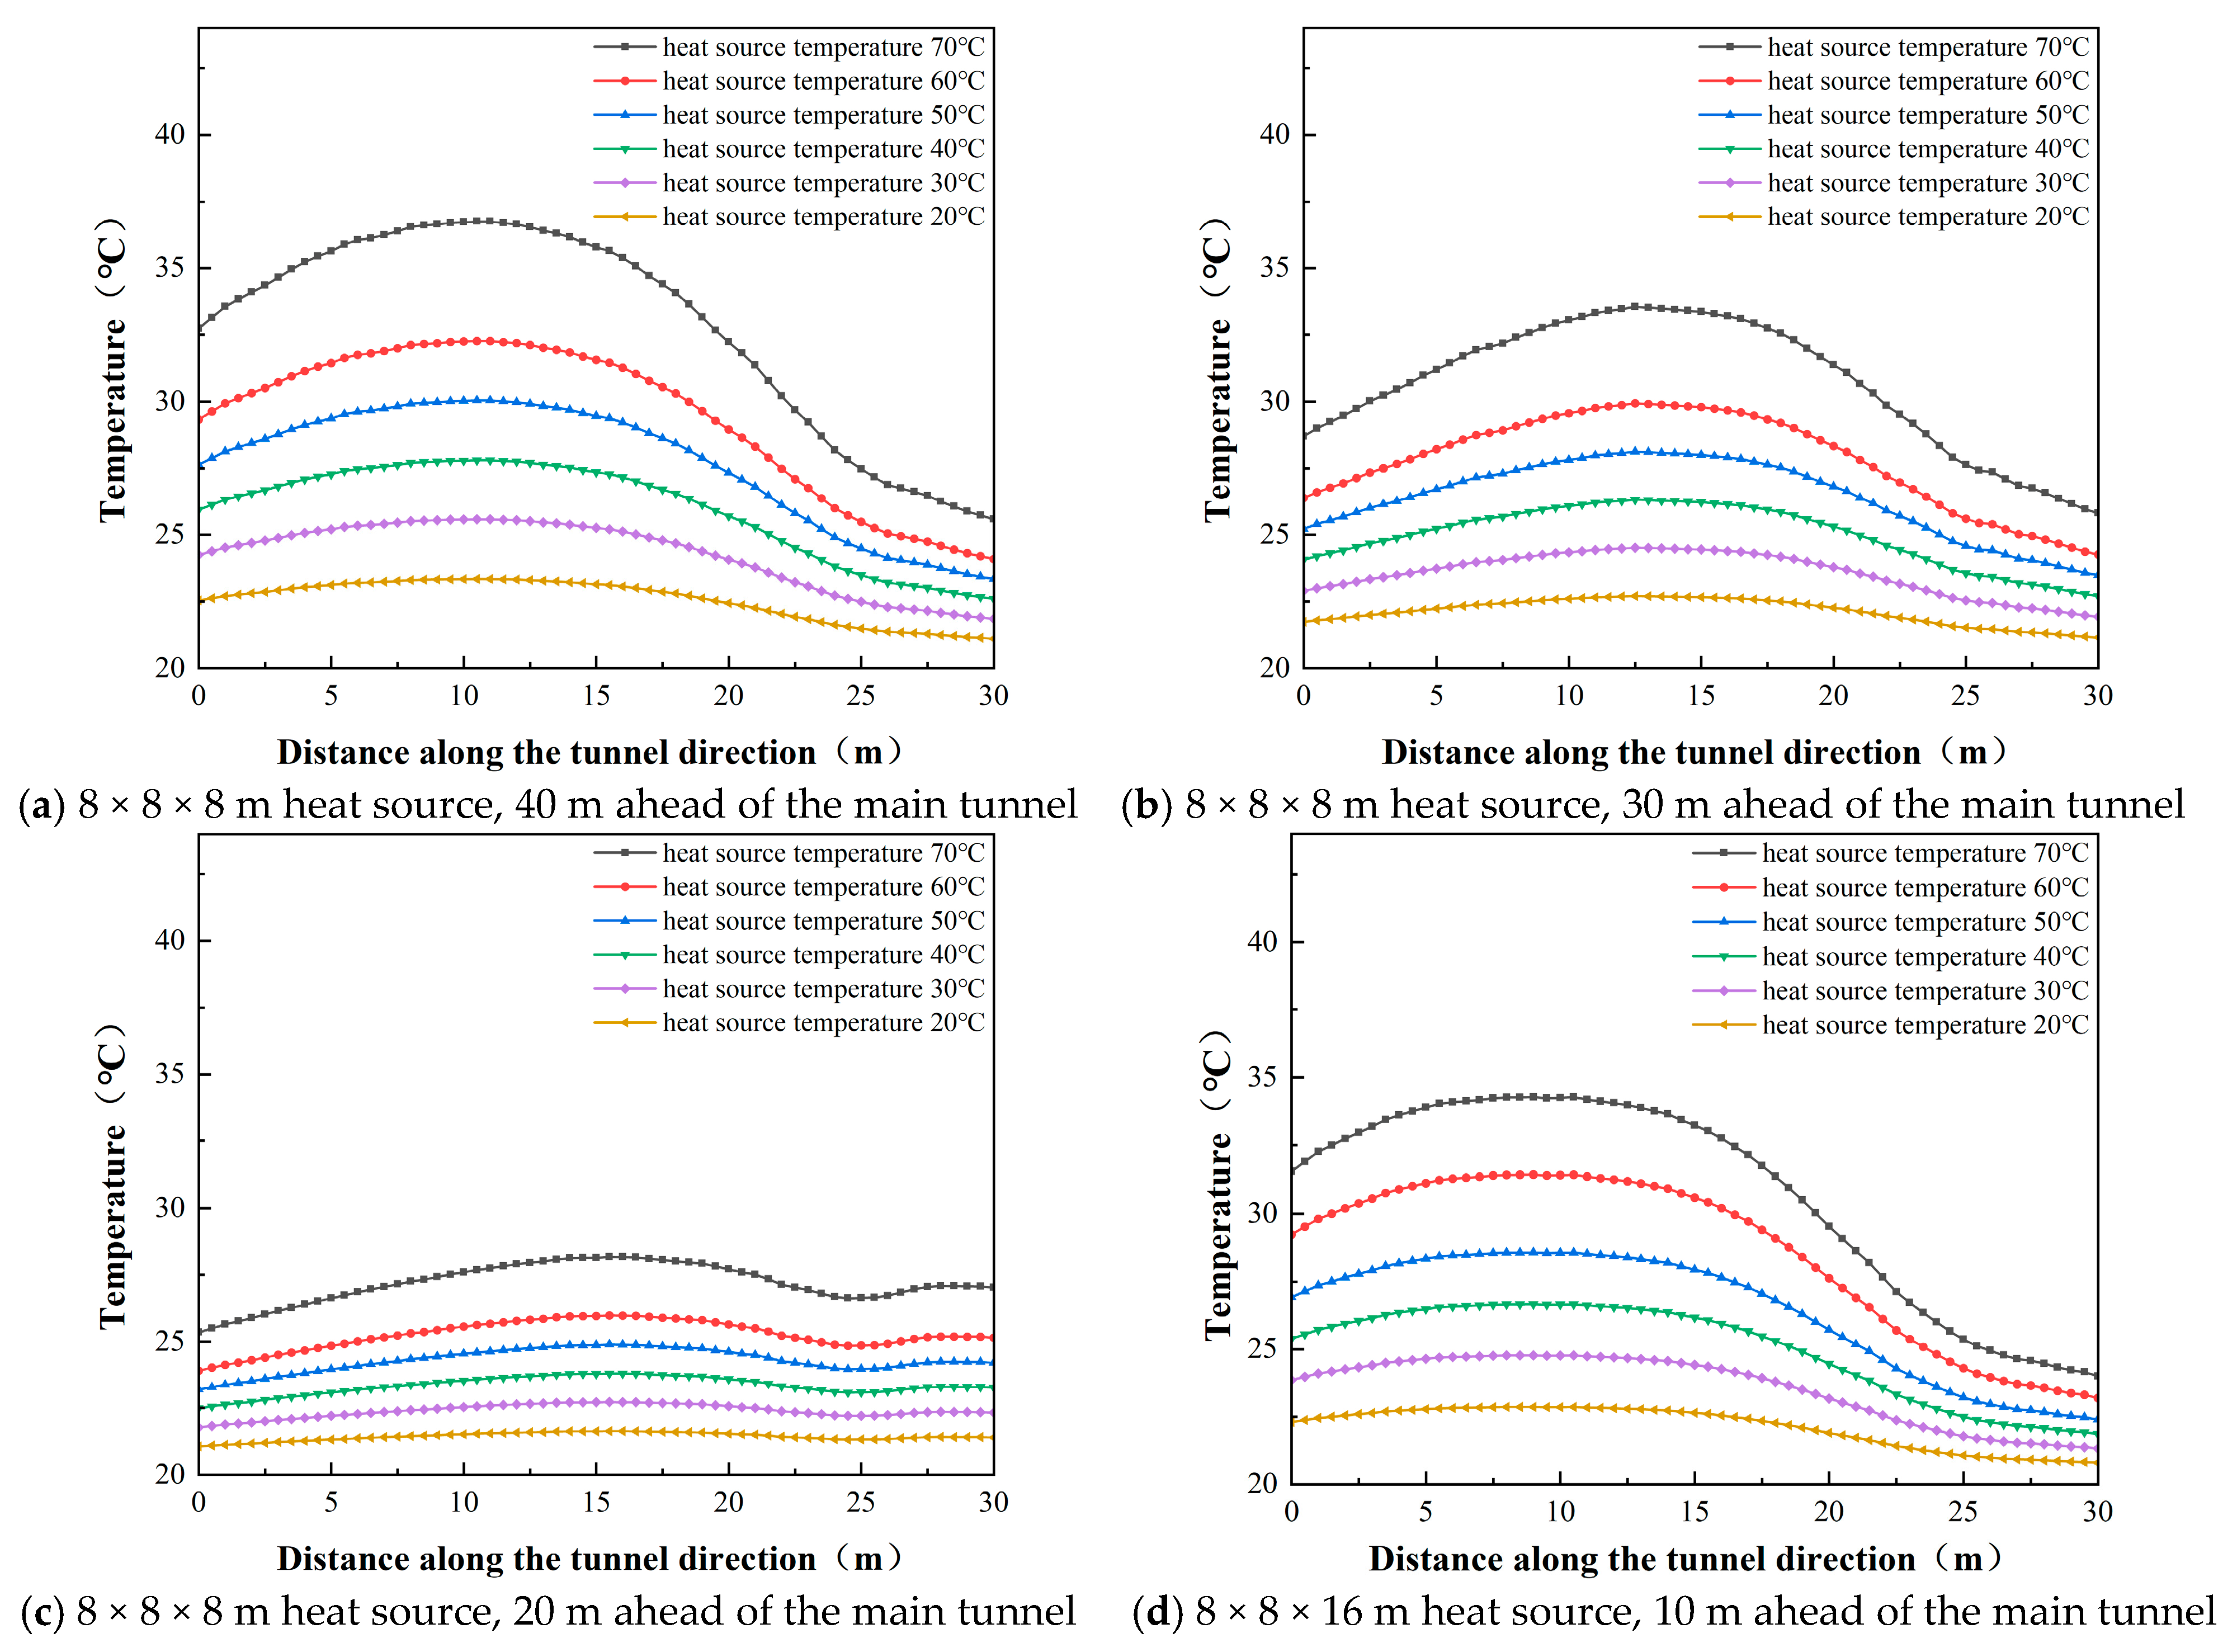
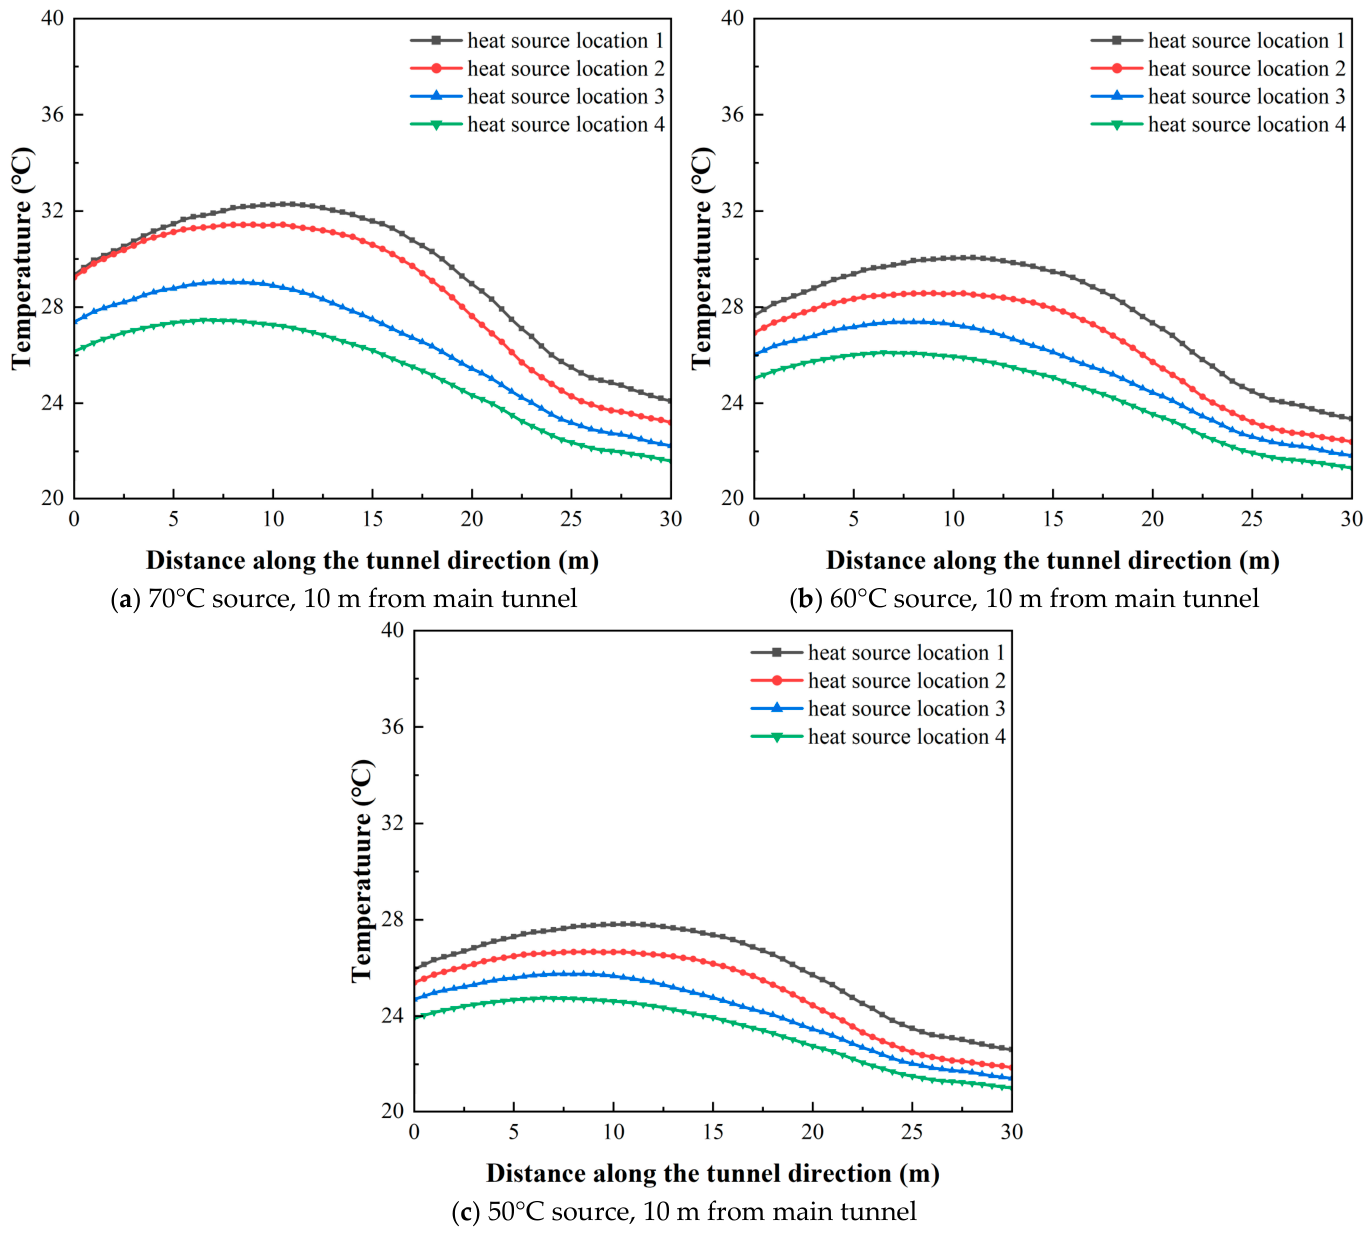
Figure 10 illustrates the variations in the apparent temperature field of the surrounding rock under different heat source temperature conditions. It was observed from the figure that under all conditions, the apparent temperature of the surrounding rock consistently exhibited a non-linear trend of initially increasing and then decreasing. Within the range of 5–10 m from the heat source, the apparent temperature field demonstrated highly regular symmetry. Notably, the higher the heat source temperature, the more pronounced this symmetry appeared. However, beyond the range of 10 m, the temperature symmetry was no longer significant. At the same monitoring point, changes in the heat source temperature exerted a corresponding linear influence on the apparent temperature of the surrounding rock. Taking Figure 10a as an example, at the position of 10 m along the tunnel direction (i.e., the axial center of the heat source), for every 10 °C increase in the heat source temperature, the apparent temperature increased by 3 °C.

5.2. The Influence of Heat Source Size on Temperature Field

(1)
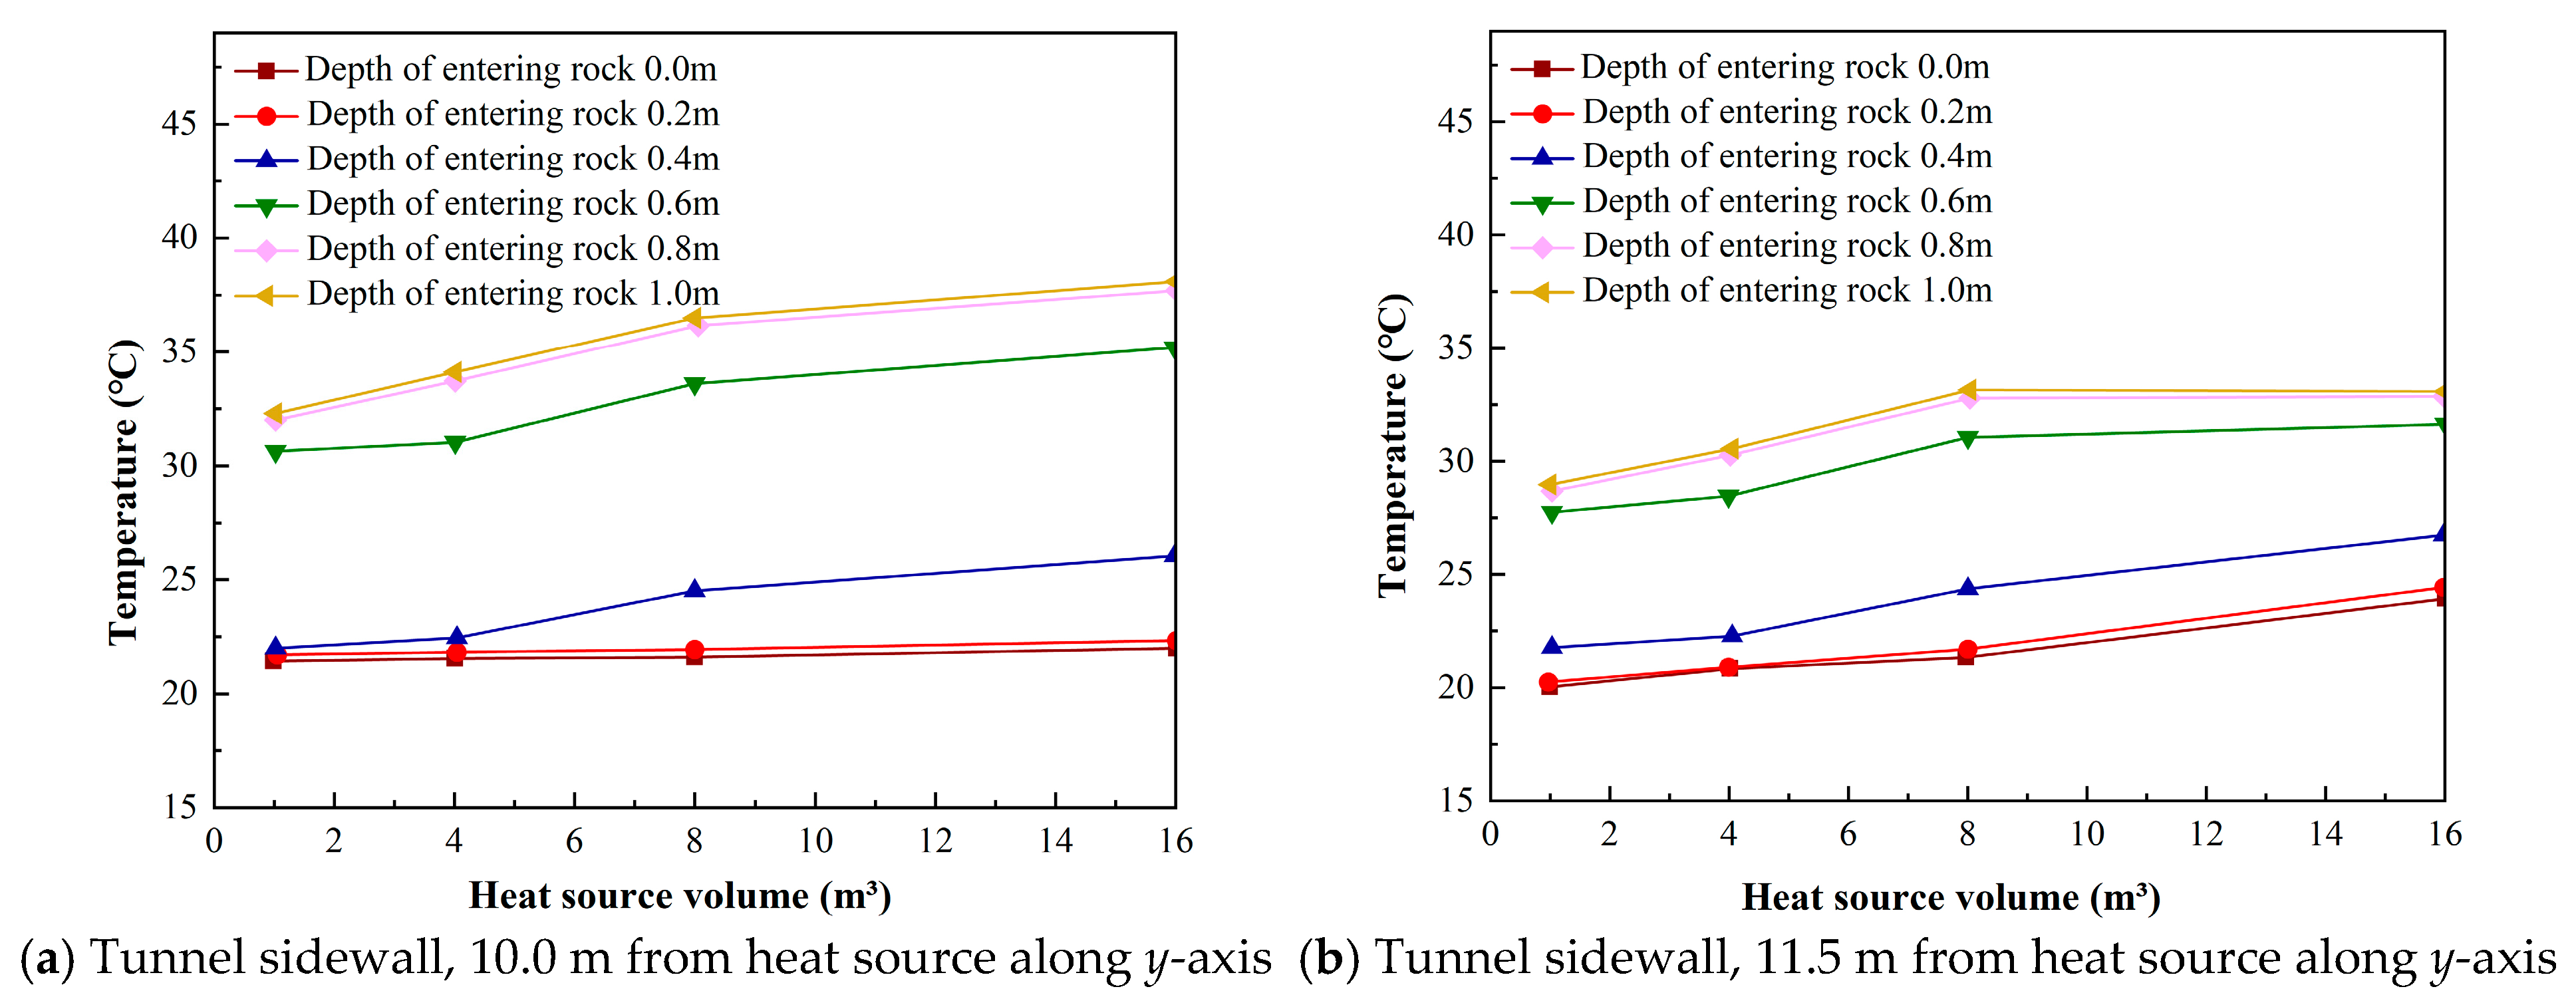
Influence of heat source size on the internal temperature field of surrounding rock
Figure 11 quantitatively defines the geometric saturation effect of the heat source size on the internal temperature field of the surrounding rock. It is observed that while the internal temperature increases with the heat source volume, the growth rate exhibits a distinct multi-stage characteristic. Under the present model conditions, a possible geometric saturation threshold appeared at approximately 8 m3 for this condition. Within the volume range of 0–8 m3, the temperature increase can be approximately described by a linear trend before the saturation threshold with volume, with a thermal contribution gradient of 0.8 °C/m3. Beyond the 8 m3 threshold, the “geometric saturation” phenomenon occurs as the incremental thermal efficiency decelerates to 0.6 °C/m3, representing a 25% decrease in heating efficiency. This deceleration is physically attributed to the diminishing surface-to-volume ratio of larger heat sources and the intrinsic thermal resistance of the rock mass, which constrains the marginal utility of heat diffusion from the source to the distal surrounding rock.
(2)
Influence of heat source size on the apparent temperature field of surrounding rock
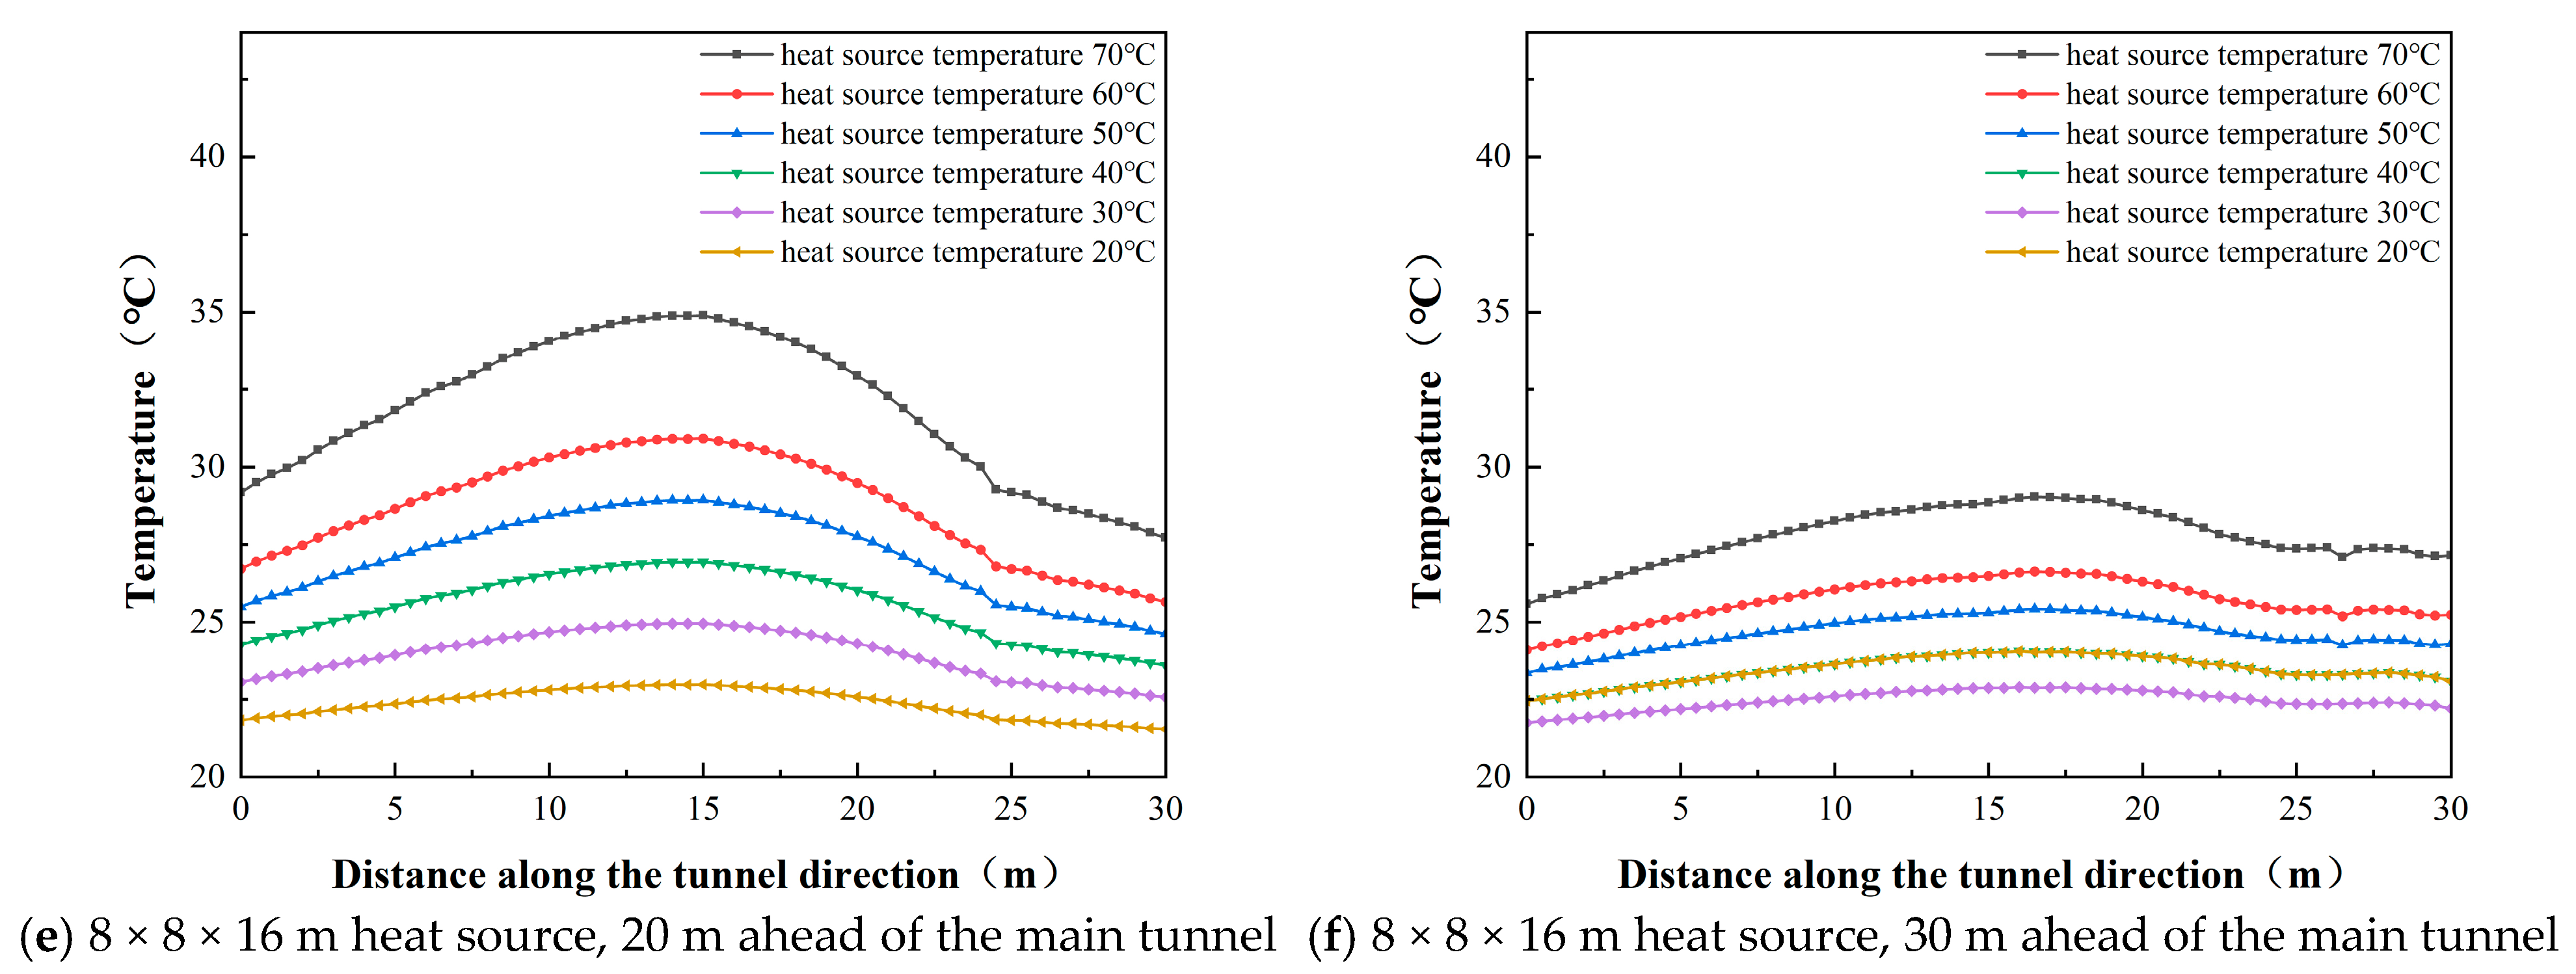
Figure 12 illustrates the variations in the apparent temperature field of the surrounding rock under different heat source size conditions. It was observed from the figure that under all conditions, the apparent temperature of the surrounding rock exhibited a non-linear trend of initially increasing and then decreasing. Moreover, two distinct zones were identified in the curves: a high-temperature zone in the middle of the heat source along the tunnel direction, and cooling zones gradually decreasing towards both sides. A comparison of the curves for different heat source sizes indicated that the size of the heat source significantly influenced the central high-temperature zone. Specifically, at the center of the high-temperature zone, for every doubling of the heat source size, the temperature increased by 1.6 °C, and the affected range of the high-temperature zone extended by 2 m.

5.3. The Influence of Heat Source Location on Temperature Field

1.
Influence of heat source position on the internal temperature field of surrounding rock
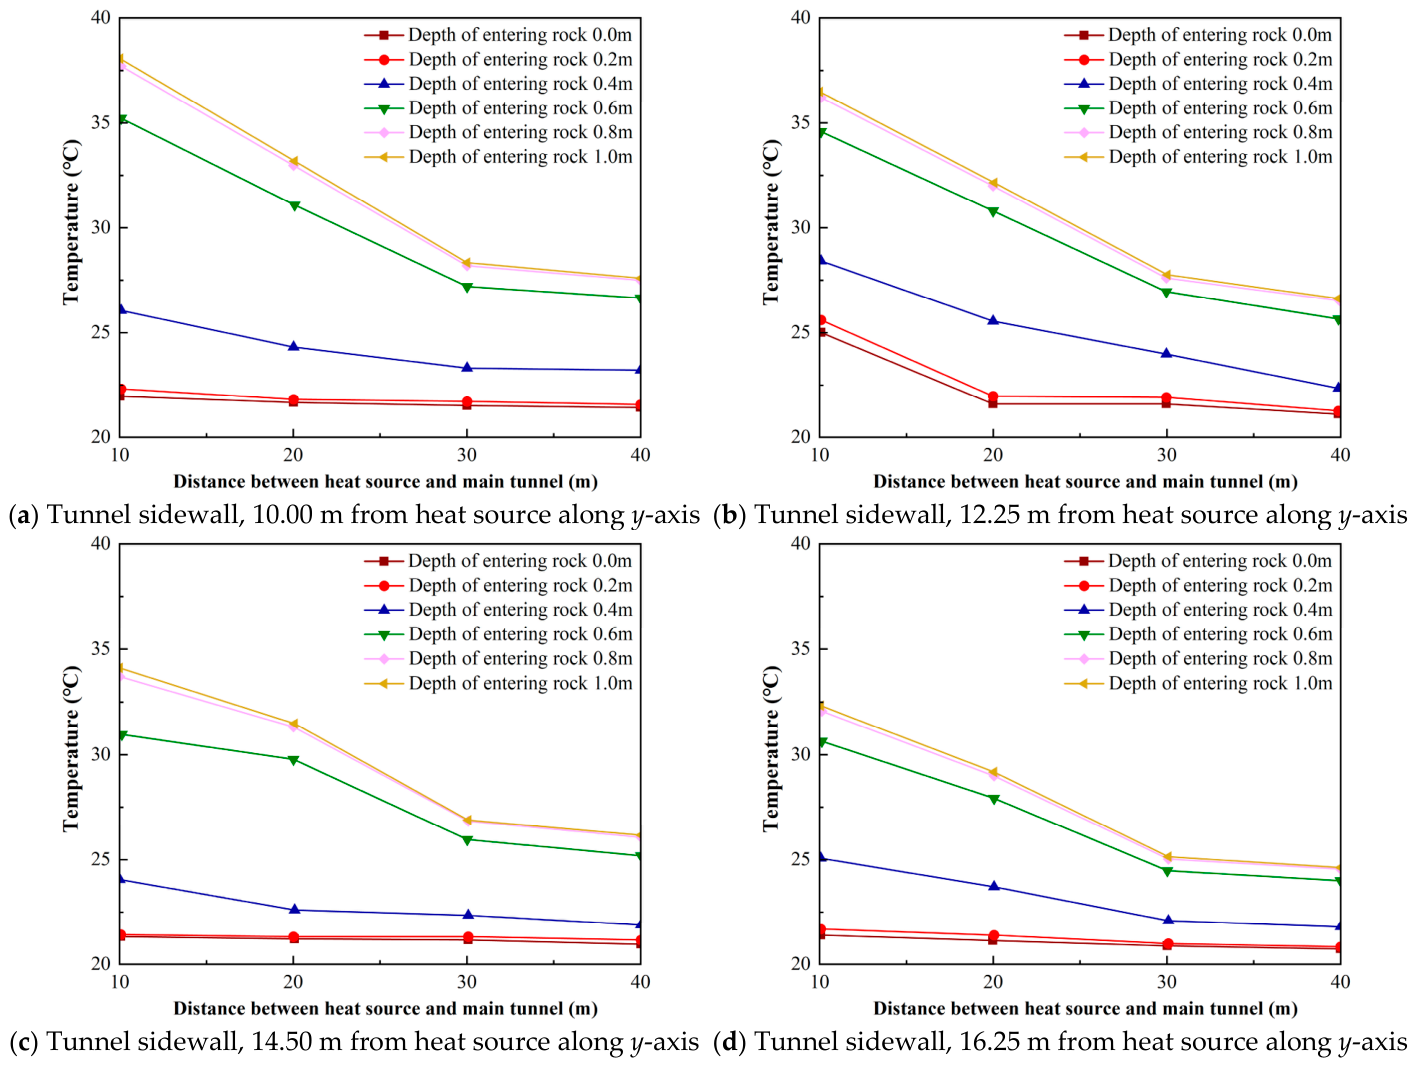
Figure 13 illustrates the variations in the internal temperature field of the surrounding rock under different heat source positions. It was observed from Figure 13 that under all conditions, the internal rock temperature decreased as the distance from the heat source to the main tunnel face increased. The rate of this decrease was initially rapid and then gradually decelerated, with significant temperature disparities observed at different depths into the rock. The temperature variation behaviors differed depending on the distance from the heat source to the main tunnel, which could be roughly categorized into two zones: a “variable temperature zone” and a “stable temperature zone.” Specifically, when the distance from the heat source to the main tunnel was between 10 m and 30 m, the rock temperature decreased with increasing distance. Conversely, when the distance exceeded 30 m, the internal rock temperature remained basically constant as the distance increased.
2.
Influence of heat source position on the apparent temperature field of surrounding rock
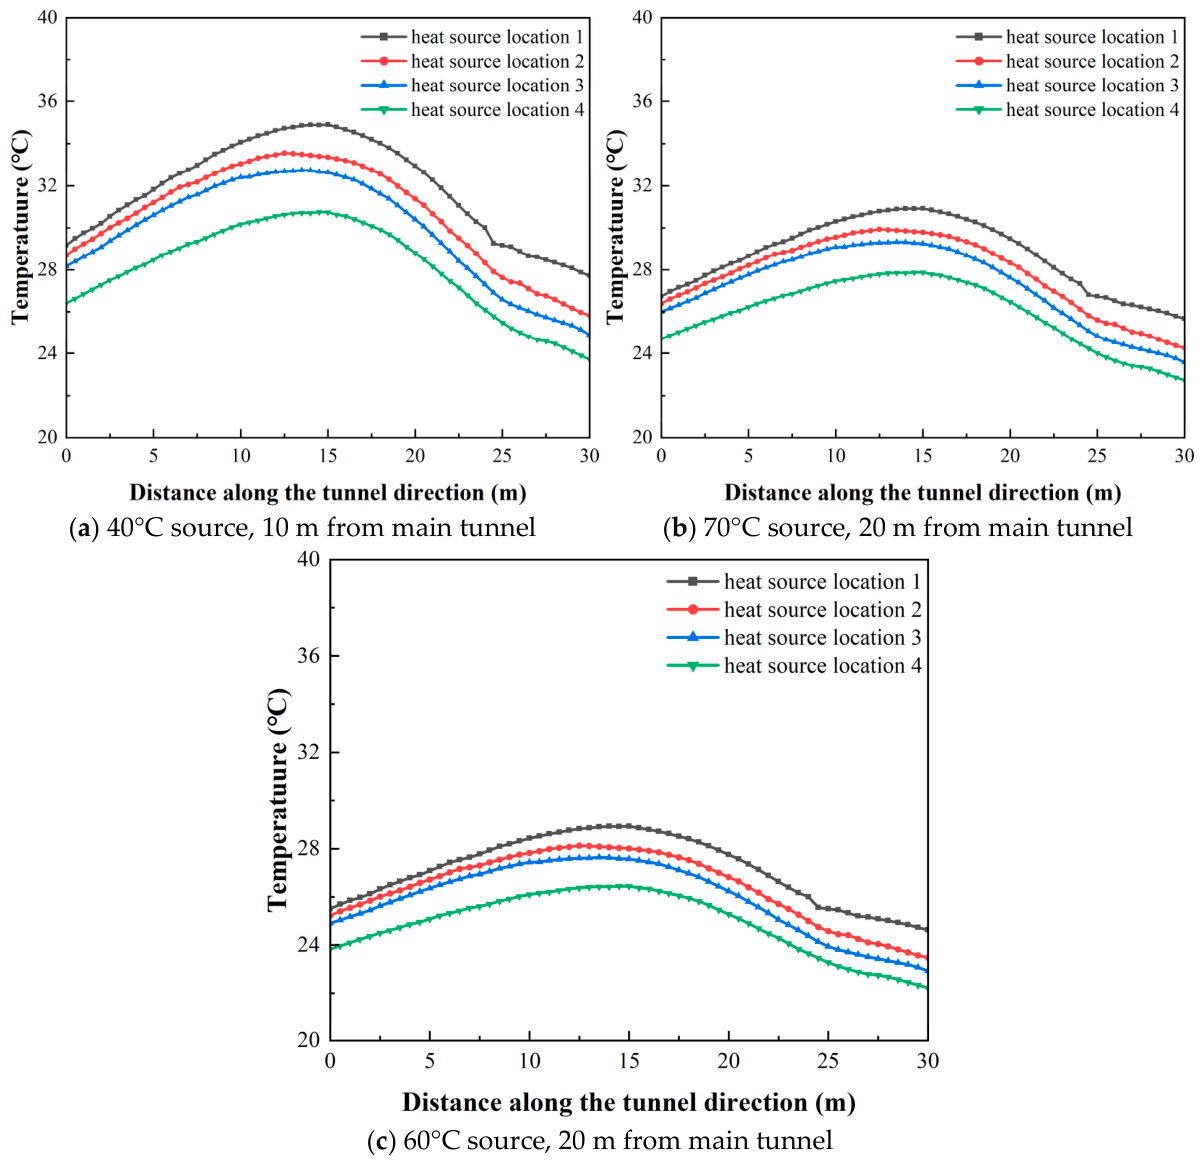
Figure 14 illustrates the variations in the apparent temperature field of the surrounding rock under different heat source positions. It was evident from Figure 14 that the temperature curves consistently exhibited a process of initially increasing, stabilizing, and subsequently decreasing. Consequently, the curves were categorized into three distinct zones: a “heating zone,” a “stable temperature zone,” and a “cooling zone.” The formation of these three zones was attributed to the spatially limited heat conduction capacity of the heat source acting on the surrounding rock surface. Specifically, the heat transfer capability was strong near the source and weak at a distance. Along the tunnel direction, the temperature began to rise as the location approached the heat source and decreased as it moved away. Within the “stable temperature zone,” the effect of heat conduction from the source was dominant, while the convective heat dissipation inside the tunnel was relatively weak. As a result, a zone of stable high temperature was maintained along the tunnel. The length of this stable zone was typically 1–2 m longer than the length of the heat source itself. As the distance along the tunnel increased further, the heat conduction capacity of the source weakened, and the convective cooling effect strengthened. Under basically constant environmental conditions, the “heating zone” and the “cooling zone” maintained a substantially symmetrical relationship in the curves.

5.4. Engineering Implications and Comparison with Other Cooling Strategies

The above results indicate that conventional ventilation can effectively reduce the temperature of the tunnel wall and the shallow surrounding rock, but its cooling effect on the deep surrounding rock is limited under the present heat-source and ventilation conditions. In this study, the cooling response was mainly concentrated within approximately 0.35 m from the tunnel boundary, while the temperature decrease in the deeper heat-accumulation zone was relatively weak. Therefore, the present results should not be interpreted as proving that ventilation is ineffective under all engineering conditions. Rather, they indicate that conventional ventilation alone may be insufficient to rapidly cool deep surrounding rock when a persistent localized geothermal heat source exists.
To further clarify the engineering significance of the present results, conventional ventilation is compared with several commonly used or potential thermal-control methods, as summarized in Table 7. It should be noted that these methods were not experimentally evaluated in this study. The comparison is intended to define the applicable scope of ventilation cooling and to provide a basis for selecting combined thermal-control strategies in high-rock-temperature tunnels.
Overall, ventilation remains an economical and convenient cooling method for tunnel construction, especially for improving the thermal environment near the excavation surface and tunnel wall. However, for tunnels affected by strong and persistent geothermal anomalies, ventilation should be regarded as a basic cooling measure rather than a complete solution. Combined strategies, such as ventilation with spray cooling for short-term construction safety, ventilation with insulation layers for reducing heat inflow, or ventilation with active heat-extraction and thermal-control grouting for long-term heat regulation, may provide more effective control of high-rock-temperature hazards.

6. Results

Through model tests on the spatiotemporal distribution of the internal temperature field of surrounding rock under high rock temperature conditions, combined with numerical models under various operating conditions, this study investigated the influence of different heat source temperatures, sizes, and positions. Furthermore, the temperature variation patterns within and on the surface of the surrounding rock were analyzed. Based on the simulation and experimental results, the following conclusions are drawn:
(1)
Under the influence of a localized geological heat source, the temperature field of the surrounding rock exhibited distinct spatial zoning characteristics. In the near-field region within approximately 0.335 m from the heat source, the temperature was directly controlled by the heat source and remained relatively stable, with a fluctuation of less than 2 °C. Beyond this near-field region, the temperature decreased with increasing distance and could be approximately described by a linear attenuation trend within the tested range. The attenuation gradient was 8.96 °C/m at the model scale, corresponding to approximately 0.69 °C/m at the prototype scale. Considering the limited number of monitoring points, this relationship should be regarded as an empirical approximation under the present test conditions rather than a universal heat-transfer law.
(2)
The size of the heat source showed a clear geometric saturation effect on the surrounding rock temperature field. Under the present model conditions, a possible saturation threshold appeared at approximately 8 m3. When the heat-source volume was smaller than this threshold, the internal temperature of the surrounding rock increased more obviously with heat-source volume, with a thermal contribution gradient of approximately 0.8 °C/m3. After the heat-source volume exceeded 8 m3, the incremental thermal contribution decreased to approximately 0.6 °C/m3, corresponding to a reduction of about 25%. This indicates that the temperature contribution of the heat source does not increase indefinitely with volume, but is constrained by the surface-to-volume ratio of the heat source and the thermal resistance of the surrounding rock.
(3)
Within the investigated parameter range, the temperature and thermal influence range of the surrounding rock generally increased with increasing heat-source temperature and heat-source size. The fitted curves showed near-linear or approximately linear trends under the present numerical conditions. However, these relationships should be interpreted as empirical trends within the tested range, rather than strict statistical laws. The heat-source position mainly affected the local temperature level of the surrounding rock, whereas its influence on the overall thermal influence range was relatively limited under the simulated conditions.
(4)
Under the present ventilation velocity, model geometry, and heat-source conditions, the cooling effect of conventional ventilation was mainly concentrated within approximately 0.35 m from the tunnel boundary. The deep surrounding rock showed a much weaker cooling response, indicating that ventilation alone may be insufficient for rapidly dissipating heat accumulated in deep rock masses under persistent localized geothermal conditions. Therefore, in severe high-rock-temperature tunnels, conventional ventilation may need to be combined with thermal insulation layers, active heat-extraction systems, or thermal-control grouting to improve long-term heat-hazard control.

Author Contributions

Q.X. was responsible for the overall logical conception and structural design of the article. X.L. performed the physical model tests, conducted the numerical simulations, and wrote the initial draft of the manuscript. J.W. was in charge of the investigation and prediction of high rock temperature (HRT) geothermal field characteristics. Y.G. focused on the accuracy verification of the numerical simulation model. J.L. contributed to the construction of the theoretical framework and the refinement of the study’s conclusions. All authors have read and agreed to the published version of the manuscript.

Funding

This work was supported by the Young Scientists Fund of the National Natural Science Foundation of China [52308406] and the Taishan Scholars Program [tstp.20221153].

Informed Consent Statement

Informed consent was obtained from all subjects involved in the study.

Data Availability Statement

The data supporting the findings of this study are available from the corresponding author upon reasonable request.

Conflicts of Interest

The authors declare no conflicts of interest.

References

  1. Wen, T.; Hu, Z.; Wang, Y.; Tang, R. Genetic Mechanism of High Geotemperature in Tunnels in Consideration of Temperature Monitoring and Hydrogeochemical Analysis. Environ. Sci. Pollut. Res. 2023, 30, 85373–85389. [Google Scholar] [CrossRef]
  2. Wang, C.; Liu, Z.; Zhang, F.; Guo, Q.; Dong, Z.; Bai, P. Heat Hazards in High-Temperature Tunnels: Influencing Factors, Disaster Forms, the Geogenetic Model and a Case Study of a Tunnel in Southwest China. Sustainability 2024, 16, 1044. [Google Scholar] [CrossRef]
  3. Zhao, Y.; Zhu, T.; Yu, L.; Lu, M. Construction Technology for Deep Tunnels Crossing Superhigh-Temperature Fault Zones with High Water Surges. Front. Struct. Civ. Eng. 2024, 18, 1267–1280. [Google Scholar] [CrossRef]
  4. Guo, J.; Li, A.; Ma, Y.; Che, J.; Li, J.; Niu, S.; Deng, L.; Wang, D.; Che, L. A Theoretical and Applied Convective Heat Transfer Model for Deep-Buried Underground Tunnels with Non-Constant Wall Temperature. Energy Build. 2023, 294, 113210. [Google Scholar] [CrossRef]
  5. Han, T.; Zhou, Y.; Liu, H.; Gao, P. Analytical Solutions for Three-Dimensional Heat Transfer Induced by Tunnel Lining Heat Exchangers in Energy Tunnels. Tunn. Undergr. Space Technol. 2026, 170, 107333. [Google Scholar] [CrossRef]
  6. Wang, C.; Jiang, J.; Bouazza, A.; Kong, G.; Ding, X. A New Model and Analytical Solution for Heat Transfer in the Heating Section of Energy Tunnels Considering the Insulation Layer. Tunn. Undergr. Space Technol. 2025, 162, 106651. [Google Scholar] [CrossRef]
  7. Zhao, P.; Li, X.; Zhang, D.; Xu, W.; Liu, J.; Wu, W.; Deng, L. A Simplified Method to Determine the Comprehensive Heat Transfer Quantity in Subway Tunnels. Energy Build. 2021, 247, 111090. [Google Scholar] [CrossRef]
  8. Narayana, G.; Selvaraj, S. Transient Heat Transfer Measurements on Pulsating and Oscillating Flows in a Shock Tunnel. Aerosp. Sci. Technol. 2020, 104, 105879. [Google Scholar] [CrossRef]
  9. Liu, X.; Xu, L.; Zhou, X.; Wang, Y.; Zeng, Y.; Chen, X. Investigation of Nonlinear Heat Transfer Mechanisms in High Geotemperature Tunnels Considering Construction Hydration Heat Effects. Therm. Sci. Eng. Prog. 2025, 63, 103737. [Google Scholar] [CrossRef]
  10. Chen, Q.; Chen, S.; Zhang, H.; Ran, G.; Zhang, F.; Yang, H. Augmentation of Tunnel-Air Convective Heat Transfer Forced by Duct Ventilation in a Geothermal Construction Tunnel. Build. Environ. 2021, 205, 108219. [Google Scholar] [CrossRef]
  11. Luo, M.-R.; Tao, Y.-C.; Yuan, Z.-B.; Tao, L.-L.; He, C.; Yuan, Y.-P.; Tian, X.-Y.; Zeng, Y.-H. Effect of Tunnel Ventilation on Surrounding Rock Temperature Field and Heat Regulating Circle during Construction Phase. Tunn. Undergr. Space Technol. 2024, 150, 105835. [Google Scholar] [CrossRef]
  12. Zhang, G.; Jiang, Z.; Chen, J.; Chen, J.; Yang, B. Study of the Convection Heat Transfer Law and Temperature Prediction of the Duct in High-Temperature Tunnels. Case Stud. Therm. Eng. 2022, 36, 102208. [Google Scholar] [CrossRef]
  13. Liu, C.; Li, P.; Wang, X.; Yu, H.; Lyu, M.; Wu, H.; Guo, Z. Thermal Environment Analysis for the Deep-Buried TBM Construction Tunnel Considering the Influences of Surrounding Rock Heat Transfer and Ventilation System. Therm. Sci. Eng. Prog. 2024, 48, 102406. [Google Scholar] [CrossRef]
  14. Zhang, G.; Jiang, Z.; Chen, Y.; Yang, B.; Peng, Y.; Si, M.; Chen, J.; Wang, M.; Yang, X. Influence of Spray Parameters and Thermal Environments under Convection Heat Transfer on the Application of Spray Cooling Technology in Deep-Buried High-Temperature Building Tunnel. Energy Build. 2023, 301, 113730. [Google Scholar] [CrossRef]
  15. Koci, J.; Navara, T.; Madera, J.; Trush, A.; Cacciotti, R.; Pospisil, S.; Cerny, R. Analysis of the Effect of Relative Humidity on the Convective Heat Transfer Coefficient Using Full-Scale Experiments in a Climatic Wind Tunnel. Energies 2025, 18, 810. [Google Scholar] [CrossRef]
  16. Ma, Q.; Hou, J.; Lai, Y.; Luo, X.; Jiang, W.; Chen, H. Influence of Piston Wind Induced by High-Speed Trains on the Temperature Field of a Tunnel in Cold Regions. Acta Geotech. 2025, 20, 3725–3743. [Google Scholar] [CrossRef]
  17. Cui, H.; Ding, C.; Xia, C.; Peng, P.; Bao, X.; Chen, X. Effects of Mechanical Ventilation and Heat Exchange Pipe System on Heat Transfer Efficiency in High Geothermal Tunnel. Tunn. Undergr. Space Technol. 2025, 164, 106815. [Google Scholar] [CrossRef]
  18. Wang, Y.; Zhou, G.; Liu, J.; Wang, F.; Qiao, G.; Xiao, W. Experimental Investigation on Heat Transfer Performance and Thermal Stress of Segment Lining in a Heating Power Energy Tunnel. Tunn. Undergr. Space Technol. 2025, 161, 106544. [Google Scholar] [CrossRef]
  19. Moradi, I.; Karimipour, A.; Afrand, M.; Li, Z.; Bach, Q.-V. Three-Dimensional Numerical Simulation of External Fluid Flow and Heat Transfer of a Heat Exchanger in a Wind Tunnel Using Porous Media Model. J. Therm. Anal. Calorim. 2020, 141, 1647–1667. [Google Scholar] [CrossRef]
  20. Yang, Z.; Tao, M.; Fei, W.; Yin, T.; Ranjith, P.G. Grain-Based Coupled Thermo-Mechanical Modeling for Stressed Heterogeneous Granite under Thermal Shock. Undergr. Space 2025, 20, 174–196. [Google Scholar] [CrossRef]
  21. Jiang, H.; Zhang, J.; Wei, G.; Yu, T. Experimental Study of Strength Degradation in Fractured Surrounding Rock of Deep High-Temperature Tunnels. Sci. Rep. 2025, 15, 28704. [Google Scholar] [CrossRef]
  22. Liu, T.; Zhang, C.; Li, W.; Tu, S.; Wang, L.; Jin, Z. Face Failure Mechanism of Fault Tunnels under High-Temperature and High-Pressure Conditions Using the Discrete Element Method. Comput. Geotech. 2025, 179, 107059. [Google Scholar] [CrossRef]
  23. Foraboschi, P. Analytical determination of the pressure exerted by a swelling clay soil on a tunnel. Acta Geotech. 2026, 21, 2023–2047. [Google Scholar] [CrossRef]
  24. Wang, M.; Tong, J.; Liu, D.; Yu, L.; Zhang, C. Classification of Support Structure Systems for High Geothermal Railway Tunnels. China Civ. Eng. J. 2015, 48, 119–125. [Google Scholar] [CrossRef]
  25. Wang, M.; Tang, X.; Wu, Q.; Tong, J.; Dong, C. Evolution Law of Temperature Field in Surrounding Rock-Support Structure of High Geotemperature Tunnels. J. China Railw. Soc. 2016, 38, 126–131. [Google Scholar]
  26. Wang, M.; Hu, Y.; Liu, D.; Jiang, C.; Wang, Q.; Wang, Y. A Study on the Heat Transfer of Surrounding Rock-Supporting Structures in High-Geothermal Tunnels. Appl. Sci. 2020, 10, 2307. [Google Scholar] [CrossRef]
  27. Ren, W.R.; Wang, C.H.; Han, C.B.; Han, D.; Zheng, J.Y.; Cui, Y.N.; Song, X.M.; Jiang, Q.; Yan, H. Cement-Based External Wall Insulation Material with Thermal Performance Improvement by Partial Substitution of Calcium Silicate. Energy Build. 2024, 317, 114415. [Google Scholar] [CrossRef]
  28. Bakatovich, A.; Gaspar, F.; Boltrushevich, N. Thermal Insulation Material Based on Reed and Straw Fibres Bonded with Sodium Silicate and Rosin. Constr. Build. Mater. 2022, 352, 129055. [Google Scholar] [CrossRef]
  29. Zhang, X.; Huang, D.; He, S.; Kong, Z.; Yang, J.; Yang, X.; Chen, Z. A Novel Thermal Insulation Material with Excellent Mechanical Properties: Carbon Fiber-Modified Aerogel /Cement-Based Composite Material. J. Build. Eng. 2024, 94, 109957. [Google Scholar] [CrossRef]
  30. Zhang, Y.; Liu, W.; Xu, Y.; Wang, S.; Zheng, H.; Li, J.; Zhou, Q. High Efficiency Thermal Insulation Material Based on Boron Hybrid Silicone Rubber and Hollow Microspheres. J. Mater. Sci. 2025, 60, 1964–1981. [Google Scholar] [CrossRef]
  31. Kang, F.; Li, Y.; Tang, C. Numerical Study on Airflow Temperature Field in a High-Temperature Tunnel with Insulation Layer. Appl. Therm. Eng. 2020, 179, 115654. [Google Scholar] [CrossRef]
Figure 1. Multi-scenario tunnel temperature model test device.
Civileng 07 00036 g001
Figure 2. Sensor embedding method.
Civileng 07 00036 g002
Figure 3. Numerical calculation boundary conditions.
Civileng 07 00036 g003
Figure 4. Comparison diagram of numerical simulation temperature and model test temperature.
Civileng 07 00036 g004
Figure 5. Spatial temperature distribution curve. (a) Longitudinal temperature; (b) horizontal temperature.
Civileng 07 00036 g005
Figure 6. Temperature evolution curves of surrounding rock ahead of the main tunnel face.
Civileng 07 00036 g006
Figure 7. Temperature evolution curves of surrounding rock in the lateral direction of the main tunnel. (a) 0.335 m from the heat source; (b) 0.67 m from the heat source; (c) 1.34 m from the heat source.
Civileng 07 00036 g007
Figure 8. Temperature evolution curves of surrounding rock at the pilot tunnel sidewall.
Civileng 07 00036 g008
Figure 9. The curve representing the variation in internal temperature of surrounding rock with the temperature of the heat source.
Civileng 07 00036 g009
Figure 10. The curve showing the variation in the apparent temperature of the surrounding rock with the temperature of the heat source.
Civileng 07 00036 g010aCivileng 07 00036 g010b
Figure 11. Variation curve of internal temperature of surrounding rock with heat source size.
Civileng 07 00036 g011aCivileng 07 00036 g011b
Figure 12. Variation curve of apparent temperature of surrounding rock with heat source size.
Civileng 07 00036 g012
Figure 13. The curve of temperature variation within the surrounding rock as a function of the heat source position.
Civileng 07 00036 g013
Figure 14. Variation curve of apparent temperature of surrounding rock with heat source position.
Civileng 07 00036 g014
Table 1. Summary of model similarity ratios.
Physical QuantitySymbolScale FactorBasisRemarks
lengthCl13design constraintsbased on site and materials
velocityCv 13 C ν = c l Archimedes criterion
timeCr169 C r = C l 2 C a Fourier criterion
pressureCh13 C p = C ρ C ν 2 compressibility neglected
thermal conductivityCp1same material used
specific heatCa1same material used
heat transfer coeffCr1 C α = C λ C l Nusselt criterion
temperatureCt1 T p = T n
Table 2. Proportion of surrounding rock materials.
MaterialWaterLimeGravelSandy SoilSand
Similarity ratio (%)7.54.312.94332.3
Table 3. Thermophysical Parameters of Surrounding Rock.
ParameterPrototypeModel
thermal conductivity2.474 (W/m·k)1.551 (W/m·k)
thermal diffusivity0.114 (m2/d)0.098 (m2/d)
Table 4. Physical parameters of surrounding rock.
ParameterValue
thermal conductivity1.551 W/(m·K)
density1984 kg/m3
specific heat800 J/(kg·K)
Table 5. Fluid Physical Parameters.
ParameterValue
thermal conductivity0.026 W/(m·K)
density1.29 kg/m3
specific heat1.007 J/(kg·K)
dynamic viscosity17.9 × 10−6 Pa·s
coefficient of thermal expansion3400 × 10−6 (1/K)
average molar mass0.02897 kg/mol
specific heat ratio1.4
Table 6. Numerical calculation scenarios.
Heat Source Temperature (°C)Heat Source Dimensions (m)Longitudinal Position of Heat Source
(m)
Transverse Position of Heat Source
(m)
958 × 8 × 161010
758 × 8 × 82020
658 × 8 × 43030
554 × 4 × 44040
452 × 2 × 25050
35×××
Table 7. Comparison of conventional ventilation and other thermal-control methods.
MethodMain MechanismEffective ZoneRelevance to This Study
Conventional ventilationconvective heat exchange between airflow and tunnel wallmainly shallow surrounding rockdirectly investigated in this study; the cooling response was mainly concentrated within approximately 0.35 m under the present conditions
Spray coolingevaporation and enhanced air coolingtunnel air and wall surfacesuitable for short-term local cooling during construction, but its influence on deep surrounding rock was not evaluated in this study
Thermal insulation layerblocks heat transfer from hot rock to tunnel spacelining–rock interfacemay reduce heat inflow into the tunnel, but it does not directly remove the heat stored in deep surrounding rock
cooling pipes/energy tunnelactive heat extractionlining or deeper rock zonemay be more suitable for long-term heat extraction, but requires higher construction complexity and system maintenance
thermal-control groutingreduces conductive heat migrationsurrounding rock zonepotentially suitable for persistent localized geothermal anomalies, especially when deep heat accumulation cannot be rapidly dissipated by ventilation alone.
Disclaimer/Publisher’s Note: The statements, opinions and data contained in all publications are solely those of the individual author(s) and contributor(s) and not of MDPI and/or the editor(s). MDPI and/or the editor(s) disclaim responsibility for any injury to people or property resulting from any ideas, methods, instructions or products referred to in the content.