Article

Parametric Study of the Physical Responses of NSM CFRP-Strengthened RC T-Beams in the Negative Moment Region

by
Yanuar Haryanto
1,2,3,*,
Gathot Heri Sudibyo
1,
Hsuan-Teh Hu
3,*,
Fu-Pei Hsiao
2,
Laurencius Nugroho
3,
Dani Nugroho Saputro
1,
Habib Raihan Suryanto
3 and
Abel Earnesta Christopher Haryanto
1
1
Department of Civil Engineering, Universitas Jenderal Soedirman, Purwokerto 53122, Indonesia
2
National Center for Research on Earthquake Engineering, Taipei 106, Taiwan
3
Department of Civil Engineering, National Cheng Kung University, Tainan 701, Taiwan
*
Authors to whom correspondence should be addressed.
CivilEng 2025, 6(4), 56; https://doi.org/10.3390/civileng6040056
Submission received: 9 August 2025 / Revised: 28 September 2025 / Accepted: 15 October 2025 / Published: 20 October 2025
(This article belongs to the Section Structural and Earthquake Engineering)

Abstract

This study presented a comprehensive finite element (FE) investigation into the flexural behavior of RC T-beams strengthened in the negative moment region using near-surface mounted (NSM) carbon-fiber-reinforced polymers (CFRP) rods. A three-dimensional nonlinear FE model was developed and validated against experimental data, achieving close agreement with normalized mean square error values as low as 0.006 and experimental-to-numerical ratios ranging from 0.95 to 1.04. The validated model was then employed to conduct a systematic parametric analysis considering CFRP rod diameter, concrete compressive strength, longitudinal reinforcement ratio, and FRP material type. The results showed that increasing CFRP diameter from 6 to 10 mm enhanced ultimate load by up to 47.51% and improved stiffness by 1.48 times. Higher concrete compressive strength contributed to stiffness gains exceeding 50.00%, although this improvement was accompanied by reductions in ductility. Beams with reinforcement ratios up to 2.90% achieved peak loads of 309.61 kN, but ductility declined. Comparison among FRP materials indicated that CFRP and AFRP offered superior strength and stiffness, whereas BFRP provided a more balanced combination of strength and deformation capacity.

1. Introduction

Reinforced concrete (RC) remains a cornerstone of modern infrastructure due to its inherent durability and ability to maintain structural performance over extended periods. As mandated by construction codes, concrete structures are typically designed for a minimum service life of 50 years [1]. However, actual performance often falls short of this target due to a range of factors including environmental aging, inadequate maintenance, accidental overloading, and deficiencies in design or workmanship [2,3,4,5,6,7,8,9]. As a result, structural retrofitting has become essential to restore or enhance performance and ensure continued compliance with evolving safety standards. Beyond restoration, upgrading RC members is often pursued to meet increasing strength demands or extend functional lifespan. Conventional retrofitting techniques include the use of external steel plates, wire mesh, fiber fabrics, post-tensioning, concrete or steel jacketing, and resin injection [10,11,12]. Among these, fiber-reinforced polymers (FRPs) have emerged as a superior alternative, offering distinct advantages such as a high strength-to-weight ratio, ease of application, and corrosion resistance [13]. The manufacturing and installation of FRP systems is cost-efficient and environmentally friendly, contributing to reduced material waste and lower life cycle costs [14]. Today, FRPs are widely accepted as an effective solution for strengthening RC structures, combining structural benefits with cost efficiency [15,16,17,18,19].
Over the last two decades, the near-surface mounted (NSM) technique has emerged as a compelling alternative to the conventional externally bonded (EB) method for enhancing the performance of reinforced concrete (RC) structures using FRPs [20]. This method involves milling shallow grooves into the concrete surface, thoroughly cleaning them (typically with compressed air), and subsequently embedding FRP rods or strips, which are then secured in place with a structural adhesive. Unlike the EB approach, where reinforcement remains exposed on the surface, the NSM system anchors the FRP material within the concrete mass. This embedded configuration not only improves bond integrity but also enhances long-term durability, making NSM systems particularly attractive for applications demanding robust and resilient strengthening solutions [21,22].
In an effort to standardize the use of FRP materials for structural strengthening, design codes such as ACI 440 [23] provide technical specifications for NSM systems. Among these, the minimum groove depth, set at no less than 1.5 times the FRP rod diameter, is critical to ensuring full adhesive contact, enabling efficient stress transfer and strain compatibility across the bonded interface. Adherence to this guideline is essential for achieving reliable bond performance and influencing the structural failure mechanism [24,25,26,27,28,29,30,31,32,33,34]. However, meeting this embedment depth can be difficult in retrofit applications, where spatial limitations or interference from existing reinforcement often restrict groove placement.
Experimental investigations have demonstrated the sensitivity of bond behavior to geometric configurations. Sharaky et al. [35] reported that narrower grooves increase the separation between carbon-FRP (CFRP) rods and steel reinforcement, resulting in improved flexural strength. Building on this, Budipriyanto et al. [36] and Haryanto et al. [37] emphasized that embedment depth significantly affects bond integrity and crack propagation. Furthermore, Haryanto et al. [38] showed that, in cases with higher tensile reinforcement ratios, partial embedment of CFRP rods may reduce flexural capacity due to altered internal force redistribution.
Despite considerable progress in the field, the application of NSM CFRP in the negative moment region of RC members has received limited attention [39,40]. Unlike the positive moment region, where flexural demand is resisted primarily by tensile reinforcement within the beam web, the negative moment region is governed by the combined action of maximum flexural and shear forces, as reported by Jumaat et al. [41] and illustrated in Figure 1. The slab–column connection further complicates this zone, as columns obstruct access to the beam web and restrict the feasible groove layout for CFRP installation [42]. These conditions make strengthening more complex than in positive moment regions, where access is straightforward and shear effects are less dominant.
Recent studies have begun to address these challenges. Han et al. [43] demonstrated that CFRP embedment depth notably influences the load-bearing capacity of RC T-beams subjected to non-reversed cyclic loading. Likewise, Haryanto et al. [44] observed comparable stiffness between half and fully embedded configurations, suggesting that shallower grooves may serve as a feasible alternative. Extending this line of inquiry, Haryanto et al. [45,46] applied reversed cyclic protocols and reported improvements in strength, energy absorption, and stiffness retention. Supporting this trend, Nugroho et al. [47] found that higher loading rates enhanced performance metrics, albeit with reduced ductility. Additionally, concrete tensile strength was shown to have a minimal influence on unstrengthened specimens but played a significant role in the capacity of CFRP-strengthened beams [48].
Complementing experimental investigations, finite element (FE) modeling has become an essential tool for analyzing the complex, nonlinear behavior of RC structures [49,50,51,52,53]. It enables detailed simulation of internal stress–strain distributions, particularly in regions where direct measurement is impractical or intrusive. Within this framework, Haryanto et al. [54] conducted a numerical study on the effects of varying NSM CFRP embedment depths in the negative moment region of RC T-beams, highlighting the critical role of bond behavior in shaping overall flexural performance. Nevertheless, the influence of other governing parameters, such as CFRP rod diameter, concrete compressive strength, reinforcement ratio, and the type of strengthening material, on flexural behavior in this region remains insufficiently explored.
Building upon these identified research needs, the present study conducts a comprehensive parametric analysis to further explore the flexural behavior of RC T-beams strengthened with NSM CFRP in the negative moment region. To overcome the practical limitations of experimental testing, a validated three-dimensional FE model is utilized to examine how variations in design parameters influence the structural response. Specifically, the investigation focuses on the effects of CFRP geometry, concrete strength, reinforcement detailing, and material selection on load capacity, stiffness, and overall beam performance. The novelty and unique contribution of this study lie in quantifying the trade-offs between strength, stiffness, and ductility across different retrofit scenarios, thereby offering practical guidance for tailoring NSM CFRP strengthening strategies in performance-based design. The insights derived from this simulation-based approach aim to refine and optimize NSM CFRP applications in structural retrofitting and rehabilitation.

2. Overview of Referenced Experimental Program

2.1. Specimen Configuration

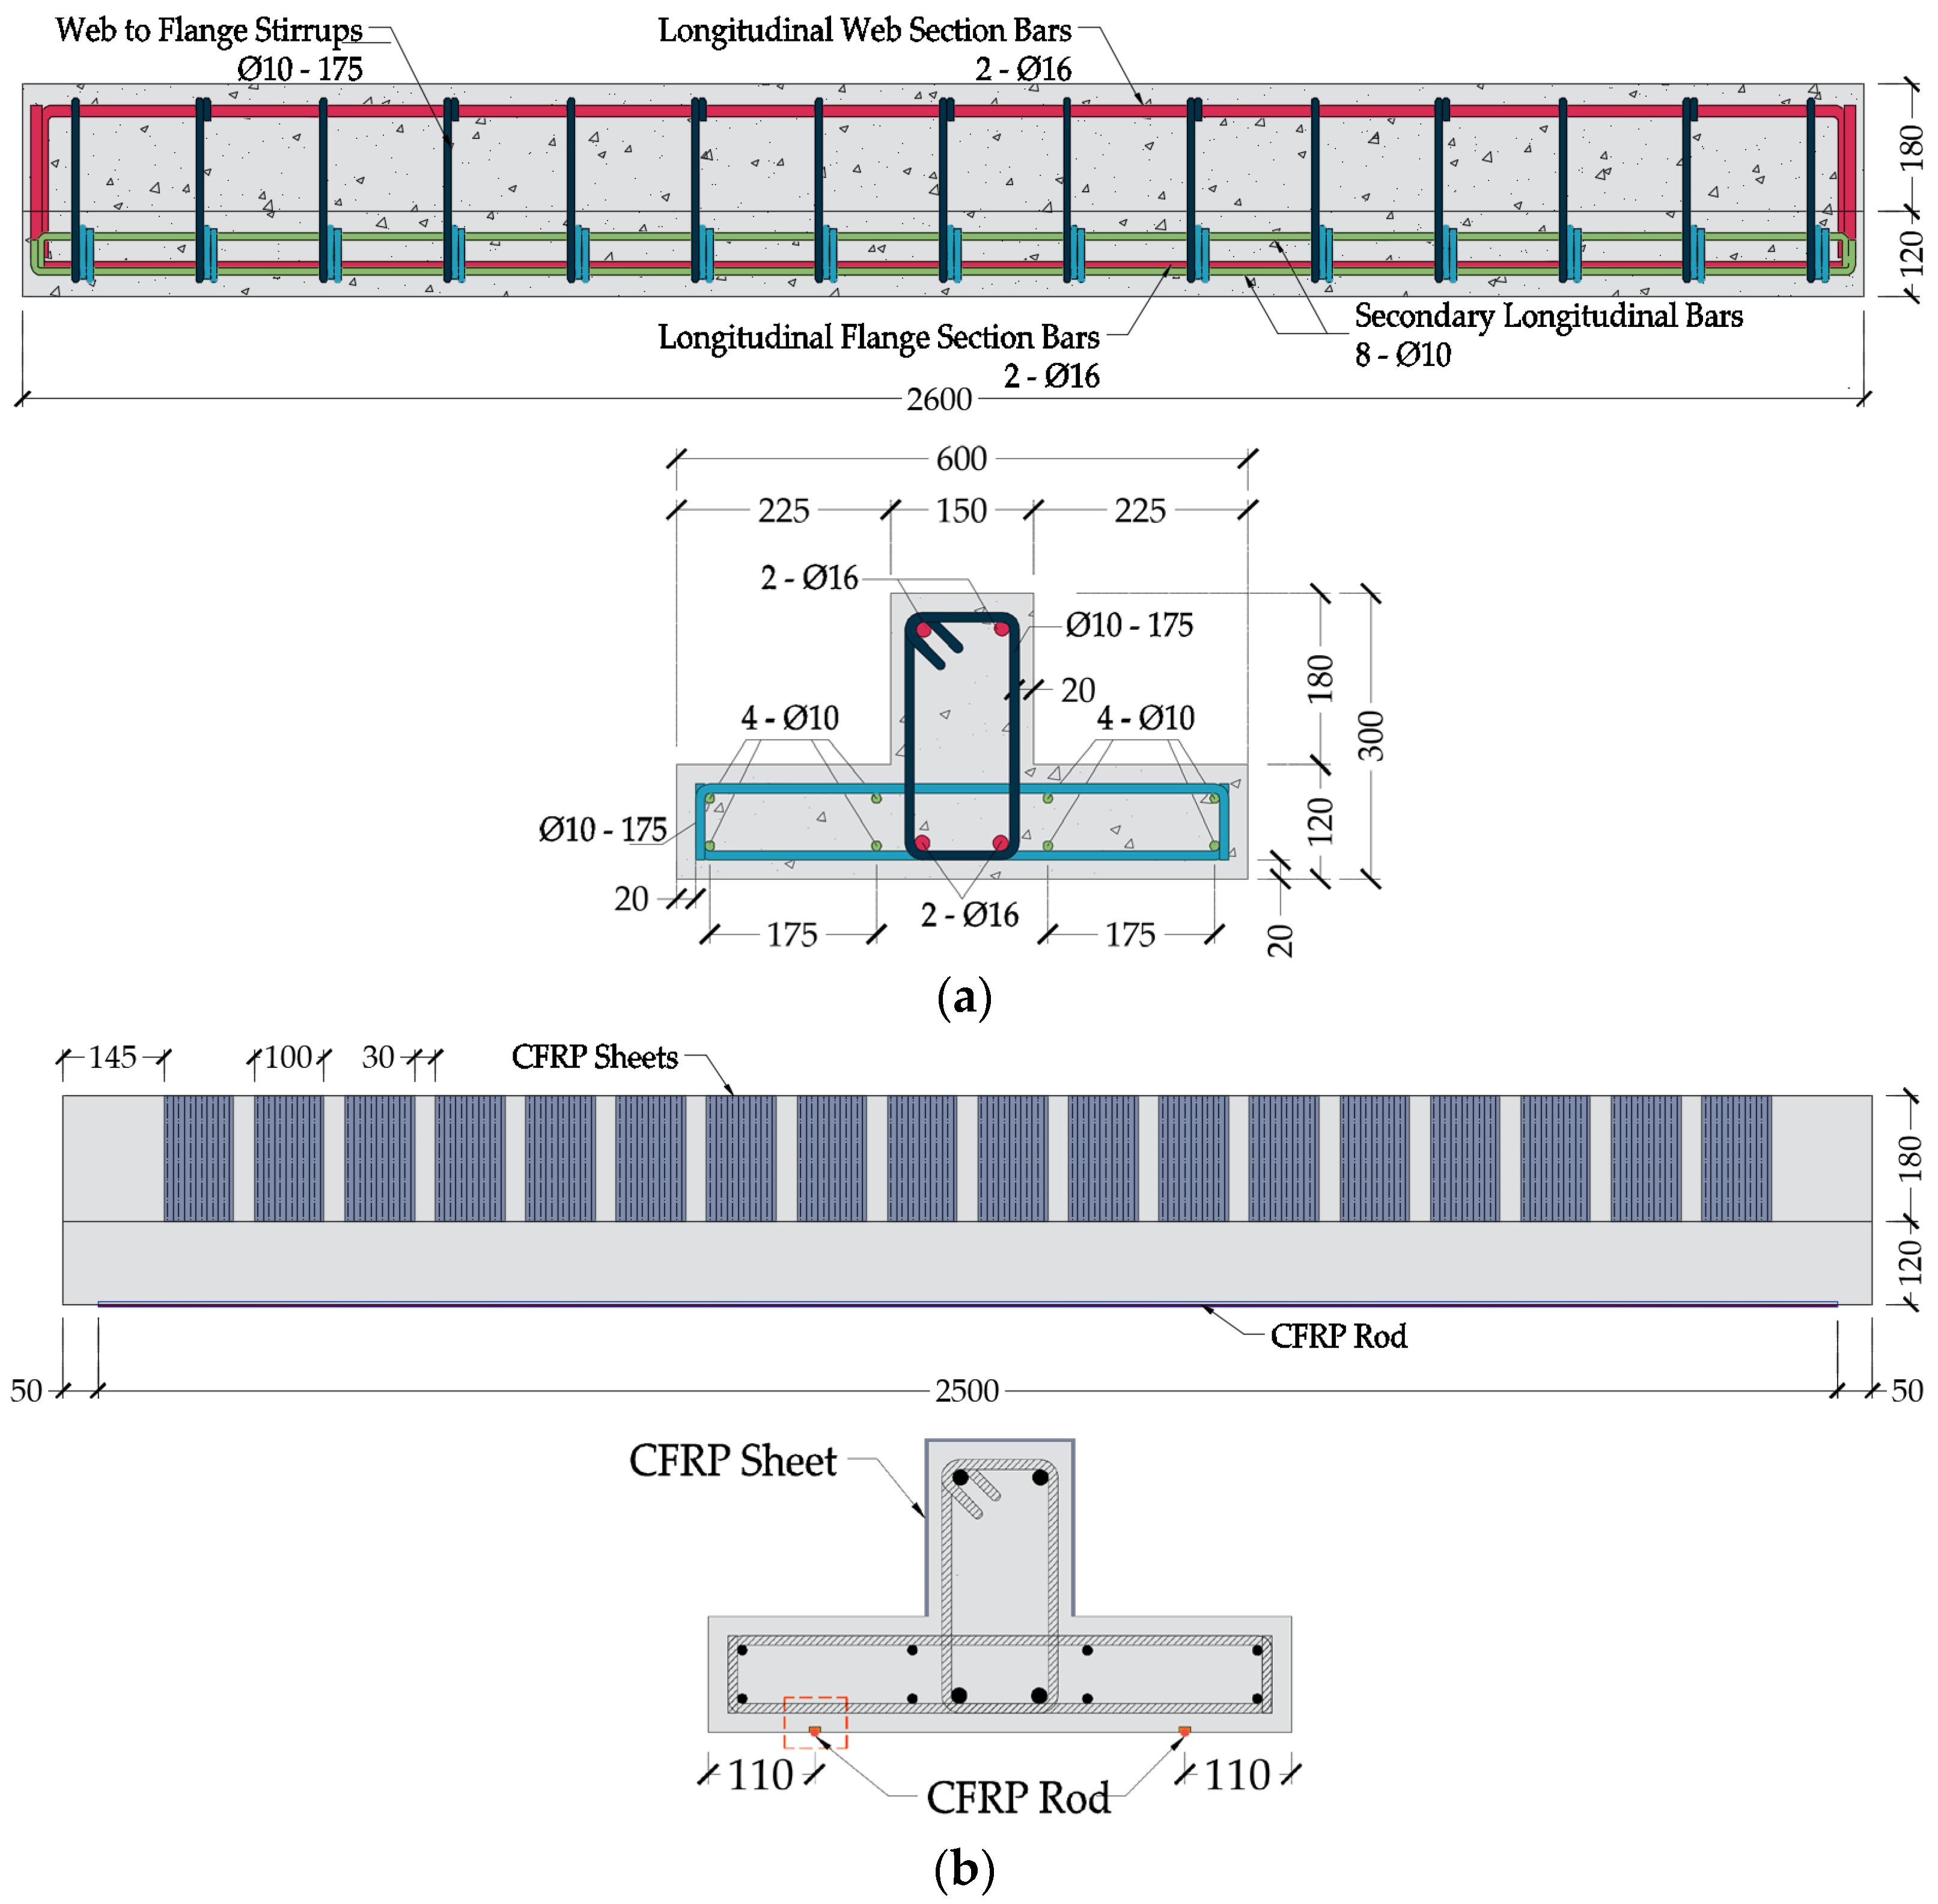
The experimental study [45,54] incorporated three full-scale RC T-beam specimens, each measuring 2600 mm in length. The cross-section was designed with an overall depth of 300 mm, a web width of 150 mm, and a flange measuring 600 mm in width and 120 mm in thickness. The flange width adhered to conservative design principles, following code-based recommendations that limit effective flange width to the minimum of one-quarter of the span, the beam spacing, or the actual slab width [55]. For a 2600 mm span, this equates to 650 mm, thereby validating the selected 600 mm width as both structurally appropriate and representative of common T-beam configurations in practice. The longitudinal reinforcement consisted of two D16 deformed bars placed symmetrically in both tension and compression zones. Additional longitudinal bars (eight plain D10 round bars) were embedded within the flange to simulate slab reinforcement. Shear resistance was provided by uniformly spaced D10 closed stirrups at 175 mm intervals, extending through both the web and flange regions to ensure consistent transverse confinement.
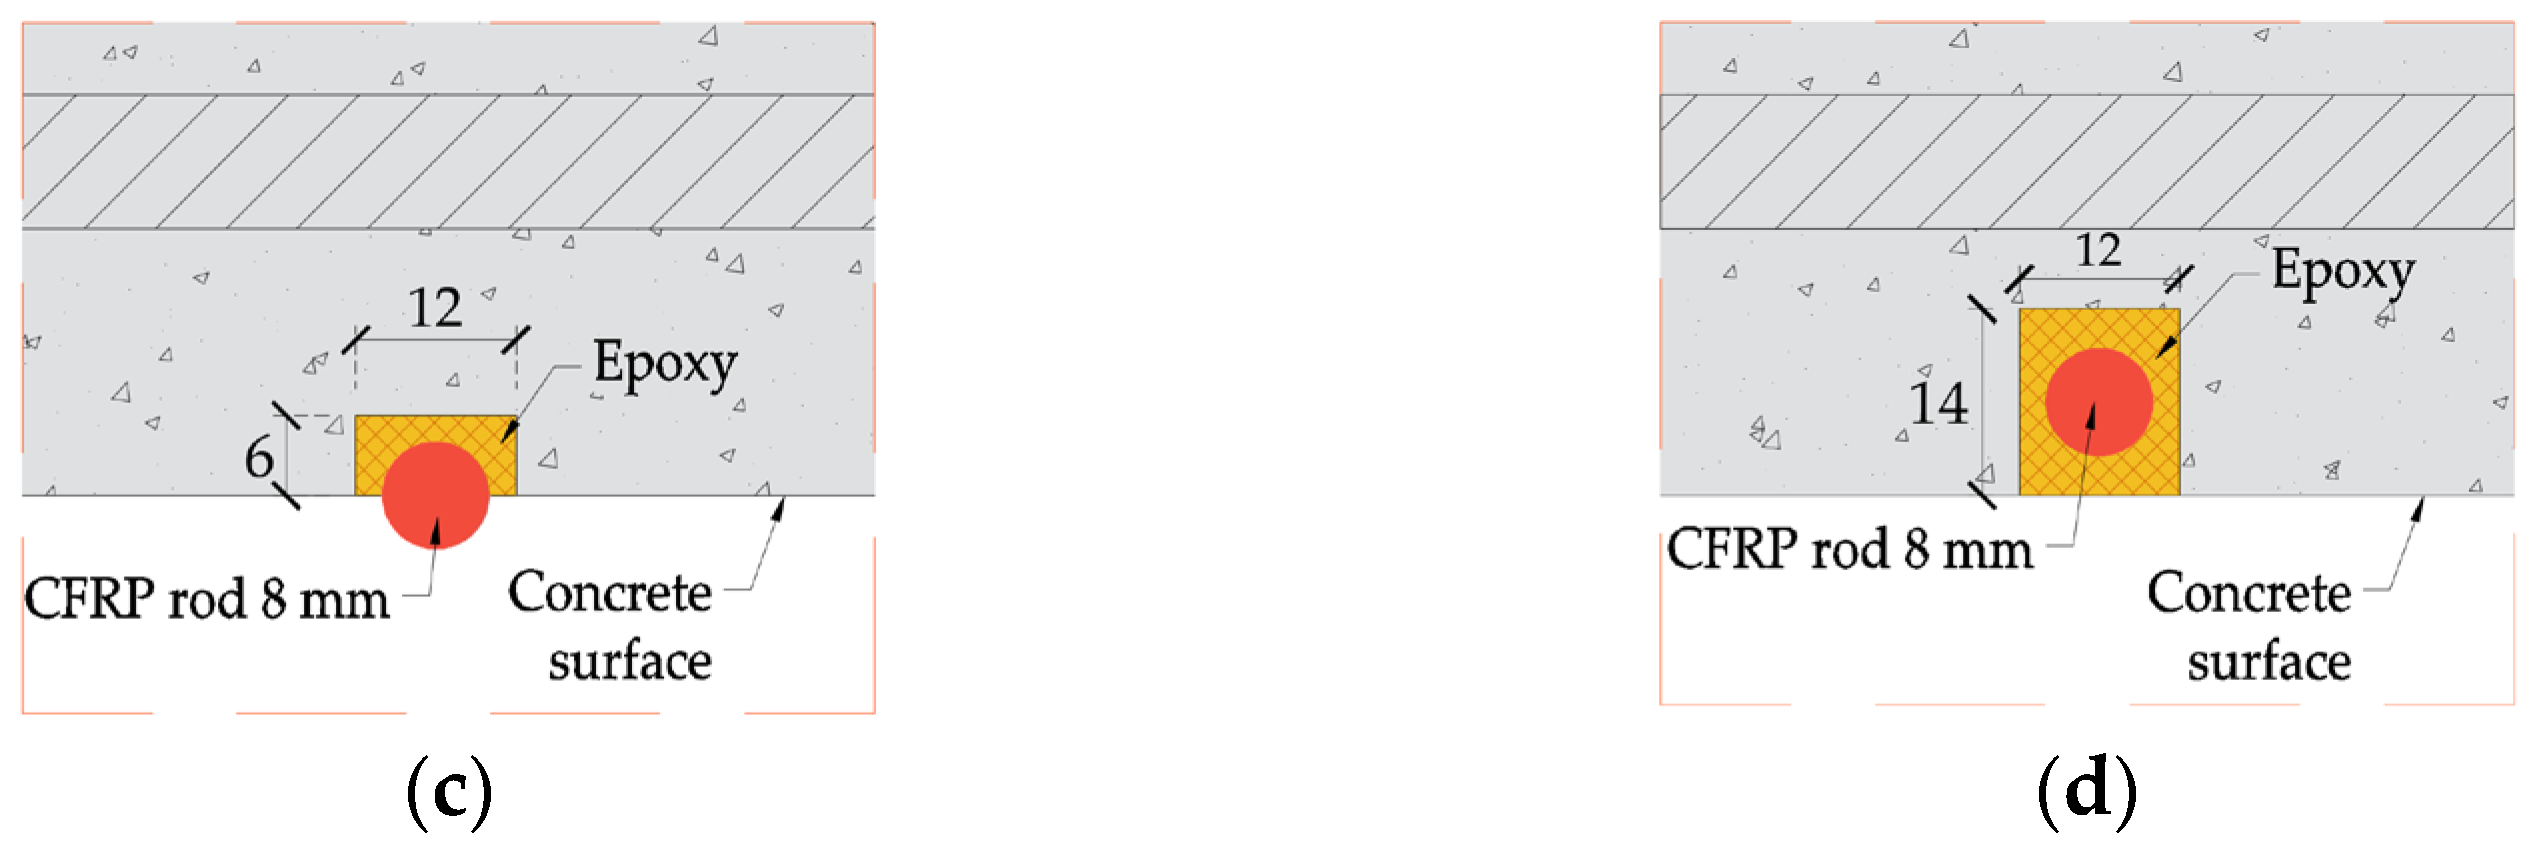
The NSM technique was employed in the two strengthened beam specimens by embedding a pair of 8 mm diameter CFRP rods (Sika® CarboDur® BC8) longitudinally within the flange region, effectively simulating tensile reinforcement in the negative moment zone. After completing a standard 28-day curing period, shallow grooves were carefully machined into the concrete surface to house the CFRP rods. To further improve shear capacity, U-shaped CFRP strips (SikaWrap®-231 C), each 100 mm wide, were externally bonded to both web faces using the epoxy system. These transverse U-wraps were evenly spaced at 130 mm intervals along the beam length, providing supplemental confinement and mitigating potential shear-related failures. All strengthening materials were supplied by PT. SIKA Indonesia. The geometric details and strengthening schemes are depicted in Figure 2.
A key innovation of this study is the exploration of a modified NSM CFRP strengthening approach that utilizes partial embedment in the negative moment region of RC T-beams. Departing from the conventional practices outlined in ACI 440 [23], which prescribe full-depth embedment for optimal bond performance, this investigation considers a more adaptable configuration which is suitable for retrofit scenarios where full groove depth cannot be achieved due to site limitations. Two strengthened specimens were constructed for comparative analysis: specimen SF, in which CFRP rods were embedded in accordance with the standard code requirements, and specimen SH, which featured rods embedded to only half their diameter, deliberately omitting a cover layer to reflect constrained field conditions. These were tested alongside an unstrengthened control beam (CB) to assess the structural implications of reduced embedment.

2.2. Test Setup and Instrumentation

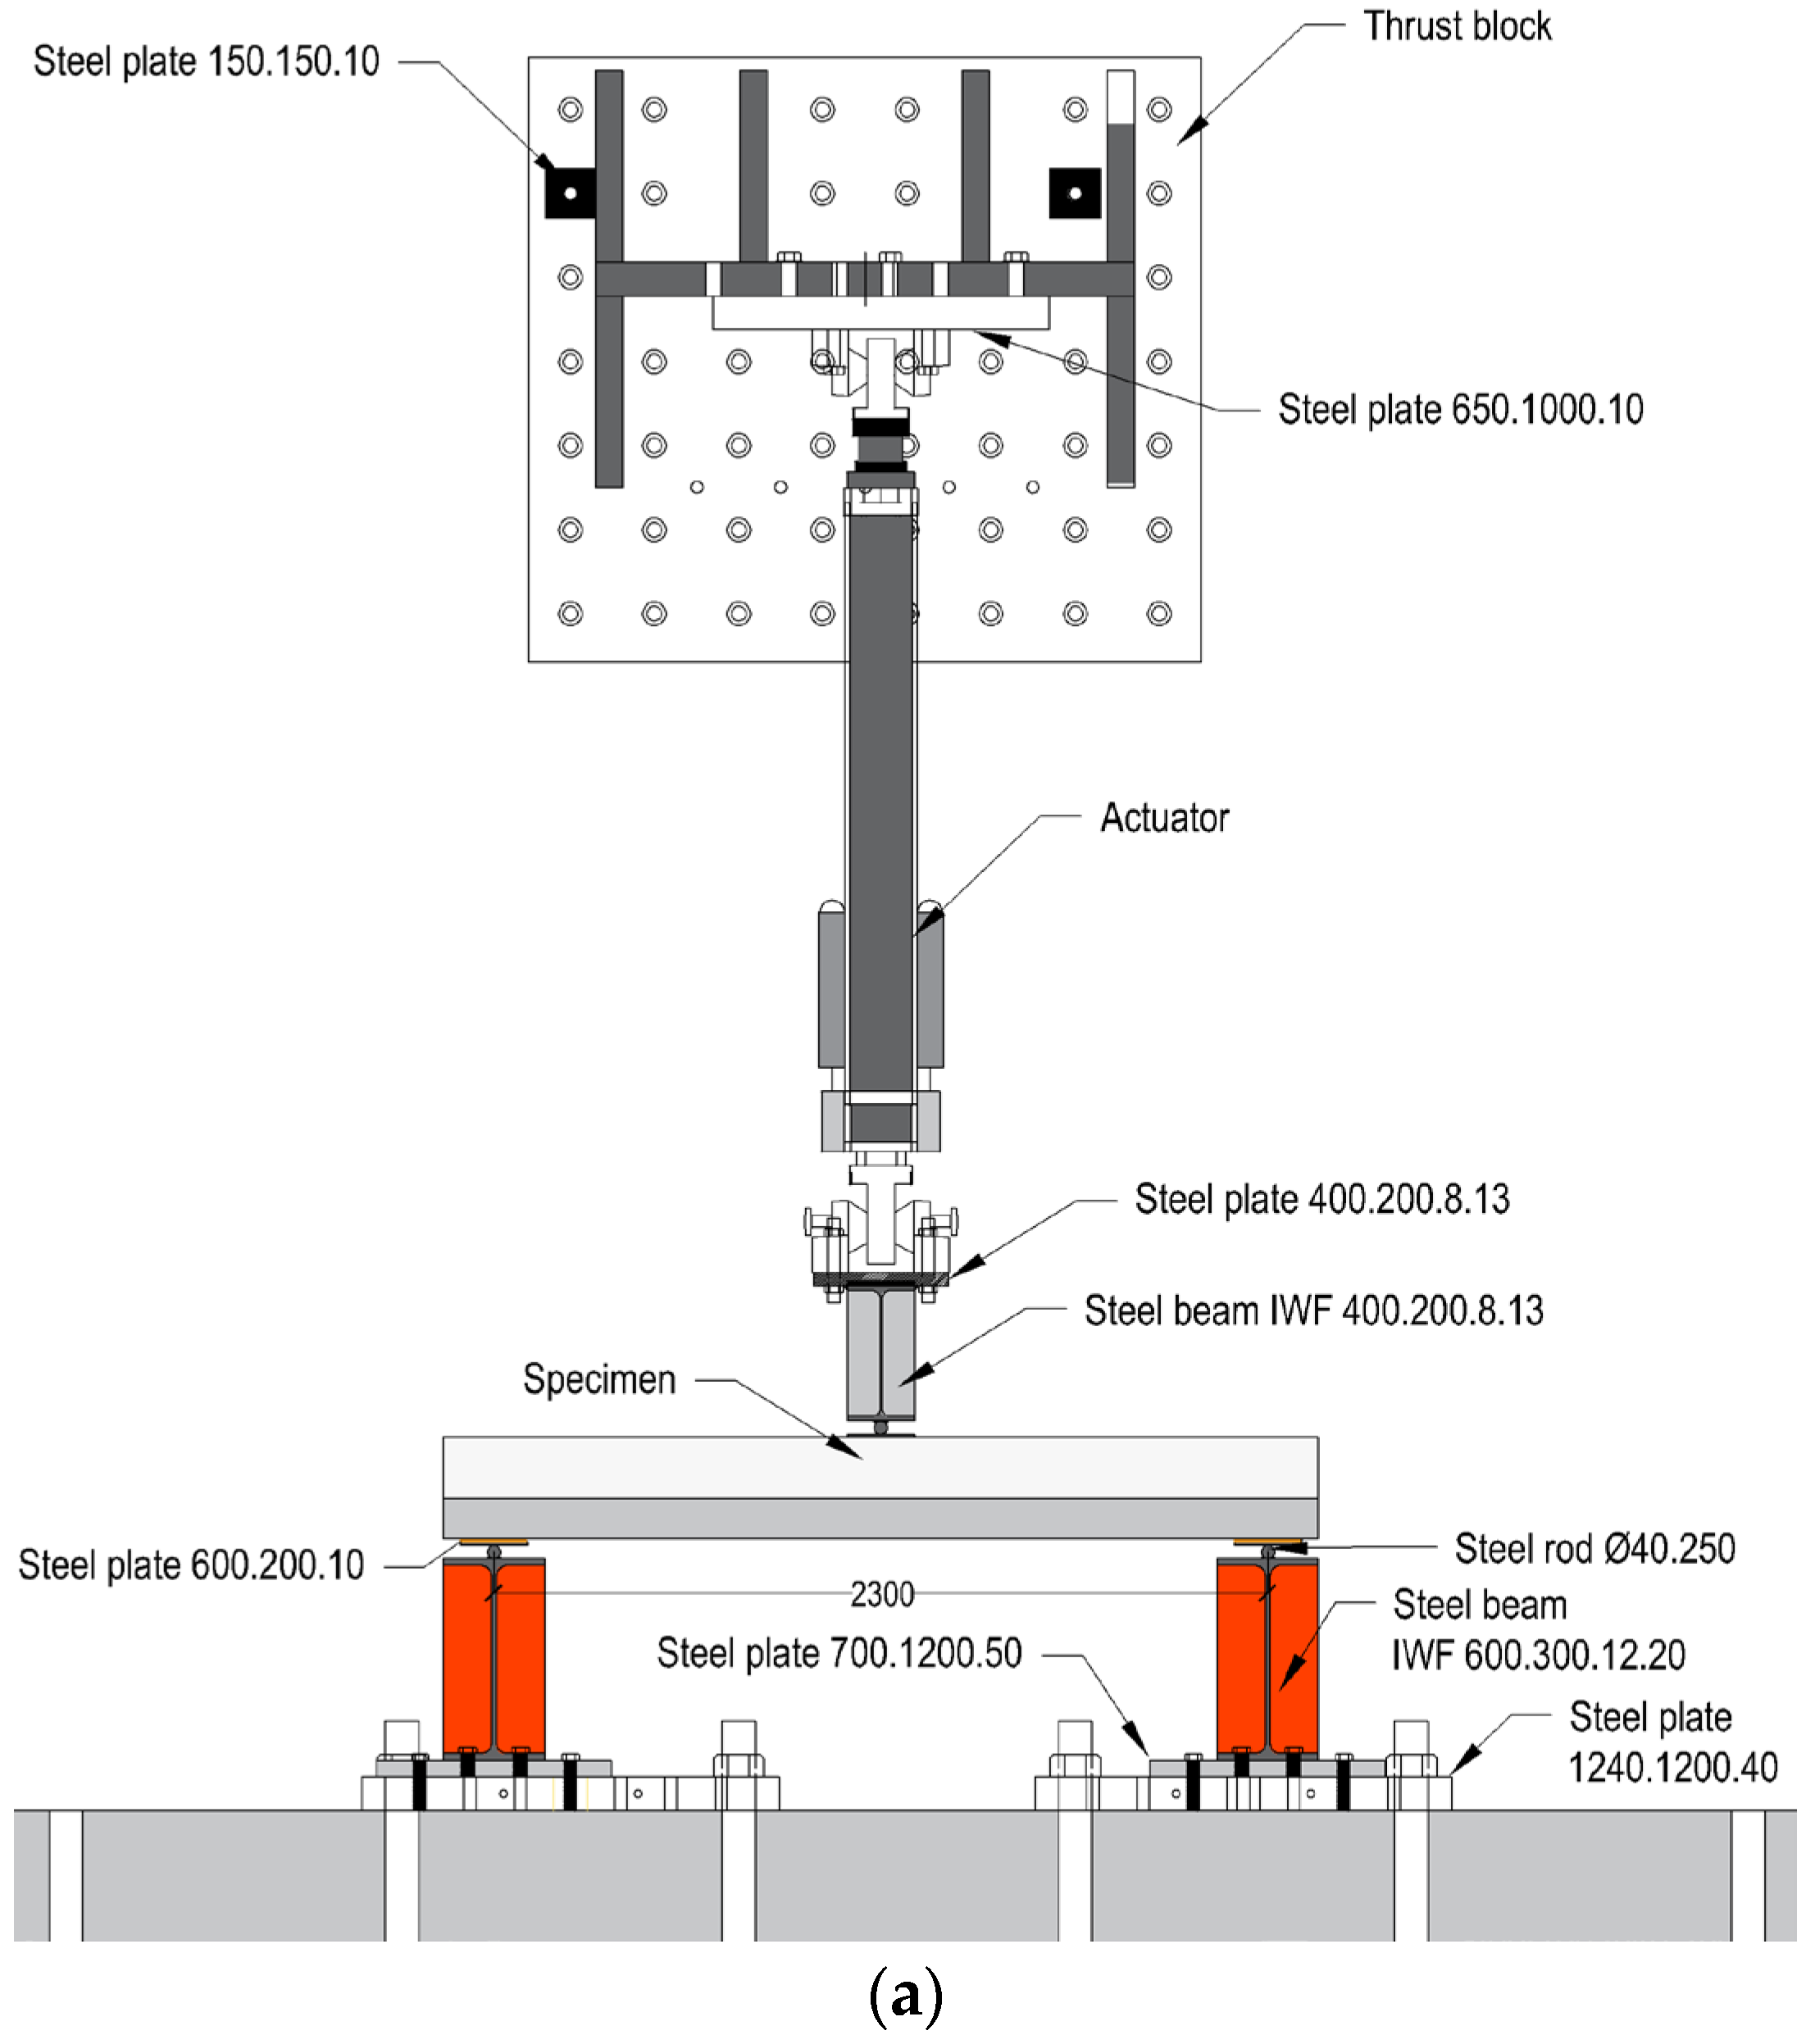
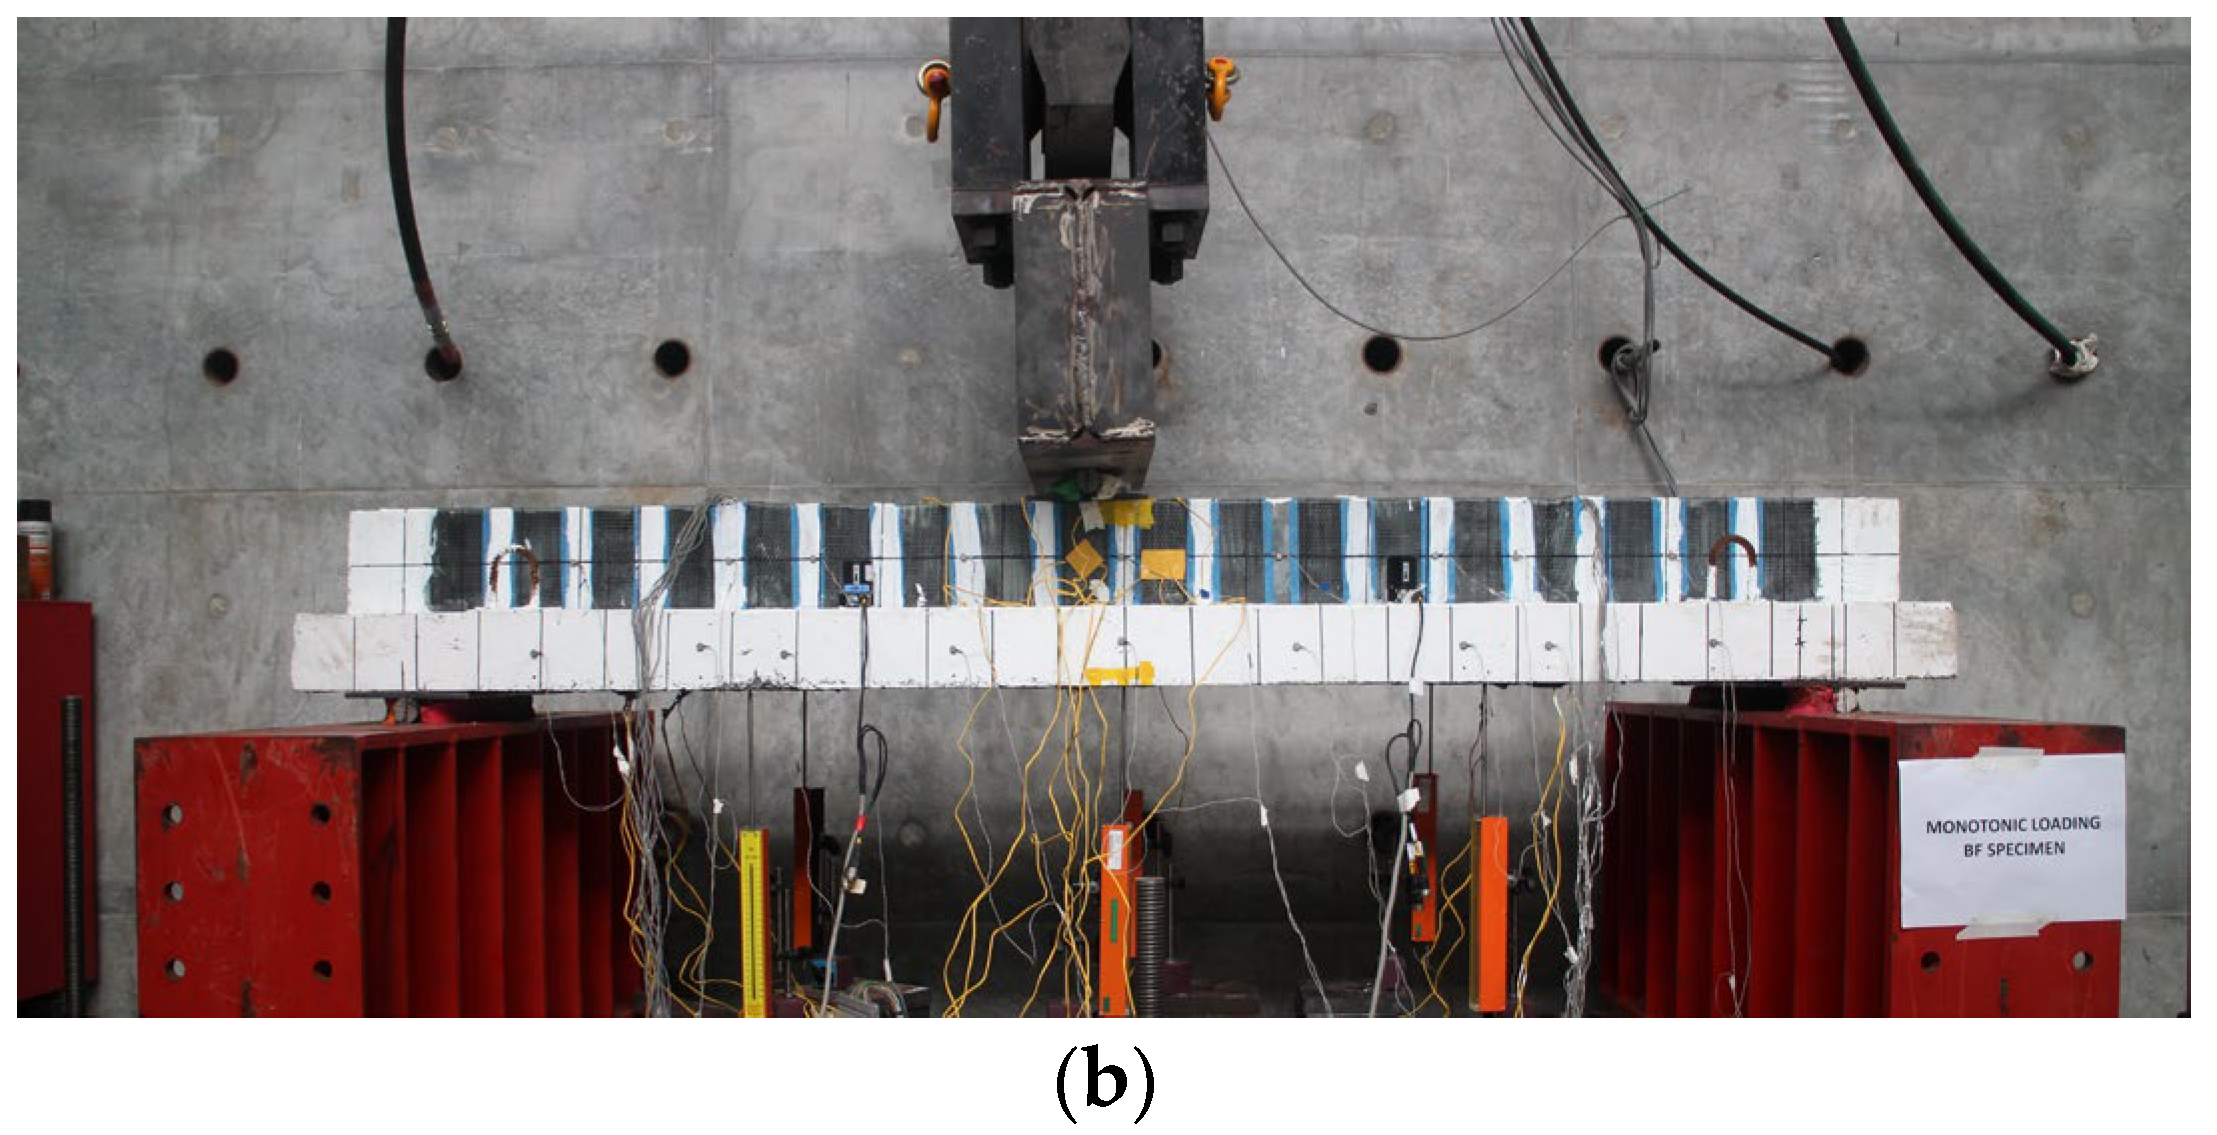
As part of the experimental campaign [45,54], three-point bending tests were performed using a servo-controlled actuator rated at 500 kN, as depicted in Figure 3.
Each specimen was tested under simply supported conditions and loaded monotonically until failure. A single-point load was applied mid-span to replicate the combined influence of peak bending and shear forces. To reproduce the negative moment behavior typical of slab–column connections, the T-beams were inverted so that the flange was positioned at the tension side. In this orientation, the actuator applied a downward force directly onto the flange (original compression face), creating tensile stresses in the slab region and thus simulating the negative flexural demand. This setup effectively reproduced the negative moment that develops in continuous members over interior supports. Loading was applied under displacement control at a constant rate of 0.0004 mm/sec. Mid-span deflections were continuously measured using a linear variable differential transformer (LVDT), while the applied load was monitored through a calibrated load cell.

3. FE Model Development

3.1. Geometry Definition

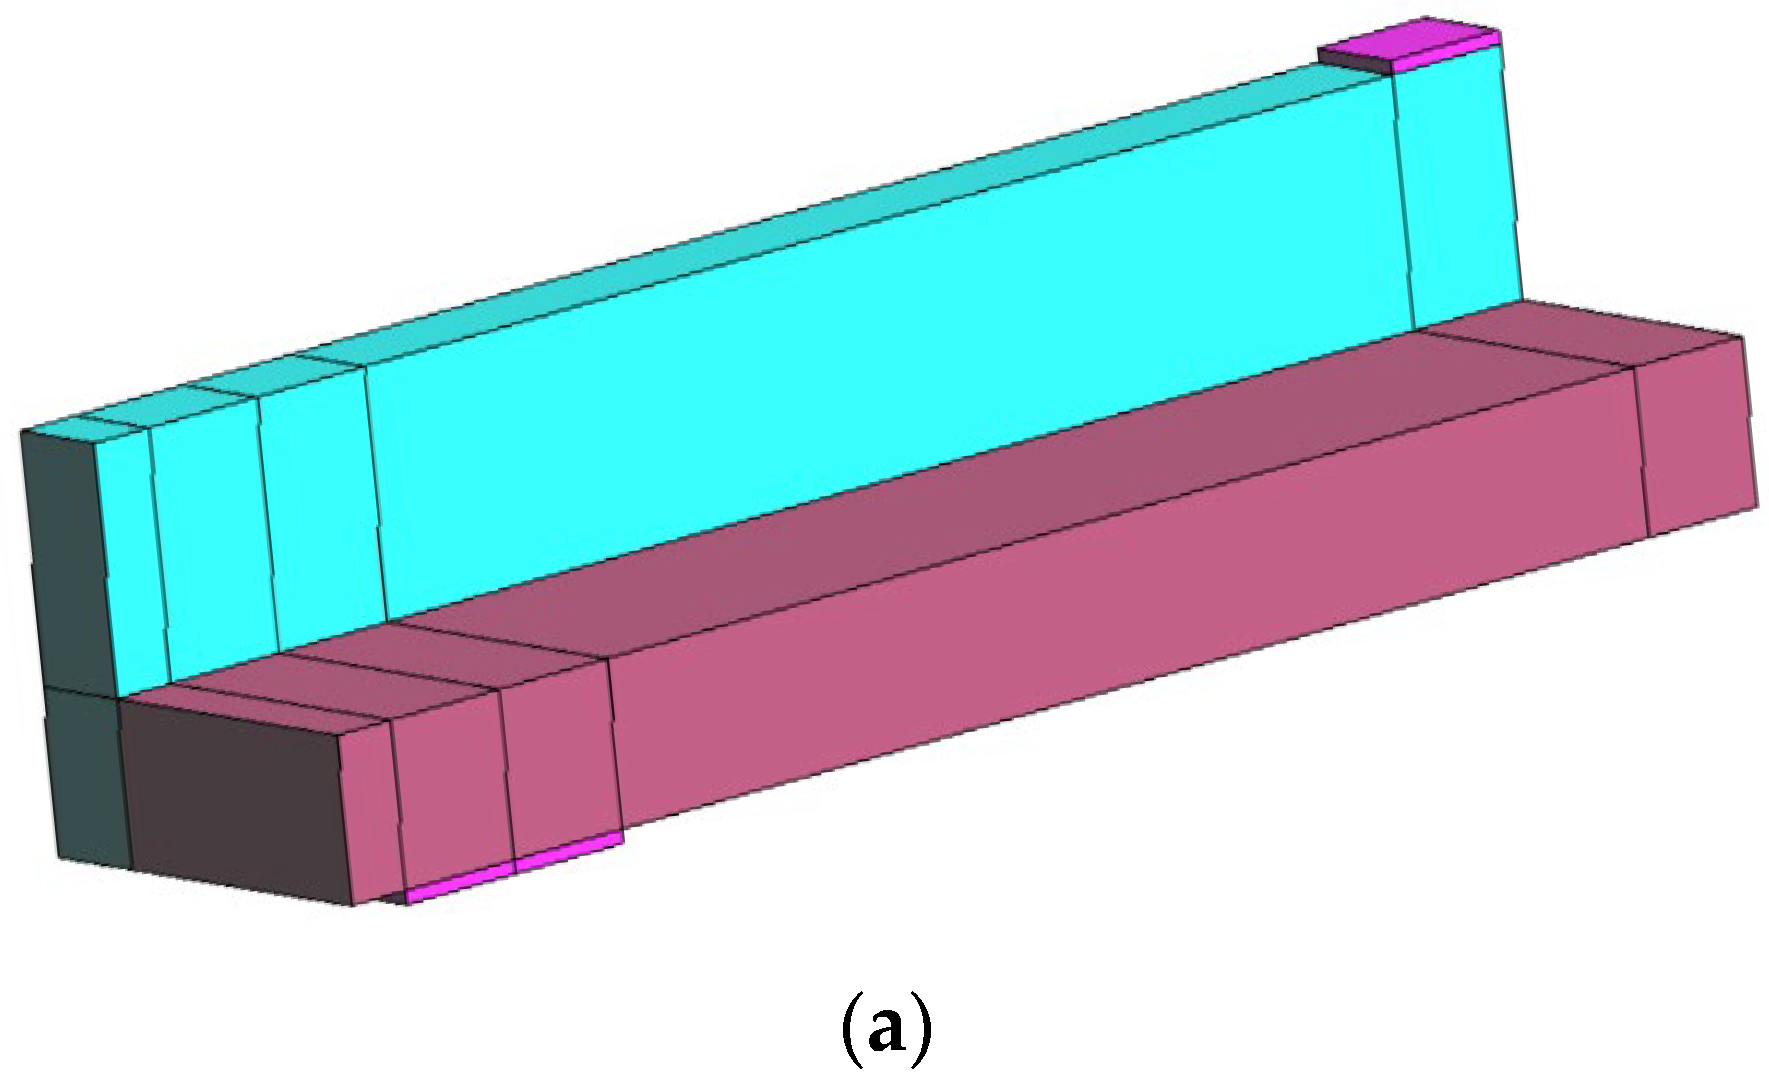
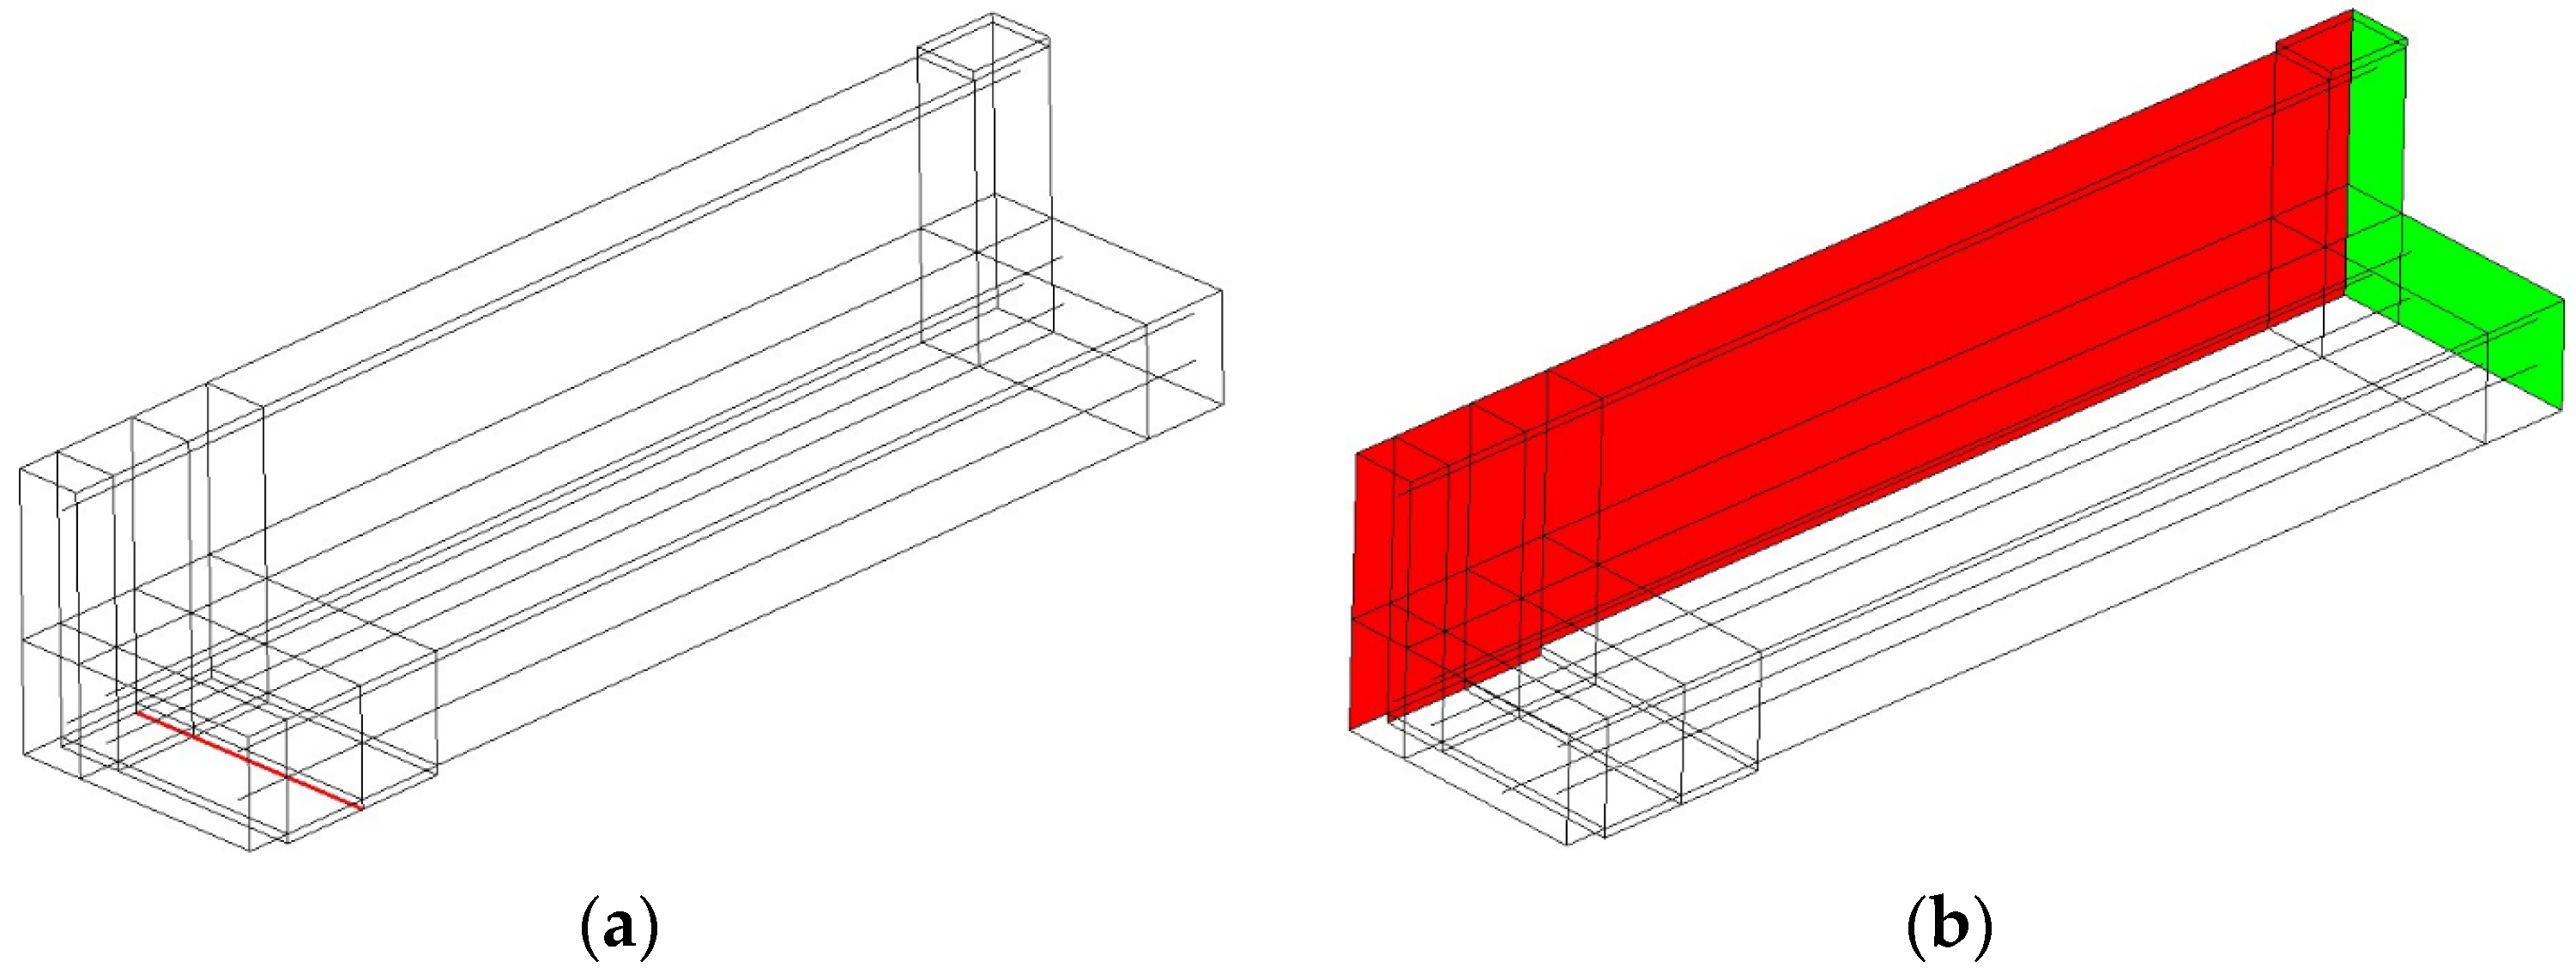
The three-dimensional FE model for this investigation was constructed using ATENA (Advanced Tool for Engineering Nonlinear Analysis), a specialized simulation platform widely adopted for the nonlinear analysis of reinforced concrete structures [56,57,58]. The model configuration faithfully reflected the experimental beam geometry, material definitions, and support conditions. Given the symmetry in both loading and geometry, only one-quarter of the full beam was modeled to reduce computational demands without compromising result fidelity, as shown in Figure 4a.
To balance numerical efficiency with solution accuracy, structured meshing was employed, with mesh density controlled by predefined segmentations along the specimen. This approach was guided by the findings of Zheng et al. [59], who demonstrated that mesh refinement beyond a certain threshold yields diminishing accuracy gains while disproportionately increasing computational costs. Although a detailed mesh convergence study was not performed in this work, the selected mesh density was determined with reference to this recommendation and was therefore considered appropriate to capture the flexural behavior of the beams within the scope of the present investigation.
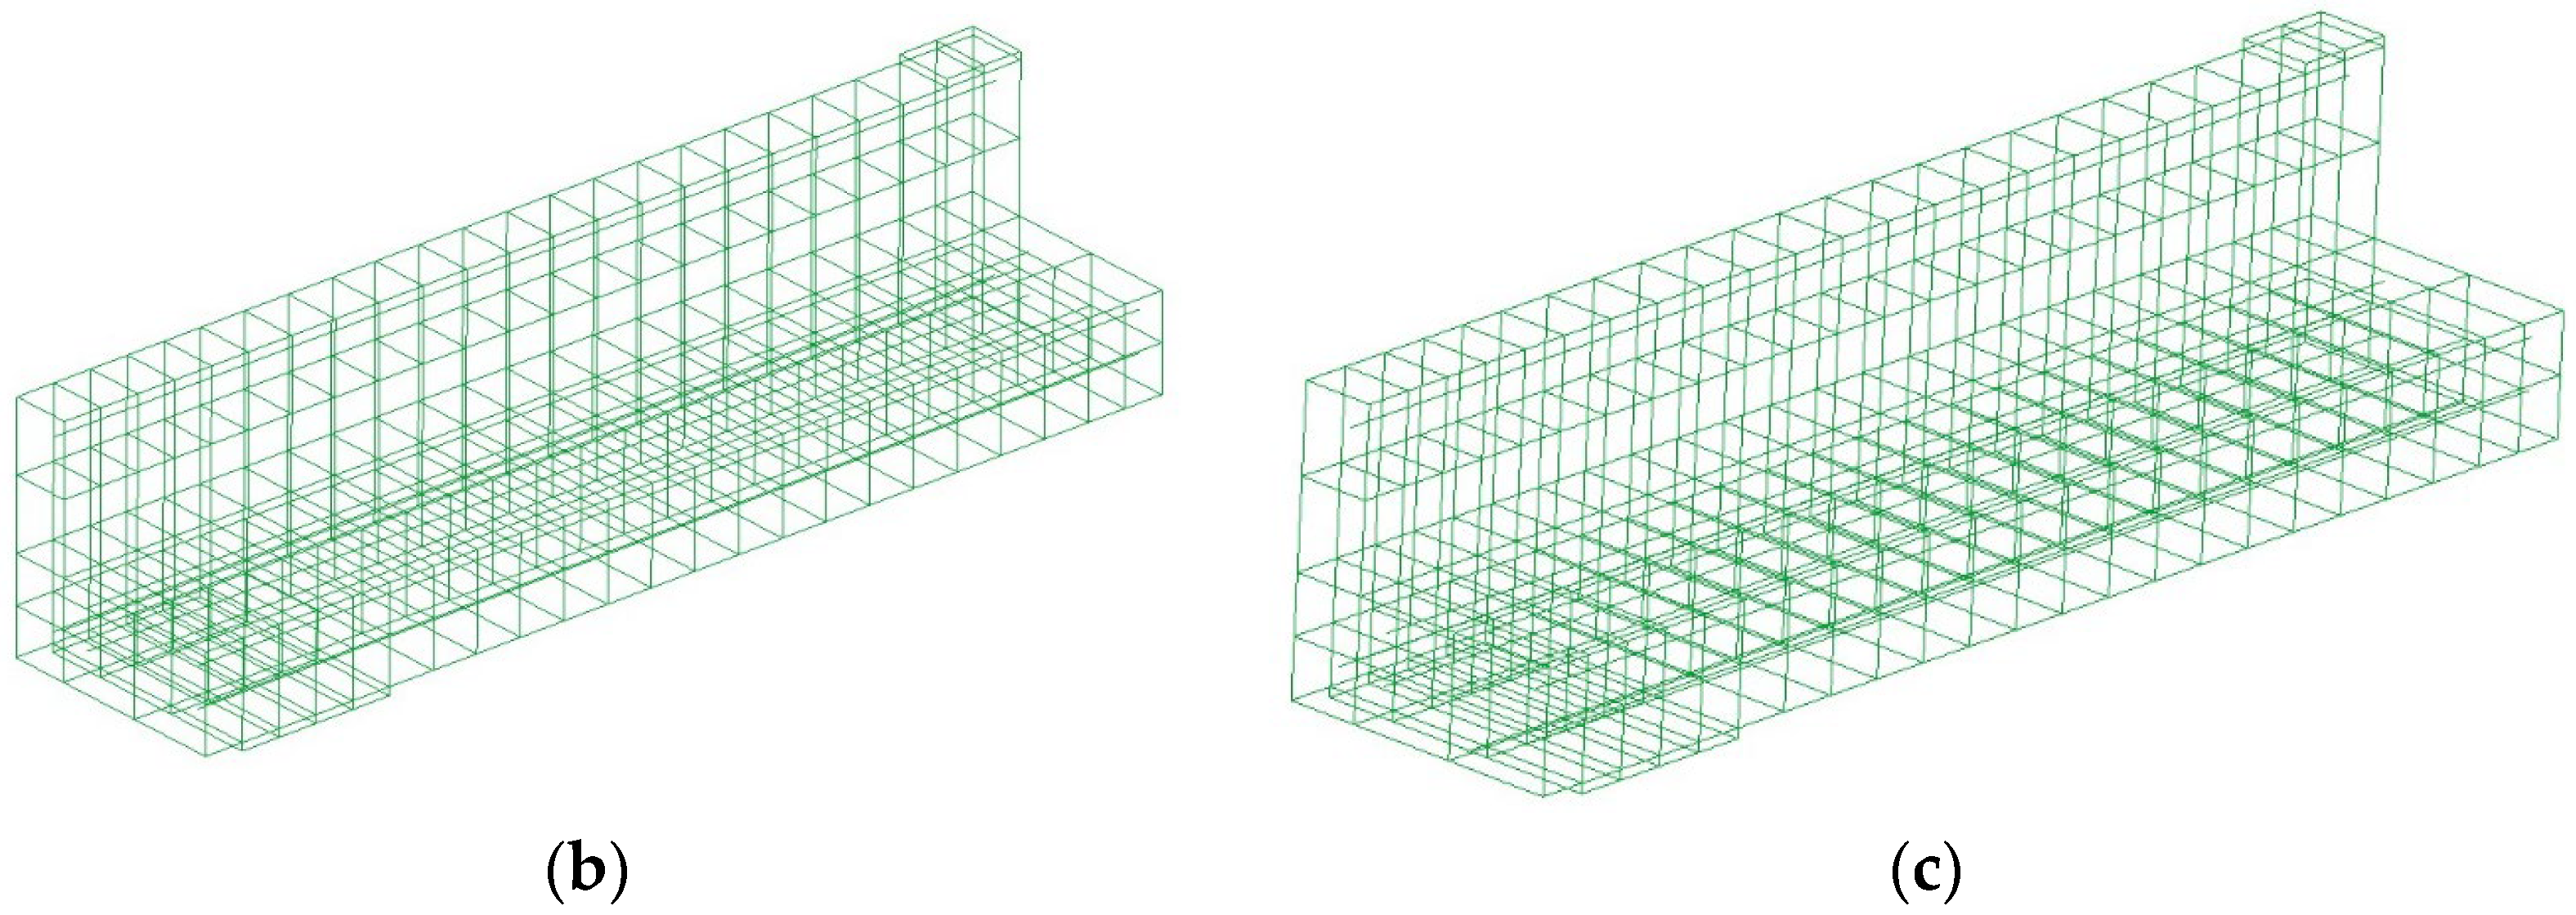
The meshing strategy was based on a structured subdivision of the beam geometry along the x, y, and z axes, to achieve an optimal balance between computational efficiency and numerical accuracy. As depicted in Figure 4b,c, the unstrengthened control beam model included six embedded linear reinforcement elements and was discretized using 198 hexahedral solid elements. In comparison, the strengthened beam model featured an additional reinforcement element, totaling seven, while maintaining the same number of hexahedral elements. Mesh generation followed a directionally segmented approach, wherein the total element count was dictated by refinement levels assigned to each axis.
To complement this meshing strategy, the bond between the NSM reinforcement, epoxy, and surrounding concrete was modeled using a perfect bond assumption within the ATENA framework. The epoxy adhesive layer was not modeled explicitly; instead, the CFRP reinforcement was embedded directly within the host concrete elements, with the interface treated as fully bonded. This simplification was adopted because experimental observations [45,54] showed that localized debonding had minimal influence on the dominant flexural failure mode in the negative moment region. Moreover, the reinforcement was fully cast into the grooves with sufficient adhesive coverage, providing a high degree of mechanical interlock and preventing significant slippage during loading.

3.2. Material Modeling

3.2.1. Concrete

Concrete is inherently brittle and was modeled in ATENA using a nonlinear fracture–plastic constitutive law. In this framework, compressive behavior was represented through plasticity mechanisms that accounted for crushing and post-peak softening, while tensile behavior was described using a smeared crack approach that captured crack initiation and propagation. Within FE analysis, two general strategies have been used to represent concrete cracking: discrete crack models and smeared crack models. The discrete crack approach explicitly defined cracks along mesh boundaries, which restricted crack propagation to predefined paths and could lead to mesh sensitivity. By contrast, the smeared crack approach, adopted in ATENA, treated cracking as a distributed phenomenon by progressively reducing element stiffness, allowing displacement discontinuities to develop within the continuum without the need for predefined crack paths.
In smeared crack formulations, crack orientation is defined using either a fixed or rotating crack concept. In the fixed crack model, illustrated in Figure 5a, the direction of cracking is locked based on the principal stress at the onset of failure and remains unchanged throughout subsequent loading stages [60].
Prior to cracking, due to the isotropic nature of uncracked concrete, the principal stress and strain directions are aligned. Once a crack forms, the principal axis of the damaged material becomes oriented normal to the crack plane. In contrast, the rotating crack model, shown in Figure 5b, permits the crack orientation to evolve in response to shifts in the principal stress direction during loading. This adaptive behavior ensures continued alignment between the principal stress and strain directions and eliminates shear deformation along the fracture plane, improving accuracy in simulations involving complex stress states [61].
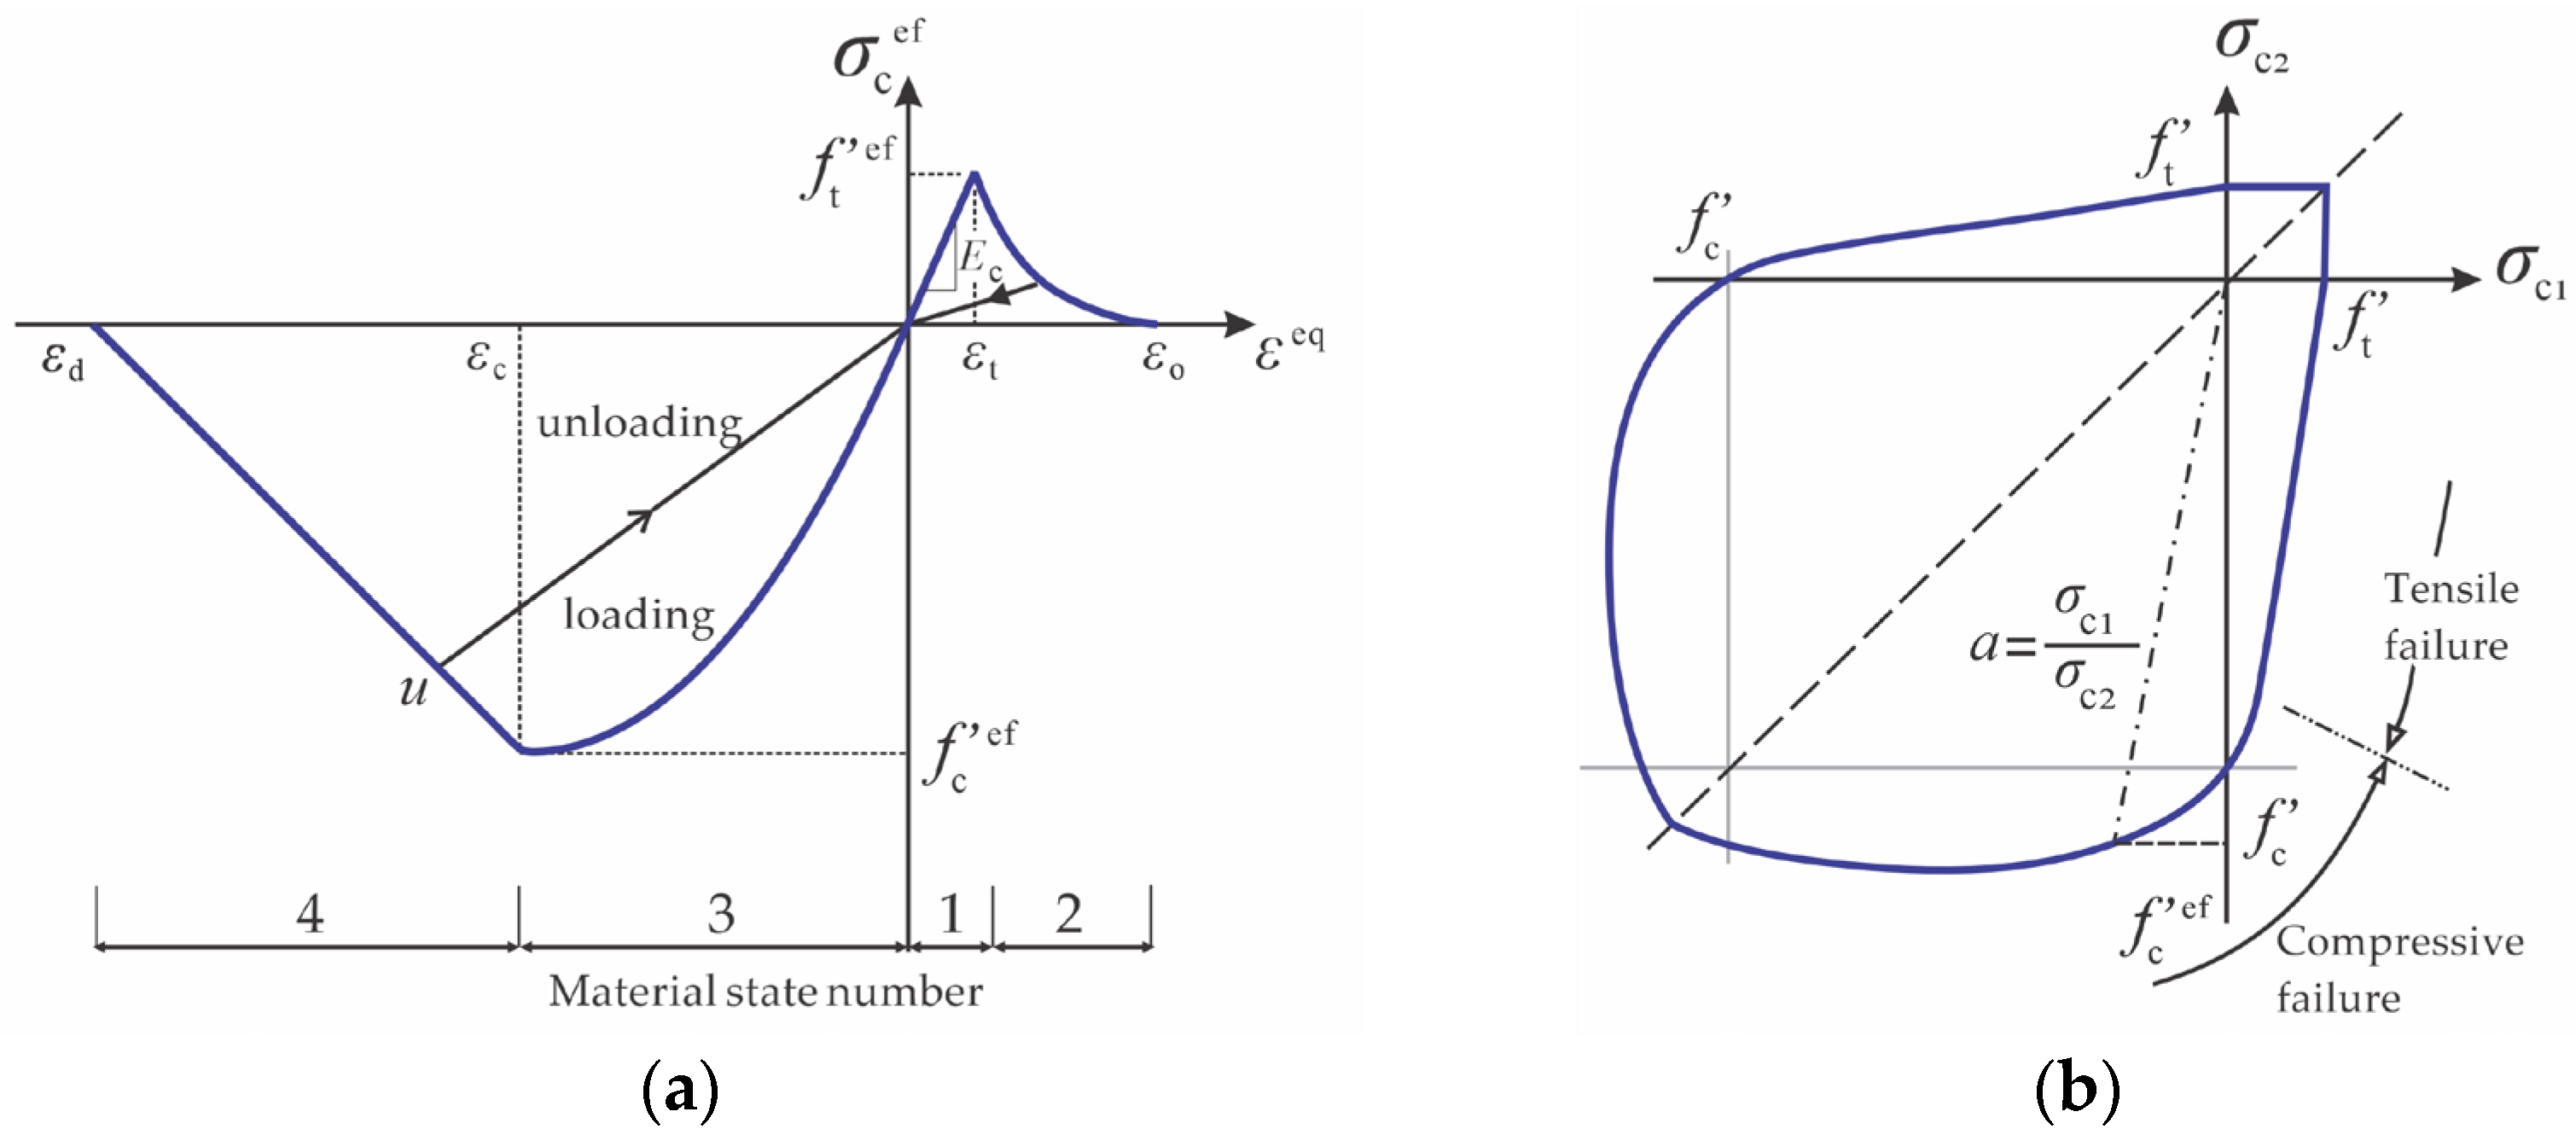
Figure 6a illustrates the full uniaxial stress–strain response of concrete, segmented into four characteristic phases that form the foundation for evaluating material degradation. The compressive behavior was modeled in accordance with the CEB-FIP code [62], which offers empirical formulations applicable to both normal and high-strength concrete. Post-peak softening under compression is captured by a linearly descending branch, reflecting the energy dissipation and strain localization effects inherent in quasi-brittle materials [60]. Under biaxial stress conditions, the nonlinear response is captured through an effective stress–equivalent strain formulation, denoted as σ c e f   and ε e q , respectively. The equivalent strain ε e q is derived from uniaxial test data, σ c i , scaled by the elastic modulus in the corresponding direction E c i , as expressed in Equation (1). This relationship is not universal but evolves based on the loading path and the unloading reference point U . Additionally, Figure 6b, based on the formulation by Kupfer et al. [63], presents the peak compressive and tensile stresses, f c e f and f t e f , under biaxial loading conditions, emphasizing the directional dependence and interaction effects inherent in multiaxial stress states.
ε e q = σ c i E c i
To more closely align the numerical model with observed experimental behavior, a variable shear retention factor was incorporated to account for the progressive loss of shear capacity as crack width increased [64]. This adjustment enables the simulation to reflect the degradation in concrete’s shear stiffness due to tensile fracturing. As illustrated in Figure 7, the parameter r g   represents the shear retention factor, which modifies the initial shear modulus G c of the uncracked concrete. The initial shear modulus is computed using the elastic modulus E c and Poisson’s ratio υ , as shown in Equation (2).
G c = E c 2 1 + ν
The shear stress acting along the crack interface, denoted as τ u v , is constrained by the tensile strength of the concrete f t , and evaluated through Equation (3), where G   represents the degraded shear modulus and γ corresponds to the applied shear strain. As outlined by Vos [65], the fracture energy G F quantifies the energy dissipation associated with crack propagation and is expressed in Equation (4), offering a robust framework for characterizing the energy demand required to advance a tensile crack through the concrete matrix.
τ u v = G γ
G F = 25   f t ( N / m )
In the simulation, concrete behavior was captured using the CC3DnonLinCementitious2 material model, implemented through eight-node solid elements. This constitutive model is well-suited to nonlinear analyses involving time-dependent effects, as it accommodates stiffness evolution during the pre-peak hardening phase and allows for the dynamic adjustment of material properties throughout the loading process. For this investigation, the necessary input parameters included compressive and tensile strengths, elastic modulus, Poisson’s ratio, fracture energy, and critical compressive displacement, as summarized in Table 1. While the compressive strength was derived directly from experimental testing [45,54] in accordance with ASTM C39/C39M-21 [66], the remaining parameters were estimated using empirical relationships and formulations reported in prior research and established design guidelines [56].

3.2.2. Steel Reinforcement and CFRP Materials

Mechanical properties for steel reinforcement were obtained from tensile testing conducted in accordance with ASTM A370-18 [67]; the results are summarized in Table 2. Within the ATENA FE framework, reinforcement is modeled using either discrete or smeared approaches. Discrete reinforcement involves explicitly defining individual steel bars as truss elements, while smeared reinforcement represents distributed reinforcement within composite zones. The smeared method may be applied as either a mesh-aligned reinforcement layer or an embedded phase within concrete elements. Both strategies assume uniaxial stress behavior and use consistent stress–strain relationships to ensure numerical compatibility and accuracy.
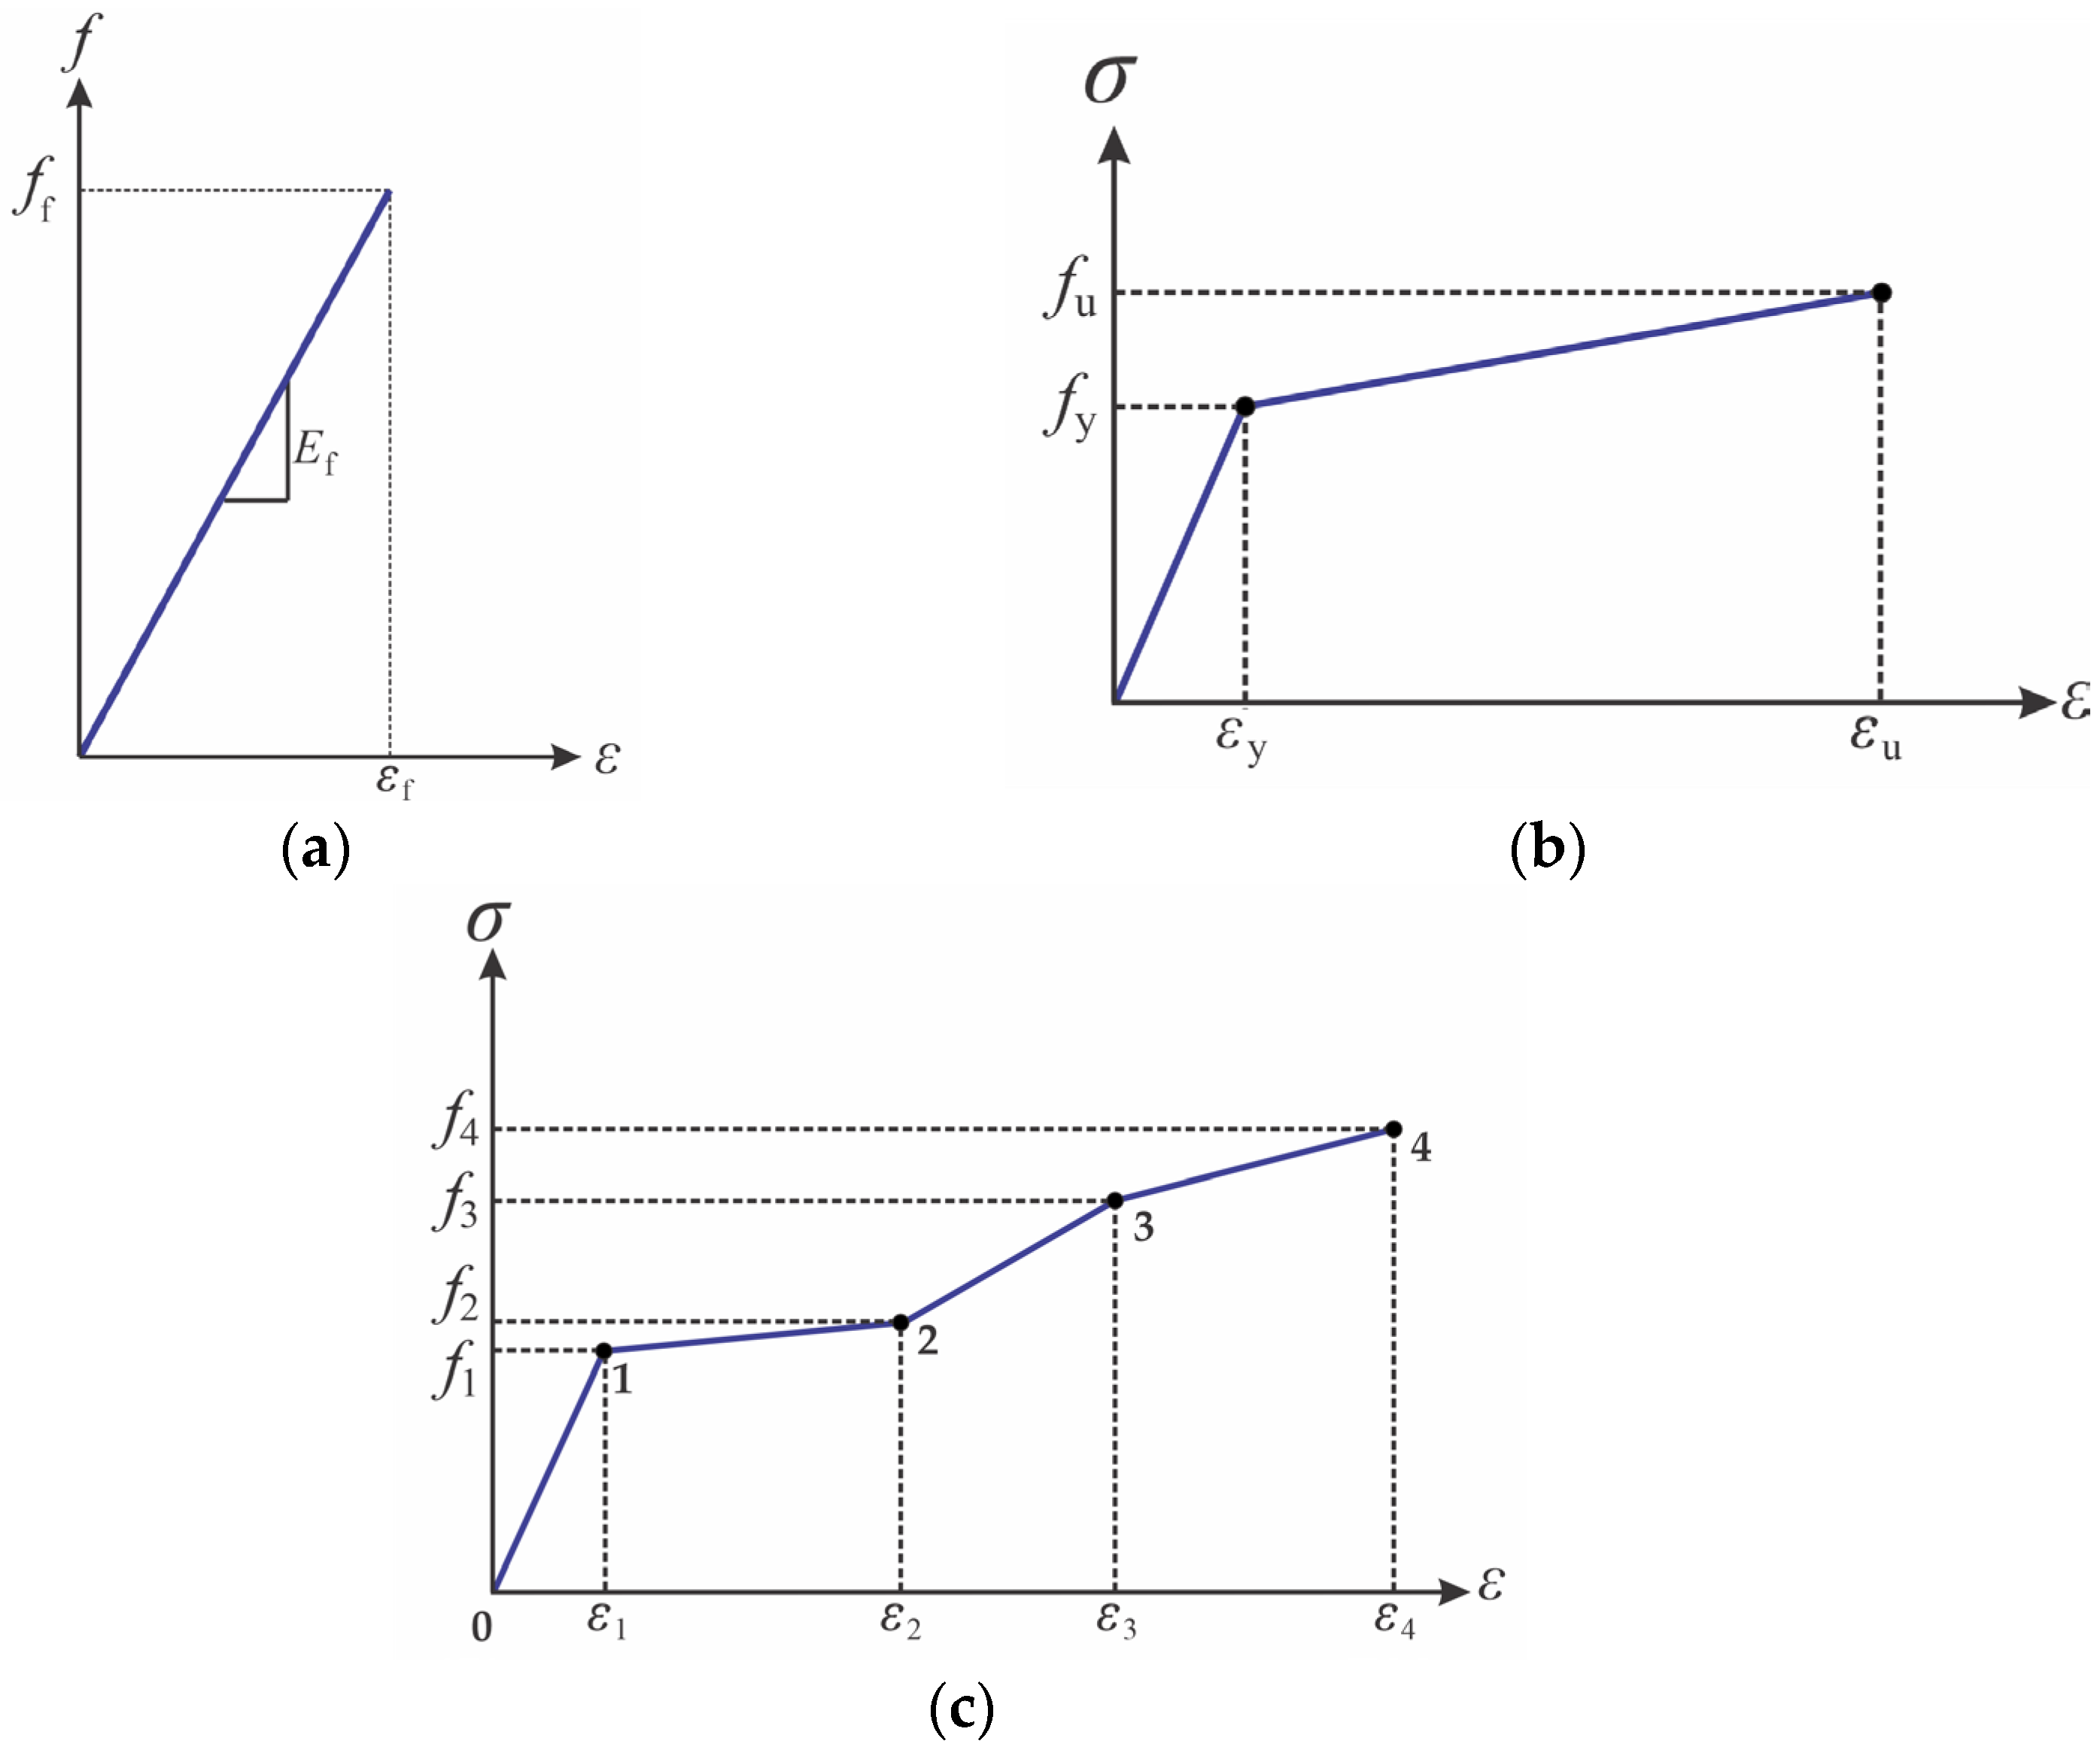
To simulate the axial behavior of longitudinal steel bars and CFRP rods, the two-node CCReinforcement element was employed. This element was configured to neglect compressive strength, making it suitable for materials like CFRP, which have limited compressive capacity due to anisotropic characteristics and local failure mechanisms, such as matrix cracking or fiber micro-buckling. The tensile response of CFRP was modeled as being linear elastic up to failure, as shown in Figure 8a, using the manufacturer-provided values: a tensile strength of 3100 MPa, an elastic modulus of 148 GPa, and an ultimate strain of 1.70%.
For concrete with integrated transverse reinforcement, the CCCombinedMaterial element was used. This eight-node element captures composite behavior in multiple directions and incorporates smeared stirrups and concrete in a single formulation. Stirrups followed a bilinear stress–strain law with strain hardening (Figure 8b), while longitudinal steel bars were assigned a multi-linear law capturing four behavioral phases: elastic, yielding, hardening, and fracture (Figure 8c).
The CFRP sheets were modeled using CCIsoShellBrick elements, which are thin-layered shell components designed to simulate composite surfaces with orthotropic behavior. Material properties, such as elastic modulus, tensile strength, and ultimate strain, were assigned based on manufacturer data, which specified a thickness of 0.131 mm, an elastic modulus of 234 GPa, a tensile strength of 4300 MPa, and an elongation at failure of 1.70%. Additional orthotropic properties were estimated based on the guidelines provided in TB-06-CRP-1 [68]. A linear elastic model was applied until failure (Figure 8a), governed by a maximum tensile strain criterion. To simplify modeling, a perfect bond was assumed at the CFRP–concrete interface, supported by the absence of debonding observed during experimental testing.

3.2.3. Loading and Supporting Components

The steel plates used for loading and support, each 20 mm thick, were modeled using the CC3DElastIsotropic element, a four-node solid element with four integration points, suitable for simulating isotropic elastic behavior under load. Due to its robust formulation, this element captures linear elastic responses using a single material parameter: the elastic modulus of steel, specified as 200 GPa. The assumption of purely elastic behavior was applied throughout the analysis, as the plates were not expected to yield. This modeling approach ensures computational efficiency whilst accurately representing load transfer and boundary conditions but without introducing unnecessary complexity into the simulation.

3.3. Boundary Conditions and Output Monitoring

In order to simulate realistic support conditions, boundary constraints were applied to replicate the actual behavior of the tested inverted specimens. Vertical restraint was introduced through the Constraint for Line function, assigned along the central axis of the supporting steel plate, as illustrated in Figure 9a. To represent the experimental setup in which the T-beam was inverted to induce negative flexural action, the loading point was applied on the flange face, generating tensile stresses in the slab region consistent with negative moment conditions. To reduce computational demand, quarter-span symmetry was adopted, with additional constraints introduced via the Constraint for Surface function so that the reduced model reproduced the global response of a full-span beam. Symmetry was enforced at the mid-span cross-section by prescribing displacements in both the x and z directions, as shown in Figure 9b.
To accurately track the nonlinear load–displacement response of the beam models, two key monitoring points were defined within the finite element setup. As shown in Figure 10a, the first point was placed on the upper surface of the loading plate to record the applied vertical reaction force, while the second point, located at the mid-span on the underside of the inverted beam, captured the maximum vertical deflection (Figure 10b).
This configuration reproduced the experimental setup, where a single concentrated load was applied at mid-span under three-point bending to generate negative flexural action in the slab region. The simulation employed a displacement-controlled loading protocol, with the vertical deformation of the loading plate incremented in 0.1 mm steps, ensuring stable convergence and enabling the analysis to trace the structural response through the full loading history until failure.

3.4. Solution Strategy

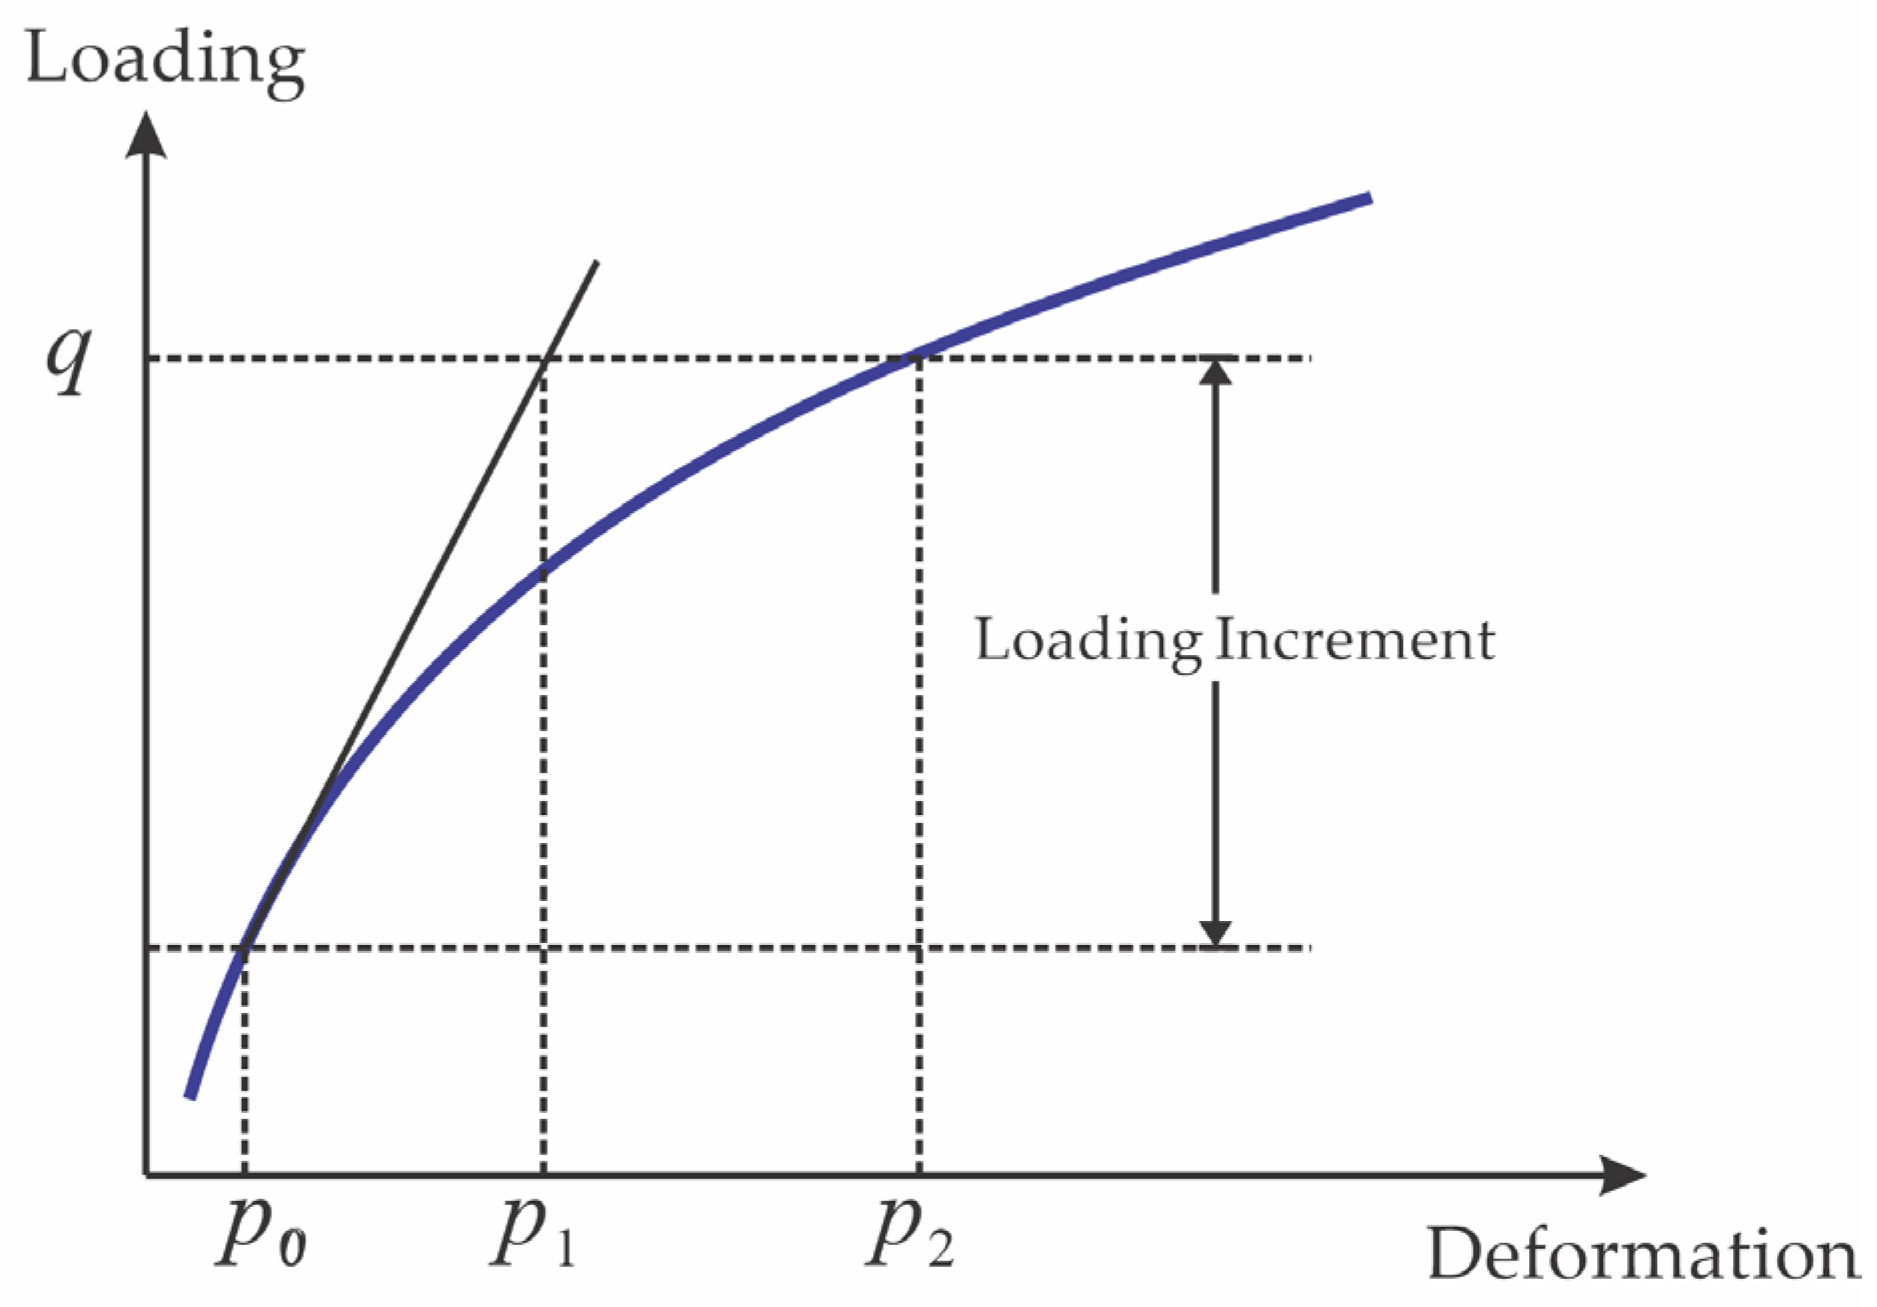
To simulate the nonlinear response of the beam models, a hybrid solution strategy, combining the Newton–Raphson algorithm with displacement-controlled loading, was employed. As illustrated in Figure 11, this method evaluates convergence by calculating the residual imbalance between the externally applied load increment and the internal element forces from the preceding iteration step [56].
Through parametric evaluation, a displacement increment of 0.05 mm was identified as optimal, providing sufficient resolution for capturing post-peak behavior whilst maintaining numerical stability. Step sizes exceeding this threshold often led to divergence or erratic outputs, whereas smaller increments improved convergence reliability and solution accuracy. Convergence thresholds for both residual force and displacement errors were set at 0.01, offering a practical balance between computational efficiency and modeling fidelity.

4. Results and Discussion

4.1. Summary of Experimental Findings

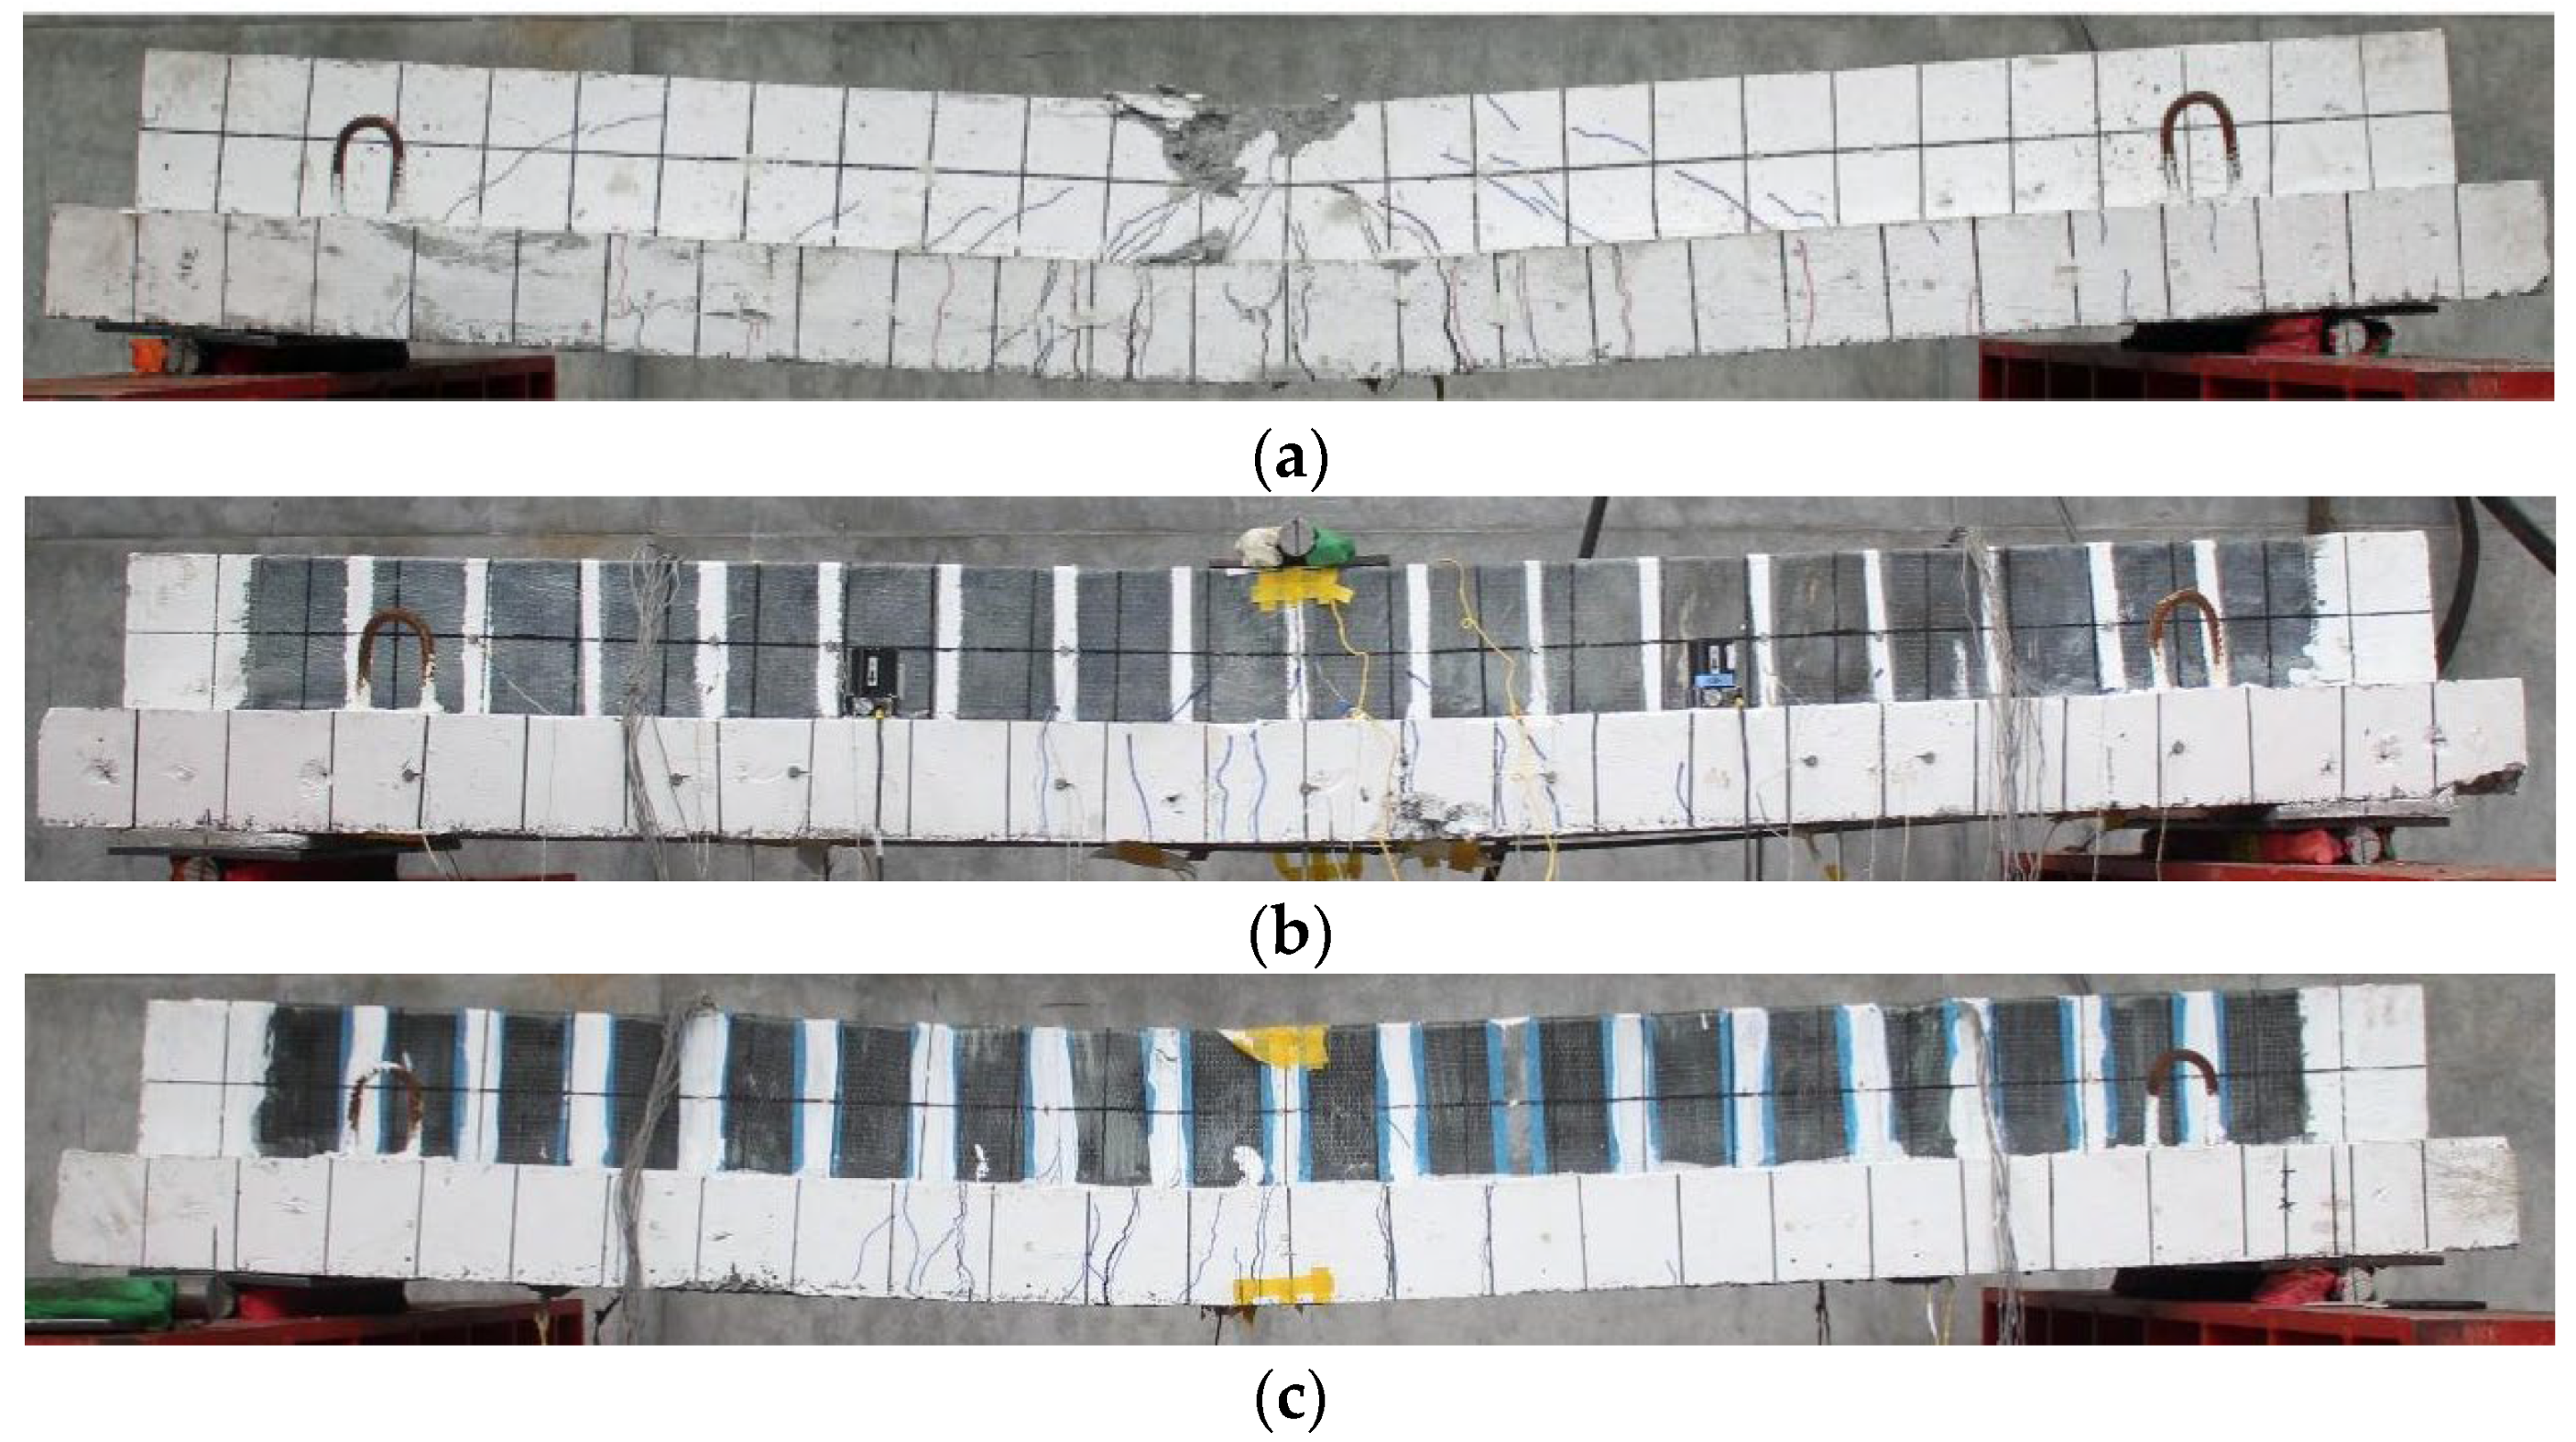
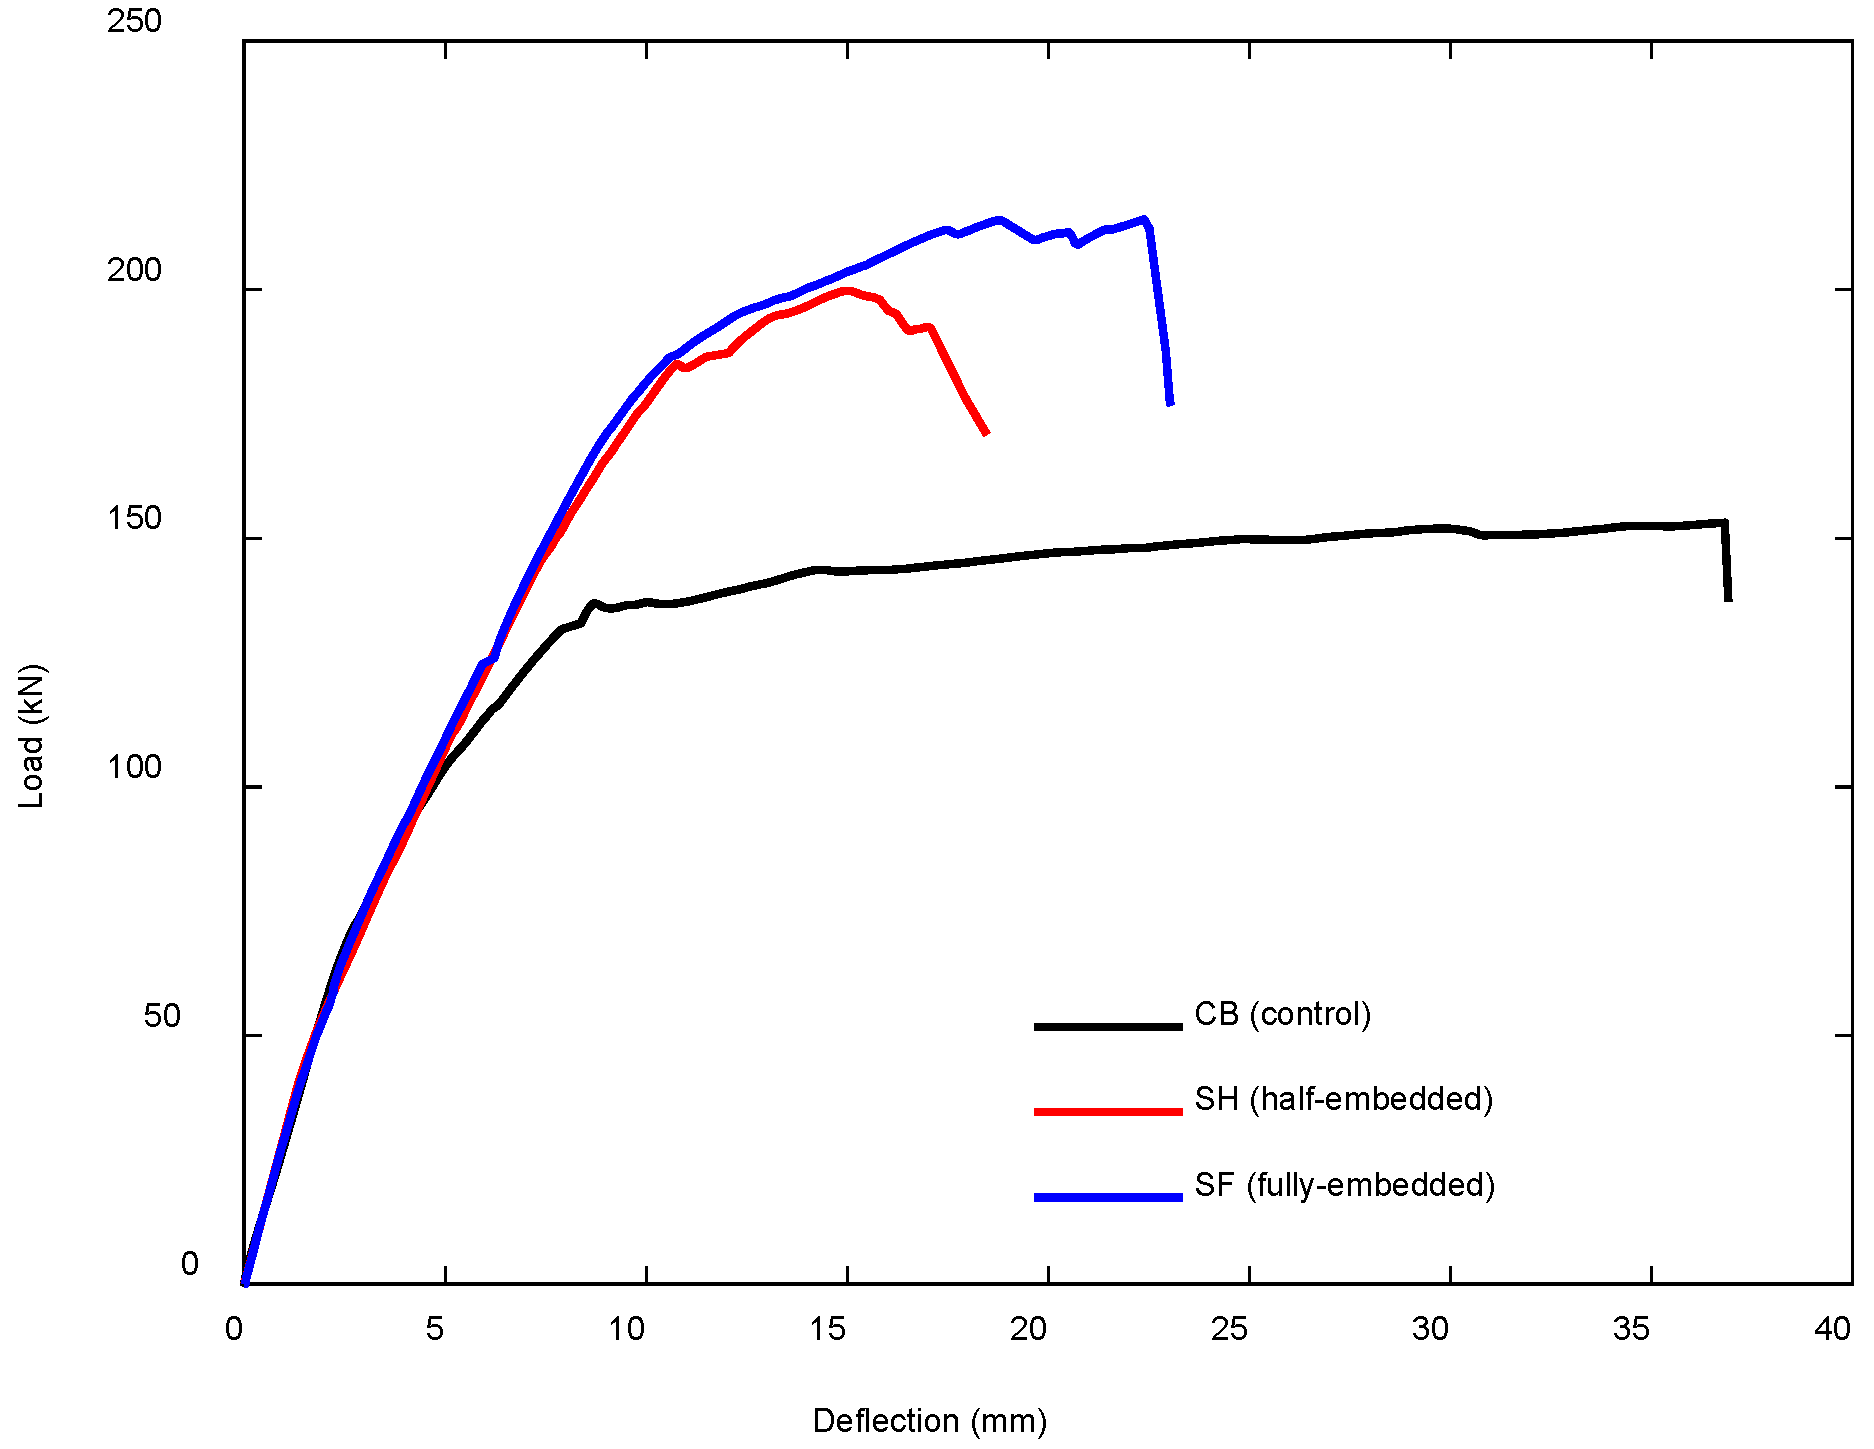
The control beam specimen (CB), which was not retrofitted, mainly failed due to tensile-induced flexural cracking. Initial cracking was observed near the mid-span at an applied load of 42.43 kN. As loading progressed, these cracks propagated upward toward the compression zone, accompanied by widening crack widths and a noticeable decline in flexural stiffness, as illustrated in Figure 12. Yielding of the tensile reinforcement occurred at 131.75 kN, marking the onset of large inelastic deformations with minimal gain in load-carrying capacity. This behavior resulted in a distinct plateau region on the load–deflection response curve. The final crack pattern, shown in Figure 13a, reveals extensive flexural damage, with cracks eventually penetrating the full section depth. Complete failure was reached at 153.14 kN when the flexural cracks fully developed and compromised the beam’s structural integrity.
For the SH specimen, which was retrofitted using half-embedded NSM CFRP rods, the initial flexural crack developed at an applied load of 46.51 kN. As loading progressed, additional flexural cracks formed and extended vertically, although none exceeded a depth of 210 mm from the tension face, primarily concentrated near the mid-span region. The final crack distribution is presented in Figure 13b. Yielding of the tensile steel reinforcement occurred at 178.96 kN, initiating a gradual stiffness degradation, as evident in the load–deflection response shown in Figure 12. Despite this, the beam continued to gain load capacity with increasing deflection. At 187.23 kN, partial debonding and relative slip between the CFRP rod and surrounding concrete were observed. The specimen ultimately failed at 199.80 kN, marking the limit of its flexural capacity under the given strengthening configuration.
In the SF specimen, strengthened with fully embedded NSM CFRP rods, the initial flexural crack appeared at a load of 51.25 kN. As the external load increased, multiple flexural cracks emerged and developed progressively along the beam depth. Yielding of the longitudinal tensile reinforcement occurred at 182.33 kN, initiating a gradual decline in stiffness, as reflected in the load–deflection response shown in Figure 4. At 210.00 kN, audible signs of slip were detected, suggesting local movement at the CFRP–concrete interface; however, post-test inspection confirmed that the CFRP rods remained fully bonded. The beam continued to carry additional load with increasing mid-span deflection, eventually reaching a peak load of 214.13 kN. At this stage, cracks had propagated to a depth of approximately 210 mm near the mid-span, as depicted in the crack pattern shown in Figure 13c.

4.2. Comparison Between Numerical and Experimental Results

Comparing numerical simulations with experimental results is a critical step in model validation, as it ensures the reliability and accuracy of FE analyses. This process helps identify modeling limitations, guide parameter calibration, and strengthen the robustness of predictive simulations, while also confirming the model’s practical applicability to design standards. In this study, the FE models were validated through a staged process against two independent experimental programs. First, the models were benchmarked against the global response of UHPC-strengthened RC T-beams reported by Nugroho et al. [69], demonstrating their ability to reproduce overall flexural behavior. Validation was then extended to the detailed experimental data of Haryanto et al. [45,54], which confirmed the models’ accuracy and provided a robust foundation for the subsequent parametric analyses.

4.2.1. UHPC-Strengthened RC T-Beams by Nugroho et al. [69]

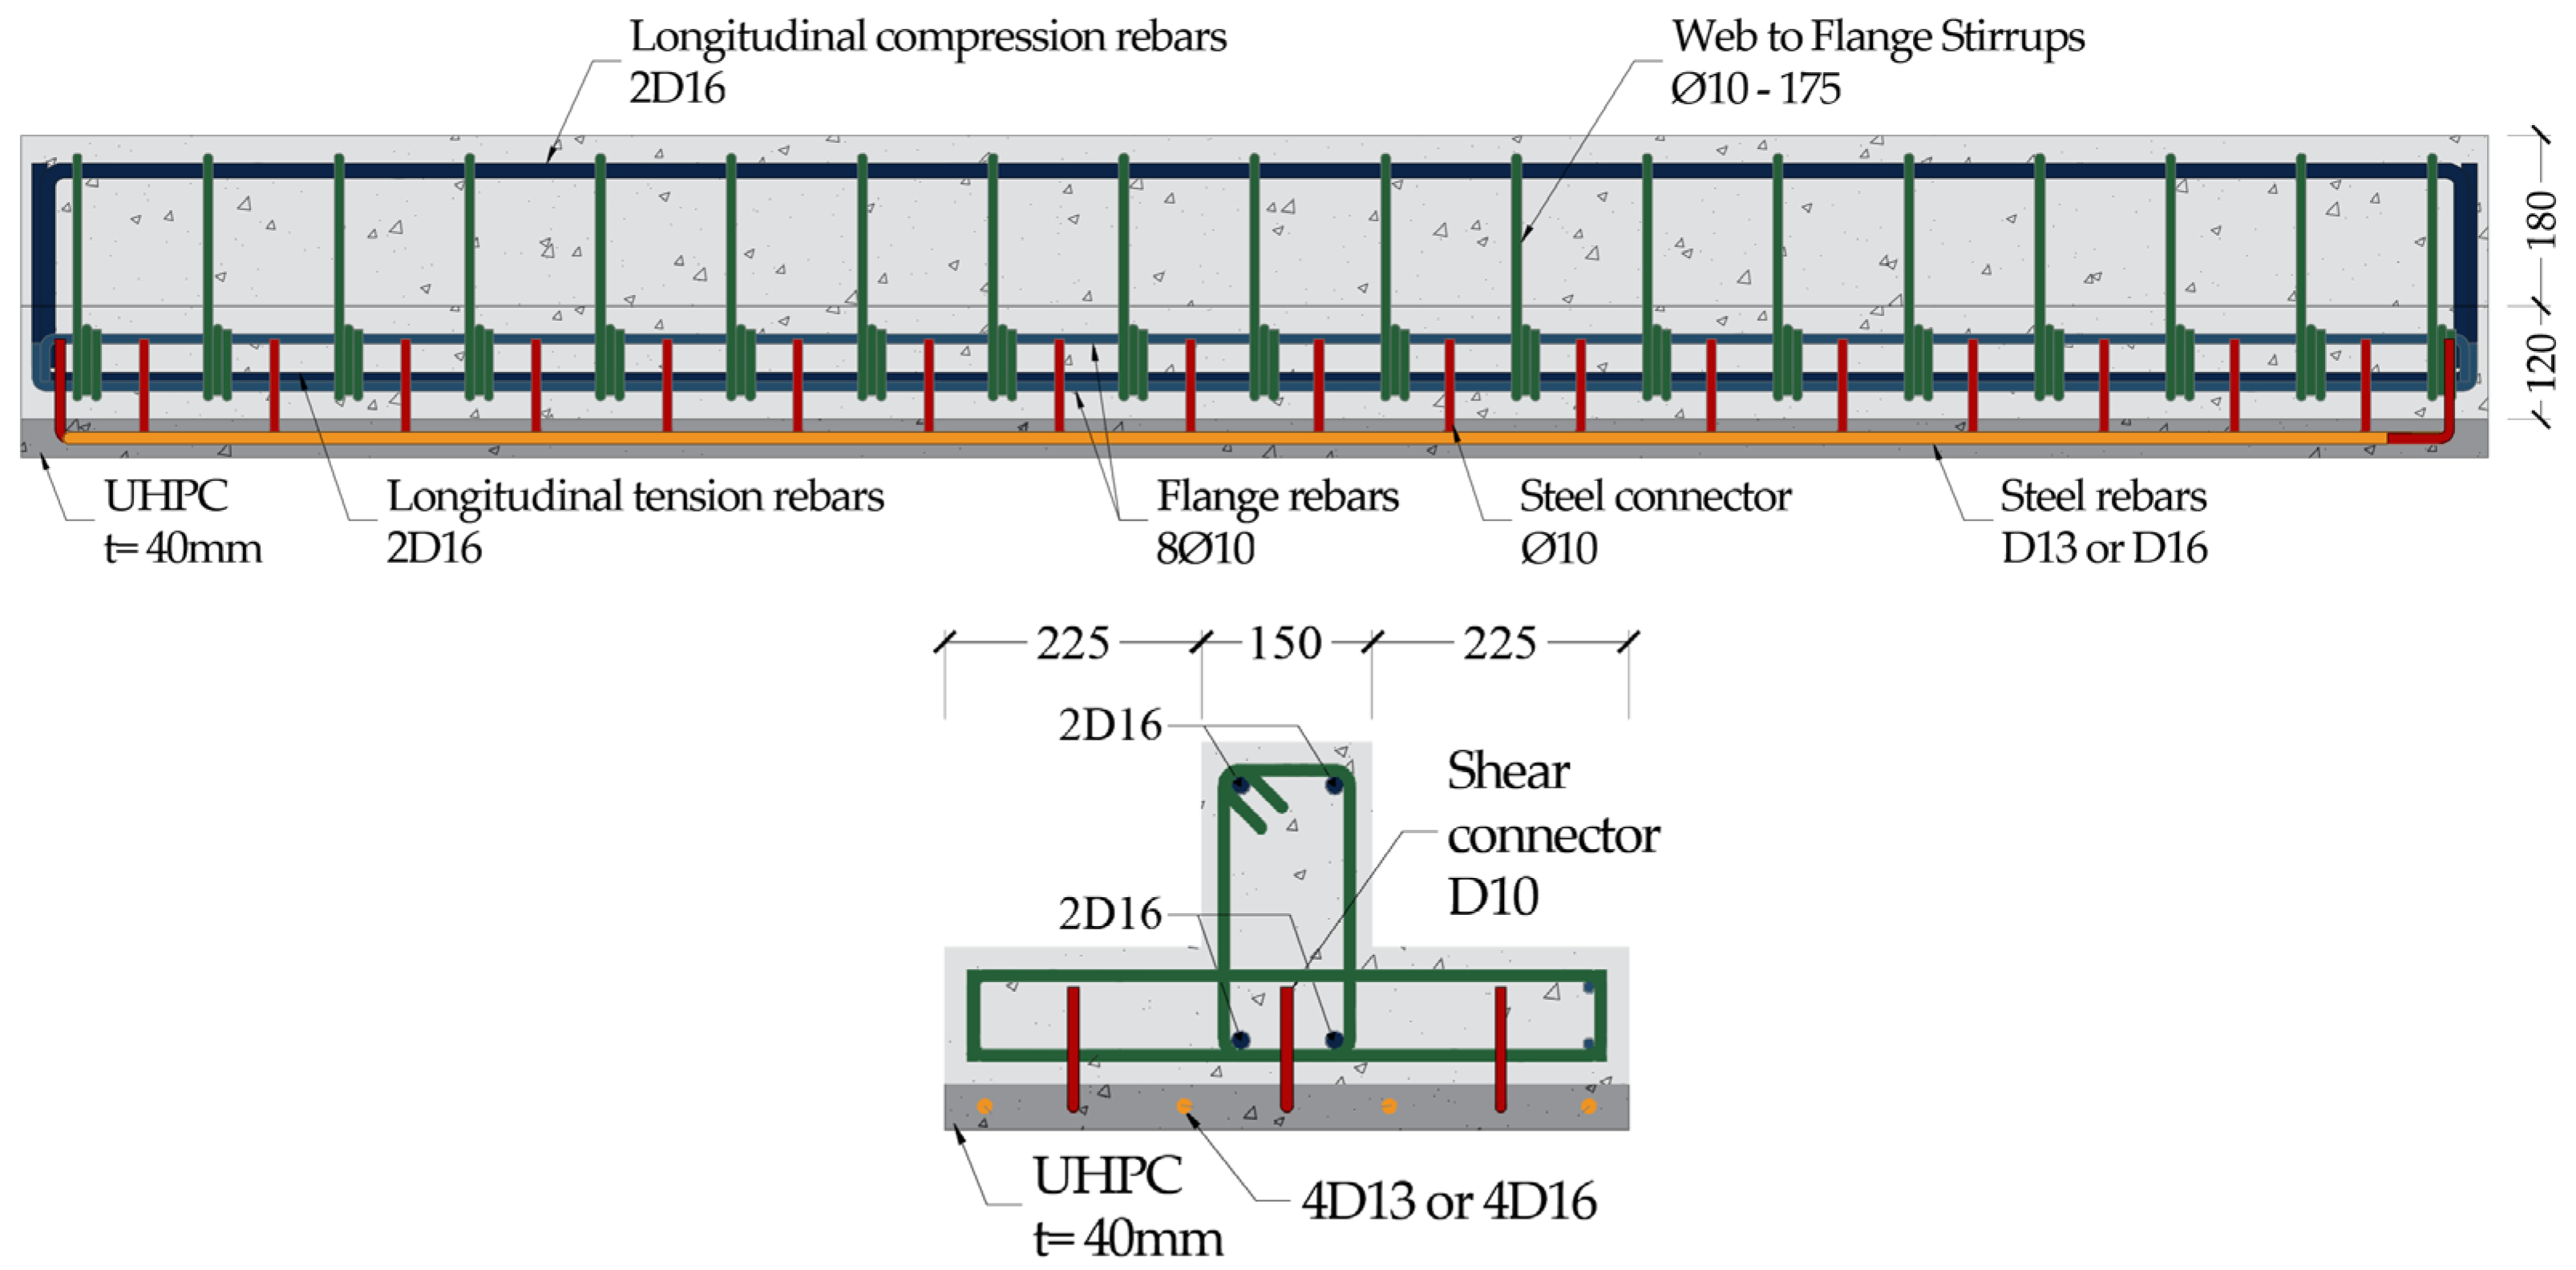
Nugroho et al. [69] investigated the flexural strengthening of RC T-beams in the negative moment region using UHPC overlays reinforced with steel rebars. In their study, three beams with identical dimensions (3300 mm in length, 600 mm flange width, 150 mm web width, 120 mm flange thickness, and 300 mm total depth) were fabricated and tested. The control specimen (UB) was left unstrengthened to establish the baseline behavior, while the other two beams were retrofitted with a 40 mm-thick UHPC layer applied along the tensile flange. To examine the influence of reinforcement within the UHPC overlay, deformed rebars with diameters of 13 mm (SB-U13) and 16 mm (SB-U16) were embedded in the strengthened beams. All specimens were detailed with D16 longitudinal rebars in the web, Ø10 flange reinforcement, and Ø10 stirrups spaced at 175 mm to prevent shear failure, as illustrated in Figure 14. The experimental results served as a benchmark for validating the numerical models, particularly in assessing the influence of UHPC overlays with different reinforcement sizes on the overall structural behavior in the negative moment region.
To enhance computational efficiency without compromising accuracy, the FE model was configured to represent only one-quarter of the beam by exploiting geometric and loading symmetry. This reduction in model size significantly decreased the number of mesh elements and shortened analysis time. Steel reinforcement was represented discretely using the CCReinforcement element, ensuring an accurate simulation of axial response. The loading plate and supports from the experimental setup were modeled as elastic isotropic solids using CC3DElastIsotropic, defined with an elastic modulus of 200,000 MPa and a Poisson’s ratio of 0.3. Transverse reinforcement was incorporated through the CCCombinedMaterial element in conjunction with the CCSmearedReinf model, thereby capturing the composite action of stirrups embedded in concrete. The bulk concrete itself was assigned to a nonlinear constitutive law using CC3DnonLinCementitious2, which enables the representation of cracking, crushing, and stiffness degradation under monotonic loading.
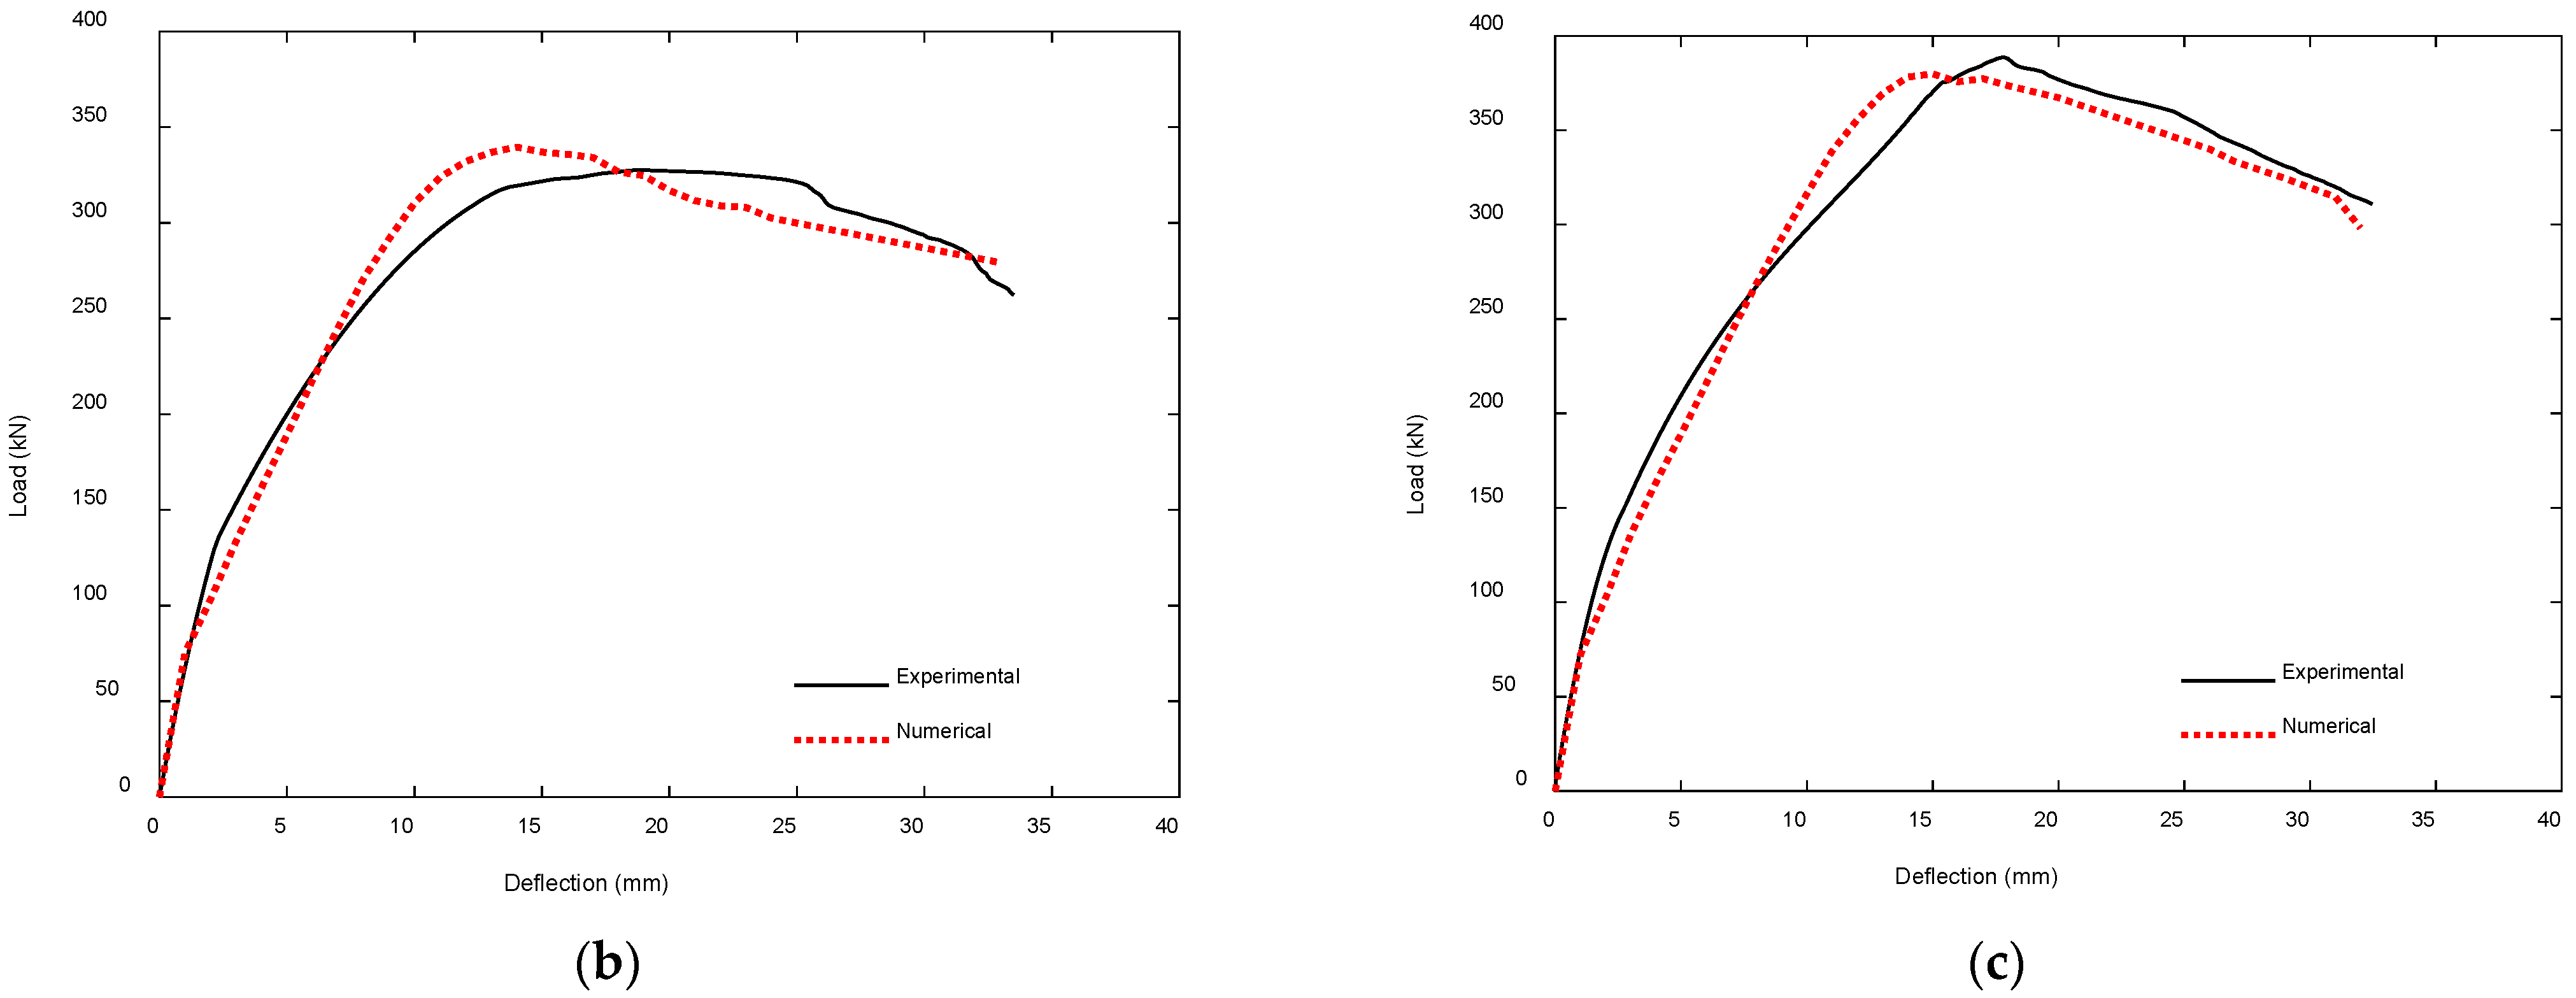
The experimental results and the FE predictions for each beam configuration are compared in Figure 15. The FE simulations closely reproduced the experimental mid-span load–deflection responses, successfully capturing both the load progression and the stiffness behavior of the beams. A notable limitation, however, was the absence of a clearly defined yield point in the strengthened specimens. This can be attributed to the modeling assumption of a perfect bond between steel and concrete, as well as between the beam and the UHPC overlay. By neglecting bond slip, the models tended to overestimate stiffness in the deflection range of approximately 8–15 mm, delaying the apparent onset of yielding until the peak load was reached.
Despite this limitation, the maximum flexural capacities were predicted with a high degree of accuracy. The ultimate loads obtained from the FE analyses were 175.12 kN for the unstrengthened beam (UB), 339.63 kN for the beam strengthened with 13 mm rebars in the UHPC layer (SB-U13), and 379.88 kN for the specimen with 16 mm rebars (SB-U16). These values aligned closely with the corresponding experimental measurements, as summarized in Table 3, with only minor deviations observed. To further quantify model accuracy, the normalized mean square error (NMSE) was employed as a statistical indicator [70,71], calculated at load intervals of 2 mm using experimental results as the reference baseline. The low NMSE values reported in Table 3 confirm that the discrepancies remained within acceptable bounds, demonstrating that the FE models provide a robust and reliable tool for investigating the flexural performance of UHPC-strengthened RC T-beams beyond the experimental scope.

4.2.2. CFRP-Strengthened RC T-Beams by Haryanto et al. [45,54]

  • Unstrengthened Control Beam (CB)
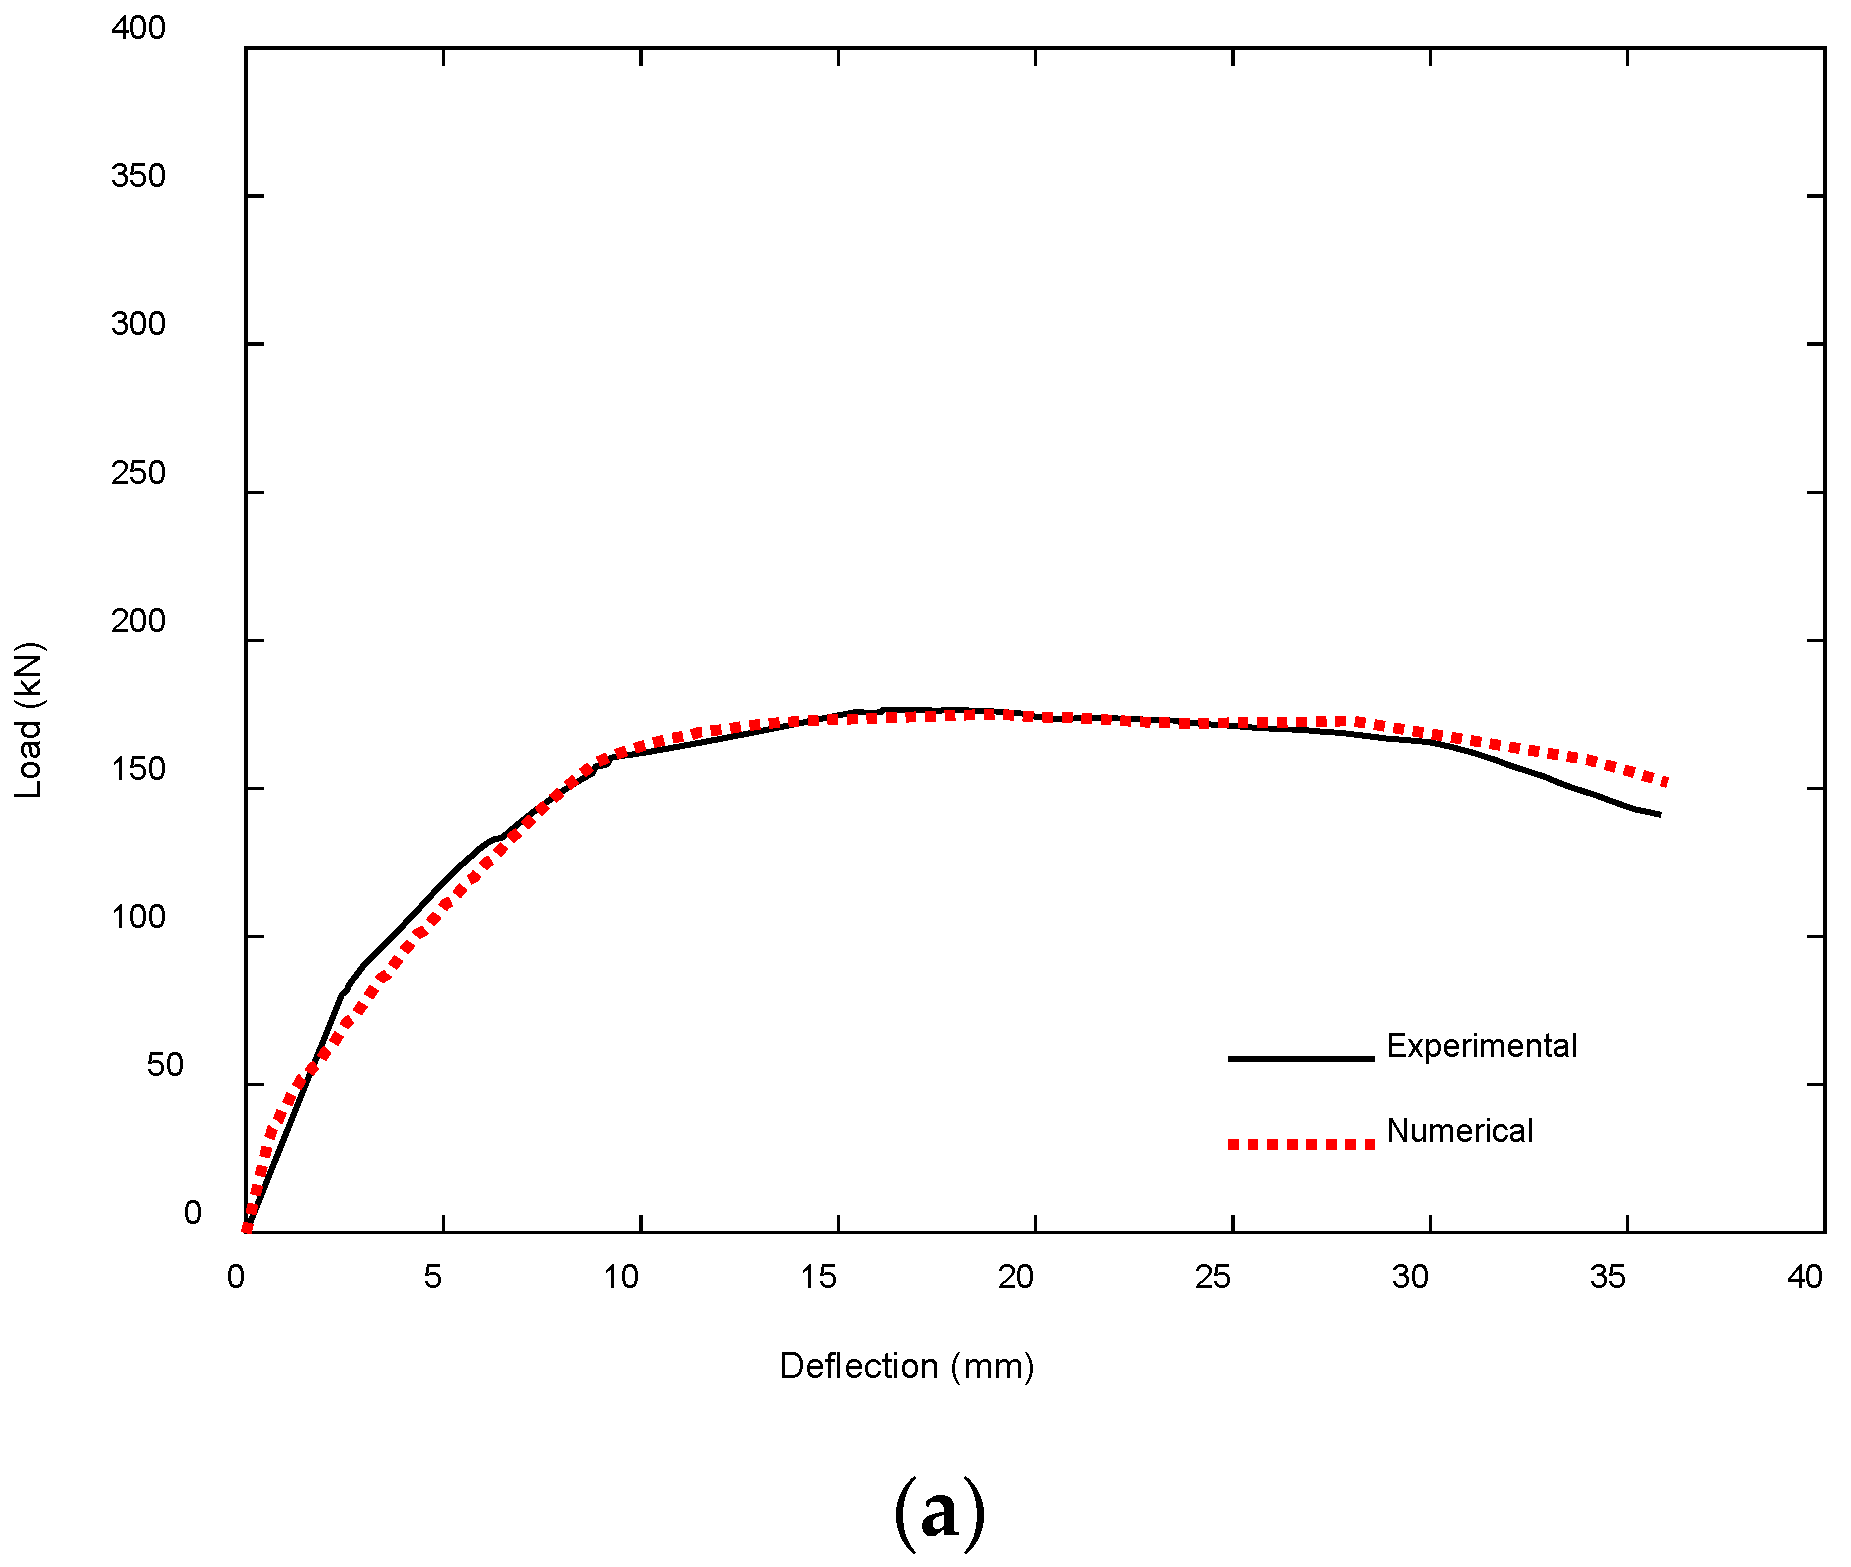
Figure 16 illustrates the comparative load–displacement behavior of the control beam (CB) obtained from both experimental testing and numerical simulation. The FE model accurately reflects the beam’s flexural response across all key phases, from the initial elastic region through yielding and into the post-yield softening domain. The close alignment between the predicted and observed curves highlights the model’s robustness in capturing structural behavior governed by bending. To quantitatively evaluate the model’s accuracy, the NMSE was calculated using discrete load values at 2 mm displacement intervals, referencing the experimental results as the baseline. The resulting NMSE value of 0.03% indicates an excellent degree of accuracy, confirming the model’s credibility for simulating the physical characteristics of RC T-beams.
In addition to accurately reproducing the overall load–displacement response, the FE model reliably captures key physical response characteristics of the unstrengthened control beam. As presented in Table 4, the predicted ultimate load (154.00 kN) and deflection at failure (36.81 mm) show excellent agreement with the experimental values (153.14 kN and 36.82 mm, respectively). Stiffness and energy absorption also align closely, with numerical-to-experimental ratios of 0.99 and 1.00. Notably, the ductility index was replicated with near-perfect accuracy, reflecting the model’s strong capability to simulate post-yield deformation behavior. The average parameter ratio of 0.99 underscores the robustness of the model in representing the structural behavior under monotonic flexural loading, affirming its validity for use in advanced simulations and strengthening evaluations.
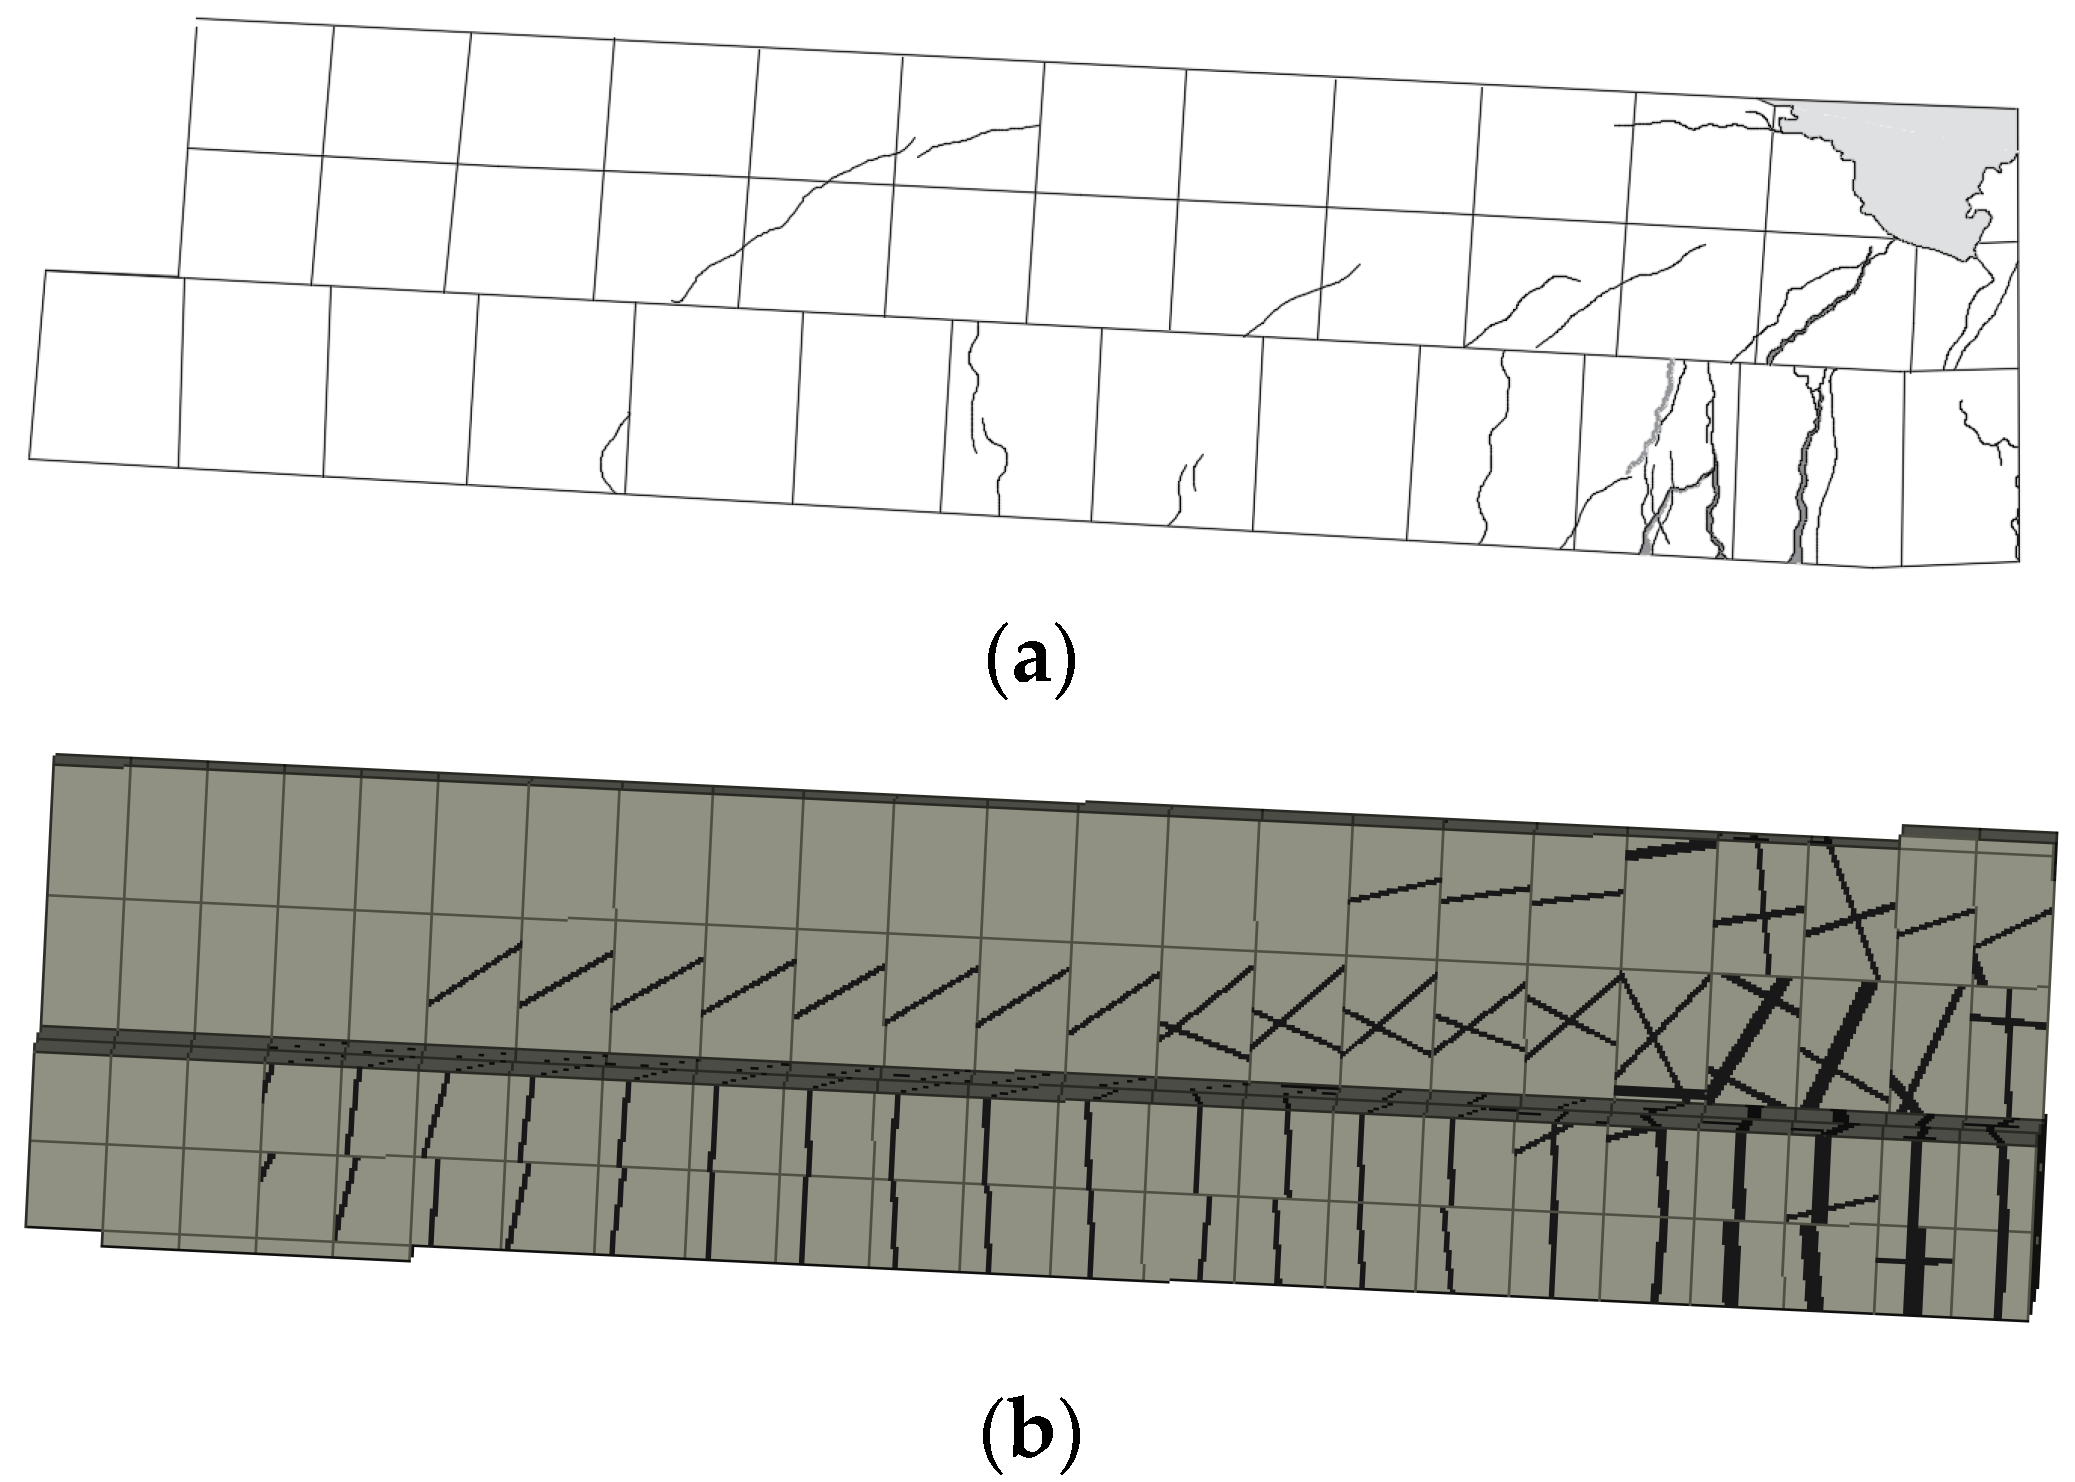
Figure 17 presents the comparison of final crack configurations derived from the FE simulations and the experimental testing. Both reveal the initiation of flexural cracks at the bottom face near the mid-span, where the maximum bending moment occurs, and their upward propagation with increasing load. The spatial distribution, orientation, and depth of the cracks captured by the numerical model correspond closely to those observed in the physical specimen. This agreement validates the ability of the damage modeling approach to replicate localized cracking behavior under bending. Furthermore, the similarity in failure mode between the two methods confirms that flexure, rather than shear or anchorage failure, governed the structural response of the control beam.
2.
Half-Embedded NSM CFRP-Strengthened Beam (SH)
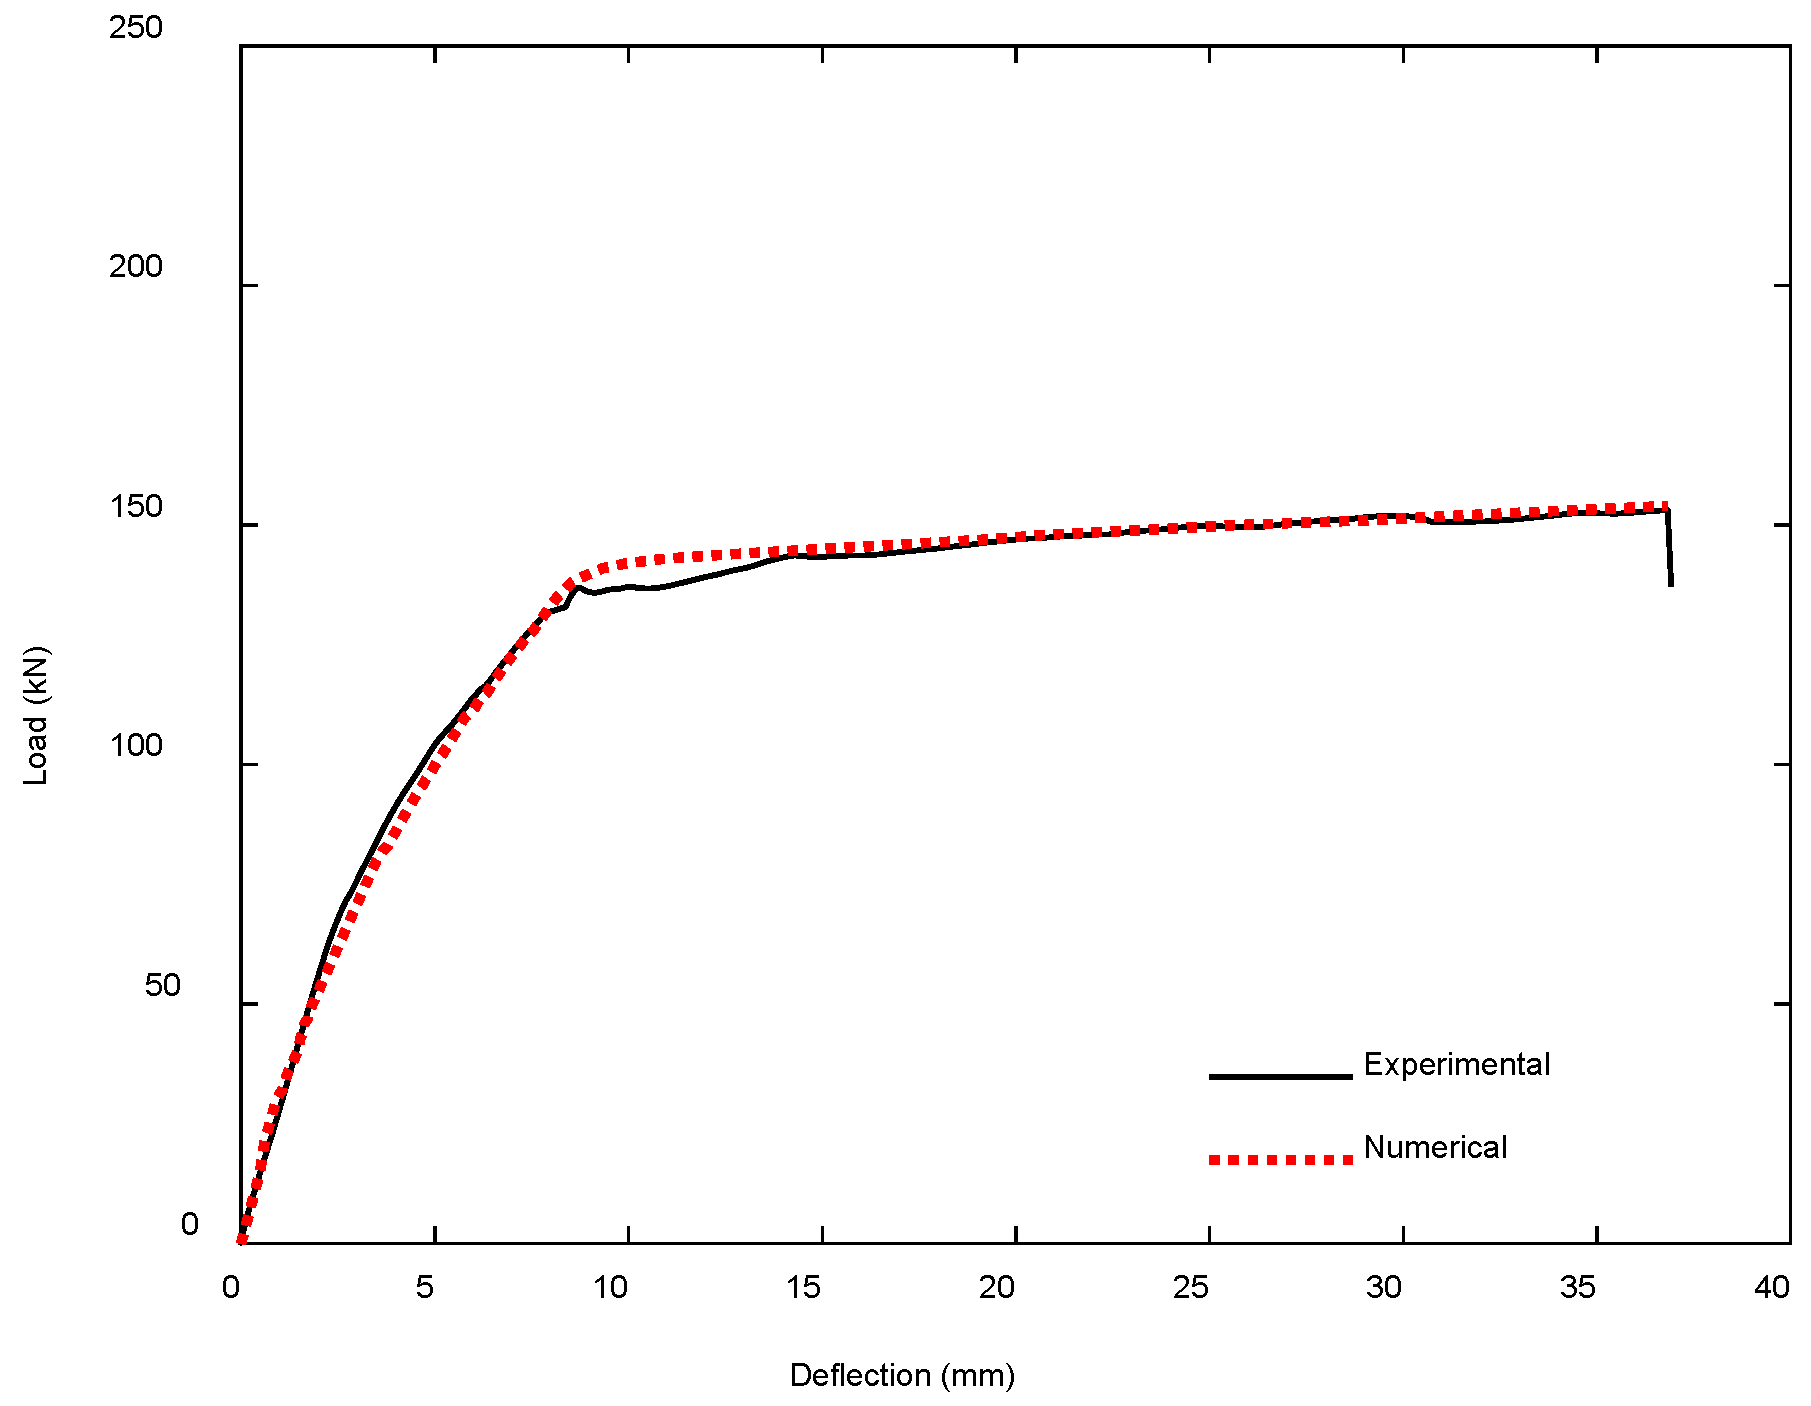
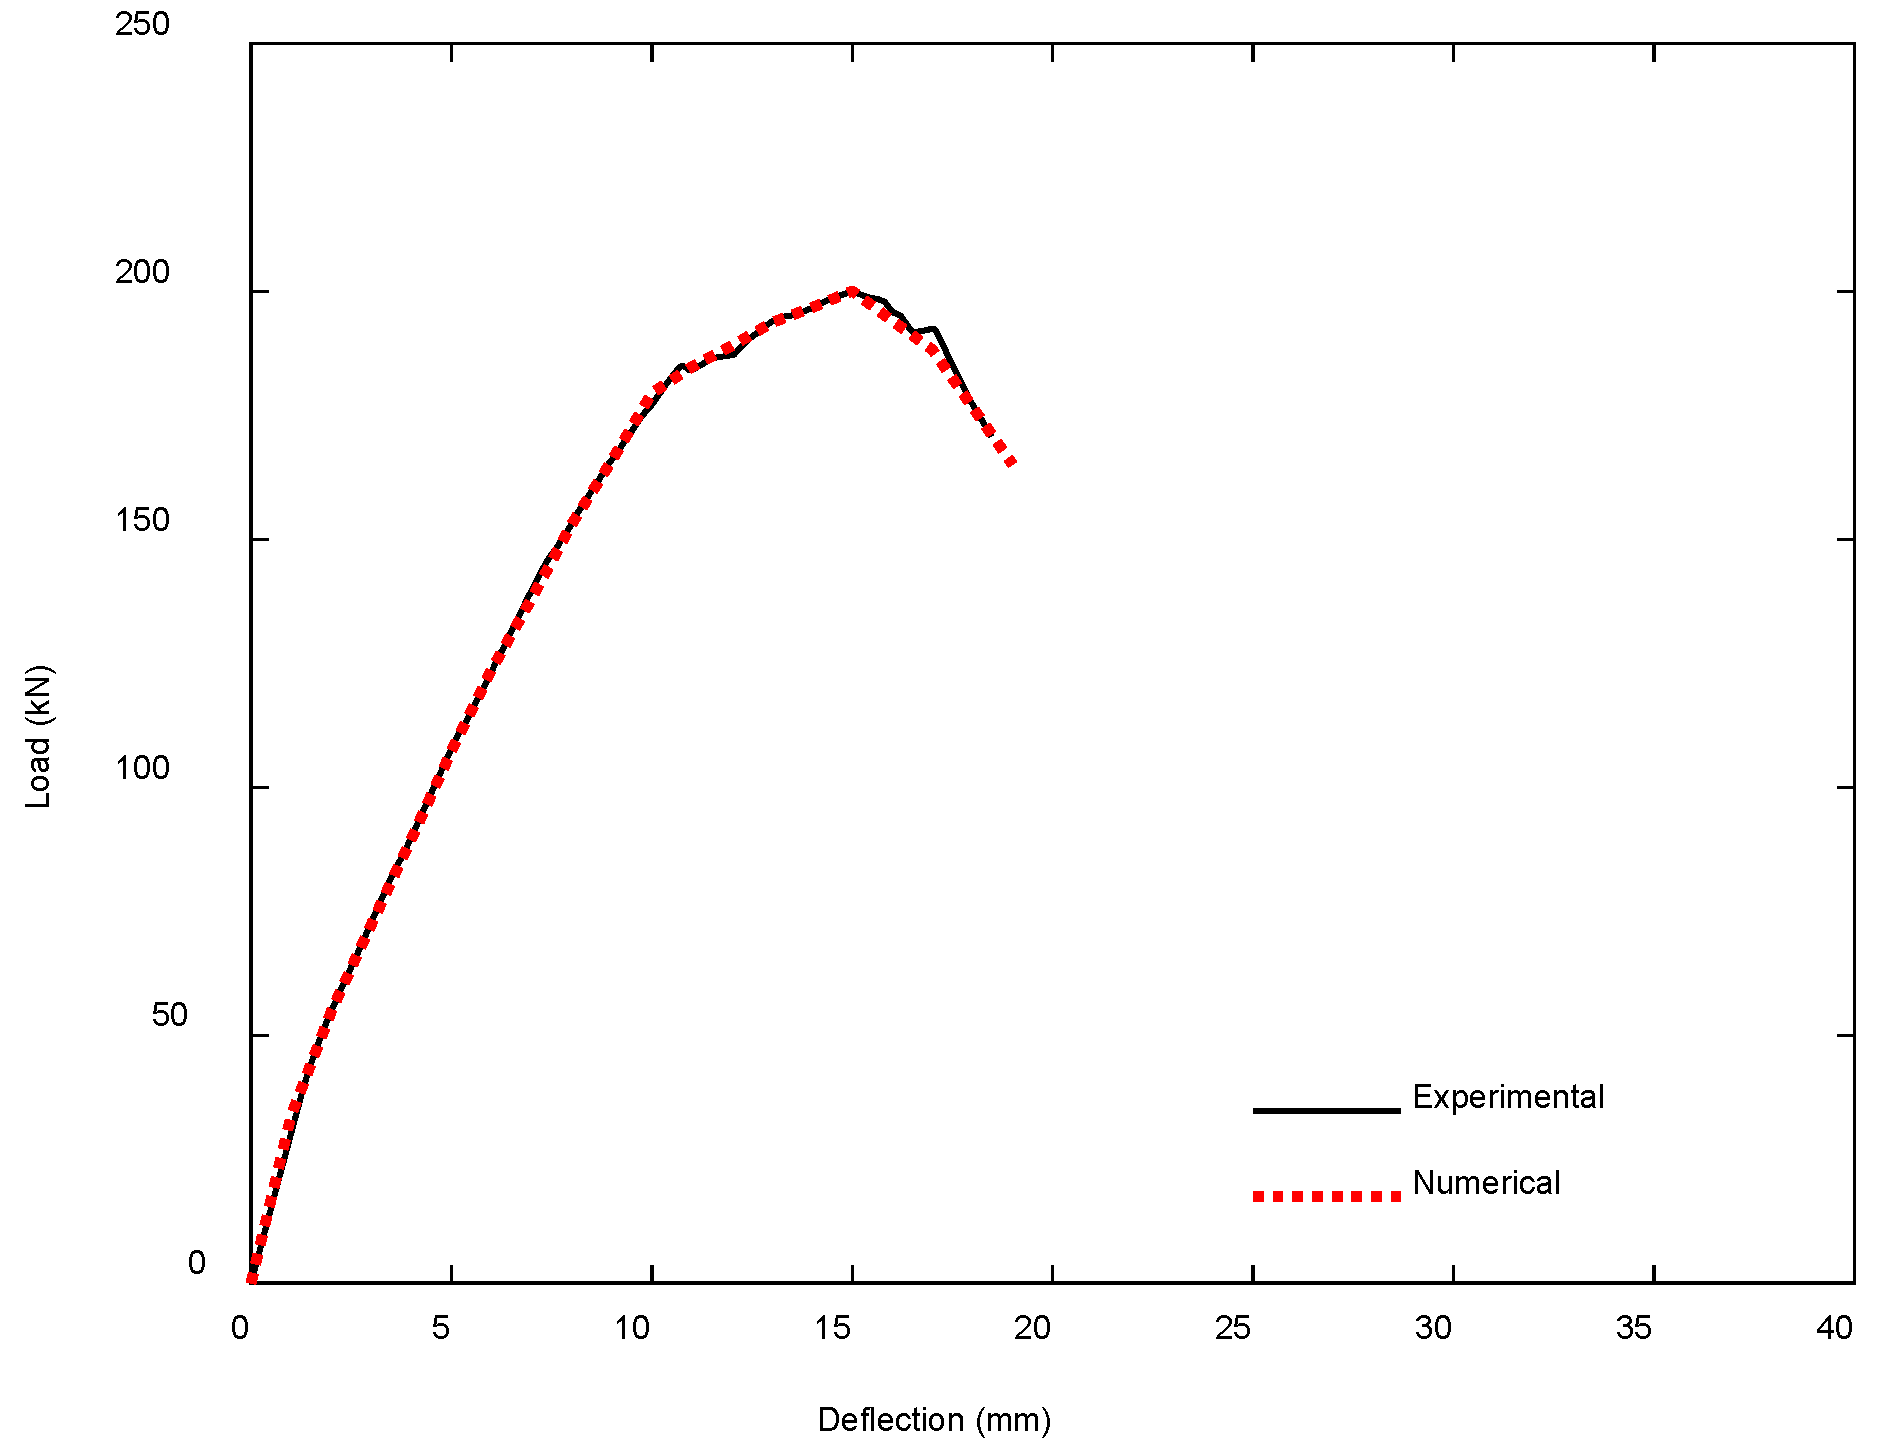
Figure 18 showcases the comparative load–deflection behavior of the half-embedded CFRP-strengthened beam (SH), evaluated through both experimental observation and FE simulation. The numerical model displays a high degree of precision in reproducing the nonlinear response of the beam, accurately tracing the stiffness, yield progression, and post-yield degradation phases. The close proximity between the experimental and simulated curves underscores the model’s capability in capturing the mechanical characteristics of partially strengthened RC members. The accuracy of the simulation was quantitatively verified using the NMSE, which was computed based on discrete load values at 2 mm deflection increments. With an NMSE value of 0.01%, the model demonstrates exceptional predictive accuracy for this strengthening configuration.
Beyond reproducing the general load–deflection behavior, the FE model also showed a high level of consistency with the experimental data in terms of essential structural parameters. Table 5 shows that the predicted peak load (200.12 kN) differed by only 0.16% from the experimental value (199.80 kN), while the ultimate displacement showed near-identical agreement (15.00 mm vs. 14.97 mm). Although the model slightly overestimated stiffness by 6.4%, ductility measures remained consistent, with a ratio of 0.98. Energy absorption was modestly overpredicted (2724.14 kN.mm vs. 2639.61 kN.mm), yielding a ratio of 0.97. The overall average parameter ratio of 0.96 confirms the FE model’s effectiveness in capturing the physical behavior of the half-embedded CFRP-strengthened beam.
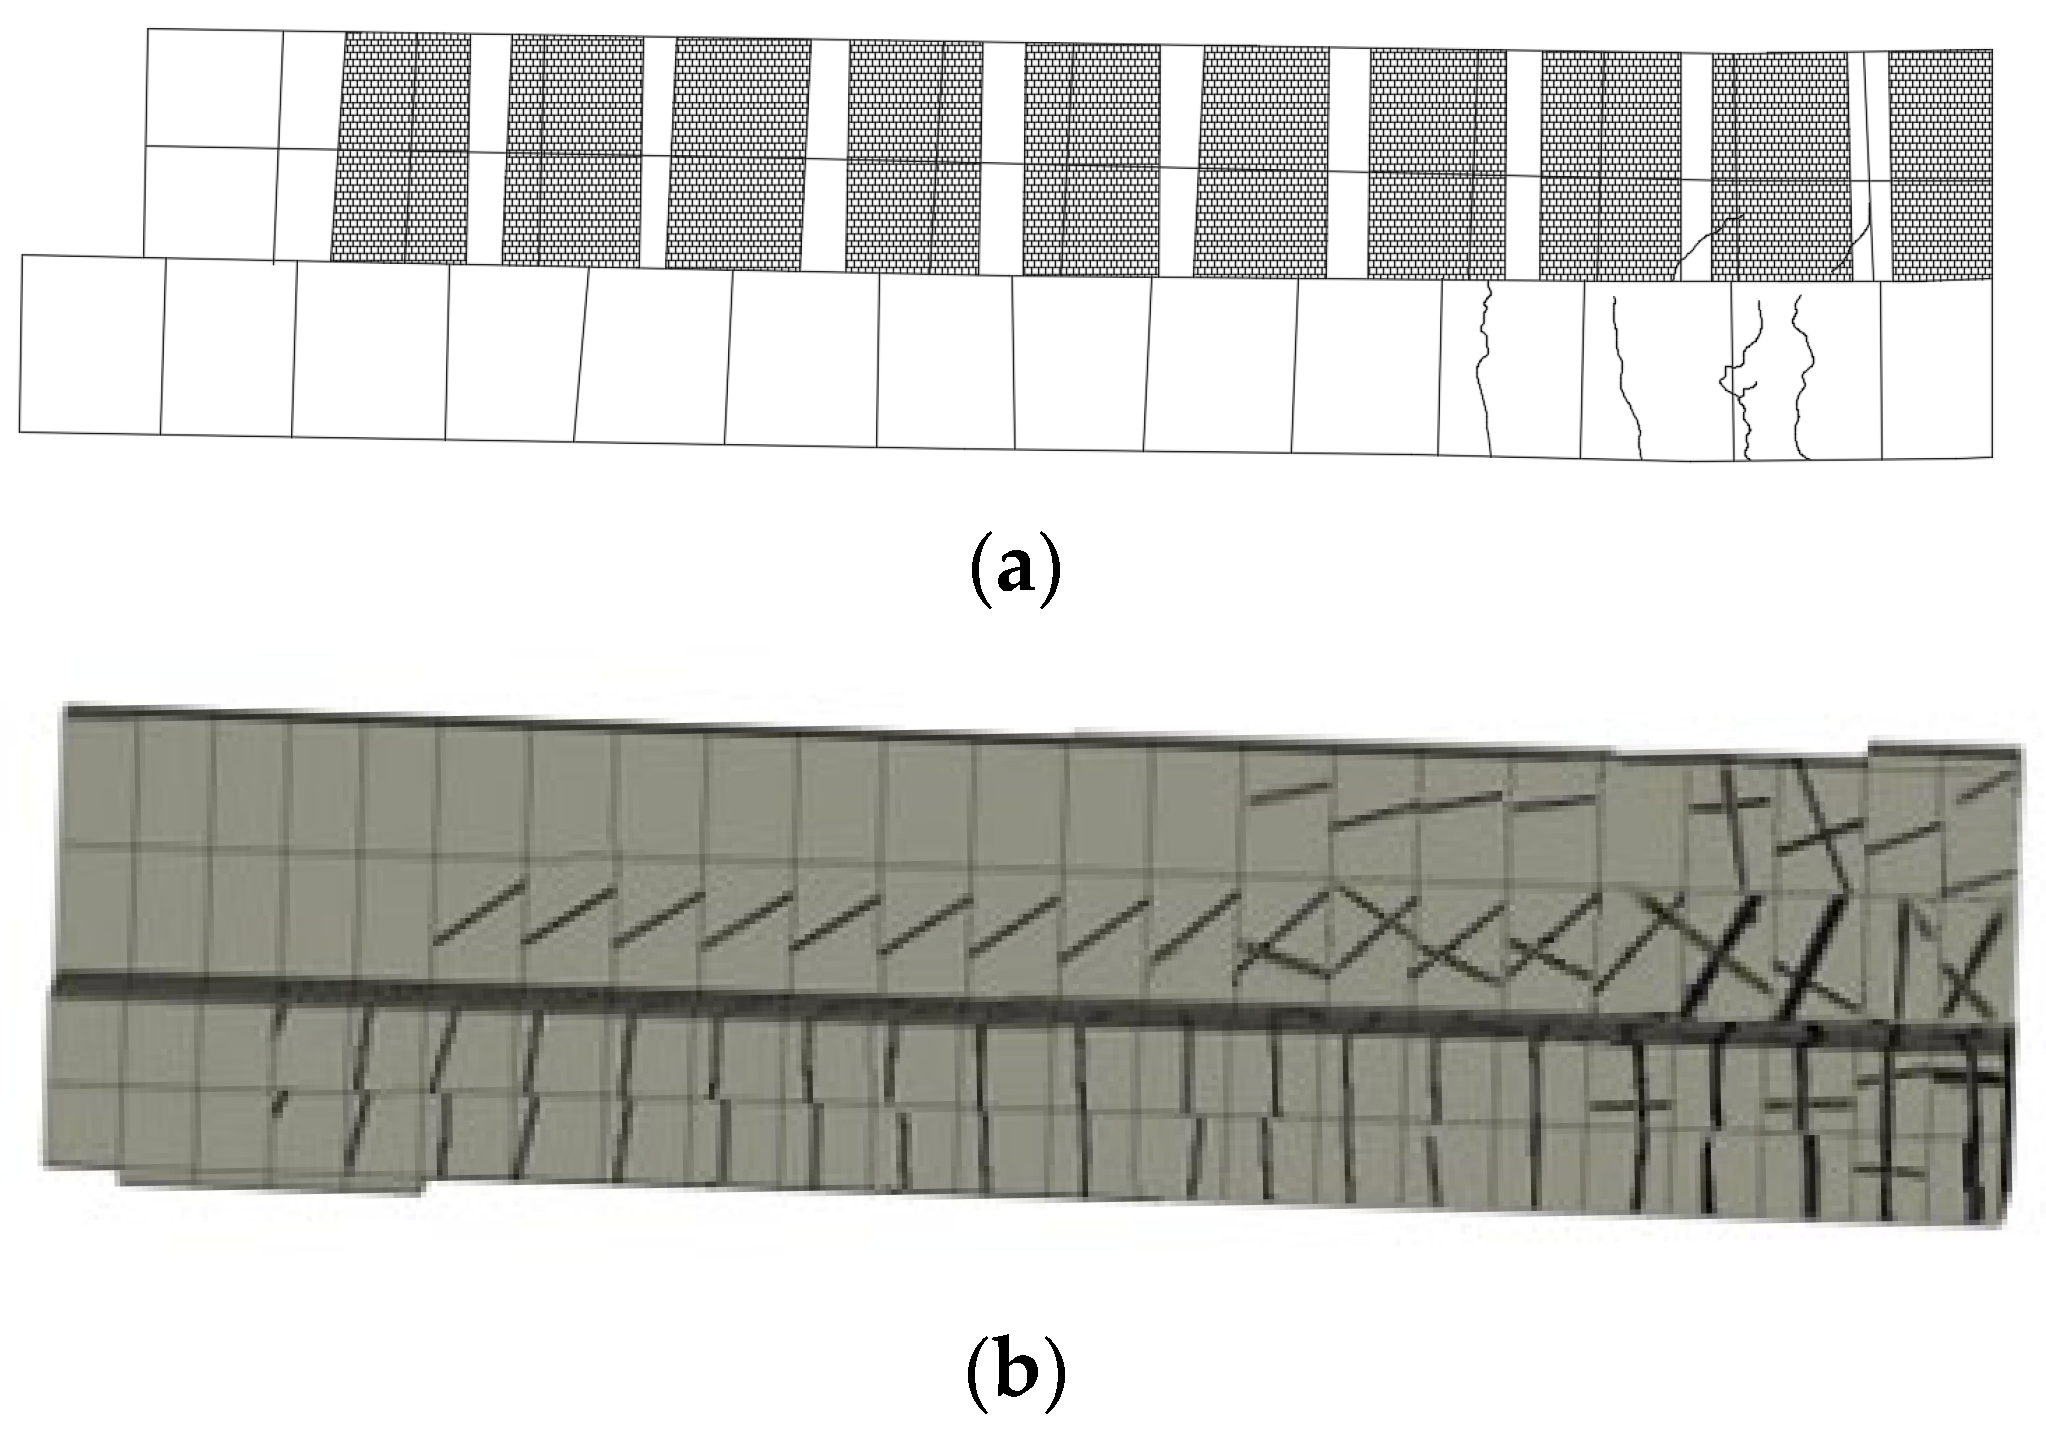
Figure 19 presents the crack pattern comparison between the experimental specimen and the numerical simulation for the SH beam. Both cases indicate that flexural cracking initiated at the mid-span and propagated upward through the tension zone. The observed crack formation was concentrated near the central region, where the negative moment demand is most critical, whilst the progression of damage remained localized and stable throughout the loading phase. The numerical model effectively captured the number, orientation, and spacing of the cracks, validating the cohesive behavior and bonding mechanism of the NSM CFRP rods. The localized failure features observed in both the physical and virtual specimens emphasize the adequacy of the partial embedment strategy in resisting flexural demands.
3.
Fully Embedded NSM CFRP-Strengthened Beam (SF)
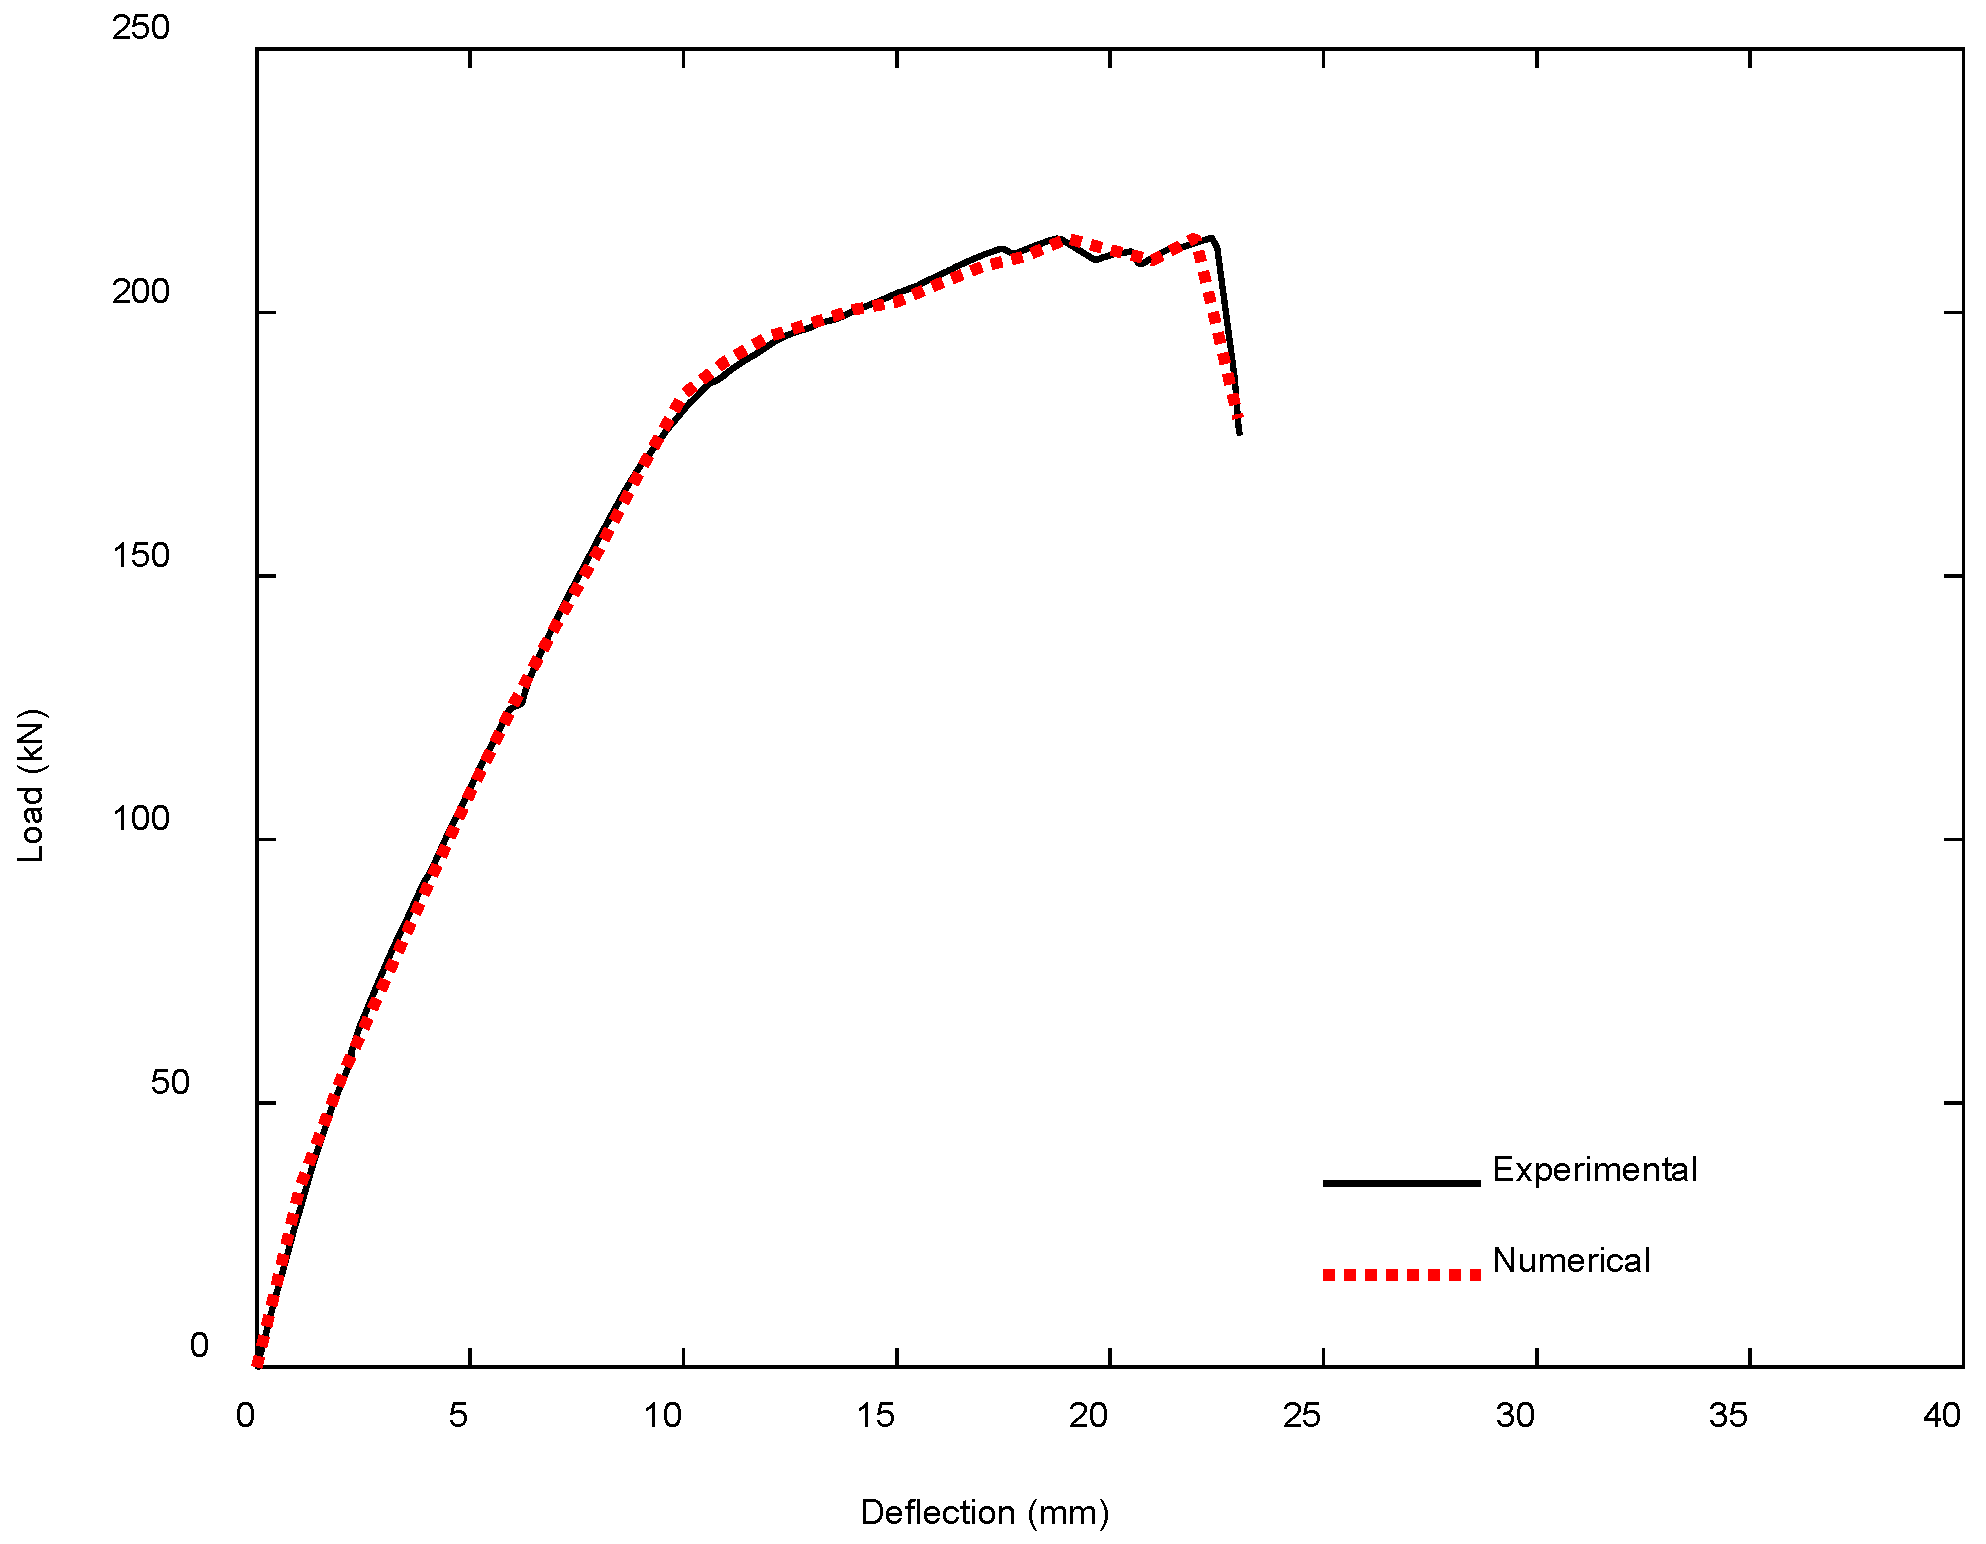
The predictive capability of the FE model for the fully embedded NSM CFRP-strengthened beam (SF) is substantiated by the strong alignment between numerical and experimental load–deflection profiles, as depicted in Figure 20. The curve trends mirror each other with remarkable consistency throughout both the pre- and post-yielding stages, underscoring the model’s capacity to replicate nonlinear flexural behavior. The NMSE for the SF specimen was calculated as 0.10%, demonstrating an exceptionally low deviation between predicted and observed results and reaffirming the robustness of the numerical scheme in simulating complex material interactions and geometric configurations under monotonic loading.
The numerical model demonstrated strong fidelity in replicating the experimental physical response of the fully embedded CFRP-strengthened beam (SF), as summarized in Table 6. The ultimate load prediction was virtually identical (214.14 kN vs. 214.13 kN), yielding a perfect ratio of 1.00. The corresponding mid-span deflection was slightly underestimated by 2% (22.00 mm vs. 22.38 mm) but still within excellent agreement. Stiffness and ductility indices were also conservatively estimated, with a ratio of 0.99 and 0.98, respectively. Similarly, energy absorption capacity was marginally lower in the simulation (3688.69 kN.mm vs. 3708.98 kN.mm), resulting in a ratio of 0.99. These tight deviations collectively result in an average physical parameter ratio of 0.99, indicating that the model effectively captured the essential performance metrics of the SF specimen under flexural action.
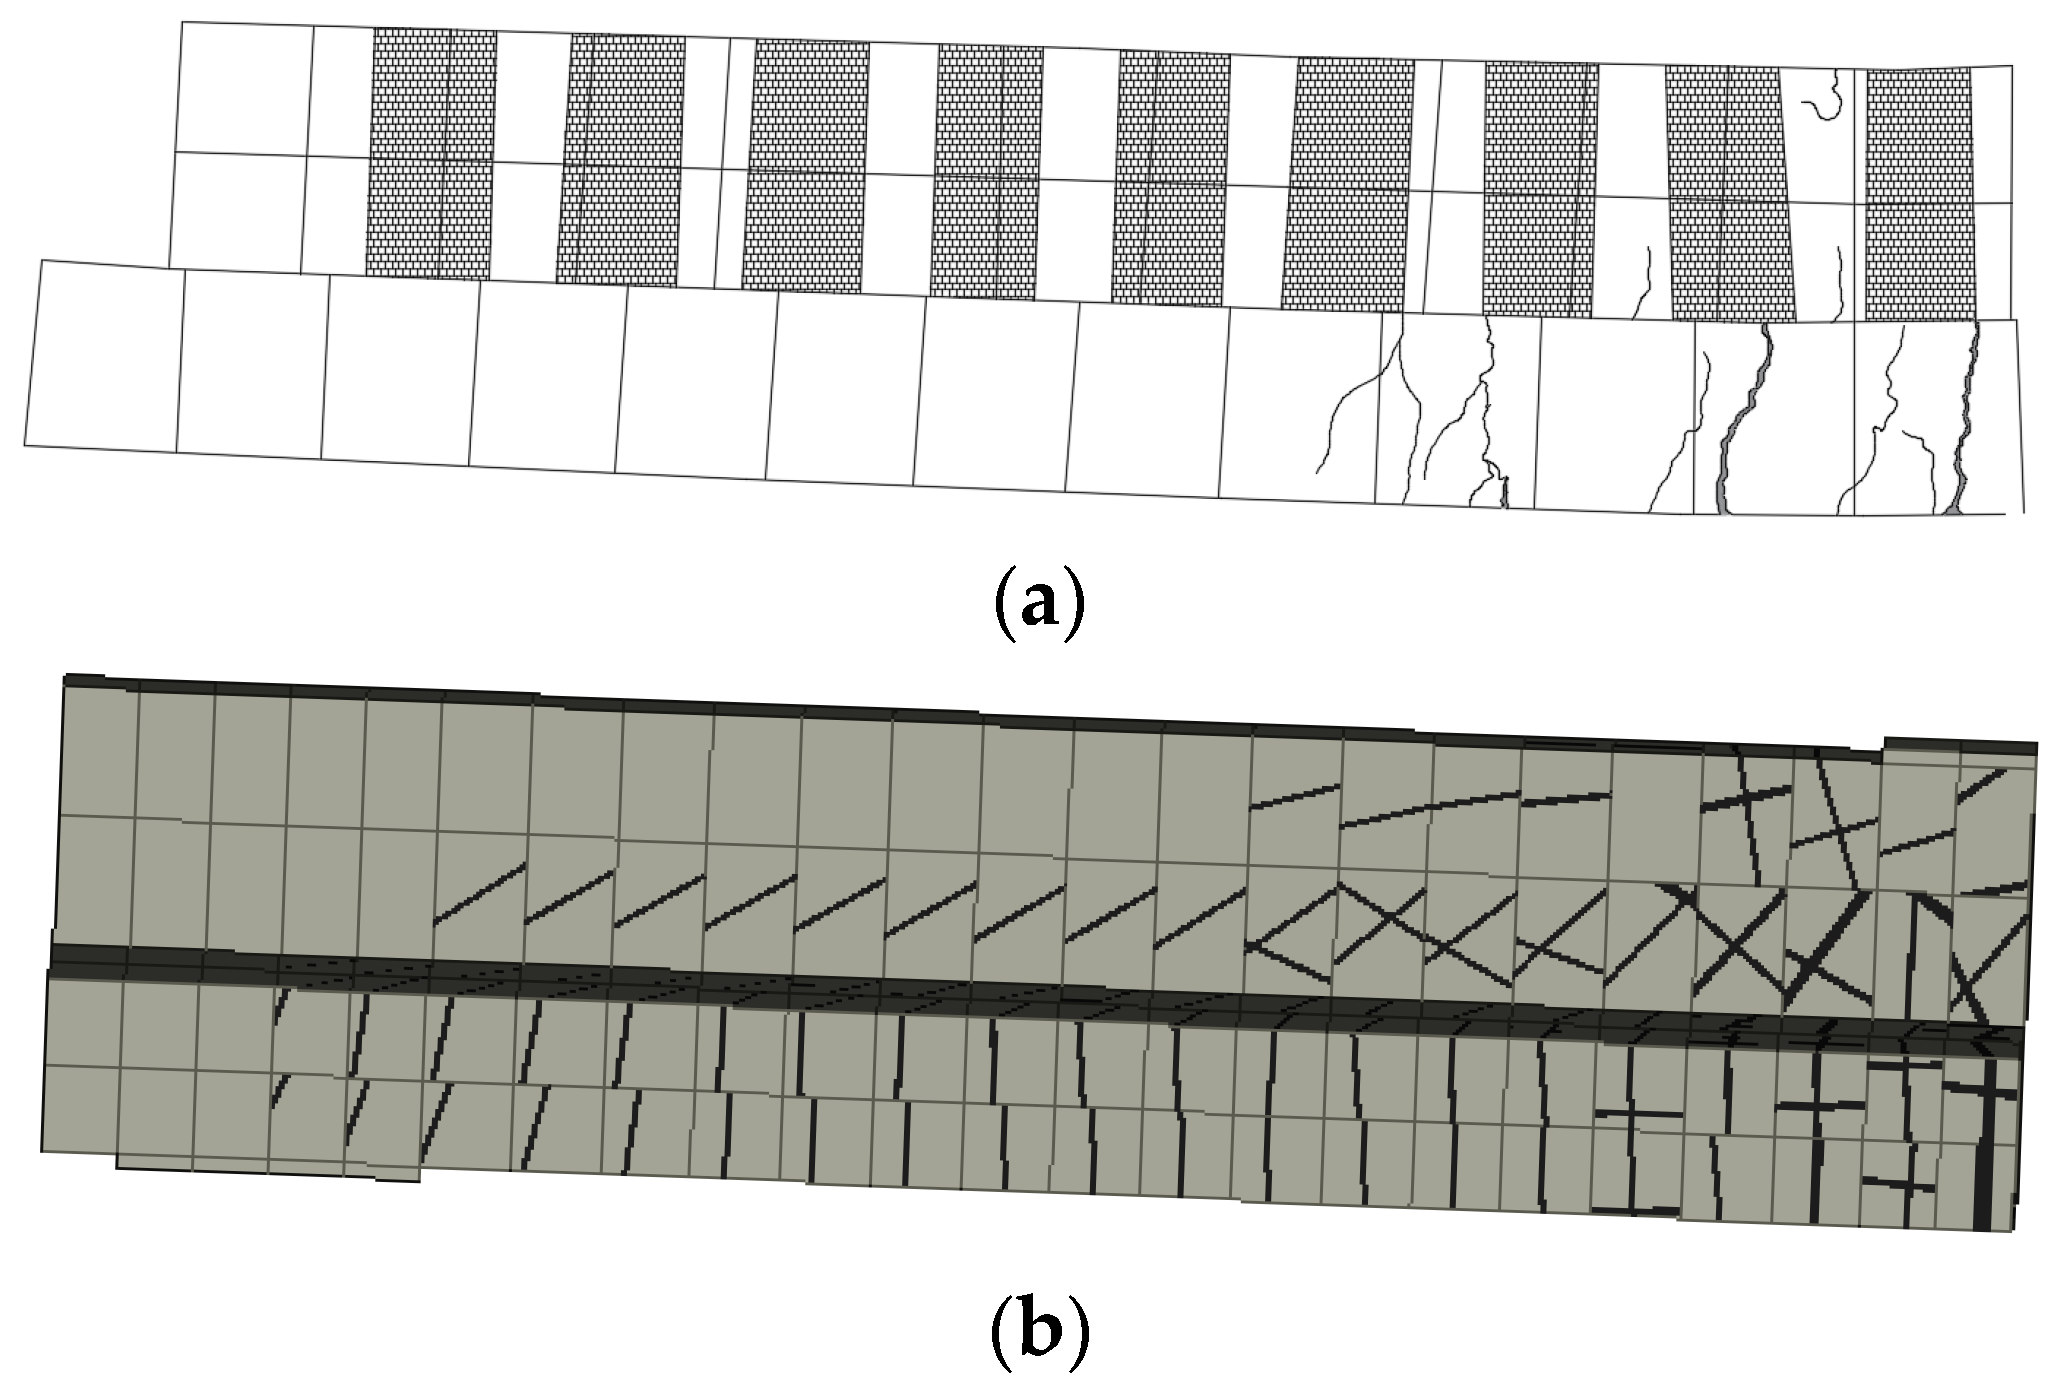
Figure 21 provides additional validation through a comparison of crack formation and propagation. The experimental specimen shows vertical and diagonal cracking concentrated near the mid-span, a pattern driven by flexural stresses. The numerical simulation accurately reflects this behavior, with comparable crack density, orientation, and location. The observed damage distribution and failure mechanisms were consistent between both representations, confirming that the embedded CFRP rods effectively enhanced the flexural capacity without altering the dominant failure mode. Overall, the congruence between numerical predictions and experimental observations across mechanical behavior and cracking profiles confirms the model’s effectiveness in replicating the structural response of the fully embedded NSM CFRP-strengthened beam.

4.3. Parametric Analysis

Upon validation of the FE models, the research progressed into a parametric investigation aimed at evaluating the influence of four key factors: the diameter of the CFRP rods, the compressive strength of concrete, the longitudinal steel reinforcement ratio, and the type of FRP material used. These parameters were selected due to their practical significance in design optimization and their potential impact on physical response characteristics. Given the inherent financial and logistical challenges of extensive experimental testing, such numerical studies provide an efficient means to explore a wide range of configurations. Moreover, a comparative assessment of various FRP materials, including their interaction with differing reinforcement layouts and concrete grades, offers valuable insights for guiding material selection and strengthening strategies in real-world applications.

4.3.1. Influence of CFRP Rod Diameter

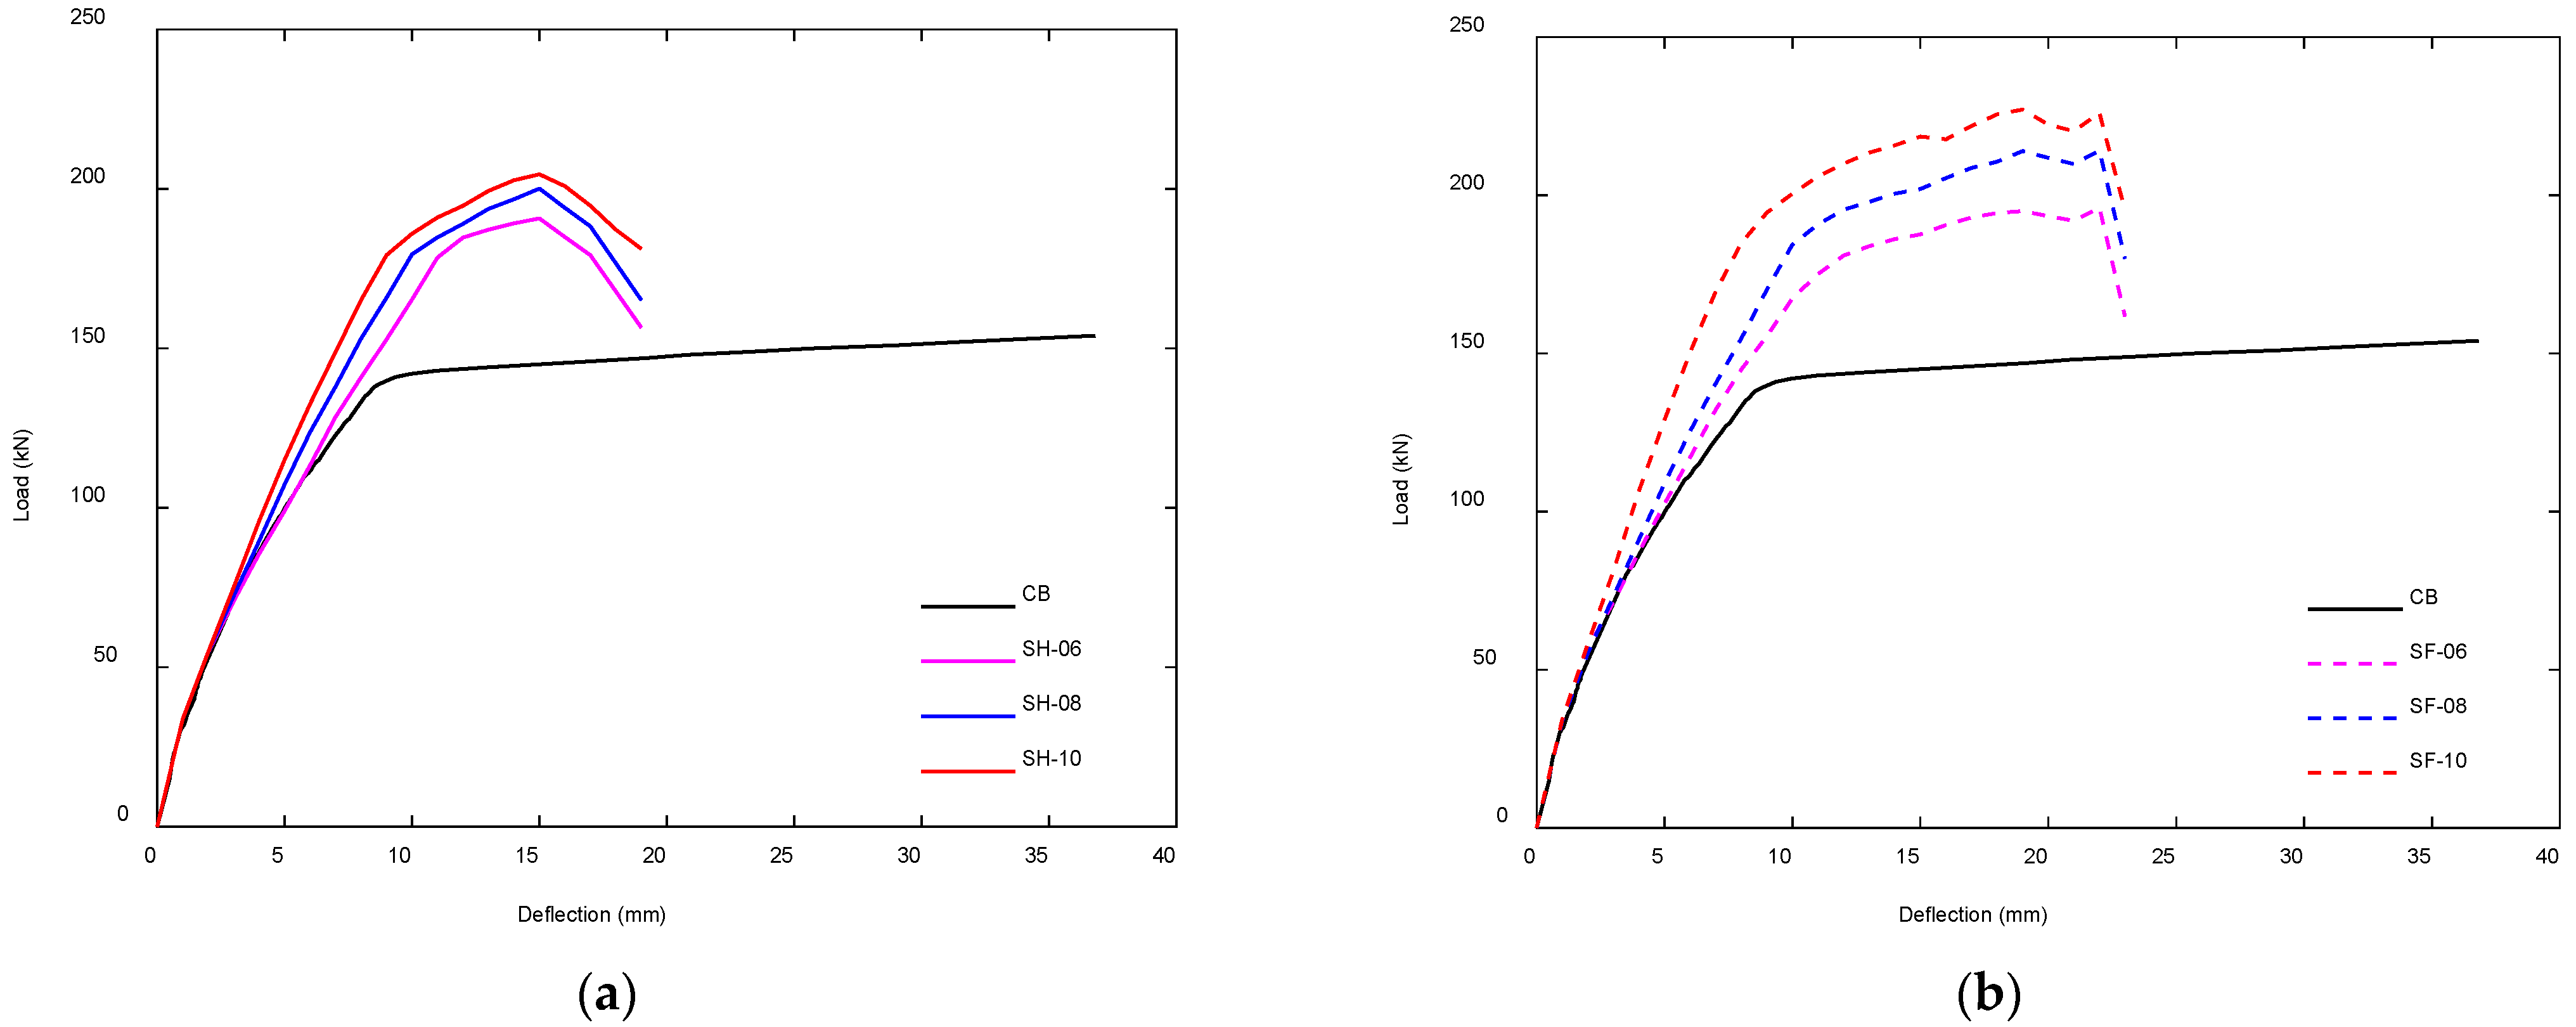
The first phase of the parametric analysis focused on evaluating the effect of CFRP rod diameter by modeling beam specimens reinforced with 6, 8, and 10 mm rods, representing reduced, baseline, and enlarged configurations, respectively. To isolate the influence of this variable, all other parameters were held constant, including a concrete compressive strength of 27.46 MPa and a longitudinal reinforcement ratio of 1.00%. The load–deflection responses for all specimens are depicted in Figure 22, providing a comparative view of their structural performance under monotonic loading. Corresponding physical response characteristics, namely, ultimate load capacity, stiffness, ductility index, and energy absorption, are summarized in Table 7, offering further insight into how CFRP rod size influences the global behavior of strengthened RC beams.
The effect of CFRP rod diameter on the structural behavior of strengthened beams is clearly demonstrated across all configurations, with increased diameters consistently yielding superior physical response characteristics. This enhancement can be attributed to the larger cross-sectional area of the CFRP rods, which not only boosts load-carrying capacity but also promotes more effective composite interaction with the surrounding concrete matrix. A comparison using the 8 mm diameter as a reference point highlights the pronounced benefit of increasing the rod size: upgrading to 10 mm resulted in a 32.86% increase in ultimate load for the SH series and a 47.51% gain for the SF series. Conversely, reducing the diameter to 6 mm diminished the relative improvement, with the SH and SF beams achieving only 1.24 and 1.27 times the ultimate load of the control beam, respectively. These observations underscore the critical importance of appropriate CFRP sizing in achieving efficient structural strengthening and optimizing performance.
A similar trend is observed in the stiffness response, where increasing the CFRP rod diameter to 10 mm leads to significant improvements, recorded at 1.25 times for the SH beam and 1.48 times for the SF beam, relative to the control. In contrast, reducing the diameter to 6 mm results in a modest reduction in stiffness, approximately 8.87% for the SH series and 6.59% for the SF series, when compared to the 8 mm configuration. These dimensional adjustments also influence energy absorption performance. Beams with 10 mm rods (SH-10 and SF-10) exhibit respective increases of 5.12% and 9.29% over their 8 mm counterparts, whereas smaller-diameter rods (SH-06 and SF-06) result in slight reductions, with ratios of 0.95 and 0.93. In terms of ductility, rod diameter plays a more nuanced role: a decrease to 6 mm lowers the ductility index by 4.92% for SH, with negligible variation in SF. Conversely, increasing the rod size to 10 mm enhances ductility by 7.10% and 18.93% for SH and SF beams, respectively.
These outcomes offer meaningful insight into the influence of CFRP rod size on the flexural response of strengthened beams, extending our current understanding of CFRP-based retrofitting strategies. Beyond confirming its role in enhancing load capacity, the study provides clear quantitative evidence of diameter-dependent changes in stiffness, ductility, and energy absorption, emphasizing the need for diameter optimization in performance-based design. While earlier research outlined the general benefits of CFRP reinforcement [43,44,45,46,47,48], this work contributes more nuanced guidance for choosing rod sizes tailored to structural demands. The simulation results validate the idea that larger CFRP diameters offer measurable improvements, although the magnitude varies by configuration. These insights support the practical value of optimizing CFRP sizing in strengthening applications and contribute to refining numerical modeling strategies for the more effective design of CFRP-strengthened concrete members.

4.3.2. Influence of Concrete Compressive Strength

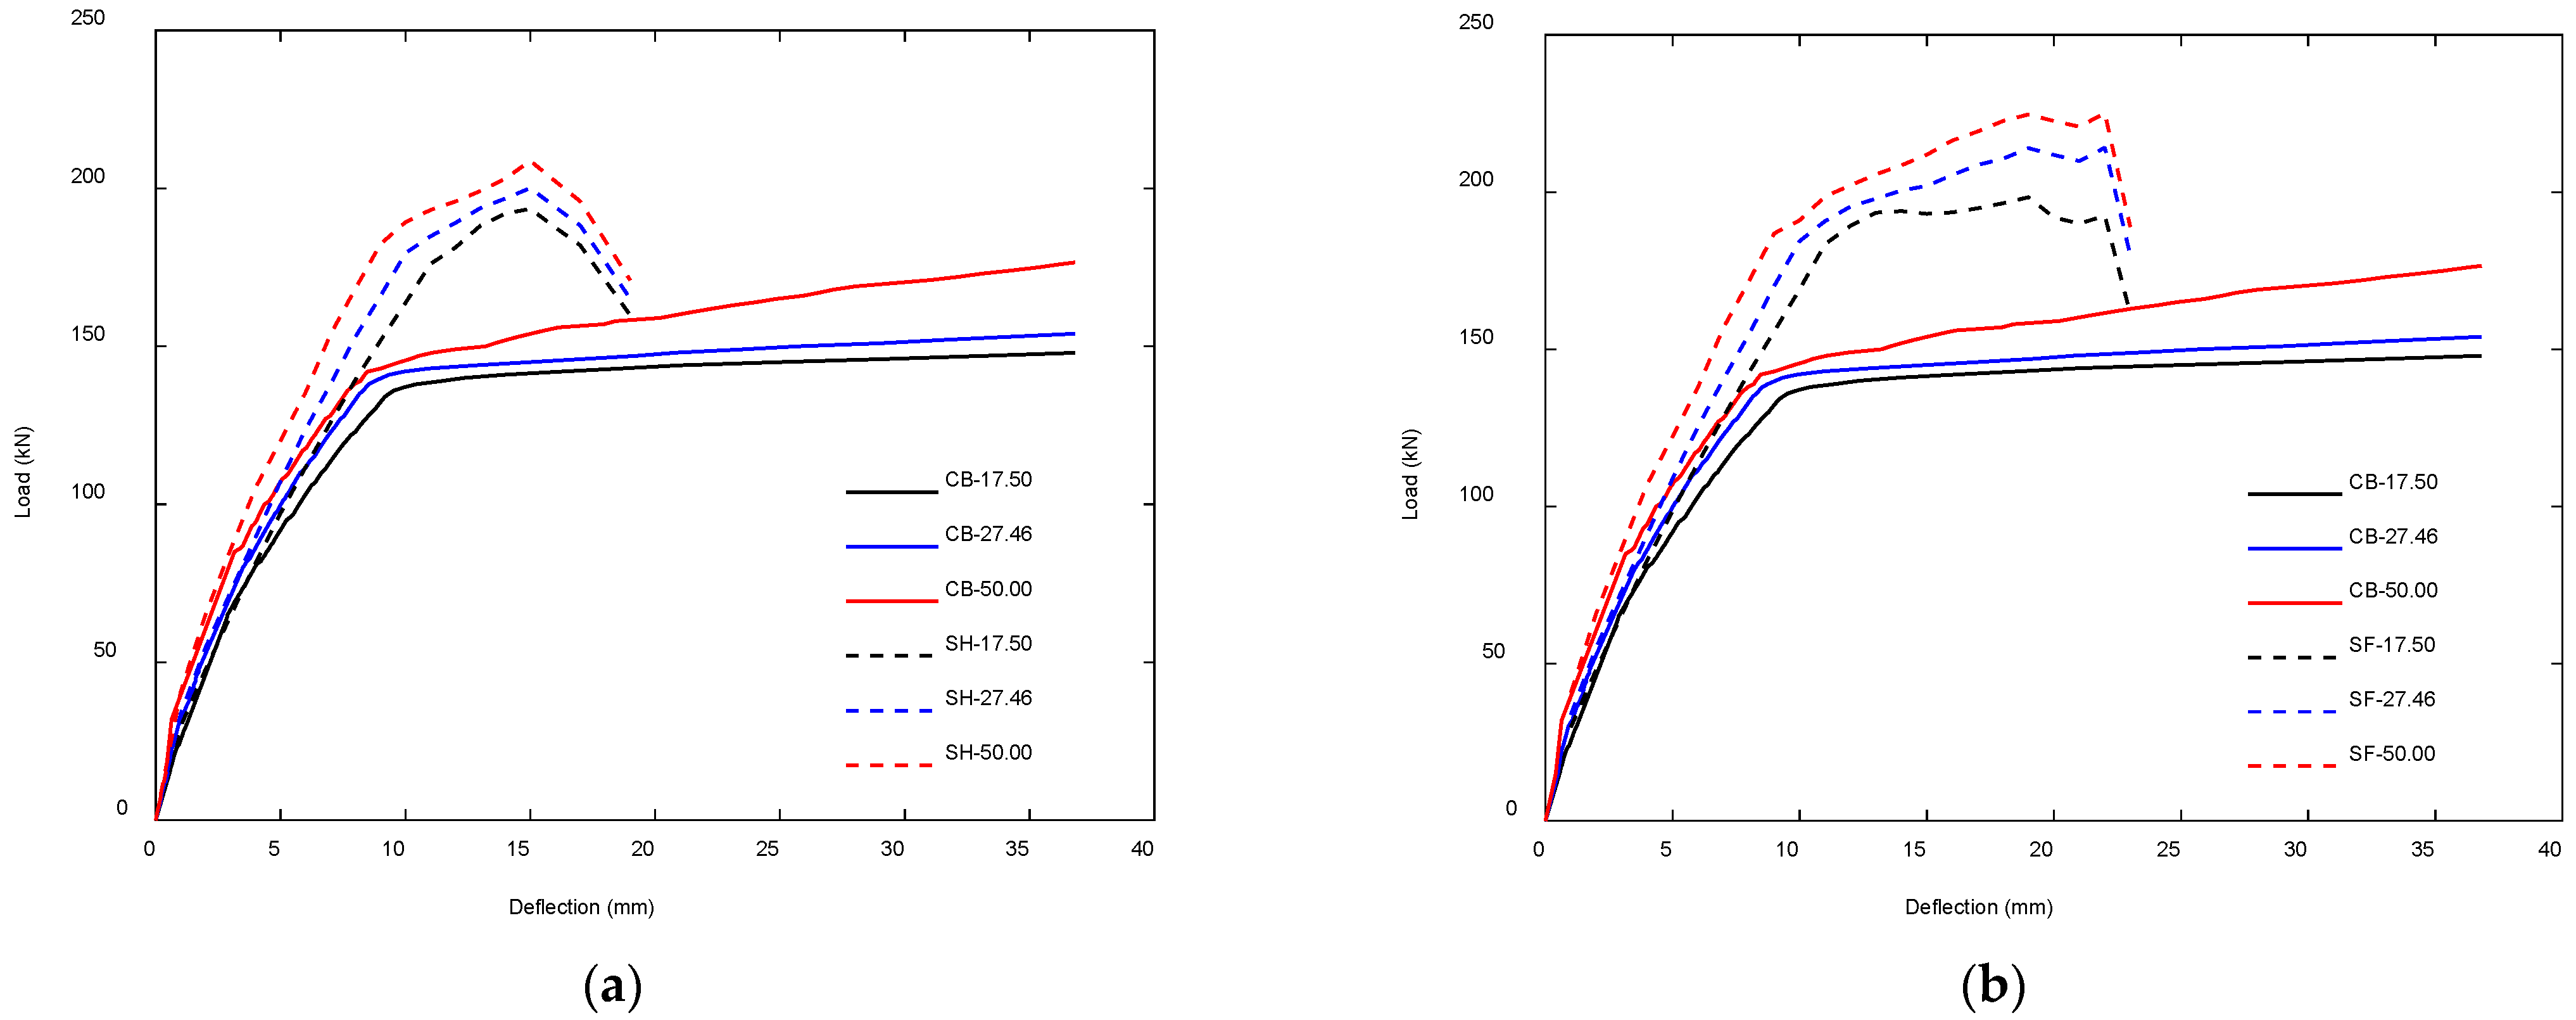
As part of the extended parametric analysis, the influence of concrete compressive strength on flexural behavior was systematically evaluated by varying f c   across three representative levels: 17.50 MPa (low), 27.46 MPa (baseline from the experiment), and 50.00 MPa (high). This variation was applied to three beam configurations, namely the control (CB), the half-embedded CFRP-strengthened (SH) beam, and the fully embedded CFRP-strengthened (SF) beam, resulting in nine distinct FE models. To ensure that the observed effects were attributable solely to changes in compressive strength, all other material and geometric parameters, including CFRP rod size (8 mm) and steel reinforcement ratio (1.00%), were held constant. The predicted structural responses under monotonic loading are illustrated through the load–deflection curves in Figure 23.
Complementary data on physical response characteristics, such as ultimate load, stiffness, ductility, and energy absorption, are detailed in Table 8, providing a holistic understanding of how concrete strength levels affect the global performance of both retrofitted and unstrengthened beams. The effect of concrete compressive strength on the flexural performance of NSM CFRP-strengthened RC T-beams is clearly demonstrated across the analyzed models. As compressive strength increases, the corresponding improvements in the modulus of elasticity and tensile resistance of concrete enhance its contribution to overall flexural capacity. This material enhancement shifts the neutral axis upward and increases tensile strain demands on the reinforcement, enabling the beams to carry greater loads. These outcomes align with established findings in the literature [72,73], confirming that stronger concrete enhances the flexural resistance of retrofitted members.
Stiffness improvements were particularly evident with higher concrete strength. Raising compressive strength from 17.50 to 50.00 MPa increased stiffness by 19.33%. Relative to the baseline strength of 27.46 MPa, SH-H and SF-H beams exhibited gains of 5.75% and 2.36%, whereas SH-L and SF-L experienced reductions of 7.47% and 0.87%. Energy absorption followed a comparable pattern: SH-H and SF-H increased by 6.95% and 6.83%, while SH-L and SF-L decreased by 5.84% and 7.11%. These results underscore the decisive role of concrete quality in enhancing both elastic behavior and energy dissipation of strengthened beams.
Although higher compressive strength also improved ductility, the gains were relatively modest. In the SH series, the ductility index rose from 1.68 at 17.50 MPa to 1.98 at 50.00 MPa, and in the SF series from 2.04 to 2.21. The control beams showed a similar trend, increasing from 4.07 to 4.75. Despite these slight improvements, the ductility of strengthened beams remained well below that of the control, reflecting the stiffening influence of CFRP reinforcement. This finding highlights a critical trade-off: while higher compressive strength enhances stiffness and energy absorption, it cannot fully compensate for the loss of deformation capacity in retrofitted beams. Such limitations must be carefully considered in design, particularly for seismic or thermally demanding conditions where repeated expansion and contraction further amplify ductility requirements.

4.3.3. Influence of Steel Reinforcement Ratio

To explore the structural implications of varying the longitudinal reinforcement ratio ( ρ ) , a series of FE models was developed encompassing three distinct configurations: 0.60%, 1.00%, and 2.90% reinforcement ratios. These reinforcement scenarios were applied across both unstrengthened and CFRP-strengthened beam types (specimens CB, SH, and SF). Importantly, the compressive strength of the concrete was fixed at 27.46 MPa and the CFRP rod diameter was held constant at 8 mm, thereby ensuring that any observed variation in flexural behavior could be directly attributed to changes in steel reinforcement ratio. The load–displacement trajectories obtained from the simulations are presented in Figure 24. Table 9 provides a comparative summary of key physical performance metrics, including peak load, stiffness, ductility index, and energy absorption. Together, these results deliver a critical insight into the role of steel reinforcement ratio in defining the flexural performance envelope of both unstrengthened and retrofitted RC T-beams.
The findings reveal that the proposed CFRP strengthening strategy remains effective across a wide range of longitudinal reinforcement ratios, from under-reinforced to over-reinforced sections. For beams with a low reinforcement ratio of 0.6%, the system achieved at least a 13.28% increase in peak load, highlighting its capacity to enhance flexural strength under demanding conditions. As the reinforcement ratio increased, so did the ultimate load capacity, with the SF-2.9 configuration attaining the highest load of 309.61 kN, among all the tested scenarios. However, this gain in strength came at the cost of reduced ductility, as higher steel ratios were associated with steeper reductions in post-peak load, suggesting a shift towards more brittle failure behavior.
The reinforcement ratio in unstrengthened RC beams plays a pivotal role in shaping the structural response following the NSM CFRP application, particularly in terms of stiffness and energy absorption. Increasing the steel ratio from 0.6% to 2.9% produced a 14.16% increase in stiffness, underscoring the synergistic interaction between internal steel and externally bonded CFRP. Compared to the baseline 1.0% case, SH-2.9 and SF-2.9 specimens achieved stiffness improvements of 19.46% and 26.16%, respectively. In contrast, under-reinforced configurations (SH-0.6 and SF-0.6) exhibited slight reductions of 12.58% and 12.44%. Energy absorption followed a similar pattern: over-reinforced beams showed substantial gains, 28.13% for SH-2.9 and 35.00% for SF-2.9, while the SH-0.6 and SF-0.6 models experienced a decline of 13.06% and 13.80%, respectively. These findings affirm that reinforcement ratio significantly modulates both the elastic response and the system’s capacity to absorb energy during progressive damage.
Despite these benefits, ductility consistently declined across all strengthened configurations, particularly in beams with higher steel content. In the case of ρ   = 2.90%, the ductility index dropped significantly from 4.62 to 1.77. This reduction reflects a key drawback of over-reinforcement in NSM CFRP systems, where the combined effect of dense longitudinal steel and bonded CFRP reinforcement restricts deformation capacity and promotes a more brittle failure mode. Such limitations become particularly concerning in environments subject to seasonal temperature variations, as repeated expansion and contraction can further exacerbate ductility demands. Therefore, while higher reinforcement ratios improve load-bearing and stiffness characteristics, they do so at the expense of ductility, a trade-off that must be carefully addressed in both seismic design and thermally demanding applications.

4.3.4. Influence of FRP Material Type

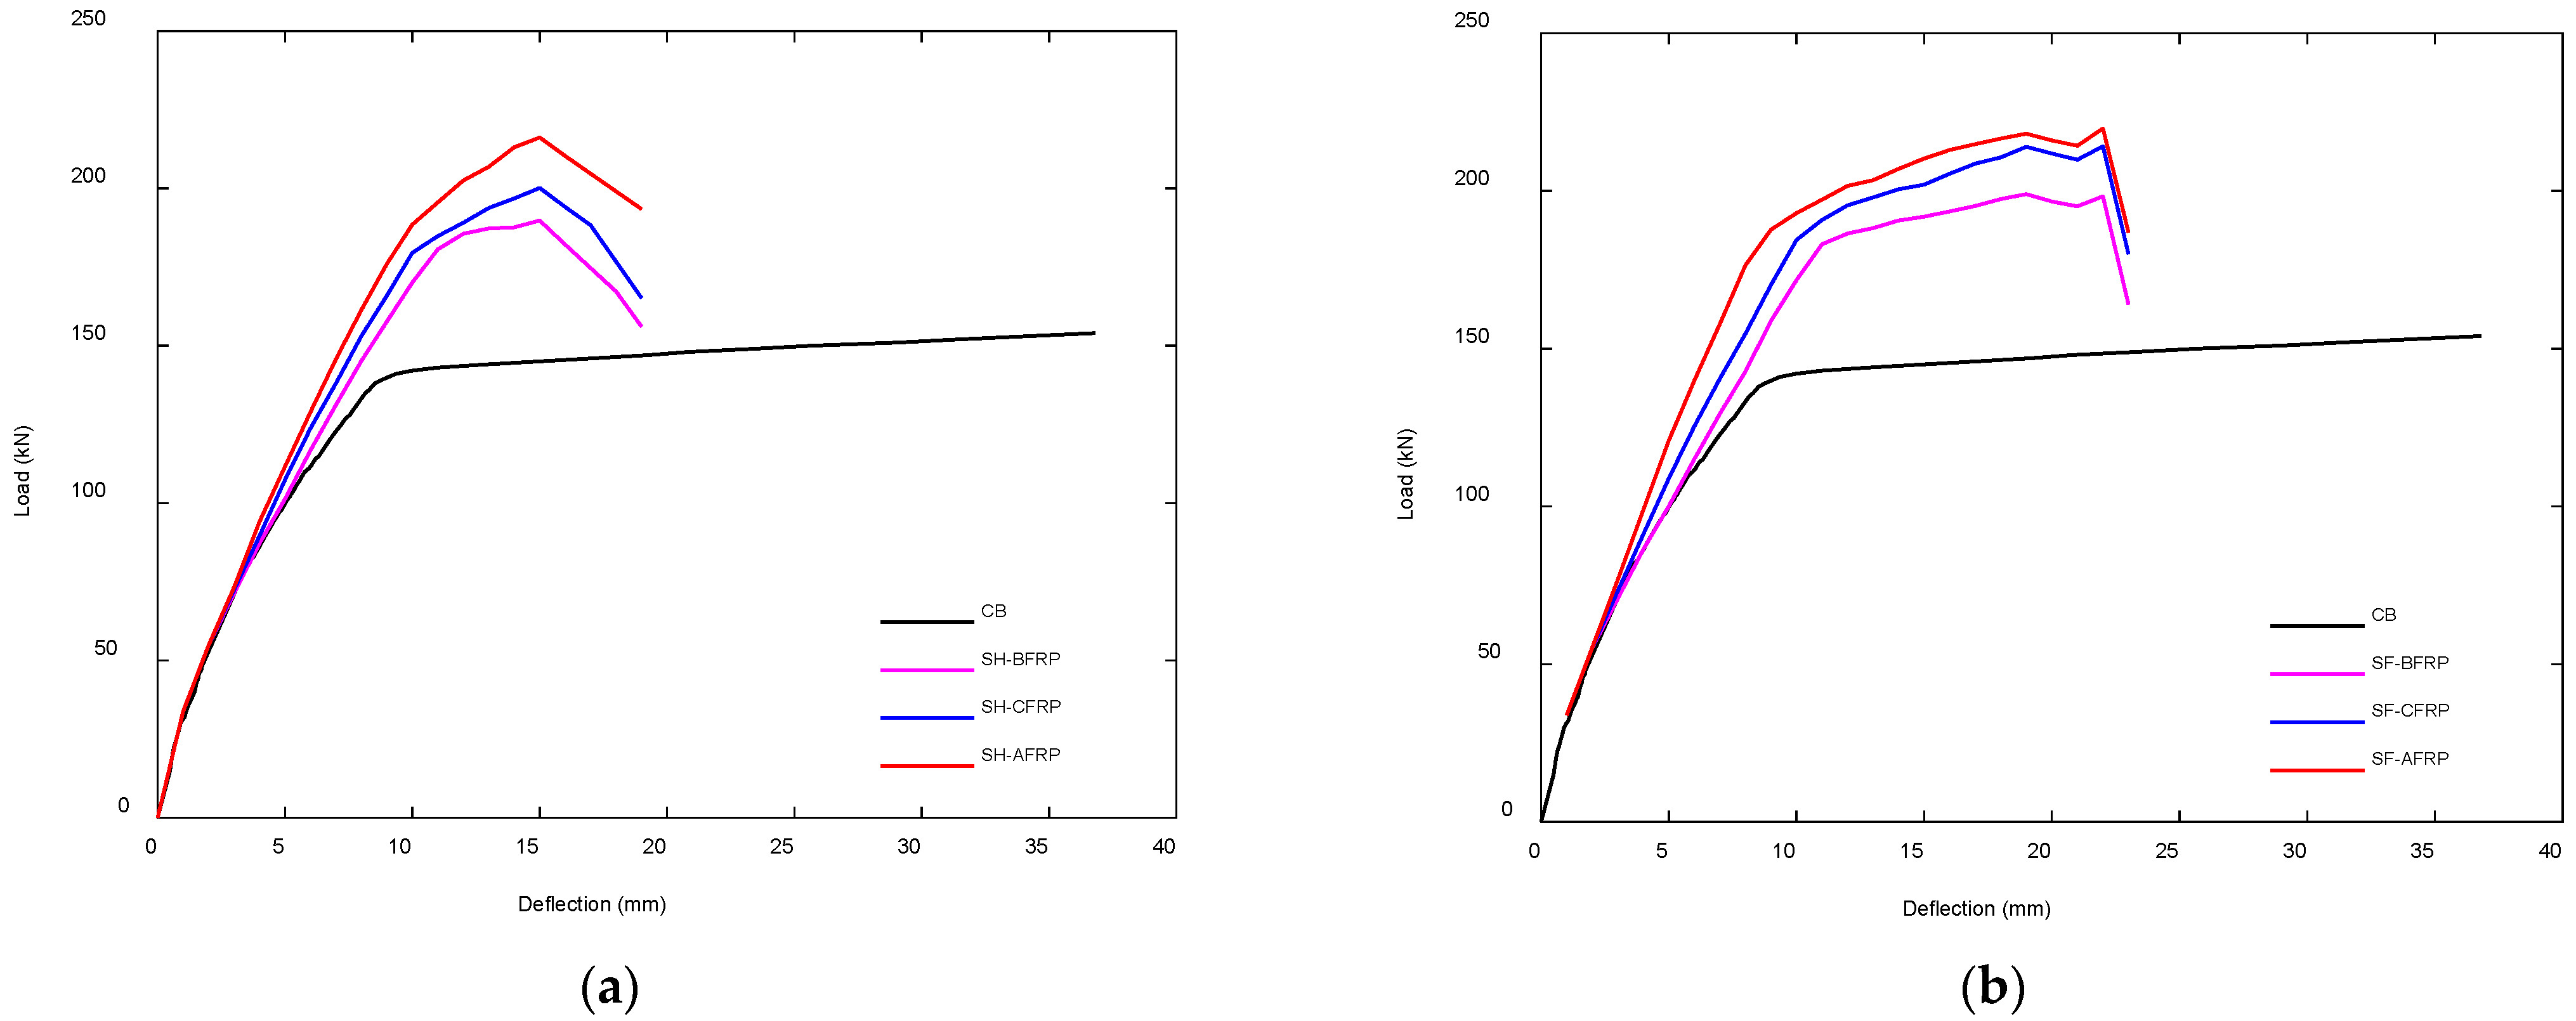
Building on the preceding parametric investigations, which explored the effects of CFRP rod diameter, concrete compressive strength, and longitudinal reinforcement ratio, this stage of the study focused on assessing the role of FRP material type in shaping flexural performance. Using the unstrengthened beam (CB) as a baseline, the original CFRP system was compared against two alternative FRPs: basalt (BFRP) and aramid (BFRP), as detailed in [74,75]. To ensure consistency, all beam models shared identical concrete properties and reinforcement layouts based on the SH and SF configurations. Figure 25 and Table 10 present the corresponding load–deflection responses and key structural performance indicators. This comparative analysis offers practical insights into the influence of FRP material on beam behavior and informs the selection of retrofit strategies based on performance priorities.
The type of FRP material applied in the strengthening system plays a decisive role in determining the flexural behavior of RC T-beams. As illustrated in Figure 25 and Table 10, beams retrofitted with different FRP types (BFRP, CFRP, and AFRP) exhibit varying performance characteristics in terms of strength, stiffness, energy absorption, and ductility. Compared to the unstrengthened control beam (CB), CFRP and AFRP systems produced the most substantial improvements in ultimate load capacity, reaching gains of 29.95% (SH-CFRP) and 40.37% (SH-AFRP), in the half-embedded configuration, and 39.05% (SF-CFRP) and 42.73% (SF-AFRP) in the fully embedded series. In contrast, BFRP delivered more modest increases, with ultimate load enhancements of 23.23% and 29.21% for SH and SF, respectively. These findings affirm the superior mechanical efficiency of CFRP and AFRP, in alignment with their material properties, whilst also demonstrating that even BFRP can yield significant load improvements when properly anchored.
In terms of stiffness, AFRP again leads with the highest increase relative to the control beam, showing gains of 18.75% for SH and 30.47% for SF. CFRP follows closely, with respective increases of 12.77% and 8.14%, while BFRP lags slightly behind, particularly in the SF series, where its stiffness ratio is 1.04 compared to the CB. These enhancements in stiffness directly reflect the higher elastic modulus of CFRP and AFRP, contributing to better crack control and reduced deformation under service loads. However, this improvement comes at the expense of ductility. As shown in Table 10, all FRP systems experience significant drops in ductility compared to the CB. SH-CFRP and SF-CFRP showed ductility index reductions of 57.74% and 52.42%, respectively, while AFRP recorded slight improvements in ductility over other FRPs but still lagged behind the control specimen. The trade-off is particularly noticeable when comparing energy absorption: although SH-AFRP and SF-AFRP achieved gains of 7.90% and 4.80% over their CFRP counterparts, both remained below the baseline CB energy absorption capacity, highlighting the inherent compromise in stiffness-ductility in FRP strengthening systems.
This comparative evaluation underscores the importance of material selection in performance-based strengthening strategies. While CFRP and AFRP provide notable improvements in load and stiffness capacity, their limited ability to maintain ductility and post-peak energy dissipation poses a constraint in scenarios where controlled failure mechanisms are critical, such as in seismic zones. Conversely, although BFRP offers lower mechanical enhancement, its slightly more balanced behavior suggests potential applicability in retrofitting where moderate strength gains with retained deformability are prioritized. Ultimately, the study highlights that no single FRP type is universally optimal; rather, the best choice depends on specific structural demands and design objectives. These insights are essential for refining FRP strengthening methodologies and tailoring them to targeted retrofit applications.

5. Conclusions

This study presented a comprehensive parametric investigation into the flexural behavior of RC T-beams strengthened in the negative moment region using NSM-CFRP rods. A validated three-dimensional FE model was developed to simulate the structural response under monotonic loading. This model facilitated a systematic exploration of key design parameters, including CFRP rod diameter, concrete compressive strength, longitudinal reinforcement ratio, and FRP material type, providing a detailed understanding of their influence on flexural performance. From this investigation, the following conclusions can be drawn:
  • The FE model was successfully validated against experimental results, with load–deflection curves, crack patterns, and response parameters showing excellent agreement (ratios 0.95–1.04; NMSE as low as 0.006).
  • Increasing CFRP diameter from 6 to 10 mm enhanced ultimate load and stiffness by up to 47.51% in fully embedded configurations, while undersized rods produced limited improvements.
  • Higher concrete compressive strength improved stiffness, energy absorption, and modestly increased ductility, though strengthened beams remained less ductile than the control, a trade-off critical in seismic and thermal applications.
  • Beams with reinforcement ratios up to 2.90% achieved peak loads of 309.61 kN, but ductility indices declined from 4.62 to 1.77, indicating more brittle behavior.
  • CFRP and AFRP provided the greatest strength and stiffness gains, while BFRP offered more moderate improvements with a better balance between strength and deformability.
  • NSM CFRP reinforcement was shown to substantially improve the negative moment performance of RC T-beams even when full groove depth was not achievable. This outcome is highly relevant for retrofit applications where embedment depth is limited by cover or construction constraints, and the results provide quantitative benchmarks that may serve as a basis for future design guidance.
  • While the findings demonstrate the effectiveness of NSM CFRP retrofitting, the study did not address cyclic, seismic, or thermal effects, nor did it explicitly model bond–slip behavior. These limitations should be explored in future research to broaden the applicability of the proposed approach and to develop more comprehensive design recommendations.

Author Contributions

Conceptualization, Y.H. and G.H.S.; methodology, Y.H. and G.H.S.; software, Y.H., G.H.S., H.R.S. and A.E.C.H.; validation, Y.H., G.H.S., H.-T.H. and F.-P.H.; formal analysis, Y.H., H.R.S. and A.E.C.H.; investigation, Y.H., D.N.S., H.R.S. and A.E.C.H.; resources, Y.H., G.H.S., H.-T.H. and F.-P.H.; data curation, Y.H., G.H.S., L.N., D.N.S., H.R.S. and A.E.C.H.; writing—original draft preparation, Y.H., H.R.S. and L.N.; writing—review and editing, Y.H., G.H.S., H.-T.H., F.-P.H., L.N., D.N.S., H.R.S. and A.E.C.H.; visualization, Y.H. and L.N.; supervision, Y.H., G.H.S., H.-T.H., F.-P.H. and D.N.S.; project administration, H.-T.H. and G.H.S.; funding acquisition, H.-T.H. and G.H.S. All authors have read and agreed to the published version of the manuscript.

Funding

This research was partially supported by the National Science and Technology Council (NSTC), Taiwan, under Grant No. 111-2625-M-006-008, awarded to the third author (H.-T.H.). Additional funding was provided by the Institute for Research and Community Service (LPPM) at Universitas Jenderal Soedirman (UNSOED), Indonesia, through the Riset Dasar UNSOED program under Grant No. 26.414/UN23.35.5/PT.01/II/2025, awarded to the second author (G.H.S.).

Data Availability Statement

The original contributions presented in this study are included in the article. Further inquiries can be directed to the corresponding authors.

Acknowledgments

The authors would like to express their sincere gratitude to PT SIKA Indonesia for providing material support and to the National Center for Research on Earthquake Engineering (NCREE), Taiwan, for their assistance during the experimental phase of this study.

Conflicts of Interest

The authors declare no conflicts of interest.

Abbreviations

The following abbreviations are used in this manuscript:
RCReinforced concrete
FRPFiber-reinforced polymers
NSMNear-surface mounted
CFRPCarbon-fiber-reinforced polymers
FEFinite element
LVDTLinear variable differential transformer
ATENAAdvanced Tool for Engineering Nonlinear Analysis
NMSENormalized mean square error
BFRPBasalt-fiber-reinforced polymers
AFRPAramid-fiber-reinforced polymers

References

  1. Hanif, M.U.; Seo, S.-Y.; Tran, H.V.; Senghong, K. Monitoring and characterizing the debonding in CFRP retrofitted RC beams using acoustic emission technology. Dev. Built Environ. 2023, 14, 100141. [Google Scholar] [CrossRef]
  2. Ayyobi, P.; Barros, J.A.O.; Dias, S.J.E. Numerical assessment of the effect of CFRP anchorages on the flexural and shear strengthening performance of RC beams. J. Compos. Sci. 2024, 8, 348. [Google Scholar] [CrossRef]
  3. Schwarz, Y.; Sanio, D.; Mark, P. Experimental study of the effectiveness of strengthening reinforced concrete slabs with thermally prestressed reinforcement. CivilEng 2025, 6, 49. [Google Scholar] [CrossRef]
  4. Baena, M.; Jahani, Y.; Torres, L.; Barris, C.; Perera, R. Flexural performance and end debonding prediction of NSM carbon FRP-strengthened reinforced concrete beams under different service temperatures. Polymers 2023, 15, 851. [Google Scholar] [CrossRef] [PubMed]
  5. Murad, Y.Z.; Al-Mahmood, H.; Tarawneh, A.; Aljaafreh, A.J.; AlMashaqbeh, A.; Abdel Hadi, R.; Shabbar, R. Shear strengthening of RC beams using fabric-reinforced cementitious matrix, carbon plates, and 3D-printed strips. Sustainability 2023, 15, 4293. [Google Scholar] [CrossRef]
  6. Hosen, M.A.; Shammas, M.I.; Kaaf, K.A.A.; Jumaat, M.Z.; Alengaram, U.J.; Sulong, N.H.R.; Hashim, H.B. Carbon fiber reinforced polymer (CFRP) for structural capacity enhancement of RC beams incorporating innovative side hybrid (SH) technique. Buildings 2024, 14, 1919. [Google Scholar] [CrossRef]
  7. Li, W.; Huang, X.; Liu, X.; Wen, T.; Jing, C.; Li, L. Flexural performance of reinforced concrete beams strengthened with a novel high-strength and high-toughness epoxy mortar thin layer. Appl. Sci. 2024, 14, 3999. [Google Scholar] [CrossRef]
  8. Atmajayanti, A.T.; Haryanto, Y.; Hsiao, F.-P.; Hu, H.-T.; Nugroho, L. Effective flexural strengthening of reinforced concrete T-beams using bonded fiber-core steel wire ropes. Fibers 2025, 13, 53. [Google Scholar] [CrossRef]
  9. Haryanto, Y.; Hu, H.-T.; Atmajayanti, A.T.; Hsiao, F.-P.; Nugroho, L.; Wariyatno, N.G. Simulation-based study on the performance of NSM-CFRP strengthening in prestressed concrete T-beams under seismic loading. Materials 2025, 18, 4386. [Google Scholar] [CrossRef]
  10. Bournas, D.A.; Pavese, S.; Tizani, W. Tensile capacity of FRP anchors in connecting FRP and TRM sheets to concrete. Eng. Struct. 2015, 82, 72–81. [Google Scholar] [CrossRef]
  11. Siddika, A.; Shojib, M.H.H.; Hossain, M.M.; Hossain, M.I.; Al Mamun, M.A.; Alyousef, R.; Amran, Y.H.M. Flexural performance of wire mesh and geotextile-strengthened reinforced concrete beam. SN Appl. Sci. 2019, 1, 1324. [Google Scholar] [CrossRef]
  12. Siddika, A.; Al Mamun, M.A.; Ferdous, W.; Alyousef, R. Performances, challenges and opportunities in strengthening reinforced concrete structures by using FRPS—A state-of-the-art review. Eng. Fail. Anal. 2020, 111, 104480. [Google Scholar] [CrossRef]
  13. Alhassan, M.; Al-Rousan, R.; Ababneh, A. Anchoring of the main CFRP sheets with transverse CFRP strips for optimum upgrade of RC beams: Parametric experimental study. Constr. Build. Mater. 2021, 293, 123525. [Google Scholar] [CrossRef]
  14. Lee, L.S.; Jain, R. The role of FRP composites in a sustainable world. Clean Technol. Environ. Policy 2009, 11, 247–249. [Google Scholar] [CrossRef]
  15. Al-Rouslan, R. Influence of opening sizes on the flexural behavior of heat-damaged reinforced concrete slabs strengthened with CFRP ropes. Case Stud. Constr. Mater. 2022, 17, e01464. [Google Scholar] [CrossRef]
  16. Al-Rouslan, R.; Issa, M.A. Flexural behavior of RC beams externally strengthened with CFRP composites exposed to severe environment conditions. KSCE J. Civ. Eng. 2017, 21, 2300–2309. [Google Scholar] [CrossRef]
  17. Al-Rouslan, R. Effect of CFRP schemes on the flexural behavior of RC beams modeled by using a nonlinear finite-element analysis. Mech. Compos. Mater. 2015, 51, 437–446. [Google Scholar] [CrossRef]
  18. Al-Rouslan, R. Impact of internal CFRP strips on the flexural behavior of heat-damaged reinforced concrete beams. Heliyon 2023, 9, e17145. [Google Scholar] [CrossRef]
  19. Al-Rouslan, R. Anchored CFRP ropes for flexural capacity recovering of thermally damaged RC one-way slabs. Alex. Eng. J. 2023, 76, 757–774. [Google Scholar] [CrossRef]
  20. Su, M.; Gong, S.; Liu, Y.; Peng, H. Flexural behavior of RC beams strengthened with fully or partially prestressed near-surface mounted FRP strips: An experimental investigation. Eng. Struct. 2022, 262, 114345. [Google Scholar] [CrossRef]
  21. Teng, J.G.; De Lorenzis, L.; Wang, B.; Li, R.; Wong, T.N.; Lam, L. Debonding failures of RC beams strengthened with near-surface mounted CFRP strips. J. Compos. Constr. 2006, 10, 92–105. [Google Scholar] [CrossRef]
  22. Zhang, S.S.; Yu, T.; Chen, G.M. Reinforced concrete beams strengthened in flexure with Near-Surface Mounted (NSM) CFRP strips: Current status and research needs. Compos. B Eng. 2017, 131, 30–42. [Google Scholar] [CrossRef]
  23. ACI Committee 440. Guide for the Design and Construction of Externally Bonded FRP Systems for Strengthening Concrete Structures (ACI 440.2R-17); American Concrete Institute: Farmington Hills, MI, USA, 2017. [Google Scholar]
  24. Badawi, M.; Soudki, K. Flexural strengthening of RC beams with prestressed NSM CFRP rods—Experimental and analytical investigation. Constr. Build. Mater. 2009, 23, 3292–3300. [Google Scholar] [CrossRef]
  25. Dias, S.J.E.; Barros, J.A.O. Shear strengthening of RC beams with NSM CFRP laminates: Experimental research and analytical formulation. Compos. Struct. 2013, 99, 477–490. [Google Scholar] [CrossRef]
  26. Almassri, B.; Kreit, A.; Al Mahmoud, F.; François, R. Mechanical behaviour of corroded RC beams strengthened by NSM CFRP rods. Compos. B Eng. 2014, 64, 97–107. [Google Scholar] [CrossRef]
  27. Capozucca, R.; Domizi, J.; Magagnini, E. Damaged RC beams strengthened with NSM CFRP rectangular rods under vibration in different constrain conditions. Compos. Struct. 2016, 154, 660–683. [Google Scholar] [CrossRef]
  28. Dias, S.J.E.; Barros, J.A.O.; Janwaen, W. Behavior of RC beams flexurally strengthened with NSM CFRP laminates. Compos. Struct. 2018, 201, 363–376. [Google Scholar] [CrossRef]
  29. Zhang, S.S.; Ke, Y.; Smith, S.T.; Zhu, H.P.; Wang, Z.L. Effect of FRP U-jackets on the behaviour of RC beams strengthened in flexure with NSM CFRP strips. Compos. Struct. 2021, 256, 113095. [Google Scholar] [CrossRef]
  30. Abdallah, M.; Al Mahmoud, F.; Tabet-Derraz, M.I.; Kheli, A.; Mercier, J. Experimental and numerical investigation on the effectiveness of NSM and side-NSM CFRP bars for strengthening continuous two-span RC beams. J. Build. Eng. 2021, 41, 102723. [Google Scholar] [CrossRef]
  31. Hadi, S.; Kazeminezhad, E.; Safakhah, S. Full-scale experimental evaluation of flexural strength and ductility of reinforced concrete beams strengthened with various FRP mechanisms. Structures 2022, 43, 1160–1176. [Google Scholar] [CrossRef]
  32. Ke, Y.; Zhang, S.S.; Nie, X.F.; Yu, T.; Yang, Y.M.; Jedrzejko, M.J. Finite element modelling of RC beams strengthened in flexure with NSM FRP and anchored with FRP U-jackets. Compos. Struct. 2022, 282, 115104. [Google Scholar] [CrossRef]
  33. Bouzid, H.; Rabia, B.; Daouadji, T.H. Ultimate behavior of RC beams strengthened in flexure using FRP material. Eng. Struct. 2023, 289, 116300. [Google Scholar] [CrossRef]
  34. Ahmed, S.; Sharaky, I.A.; Ibrahim, E.Y.E.; Abdo, A. Flexural response of GFRP RC beams strengthened with side and bottom NSM GFRP bars. Case Stud. Constr. Mater. 2023, 18, e01858. [Google Scholar] [CrossRef]
  35. Sharaky, I.A.; Torres, L.; Comas, J.; Barris, C. Flexural response of reinforced concrete (RC) beams strengthened with near surface mounted (NSM) fiber reinforced polymer (FRP) bars. Compos. Struct. 2014, 109, 8–22. [Google Scholar] [CrossRef]
  36. Budipriyanto, A.; Han, A.L.; Hu, H.-T. Bond-shear behavior of FRP rods as a function of attachment configuration. J. Adv. Civ. Environ. Eng. 2018, 1, 9–17. [Google Scholar] [CrossRef]
  37. Haryanto, Y.; Hu, H.-T.; Han, A.L.; Hsiao, F.-P.; Teng, C.-J.; Hidayat, B.A.; Nugroho, L. Nonlinear 3D model of double shear lap tests for the bond of near-surface mounted FRP rods in concrete considering different embedment depth. Period. Polytech. Civ. Eng. 2021, 65, 878–889. [Google Scholar]
  38. Haryanto, Y.; Hu, H.-T.; Han, A.L.; Hsiao, F.-P.; Teng, C.-J.; Hidayat, B.A.; Wariyatno, N.G. Negative moment region flexural strengthening system of RC T-beams with half-embedded NSM FRP rods: A parametric analytical approach. J. Chin. Inst. Eng. 2021, 44, 553–561. [Google Scholar] [CrossRef]
  39. Tudjono, S.; Han, A.L.; Gan, B.S. An integrated system for enhancing flexural member’s capacity via combinations of the fiber reinforced plastic use, retrofitting, and surface treatment techniques. Int. J. Technol. 2018, 9, 5–15. [Google Scholar] [CrossRef]
  40. Haryanto, Y.; Hu, H.-T.; Han, A.L.; Hsiao, F.-P.; Teng, C.-J.; Hidayat, B.A.; Nugroho, L. Numerical investigation on RC T-beams strengthened in the negative moment region using NSM FRP rods at various depth of embedment. Comput. Concr. 2021, 28, 347–360. [Google Scholar]
  41. Jumaat, M.Z.; Rahman, M.M.; Alam, M.A. Flexural strengthening of RC continuous T-beam using CFRP laminate: A review. Int. J. Phys. Sci. 2010, 5, 619–625. [Google Scholar]
  42. Al-Khafaji, A.; Salim, H. Flexural strengthening of RC continuous T-beams using CFRP. Fibers 2020, 8, 41. [Google Scholar] [CrossRef]
  43. Han, A.L.; Hu, H.-T.; Gan, B.S.; Hsiao, F.-P.; Haryanto, Y. Carbon fiber-reinforced polymer rod embedment depth influence on concrete strengthening. Arab. J. Sci. Eng. 2022, 47, 12685–12695. [Google Scholar] [CrossRef]
  44. Haryanto, Y.; Han, A.L.; Hu, H.-T.; Hsiao, F.-P.; Gan, B.S.; Nugroho, L.; Lin, C.-C. Impact of Non-Reversed Low Cyclic Loading on the Seismic Response of RC T-Beams Strengthened in the Hogging Zone Using NSM-CFRP Rods with Different Embedment Depth. In Proceedings of the 33rd International Ocean and Polar Engineering Conference, Ottawa, ON, Canada, 18–23 June 2023. [Google Scholar]
  45. Haryanto, Y.; Hsiao, F.-P.; Hu, H.-T.; Han, A.L.; Chua, A.W.; Salim, F.; Nugroho, L. Structural behavior of negative moment region NSM-CFRP strengthened RC T-beams with various embedment depth under monotonic and cyclic loading. Compos. Struct. 2022, 301, 116214. [Google Scholar] [CrossRef]
  46. Haryanto, Y.; Hermanto, N.I.S.; Hsiao, F.-P.; Hu, H.-T.; Han, A.L.; Nugroho, L.; Salim, F. Predicting the Behavior of RC T-Beams Strengthened with NSM-CFRP Rods in The Negative Moment Region: A Finite Element Approach for Low Cyclic Loading. In Proceedings of the E3S Web Conference, 2nd International Conference on Disaster Mitigation and Management, Padang, Indonesia, 29–30 September 2023. [Google Scholar]
  47. Nugroho, L.; Haryanto, Y.; Hu, H.-T.; Han, A.L.; Hsiao, F.-P.; Lin, C.-C.; Weng, P.-W.; Widiastuti, E.P. NSM-CFRP rods with varied embedment depths for strengthening RC T-beams in the negative moment region: Investigation on high cyclic response. Compos. Struct. 2024, 331, 117891. [Google Scholar] [CrossRef]
  48. Nugroho, L.; Haryanto, Y.; Hu, H.-T.; Hsiao, F.-P.; Han, A.L.; Widyaningrum, A.; Prasetijo, H. Flexural Capacity of Negative Moment Region NSM-CFRP Strengthened RC T-beam Under High Loading Rate: An Analytical Prediction. In Proceedings of the E3S Web Conference the 2nd International Conference on Disaster Mitigation and Management, Padang, Indonesia, 29–30 September 2023. [Google Scholar]
  49. Nguyen, M.H.; Ho, M.H.; Tran, V.R.; Phan, H.N.; Nguyen, D.D.N.; Huynh, P.N. Flexural performance of reinforced concrete beams strengthened with prestressed FRP sheets: Experiments and numerical investigations. Case Stud. Constr. Mat. 2024, 21, e03475. [Google Scholar] [CrossRef]
  50. Cutolo, A.; Guarracino, F.; Olivieri, C.; Mascolo, I. Nonlinear FE analysis of a masonry spiral staircase in Nisida: A refined numerical case study. Int. J. Multiscale Comput. Eng. 2022, 20, 105–114. [Google Scholar] [CrossRef]
  51. Verre, S. Numerical strategy for column strengthened with FRCM/SRG system. Buildings 2022, 12, 2187. [Google Scholar] [CrossRef]
  52. Nugroho, L.; Haryanto, Y.; Hu, H.-T.; Hsiao, F.-P.; Pamudji, G.; Setiadji, B.H.; Hsu, C.-N.; Weng, P.-W.; Lin, C.-C. Prestressed concrete T-beams strengthened with near-surface mounted carbon-fiber-reinforced polymer rods under monotonic loading: A finite element analysis. Eng 2025, 6, 36. [Google Scholar] [CrossRef]
  53. Haryanto, Y.; Hsiao, F.-P.; Nugroho, L.; Hu, H.-T.; Sudibyo, G.H.; Wariyatno, N.G.; Hidayat, B.A.; Pamudji, G. Enhancing the negative moment flexural capacity of RC T-beams with bonded steel wire ropes—A parametric study. Eng. Fail. Anal. 2025, 180, 109883. [Google Scholar] [CrossRef]
  54. Haryanto, Y.; Wariyatno, N.G.; Hsiao, F.-P.; Hu, H.-T.; Han, A.L.; Nugroho, L.; Hartono, H. RC T-beams with flexural strengthening in the negative moment region under different configurations of NSM CFRP rods. Eng. Fail. Anal. 2025, 173, 109458. [Google Scholar] [CrossRef]
  55. ACI Committee 318. Building Code Requirements for Structural Concrete and Commentary (ACI 318-19); American Concrete Institute: Farmington Hills, MI, USA, 2019. [Google Scholar]
  56. Cervenka, V.; Cervenka, J.; Janda, Z.; Pryl, D. ATENA Program Documentation Part 8: User’s Manual for ATENA-GID Interface; Cervenka Consulting: Prague, Czech Republic, 2021. [Google Scholar]
  57. Alwash, D.; Kalfat, R.; Al-Mahaidi, R. Numerical modelling of RC beams strengthened in shear using NSM FRP and cement based adhesives. Structures 2023, 57, 105217. [Google Scholar] [CrossRef]
  58. Palomo, I.R.I.; Frappa, G.; de Almeida, L.C.; Trautwein, L.M.; Pauletta, M. Analytical and numerical models to determine the strength of RC exterior beam–column joints retrofitted with UHPFRC. Eng. Struct. 2024, 312, 118244. [Google Scholar] [CrossRef]
  59. Zheng, Y.-Z.; Wang, W.-W.; Mosalam, K.M.; Fang, Q.; Chen, L.; Zhu, Z.-F. Experimental investigation and numerical analysis of RC beams shear strengthened with FRP/ECC composite layer. Compos. Struct. 2020, 246, 112436. [Google Scholar] [CrossRef]
  60. Cervenka, V. Constitutive model for cracked reinforced concrete. J. Proc. 1985, 82, 877–882. [Google Scholar]
  61. Vecchio, F.J.; Collins, M.P. The modified compression-field theory for reinforced-concrete elements subjected to shear. J. Proc. 1986, 83, 219–231. [Google Scholar]
  62. Comité Euro-International du Béton. CEB-FIP Model Code 1990: Design Code; Thomas Telford Publishing: London, UK, 1993. [Google Scholar]
  63. Kupfer, H.; Hilsdorf, H.K.; Rüsch, H. Behavior of concrete under biaxial stresses. J. Proc. 1969, 66, 656–666. [Google Scholar] [CrossRef]
  64. Scotta, R.; Vitaliani, R.; Saetta, A.; Oñate, E.; Hanganu, A. A scalar damage model with a shear retention factor for the analysis of reinforced concrete structures: Theory and validation. Comput. Struct. 2001, 79, 737–755. [Google Scholar] [CrossRef]
  65. Vos, E. Influence of Loading Rate and Radial Pressure of Bond in Reinforced Concrete. Ph.D. Thesis, Delft University, Delft, The Netherlands, 1983. [Google Scholar]
  66. ASTM Committee C09. Standard Test Method for Compressive Strength of Cylindrical Concrete Specimens (ASTM C39/C39M-21); ASTM International: West Conshohocken, PA, USA, 2021. [Google Scholar]
  67. ASTM Committee A01. Standard Test Methods and Definitions for Mechanical Testing of Steel Products (ASTM A370-18); ASTM International: West Conshohocken, PA, USA, 2018. [Google Scholar]
  68. Dassault Systèmes. P Projectile Impact on a Carbon Fiber Reinforced Plate (TB-06-CRP-1, revised April 2007). Available online: https://www.3ds.com/assets/invest/2023-10/aero-projectile-impact-on-a-carbon-fiber-reinforced-06.pdf (accessed on 15 March 2024).
  69. Nugroho, L.; Haryanto, Y.; Hsiao, F.-P.; Hu, H.-T.; Weng, P.-W.; Lin, C.-C.; Kristiawan, S.A.; Sangadji, S. Effectiveness of UHPC reinforced with steel rebars for flexural strengthening of RC T-beams in an idealized negative moment region. Structures 2025, 10, 109728. [Google Scholar] [CrossRef]
  70. Poli, A.A.; Cirillo, M.C. On the use of the normalized mean square error in evaluating dispersion model performance. Atmos. Environ. Part A 1993, 27, 2427–2434. [Google Scholar] [CrossRef]
  71. Kumar, A.; Luo, J.; Bennett, G.F. Statistical evaluation of lower flammability distance (LFD) using four hazardous release models. Process Saf. Prog. 1993, 12, 1–11. [Google Scholar] [CrossRef]
  72. Alabdulhady, M.Y.; Ojaimi, M.F.; Chkheiwer, A.H. The efficiency of CFRP strengthening and repair system on the flexural behavior of RC beams constructed with different concrete compressive strength. Results Eng. 2022, 16, 100763. [Google Scholar] [CrossRef]
  73. Ashour, S.A. Effect of compressive strength and tensile reinforcement ratio on flexural behavior of high-strength concrete beams. Eng. Struc. 2000, 22, 413–423. [Google Scholar] [CrossRef]
  74. Abbood, I.S.; Odaa, S.A.; Hasan, K.F.; Jasim, M.A. Properties evaluation of fiber reinforced polymers and their constituent materials used in structures—A review. Mater. Today Proc. 2021, 43, 1003–1008. [Google Scholar] [CrossRef]
  75. Abd el-Hafez, L.M.; Mahmoud, F.R.; Fahmy, N.G.; Tawfic, Y.R. Behavior of large-scale columns strengthened with basalt fiber-reinforced polymers sheets or bars and hybrid FRPs. Case Stud. Constr. Mater. 2023, 19, e02125. [Google Scholar] [CrossRef]
Figure 1. Schematic representation of the negative moment region in a structural system. Red and blue indicate the sign of the value, where red represents negative and blue represents positive.
Civileng 06 00056 g001
Figure 2. Configuration of RC T-beam specimens (unit: mm): (a) Control beam; (b) NSM-CFRP-strengthened beam; (c) Beam with half-embedded CFRP rods; (d) Beam with fully embedded CFRP rods.
Civileng 06 00056 g002aCivileng 06 00056 g002b
Figure 3. Experimental setup of inverted RC T-beam specimens under three-point bending to simulate negative moment behavior [45,54]: (a) Schematic illustration of the inverted beam configuration.; (b) Photograph of the test setup during loading.
Civileng 06 00056 g003aCivileng 06 00056 g003b
Figure 4. Finite element representation of beam specimens: (a) Geometric configuration of the model, where the different colors indicate different materials used in the model; (b) Mesh layout for the unstrengthened beam; (c) Mesh layout for the strengthened beam.
Civileng 06 00056 g004aCivileng 06 00056 g004b
Figure 5. Representation of smeared crack modeling approaches: (a) Fixed crack orientation model; (b) Rotating crack orientation model.
Civileng 06 00056 g005
Figure 6. Constitutive models for concrete: (a) Uniaxial stress–strain relationship; (b) Biaxial failure surface.
Civileng 06 00056 g006
Figure 7. Representation of the shear retention factor in cracked concrete.
Civileng 06 00056 g007
Figure 8. Constitutive stress–strain models for steel and CFRP materials: (a) Linear elastic behavior for CFRP; (b) Bilinear response with strain hardening; (c) Multi-linear representation for steel reinforcement.
Civileng 06 00056 g008
Figure 9. Application of boundary conditions: (a) Line constraint shown in red applied along the support axis; (b) Surface constraint enforcing symmetry at the mid-span section, where red represents the surface constraint in the z-direction and green represents the surface constraint in the x-direction.
Civileng 06 00056 g009
Figure 10. Definition of monitoring points in the FE model: (a) Load measurement at the top of the loading plate, where the arrow symbols indicate the applied force and its direction; (b) Displacement tracking at the beam soffit, where the dot symbols indicate the points used to measure deflection.
Civileng 06 00056 g010
Figure 11. Displacement-controlled loading framework using the Newton–Raphson iterative method.
Civileng 06 00056 g011
Figure 12. Load–deflection responses of tested beam specimens [45,54].
Civileng 06 00056 g012
Figure 13. Observed crack patterns of tested beam specimens [45]: (a) Control beam (CB); (b) Half-embedded NSM CFRP beam (SH); (c) Fully embedded NSM CFRP beam (SF).
Civileng 06 00056 g013
Figure 14. Specimen configuration in the study of Nugroho et al. [69] (unit: mm).
Civileng 06 00056 g014
Figure 15. Load-deflection responses for UHPC-strengthened RC T-beams [69]: (a) Specimen UB; (b) Specimen SB-U13; (c) Specimen SB-U16.
Civileng 06 00056 g015aCivileng 06 00056 g015b
Figure 16. Comparison of numerical and experimental [45,54] load–deflection curves of the unstrengthened control beam (CB).
Civileng 06 00056 g016
Figure 17. Crack development of the control beam (CB): (a) Experimental observation; (b) Numerical simulation.
Civileng 06 00056 g017
Figure 18. Comparison of numerical and experimental [45,54] load–deflection curves of the half-embedded NSM CFRP-strengthened beam (SH).
Civileng 06 00056 g018
Figure 19. Crack development of the half-embedded NSM CFRP-strengthened beam (SH): (a) Experimental observation; (b) Numerical simulation.
Civileng 06 00056 g019
Figure 20. Comparison of numerical and experimental [45,54] load–deflection curves of the fully embedded NSM CFRP-strengthened beam (SF).
Civileng 06 00056 g020
Figure 21. Crack development of the fully embedded NSM CFRP-strengthened beam (SF): (a) Experimental observation; (b) Numerical simulation.
Civileng 06 00056 g021
Figure 22. Load–deflection responses of beam models incorporating different CFRP rod diameters: (a) Half-embedded configuration (SH); (b) Fully embedded configuration (SF). All simulations were conducted using a concrete compressive strength of 27.46 MPa and a longitudinal reinforcement ratio of 1.00%.
Civileng 06 00056 g022
Figure 23. Load–deflection responses of beam models with varying concrete compressive strengths: (a) Half-embedded configuration (SH); (b) Fully embedded configuration (SF). All simulations were performed using 8 mm CFRP rods and a constant longitudinal reinforcement ratio of 1.00%.
Civileng 06 00056 g023
Figure 24. Load–deflection responses of beam models with varying steel reinforcement ratios: (a) Half-embedded configuration (SH); (b) Fully embedded configuration (SF). All simulations were conducted using a concrete compressive strength of 27.46 MP and 8 mm CFRP rods.
Civileng 06 00056 g024
Figure 25. Load–deflection responses of beam models with varying FRP materials: (a) Half-embedded configuration (SH); (b) Fully embedded configuration (SF). All simulations were conducted using a concrete compressive strength of 27.46 MPa constant longitudinal reinforcement ratio of 1.01%.
Civileng 06 00056 g025
Table 1. Input parameters for concrete used in the FE model.
PropertiesFormulaValue
Compressive strength [45,54] ,   f c (MPa)Test result27.46
Tensile strength [56] ,   f t (MPa) 0.5 f c 2.62
Elastic modulus [56] ,   E c (MPa) 3320 f c + 6900 24,297.56
Poisson’s ratio [56] ,   ν N/A0.2
Specific fracture energy [56] ,   G F (N/m) 25 f t 65.50
Critical compressive displacement [56] ,   W d (m)N/A−0.0005
Shear retention factorN/AVariable
Table 2. Mechanical properties of the reinforcing bars.
Bar SizeModulus of Elasticity
(GPa)
Yield Strength (MPa)Yield Strain (µε)Tensile Strength (MPa)
10200350.671800500.85
16200492.252500727.51
Table 3. Comparison of experimental and numerical results for UHPC strengthened RC T-beams.
ParameterUBSB-U13SB-U16
Experimental ultimate load, Pu-exp (kN) [69]176.66327.58388.59
Numerical ultimate load, Pu-num (kN)175.12339.63379.88
Difference (%)0.873.682.24
NMSE (%)0.20.30.3
Table 4. Numerical and experimental comparison of physical response characteristics for the unstrengthened control beam (CB).
InvestigationPhysical Response Characteristics
Ultimate Load
(kN)
Deflection
(mm)
Stiffness
(kN/mm)
Ductility
index
Energy Absorption
(kN.mm)
Experimental153.1436.8213.584.554901.72
Numerical154.0036.8113.394.334915.49
Ratio1.011.000.990.951.00
Table 5. Numerical and experimental comparison of physical response characteristics for the half-embedded NSM CFRP-strengthened beam (SH).
InvestigationPhysical Response Characteristics
Ultimate Load
(kN)
Deflection
(mm)
Stiffness
(kN/mm)
Ductility
Index
Energy Absorption
(kN.mm)
Experimental199.8014.9714.141.792639.61
Numerical200.1215.0015.101.832724.14
Ratio1.001.000.940.980.97
Table 6. Numerical and experimental comparison of physical response characteristics for the fully embedded NSM CFRP-strengthened beam (SF).
InvestigationPhysical Response Characteristics
Ultimate Load
(kN)
Deflection
(mm)
Stiffness
(kN/mm)
Ductility
Index
Energy Absorption
(kN.mm)
Experimental214.1322.3815.012.103708.98
Numerical214.1422.0014.872.063688.69
Ratio1.000.980.990.980.99
Table 7. Effect of CFRP rod diameter variation on the physical response characteristics of RC T-beams strengthened in the negative moment region.
Beam
Model
CFRP Rod Diameter (mm)Physical Response Characteristics
Ultimate Load
(kN)
Stiffness
(kN/m)
Ductility
Index
Energy Absorption
(kN.mm)
ValueRatioValueRatioValueRatioValueRatio
CB-154.00-13.39-4.33-4915.49-
SH-062 Ø6190.781.2413.761.031.740.402585.710.53
SH-082 Ø8200.121.3015.101.131.830.422724.140.55
SH-102 Ø10204.611.3316.771.251.960.452863.750.58
SF-062 Ø6196.101.2713.891.042.100.483417.940.70
SF-082 Ø8214.141.3914.871.112.060.483688.690.75
SF-102 Ø10227.171.4819.761.482.450.574031.370.82
Table 8. Effect of concrete compressive strength variation on the physical response characteristics of RC T-beams strengthened in the negative moment region.
Beam
Model
Concrete Compressive Strength (MPa)Physical Response Characteristics
Ultimate Load
(kN)
Stiffness
(kN/m)
Ductility
Index
Energy Absorption
(kN.mm)
ValueRatioValueRatioValueRatioValueRatio
CB-L17.50147.96-12.24-4.07-4712.28-
CB-B27.46154.00-13.39-4.33-4915.49-
CB-H50.00176.56-14.57-4.75-5495.98-
SH-L17.50193.561.3113.971.141.680.412565.050.54
SH-B27.46200.121.3015.101.131.830.422724.140.55
SH-H50.00208.741.1815.971.101.980.422913.520.53
SF-L17.50198.401.3414.741.202.040.503426.550.73
SF-B27.46214.141.3914.871.112.060.483688.690.75
SF-H50.00225.151.2815.221.042.210.473940.450.72
Table 9. Effect of steel reinforcement ratio variation on the physical response characteristics of RC T-beams strengthened in the negative moment region.
Beam
Model
Steel
Reinforcement Ratio (%)
Physical Response Characteristics
Ultimate Load
(kN)
Stiffness
(kN/m)
Ductility
Index
Energy Absorption
(kN.mm)
ValueRatioValueRatioValueRatioValueRatio
CB-0.60.6149.96-11.29-4.62-4252.28-
CB-1.01.0154.00-13.39-4.33-4915.49-
CB-2.92.9176.56-12.88-3.21-6058.84-
SH-0.60.6169.881.1313.201.171.960.422368.430.56
SH-1.01.0200.121.3015.101.131.830.422724.140.55
SH-2.92.9281.751.6018.041.401.440.453490.460.58
SF-0.60.6179.381.2013.021.152.260.493179.780.75
SF-1.01.0214.141.3914.871.112.060.483688.690.75
SF-2.92.9309.611.7518.761.461.770.554979.600.82
Table 10. Effect of FRP material variation on the physical response characteristics of RC T-beams strengthened in the negative moment region.
Beam
Model
FRP
Material
Physical Response Characteristics
Ultimate Load
(kN)
Stiffness
(kN/m)
Ductility
Index
Energy Absorption
(kN.mm)
ValueRatioValueRatioValueRatioValueRatio
CB-154.00-13.39 4.33-4915.49-
SH-BFRPBFRP189.781.2314.231.061.830.422061.870.42
SH-CFRPCFRP200.121.3015.101.131.830.422724.140.55
SH-AFRPAFRP216.171.4015.901.191.970.452939.220.60
SF-BFRPBFRP198.981.2913.971.042.050.473461.260.70
SF-CFRPCFRP214.141.3914.481.082.060.483688.690.75
SF-AFRPAFRP219.801.4317.471.302.340.543865.820.79
Disclaimer/Publisher’s Note: The statements, opinions and data contained in all publications are solely those of the individual author(s) and contributor(s) and not of MDPI and/or the editor(s). MDPI and/or the editor(s) disclaim responsibility for any injury to people or property resulting from any ideas, methods, instructions or products referred to in the content.