1. Introduction
Due to very low connected porosity of ultra-high-performance concrete (UHPC), it is reported to have excellent performance against deterioration mechanisms that involve water or ion ingress into concrete, including freeze–thaw deterioration [
1,
2].
In conventional concretes, freeze–thaw resistance is typically enhanced by modifying the air-void system. Traditional air-entraining agents (AEAs) generate stable micro-bubbles, while polymeric microspheres have more recently been used to provide uniform and thermo-stable voids. Several studies have examined the microstructural evolution of such systems during cyclic freeze–thaw damage using mercury intrusion porosimetry (MIP) and micro-CT imaging. These works show that the presence and stability of the void system are critical to durability [
3,
4,
5]. However, air entrainment is precluded from being used in UHPC because it would unacceptably reduce its strength. In contrast to normal-strength concrete without air entrainment, UHPC has been shown to have excellent freeze–thaw durability. The low permeability and porosity of UHPC are thought to keep the concrete from becoming critically saturated [
6].
Several studies have been conducted to investigate the freeze–thaw performance of UHPC. Ahlborn et al. performed freeze–thaw cycling on UHPC in accordance with ASTM C666, Procedure B (freezing in air, thawing in water) for 300 cycles with no degradation measured [
7]. Similarly, Acker and Behloul reported that UHPC showed no degradation after 400 cycles of freezing and thawing [
8]. Russell and Graybeal showed that both untreated and steam cured UHPC specimens showed at least a 96% relative dynamic modulus of elasticity after 690 cycles of freeze–thaw, conducted according to ASTM C666 Procedure A when freezing and thawing in water [
9]. Another study measured the resistance of UHPC to freeze–thaw in the presence of a NaCl solution, conducted according to CEN/TS 12390-9, that showed an extremely low mass loss after 112 freeze–thaw cycles [
10]. Another study performed on UHPC with 2.5% steel fibers found a 15.8% increase in loading capacity after 600 freeze and thaw cycles [
11]. Freeze–thaw testing of concrete made with locally produced materials having a 14,100 psi (97 MPa) of compressive strength showed no freeze–thaw damage up to 600 cycles. Between 600 and 1500 cycles, minor damage was observed, resulting in exposed steel fibers and reduced first-cracking strength [
12]. UHPC specimens with compressive strengths ranging from 18 ksi (124 MPa) (ambient cured) to 28 ksi (193 MPa) (steam cured) showed high resistance to freeze–thaw and scaling. Durability testing confirmed that UHPC with strengths above 18 ksi maintained integrity under F–T cycles [
13]. UHPC specimens with compressive strengths exceeding ~21.7 ksi (150 MPa) retained over 90% RDME after 600 F–T cycles, indicating excellent durability, while normal-strength concrete showed only 55% RDME under the same conditions [
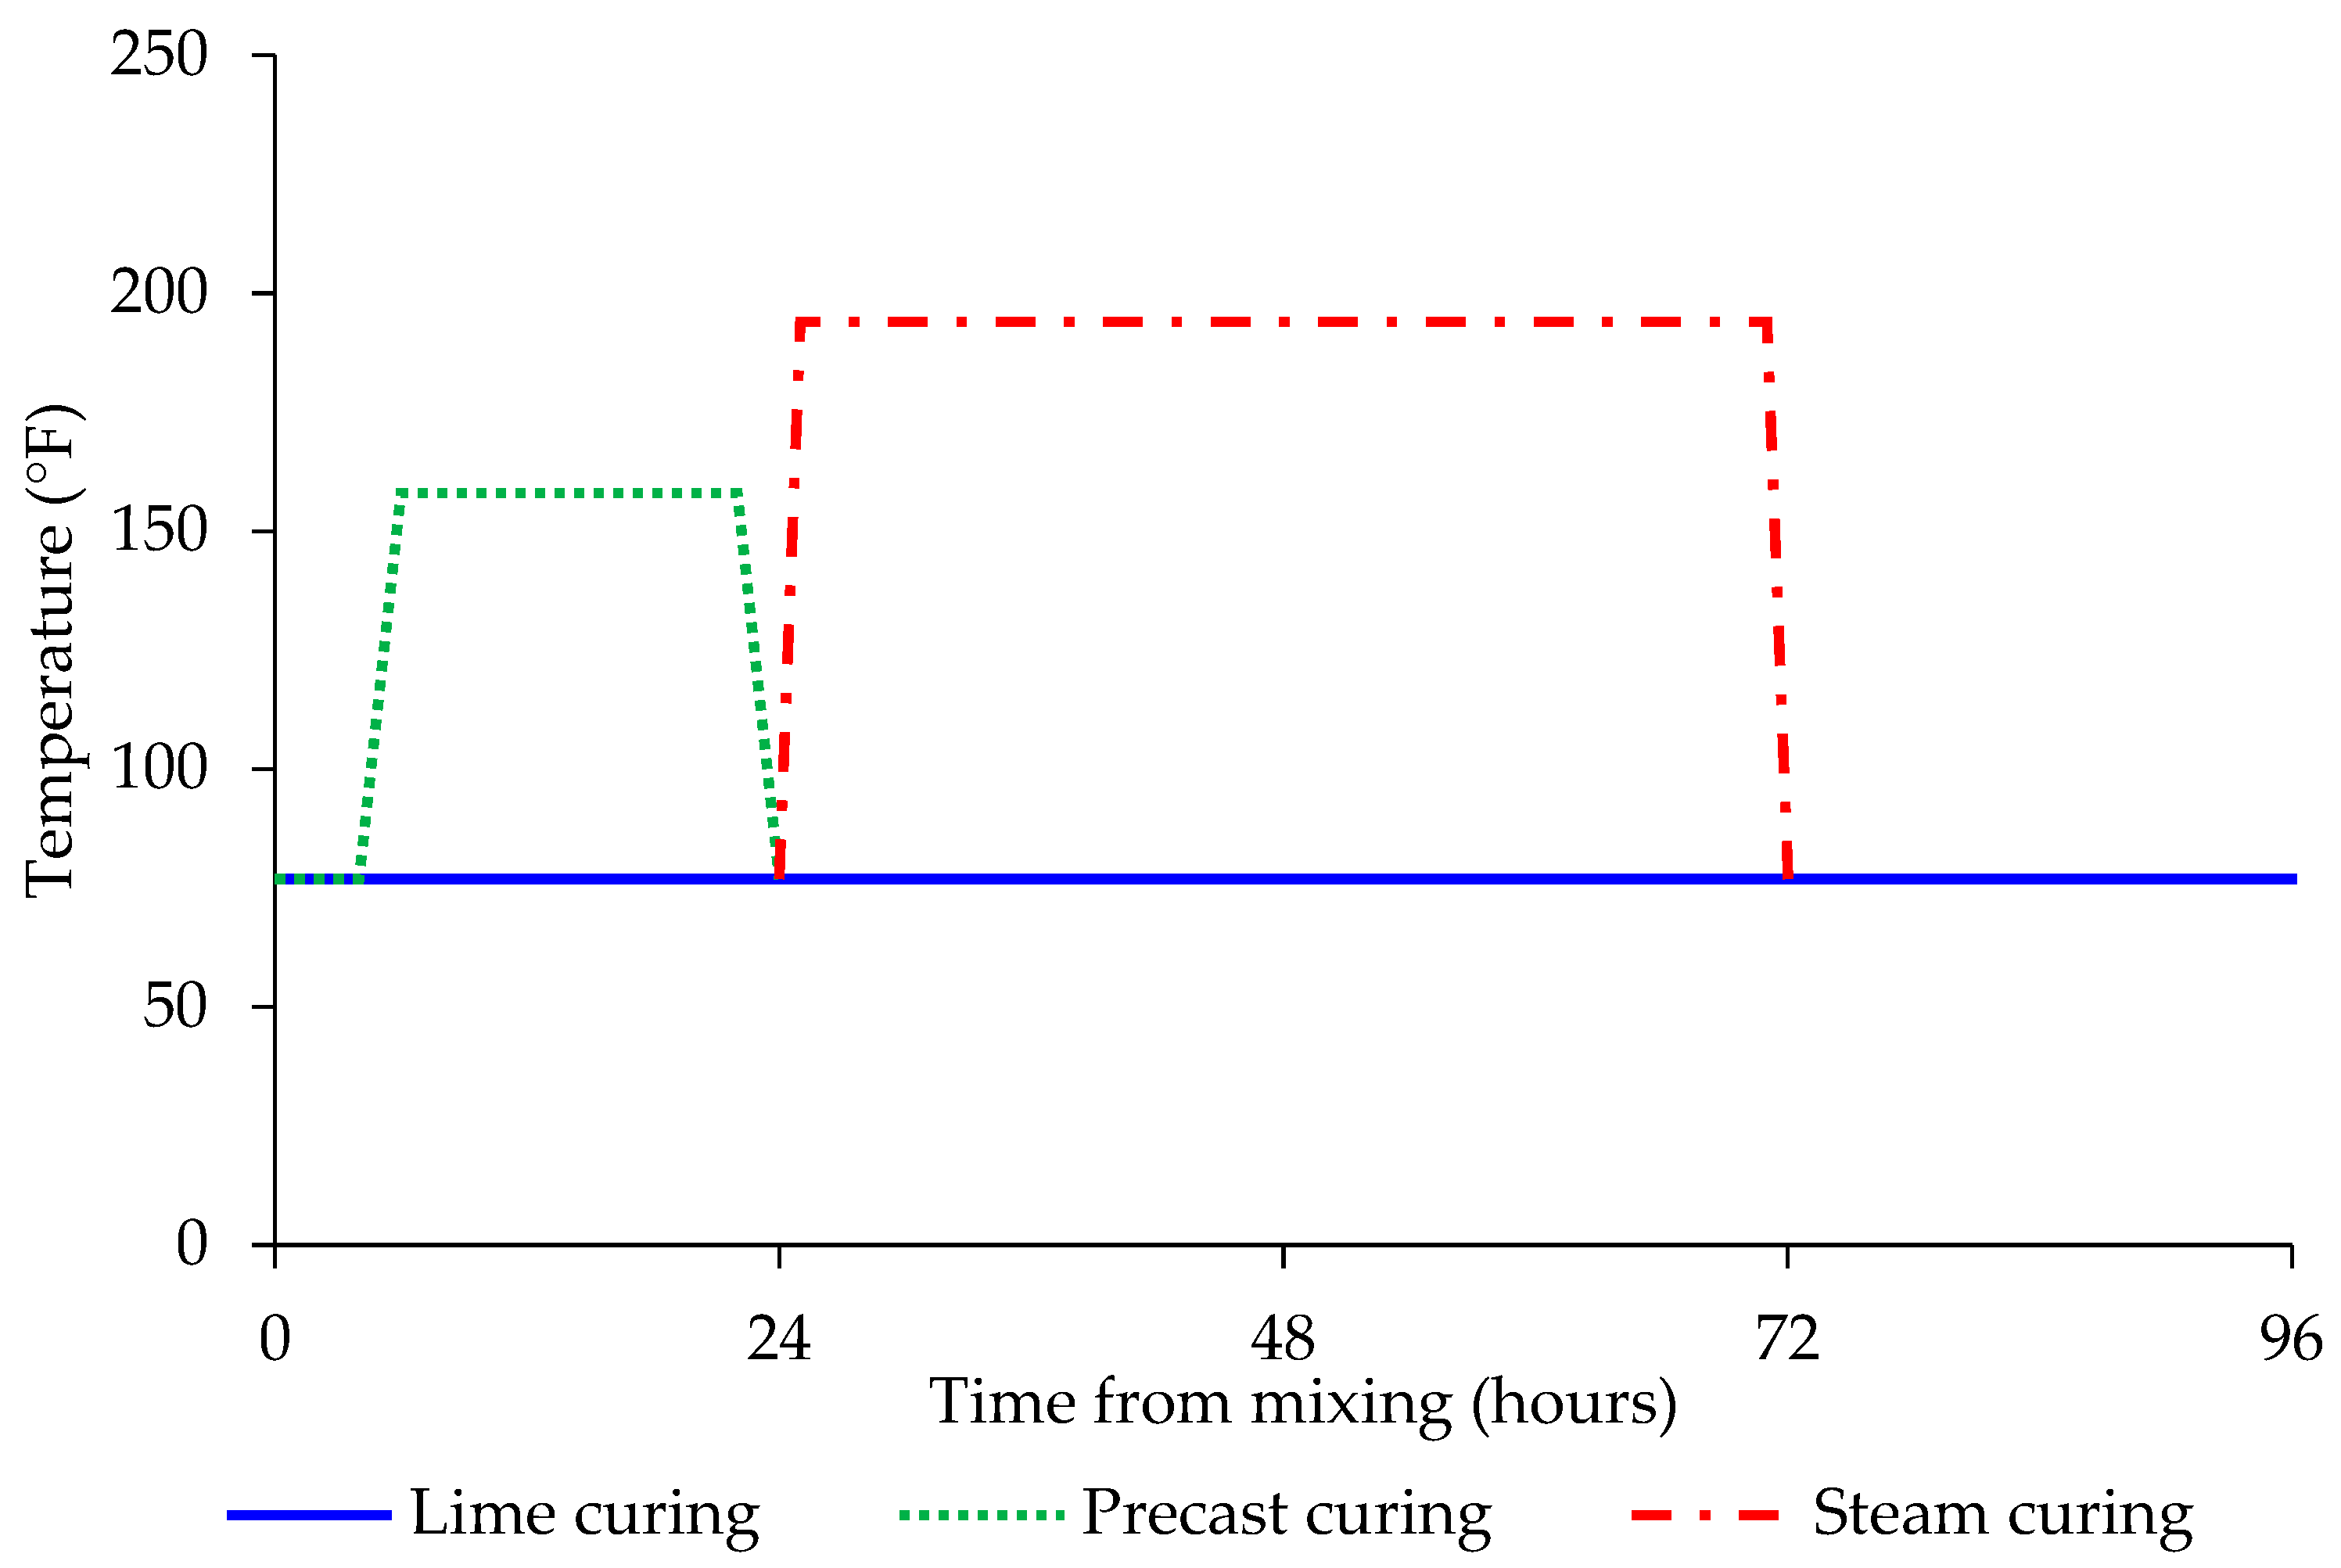
11].
UHPC has been found to have excellent field durability in cold climates. At the Cattenom power plant in France, UHPC was used to replace some of its beams. After six years of exposure in the aggressive environment with natural freeze–thaw cycles, there was no noticeable degradation of the beams [
14]. In another case, UHPC samples were cured at lab temperature for a week, followed by heat curing at 194 °F (90 °C) for 4 days in water and 2 days in air, after which they were placed at the Treat Island, Maine exposure site maintained by the U.S. Army Corps of Engineers. Tide levels vary by as much as 22 feet at this site, with the temperature during the winter ranging from −10 °F to −37 °F (−23 °C to −38 °C), making this site an ideal place to test UHPC performance. After several years of exposure and hundreds of freeze–thaw cycles, no evidence of deterioration or mass loss was seen on any samples [
15].
ASTM C1856 requires UHPC freeze–thaw testing to be conducted according to ASTM C666 Procedure A for at least 300 cycles or until its relative dynamic modulus of elasticity reaches 90% [
16]. ASTM C666 requires the concrete to be cured in limewater for 14 days before testing, or 2 days if saw-cut from hardened concrete [
17]. No changes are recommended for UHPC curing or saturation level. If UHPC freeze–thaw durability comes from a low degree of saturation, this may not be reliable in the long term.
While theories exist on the mechanism responsible for UHPC freeze–thaw durability, testing is needed to validate these theories. This will provide guidance to mixture design and test methods required for freeze–thaw performance. Previous UHPC testing performed to date has mostly focused on concrete with compressive strength above 21 ksi (145 MPa). It is also not known at what strength level UHPC transitions to excellent freeze–thaw performance. Therefore, in this study, testing was conducted to determine if this excellent performance extended to the lower strength levels ranging from high performance to ultra-high-performance concrete.
In this study, four non-proprietary UHPC mixtures with different mixture proportions, including different water-cementitious material ratios (w/cm), were made to test the performance of UHPC against freeze–thaw cycling. The mixtures were designed for multiple strength classes and curing methods to determine how mixture design components, compressive strength, and curing methods affected the concrete F–T resistance. Samples for freeze–thaw durability were made and tested using 1.5% steel fibers for all the different strength classes tested [
18]. The samples were tested for up to 330 cycles to determine at which strength level the UHPC F–T performance becomes acceptable without the use of air entrainment. Low-temperature differential scanning calorimetry (DSC) and mercury intrusion porosimetry (MIP) tests were also used to reveal the freeze–thaw mechanism of the concrete samples.
3. Results and Discussion
3.1. Compressive Strength
The average compressive strength, standard deviation, and coefficient of variation for each mixture are presented in
Table 8.
p-values were also calculated from 2-factor t-tests comparing compressive strength results of each sample group to each other group.
p-values of less than 0.05 were obtained, showing that the curing methods had a significant impact on compressive strength. Even though the mixtures were designed to meet the strength target for 28 days of curing, most of the limewater-cured samples and all the steam-cured samples met the target strength at 14 days. The steam curing increased the compressive strength for all mixtures except for the lowest strength class mixture. The precast curing lowered the concrete strength for all mixtures, showing the importance of the pre-curing before steam curing in forming a good microstructure [
34]. Also, the precast curing may accelerate hydration unevenly, leading to microstructural inconsistencies that reduce compressive strength [
34].
3.2. Freeze–Thaw Testing
ASTM C666 [
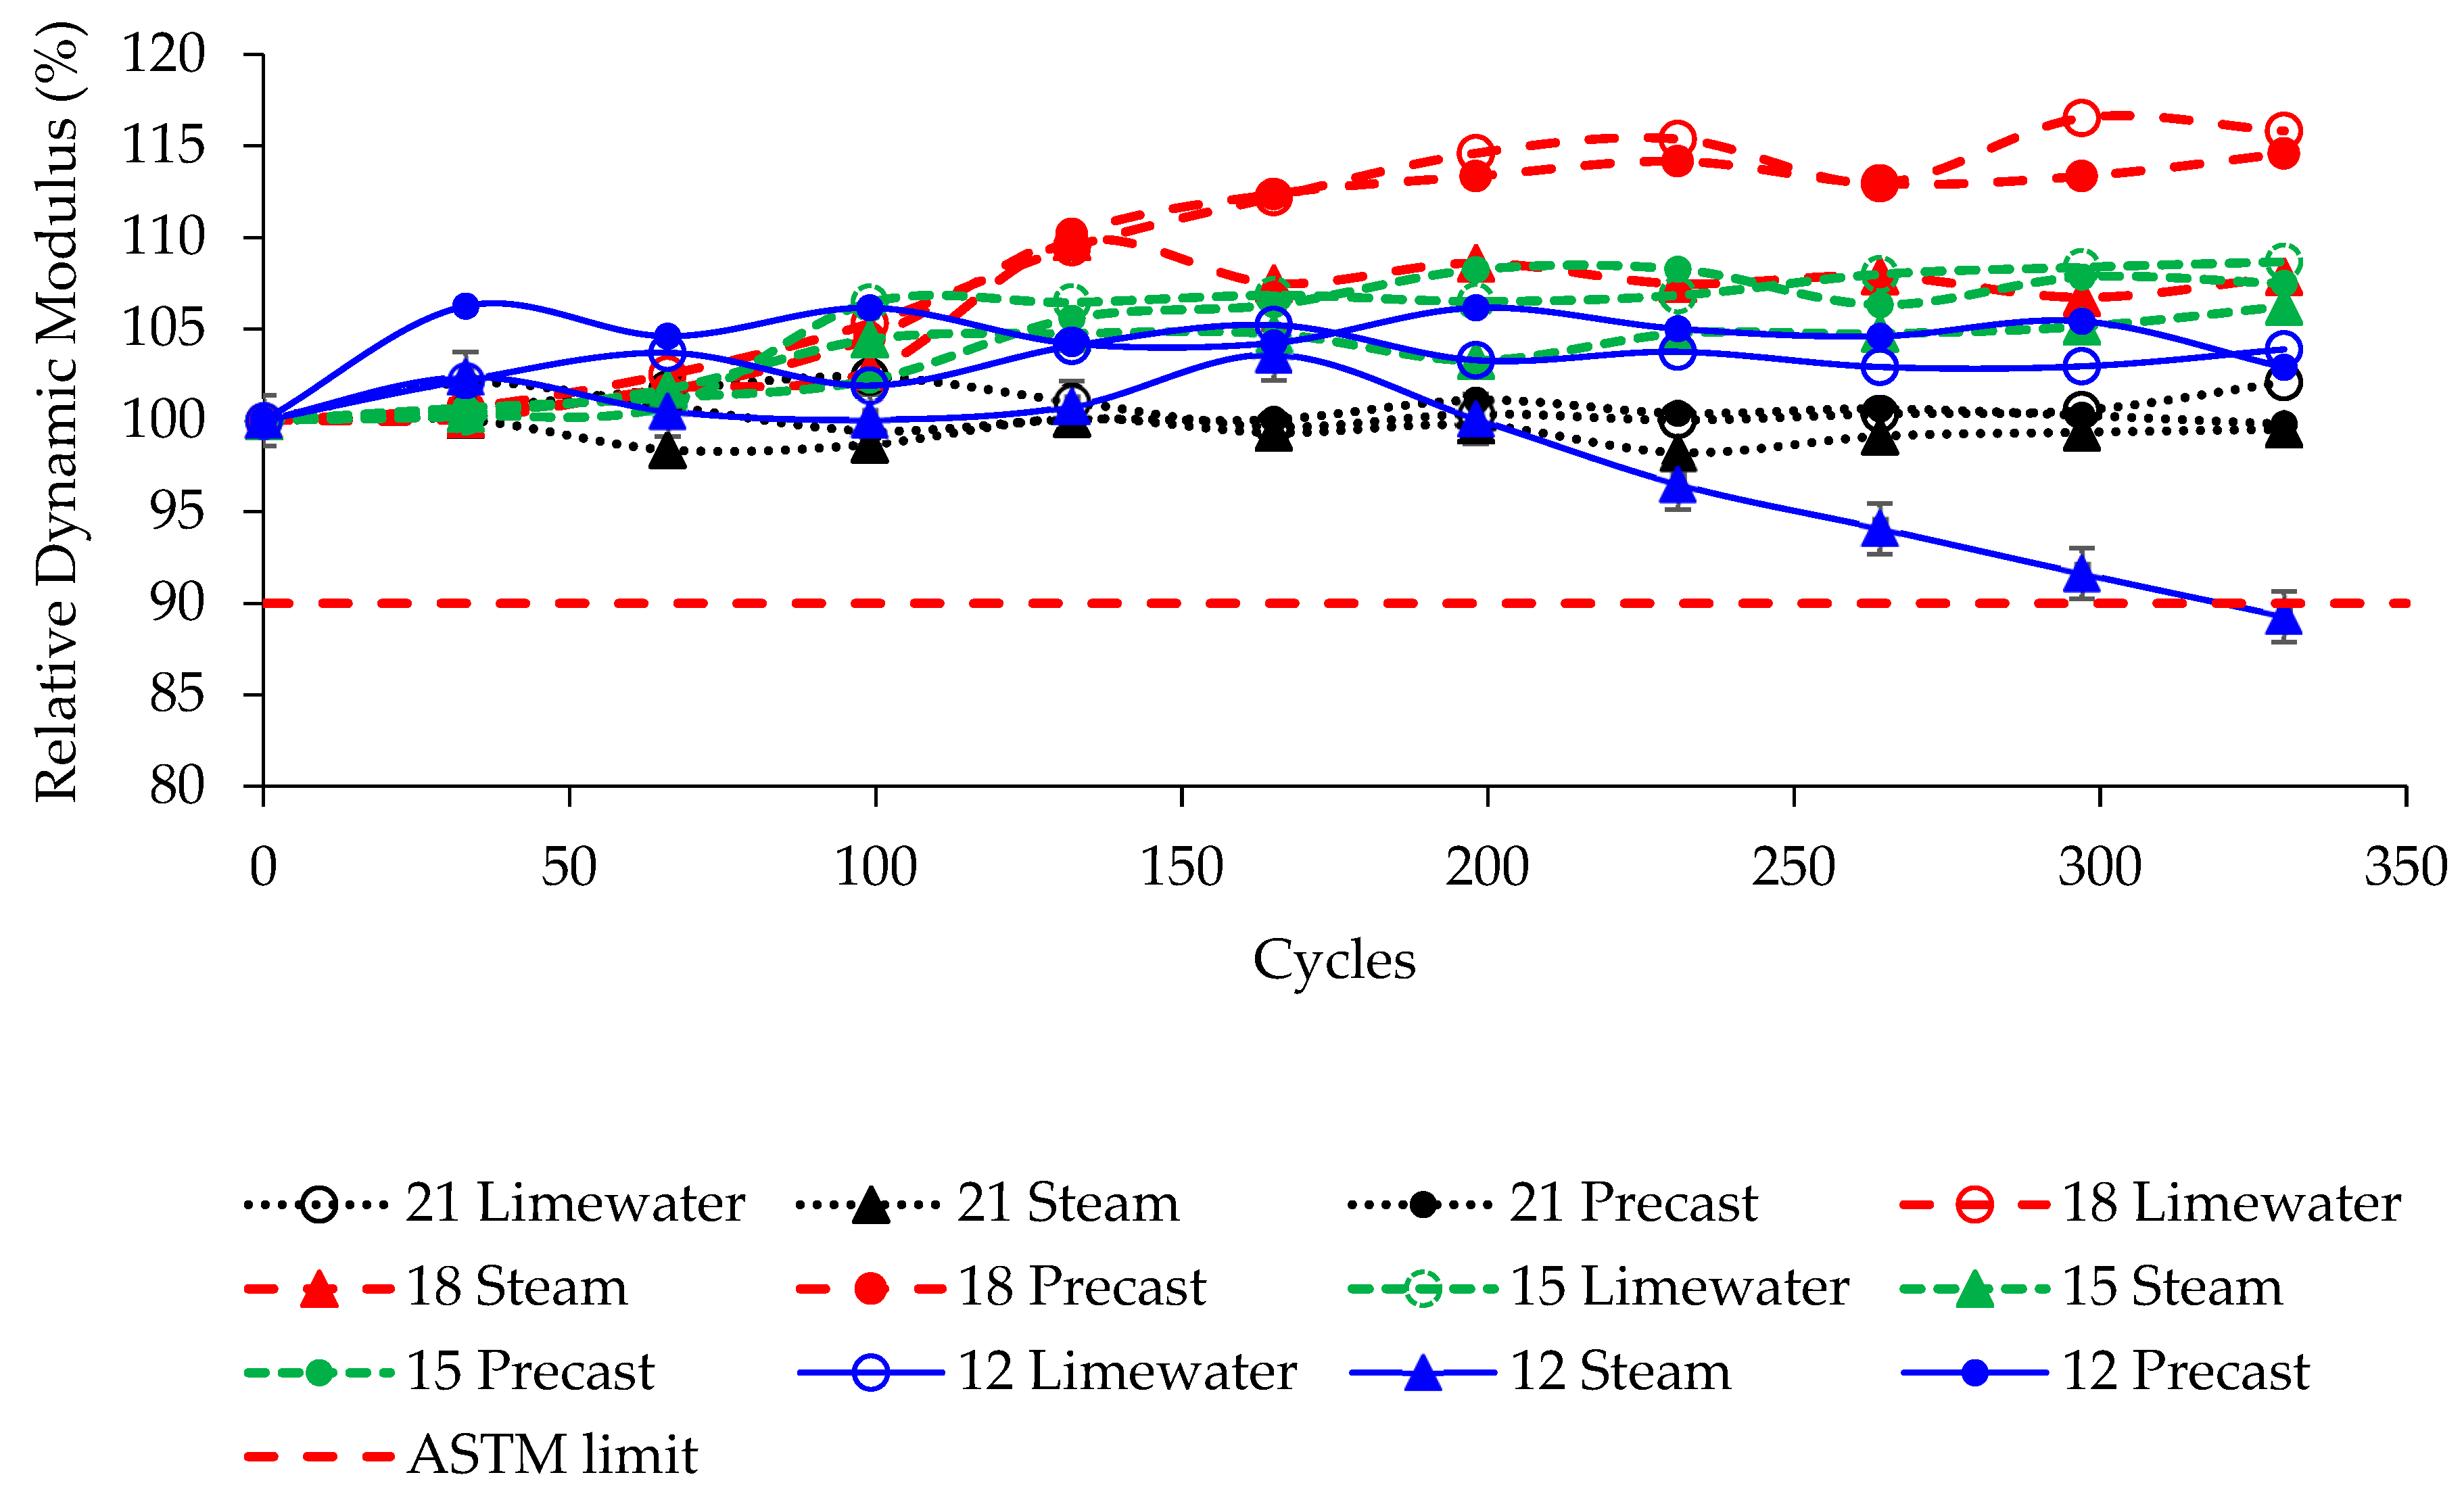
17] was followed to study the freeze–thaw durability of concrete made for four different strength classes and three different curing methods. The UHPC relative dynamic modulus of elasticity (RDME) with increasing cycles is shown in
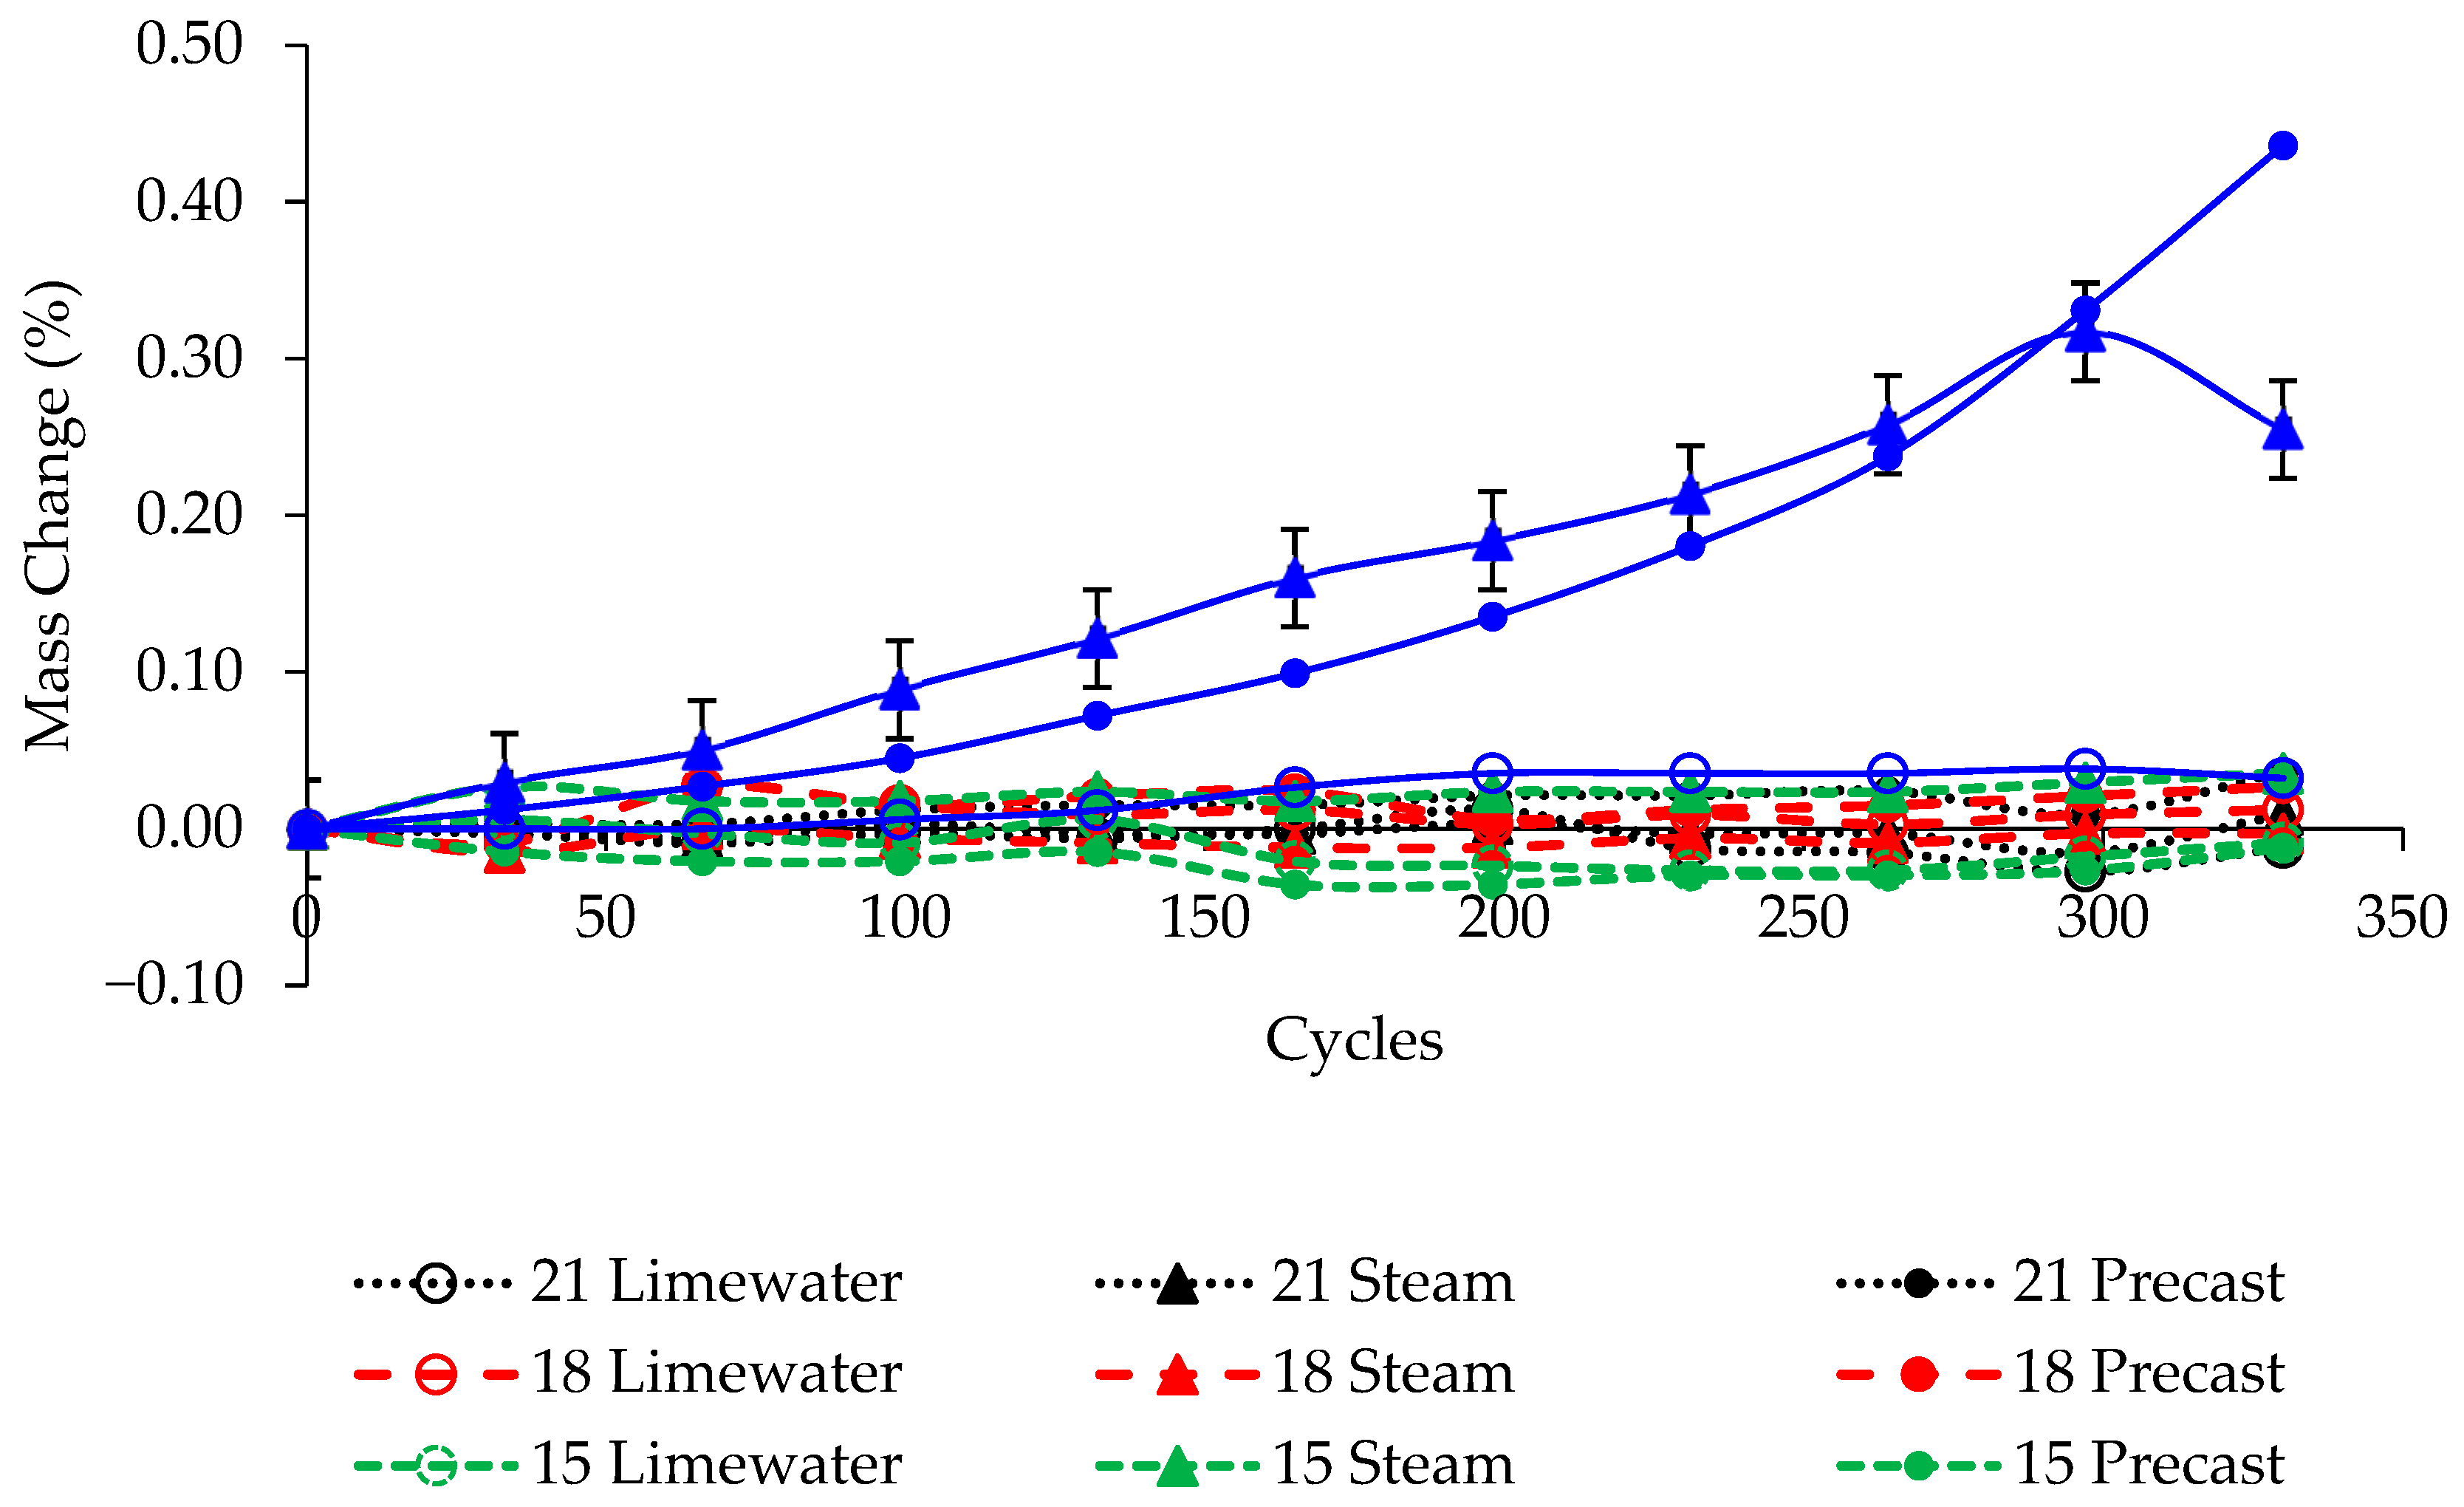
Figure 3, and the mass change is shown in
Figure 4. After 330 cycles, the 12 ksi mixture showed higher mass gains of 0.03%, 0.25%, and 0.44% for the limewater-cured, steam-cured, and precast-cured samples, respectively. This could indicate internal cracks that absorbed water during the testing [
35]. The relative dynamic modulus was observed to increase at least slightly for all mixtures cured in limewater. This expected increase is because of increased hydration with exposure to moisture during the test and is in agreement with experimental results found by others [
35,
36,
37]. The steam-cured samples showed the lowest values with cycling because the steam curing likely increased the degree of reaction, leaving less space available for additional hydration. The precast-cured samples showed RDME in between that of the limewater-cured and steam-cured samples. The steam-cured specimens for the lowest strength class started to show a decrease in the relative dynamic modulus by 165 freeze–thaw cycles, and were close to falling below the ASTM C1856 limit of 90% at the 300 cycles [
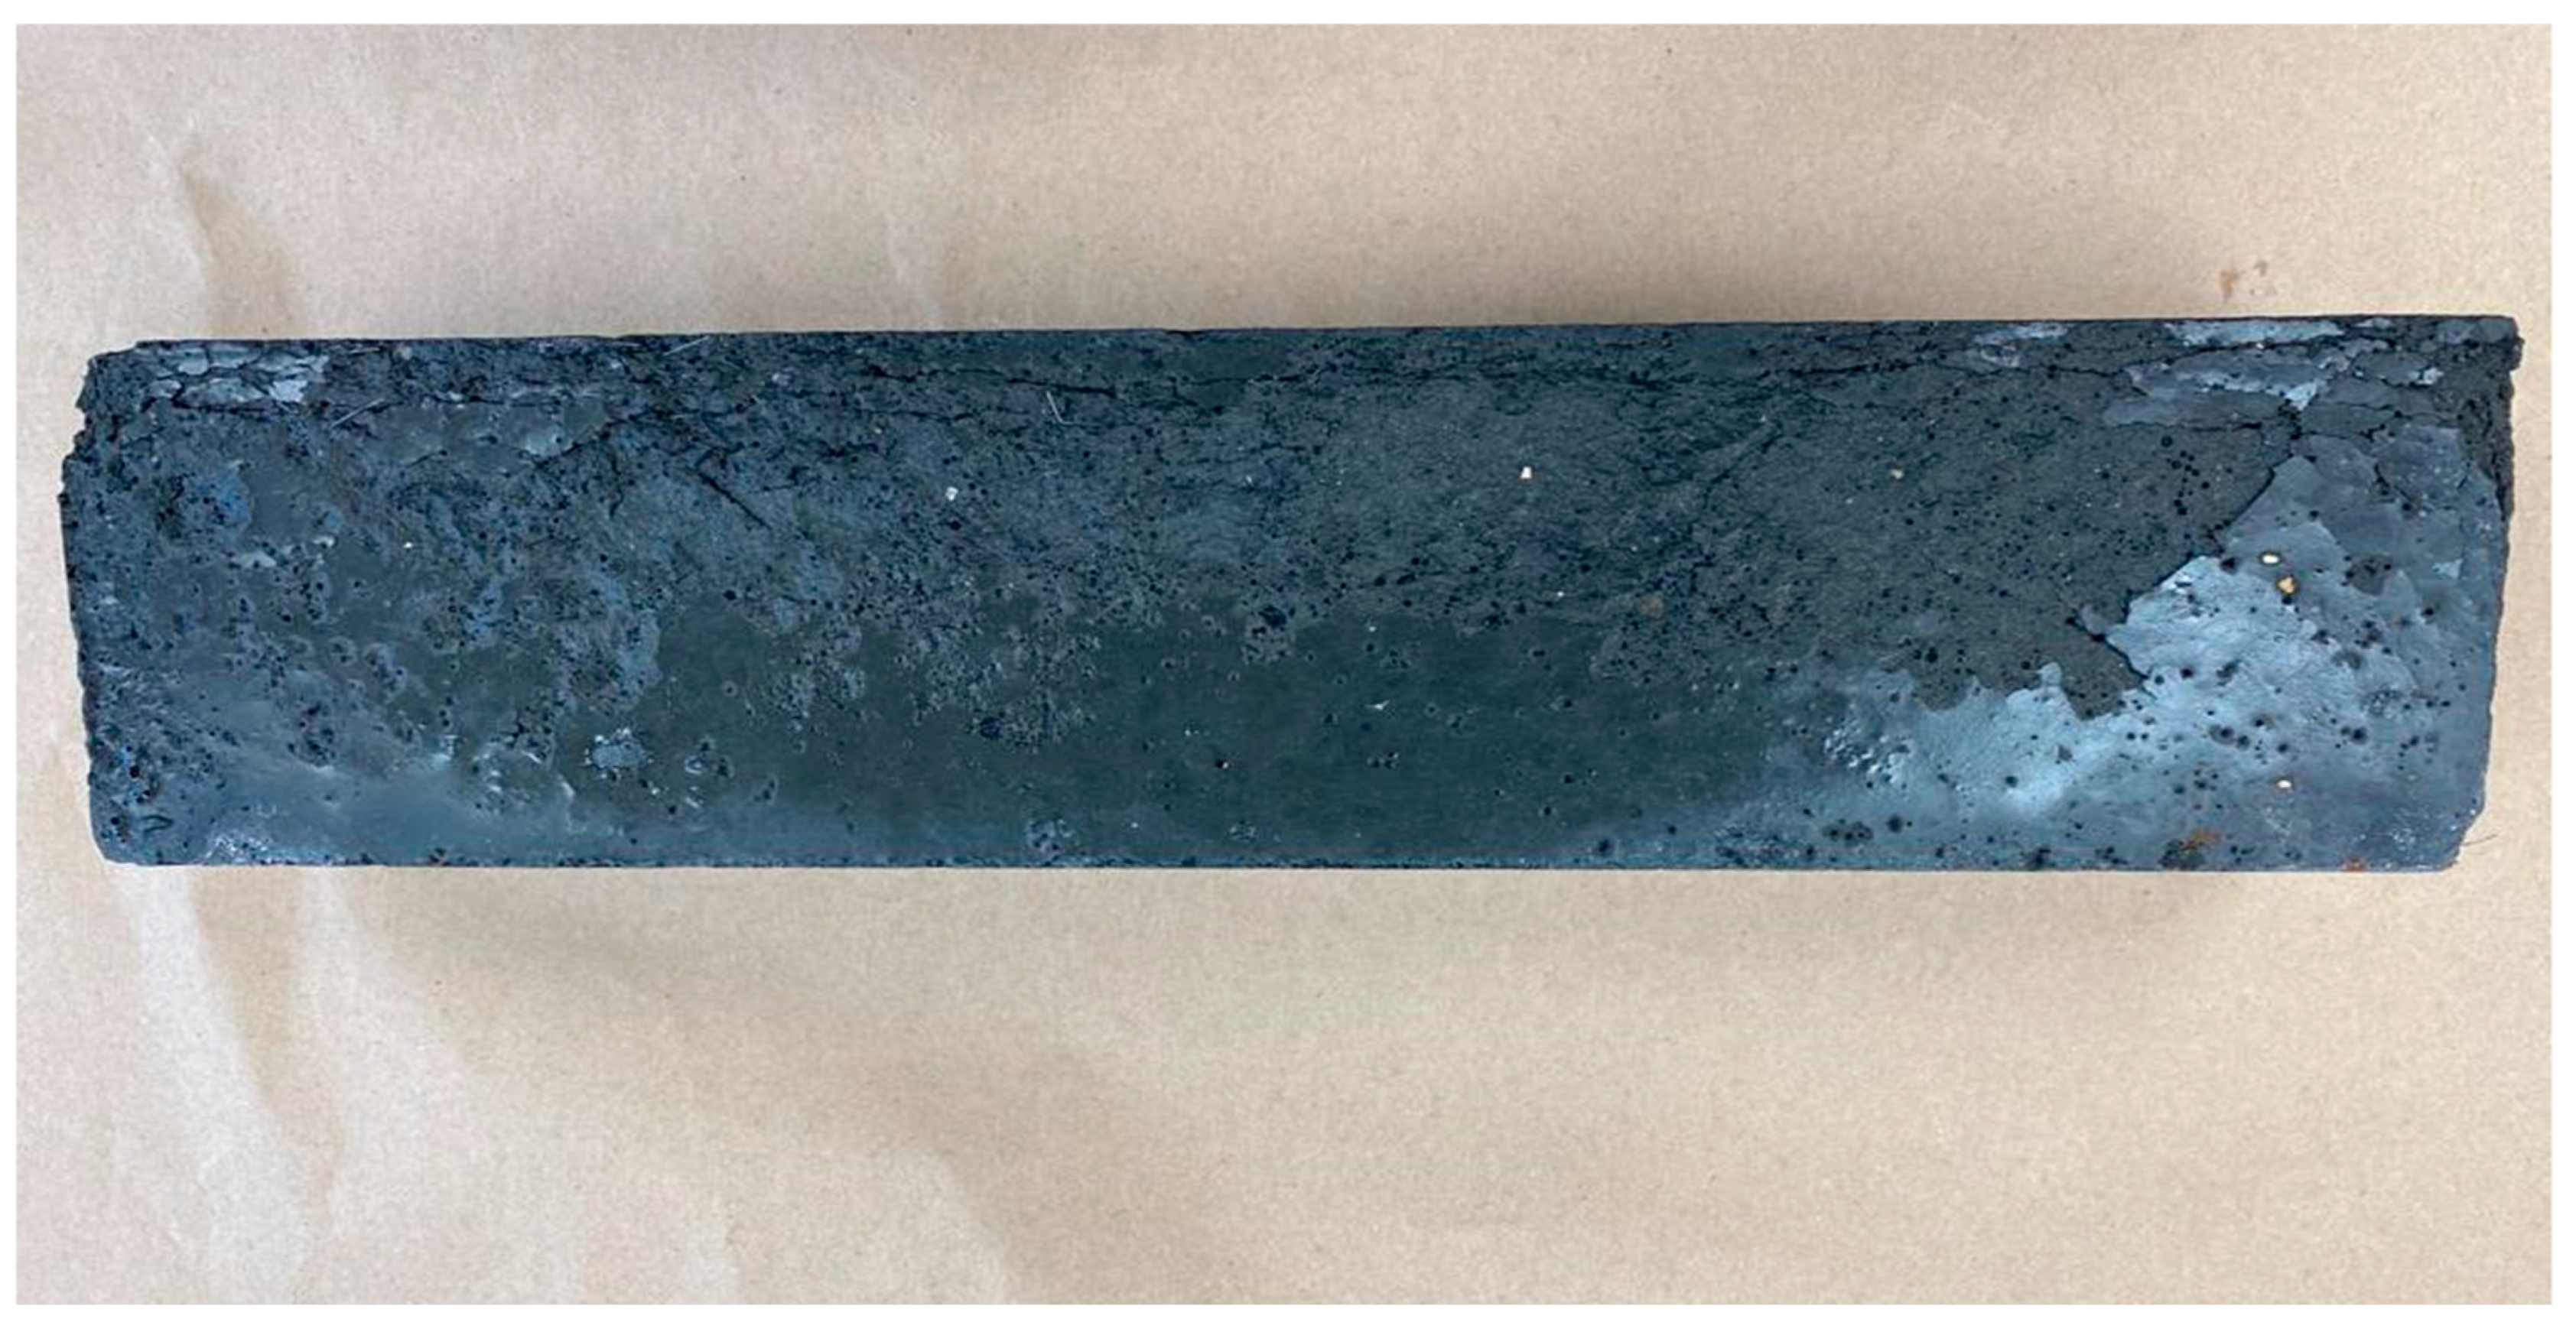
16]. This was manifest visually as some light surface scaling.
Figure 5 shows a picture of a 12 ksi steam-cured sample at the end of testing, clearly showing surface scaling. The 12 ksi samples had the highest initial water content: 15%, 24%, and 45% higher than the 15 ksi, 18 ksi, and 21+ ksi samples, respectively. The surface scaling might be from an interfacial layer, high in cementitious material, between the UHPC and the sides of the mold that formed during placement that is vulnerable to scaling. A study by Lee Ming showed a similar trend to this observation as they found that when compared to samples that had undergone standard curing, the steam-cured samples had slightly lower relative dynamic modulus [
38,
39]. Another study performed by Graybeal showed that the RDME decreased slightly for the steam-treated specimens compared to a significant increase for the untreated specimens, as the untreated UHPC had more unhydrated cementitious particles and space available for continued hydration [
40]. In general, this indicates that the steam-cured samples exhibited higher levels of hydration before testing.
3.3. Low-Temperature DSC Testing
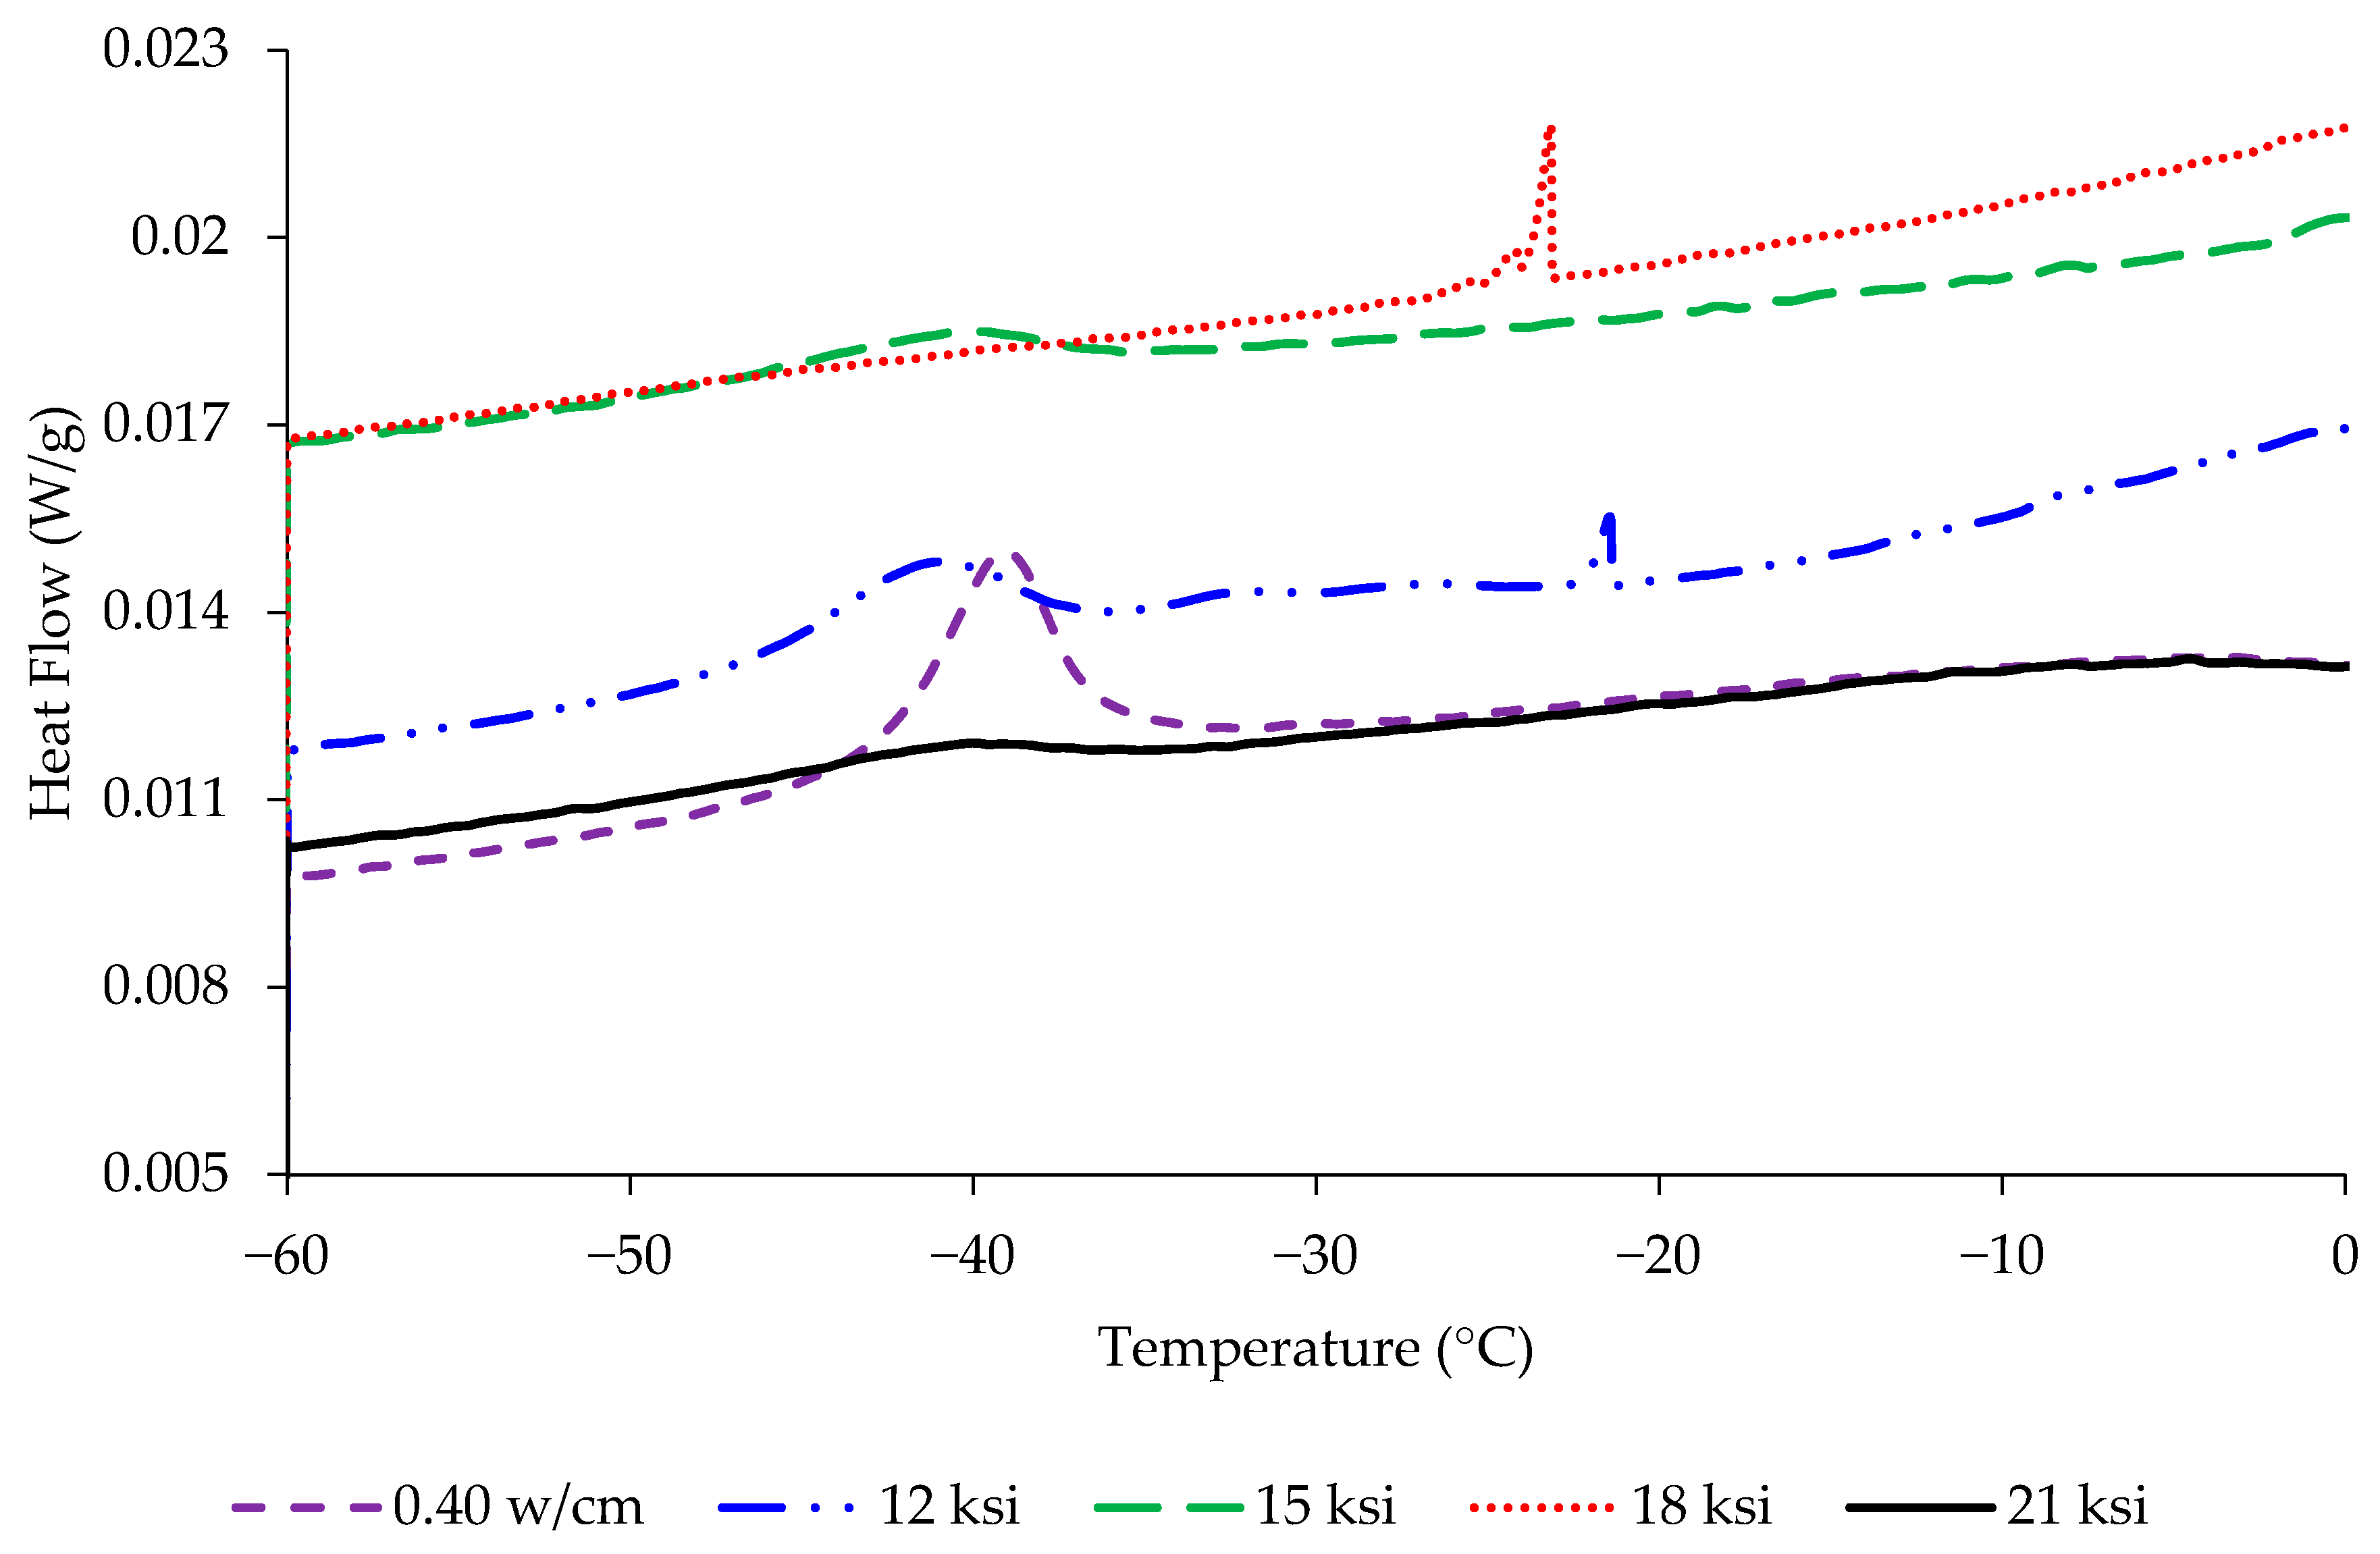
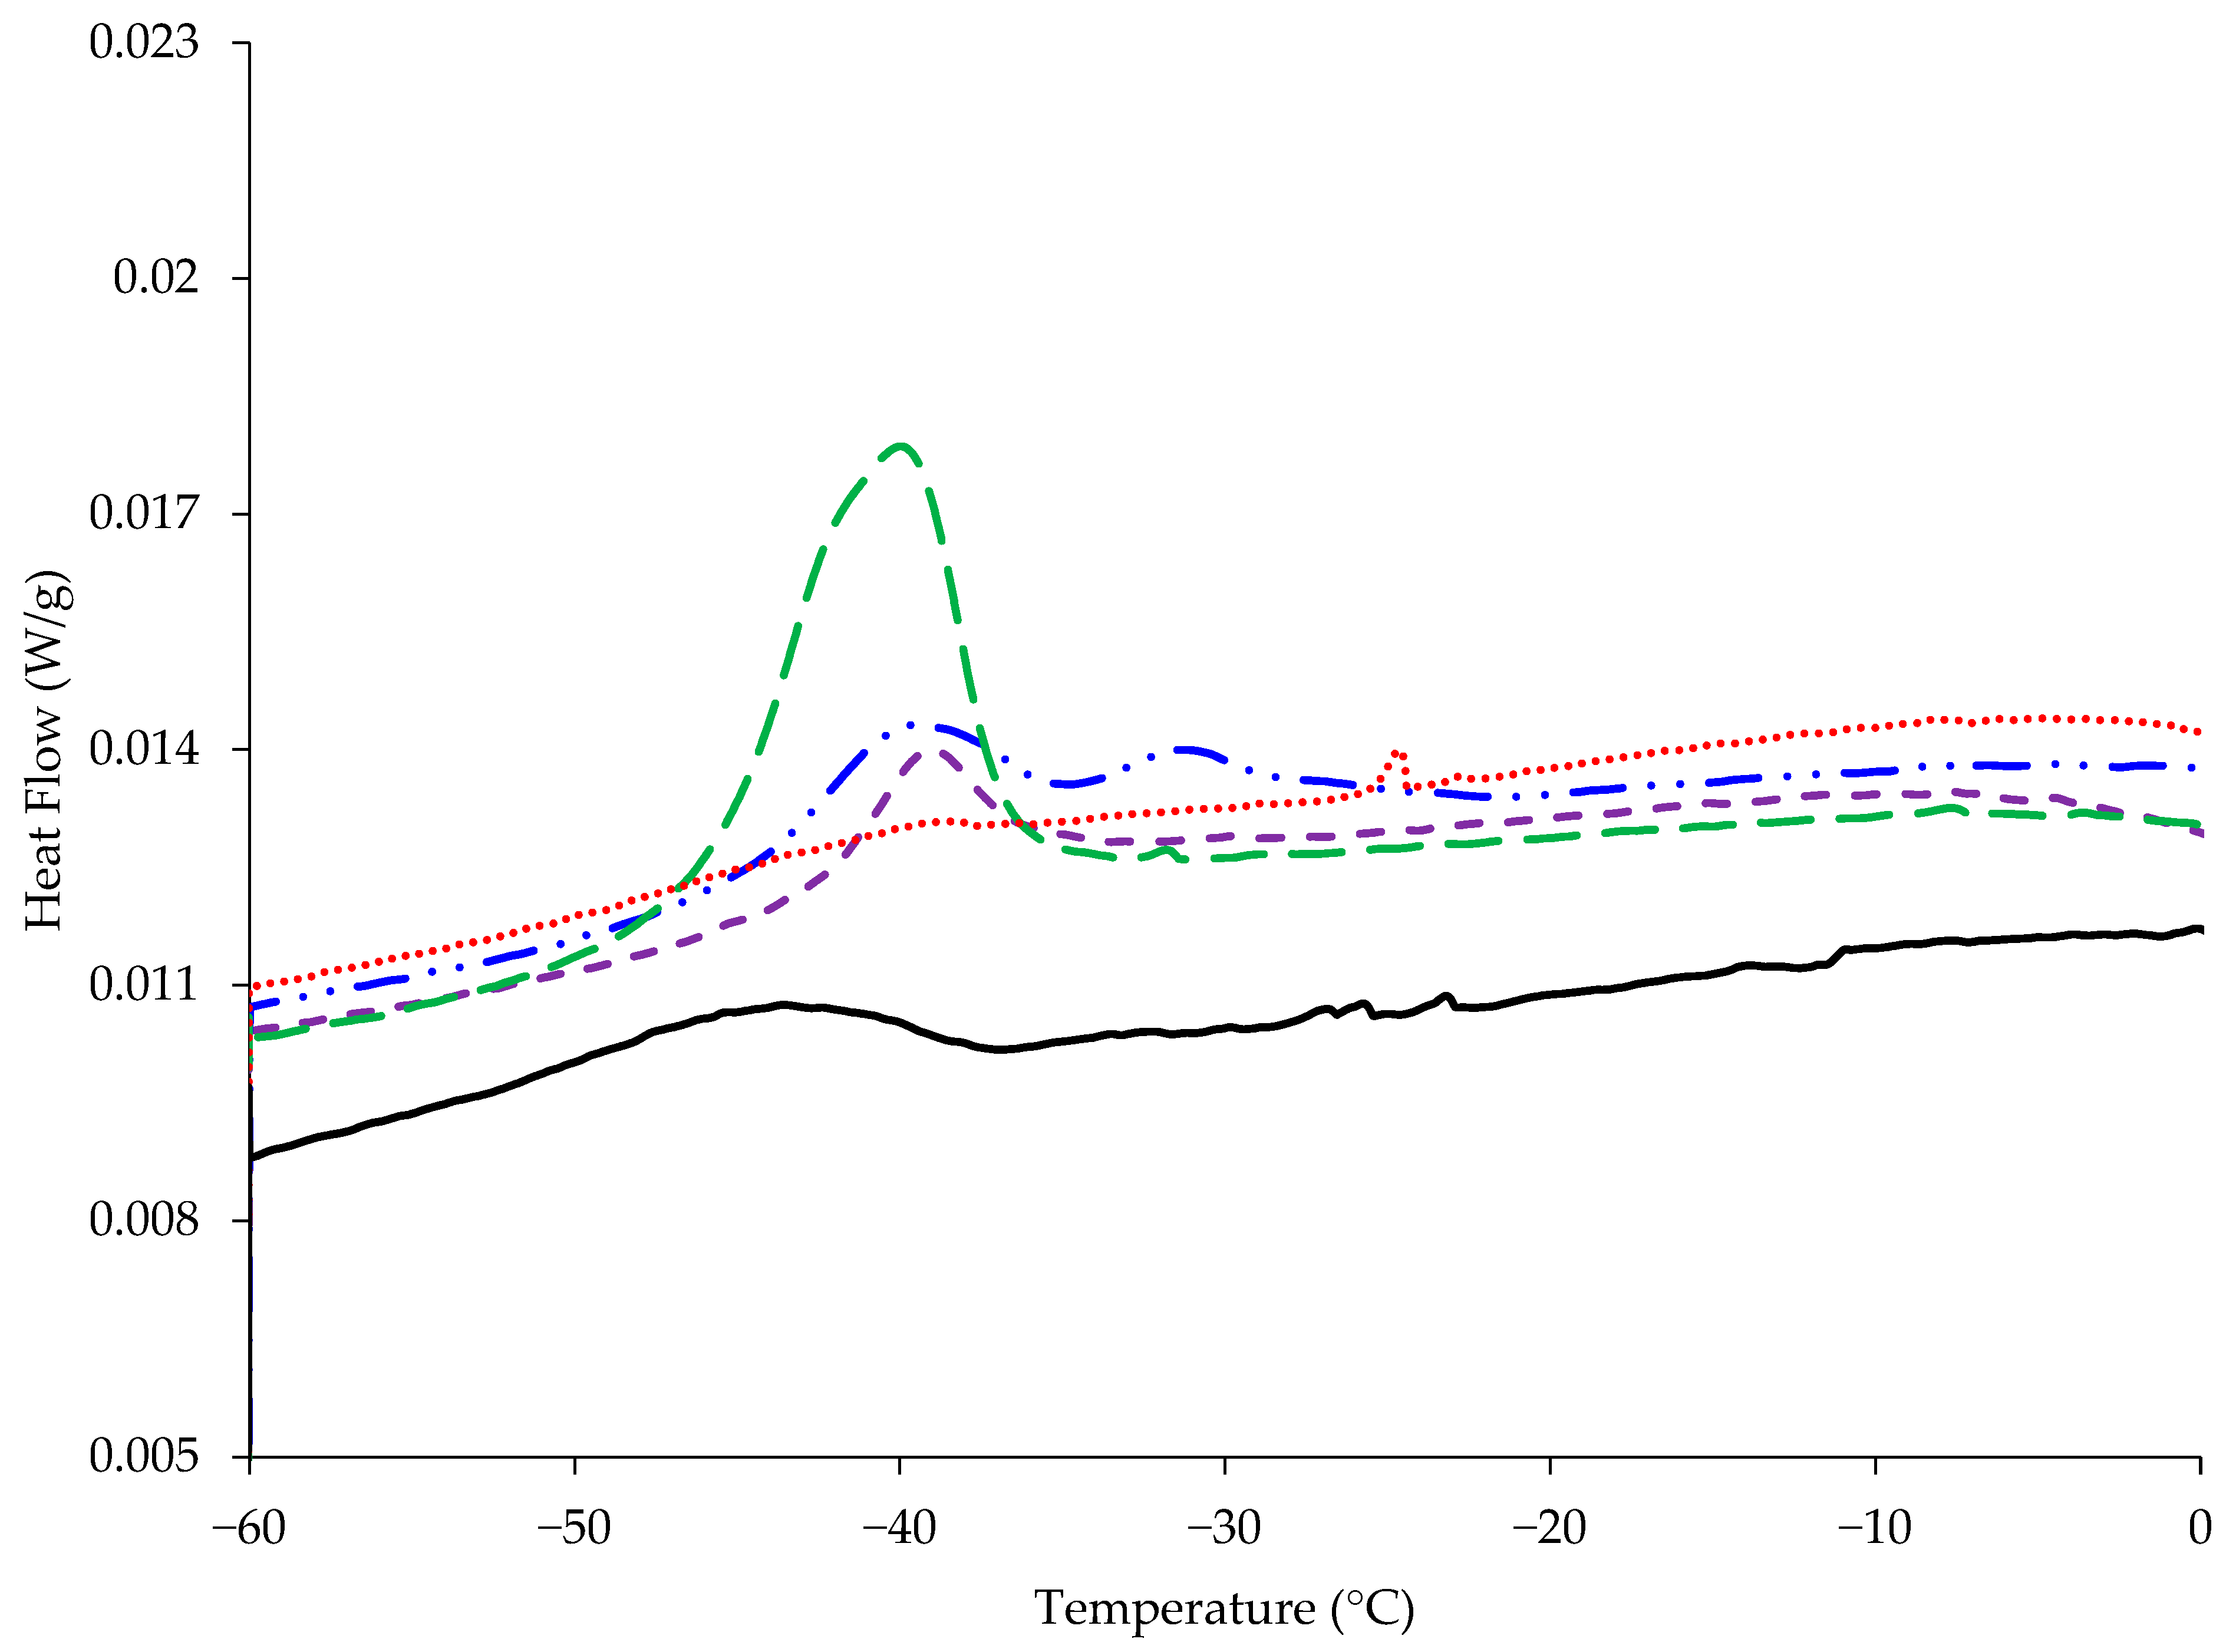
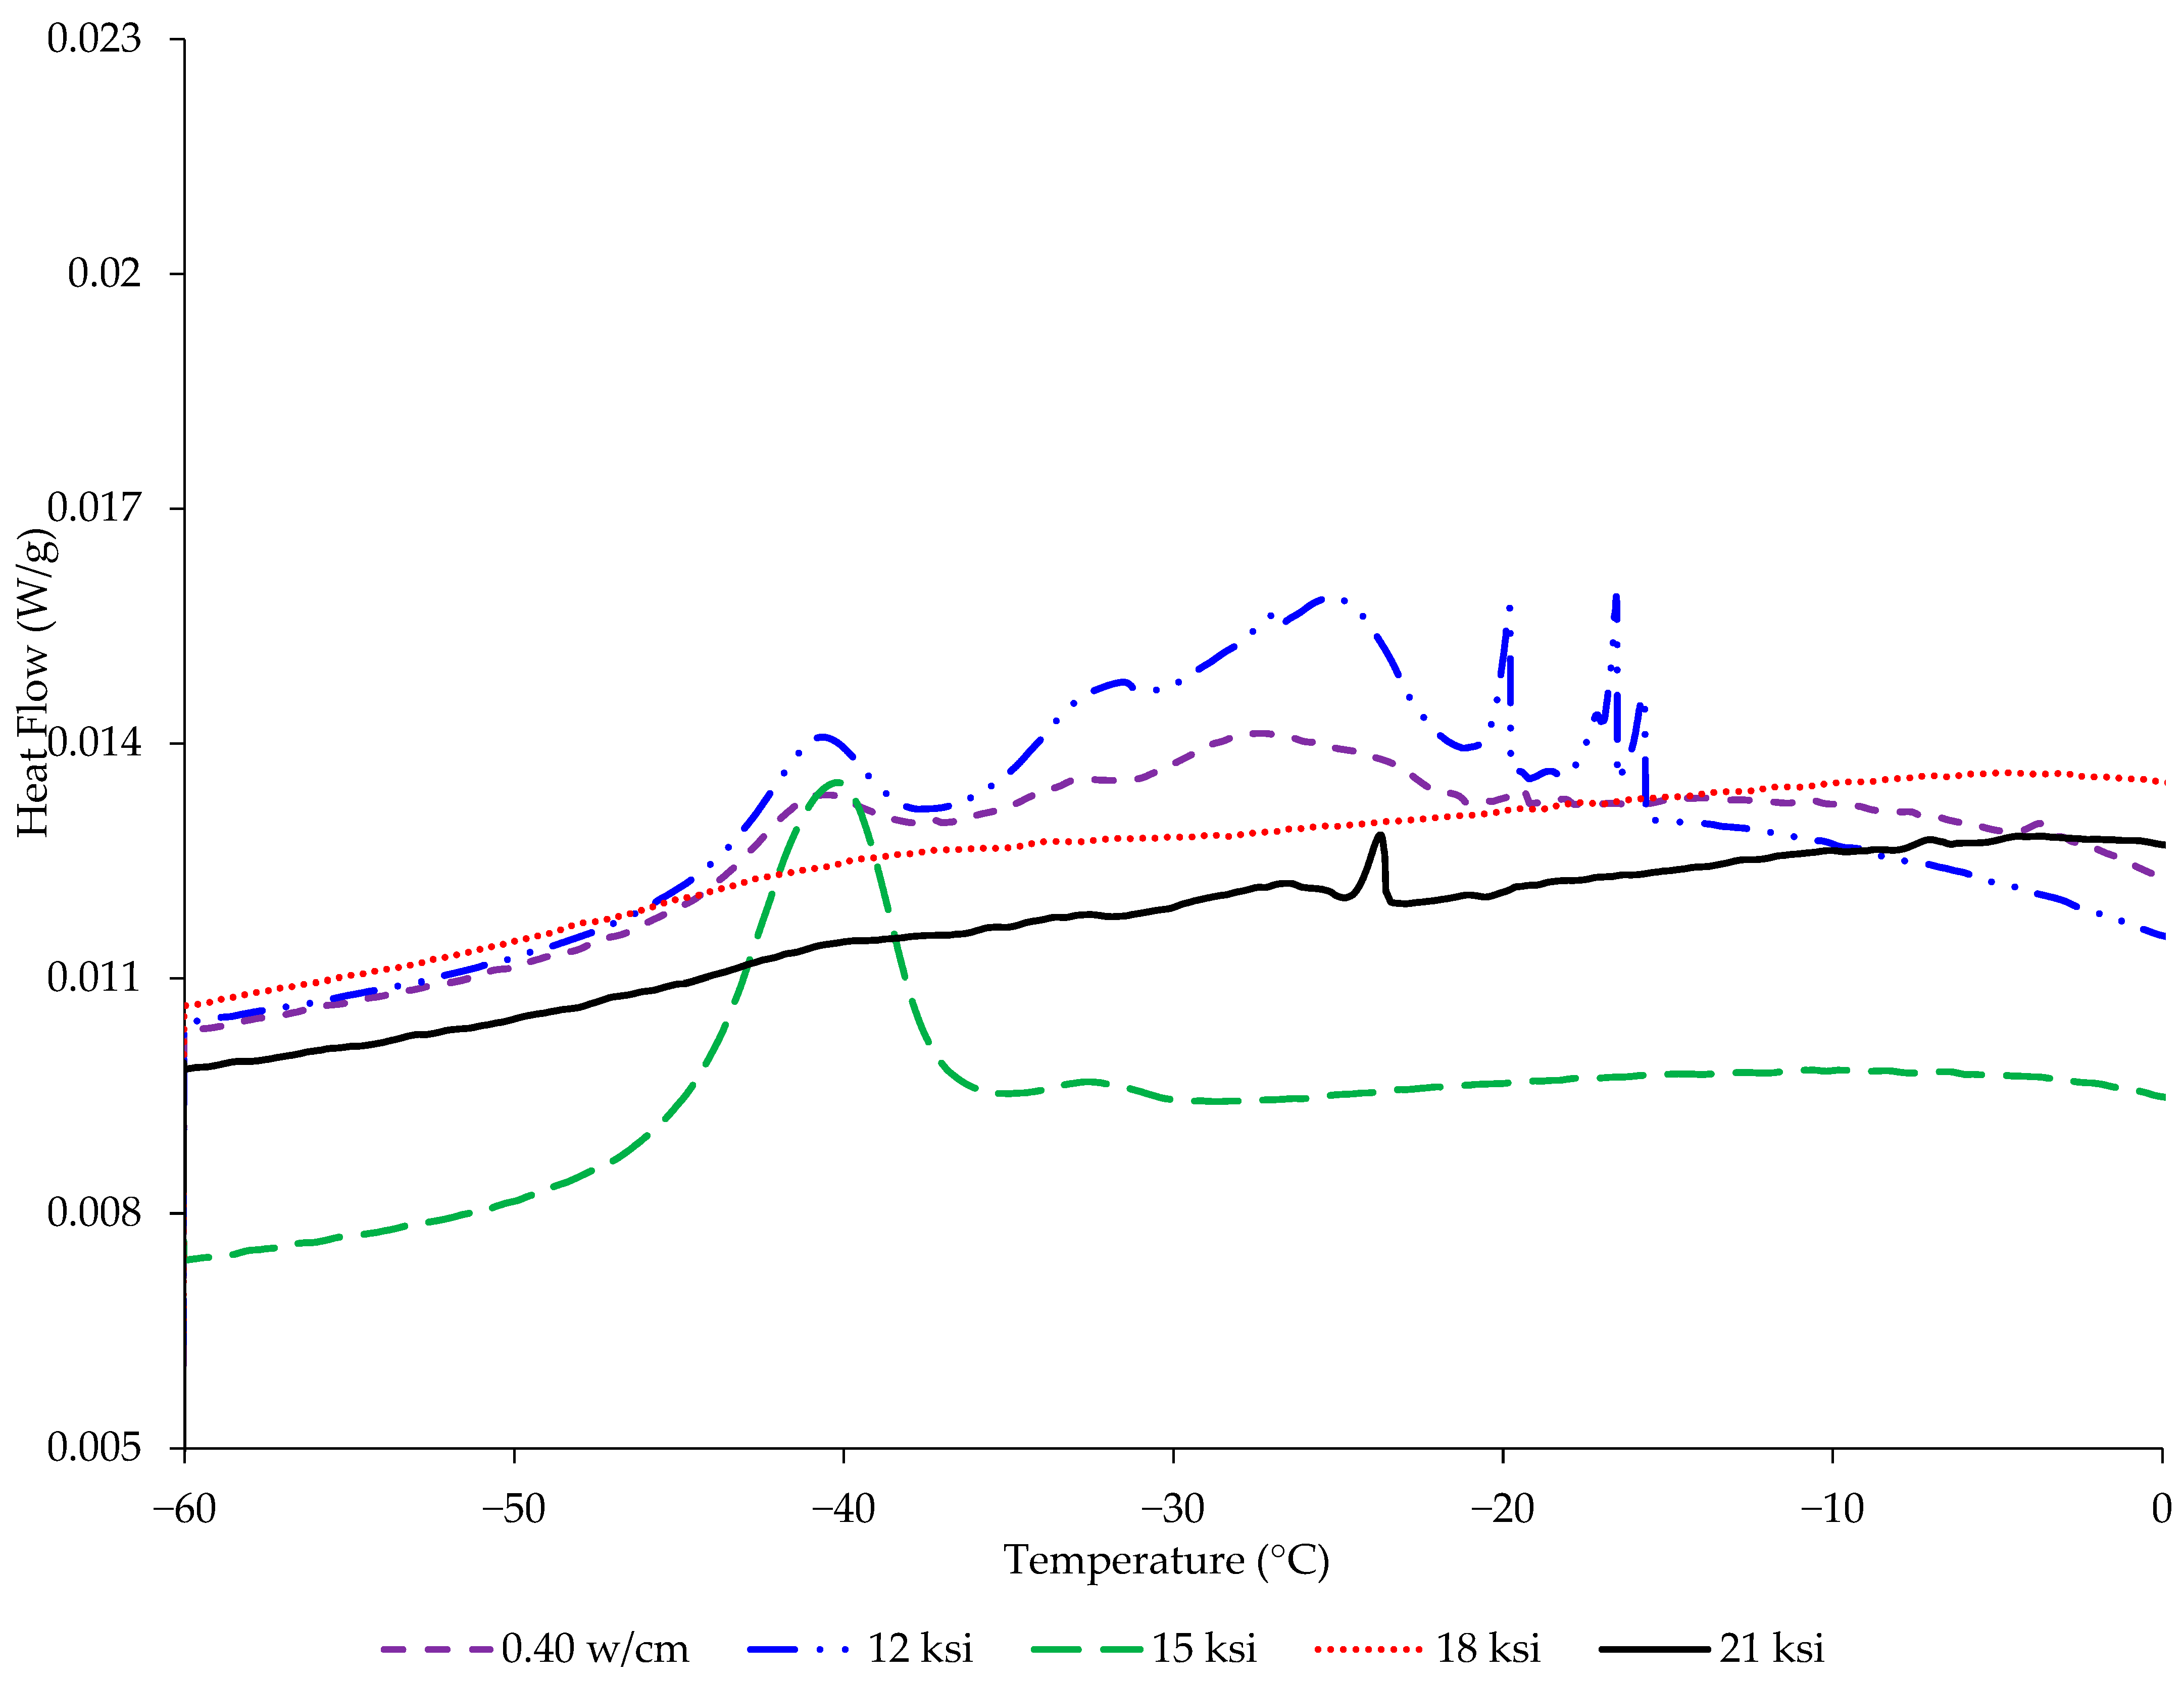
The measured heat flow curves of freezing for the limewater-, steam-, and precast-cured samples for each strength class are shown in
Figure 6,
Figure 7, and
Figure 8, respectively. The highest strength class mixture, the 21+ ksi mixture, showed the lowest heat flow (around 0.009 W/g) for all three types of curing. This indicates the very low volume of pores in the concrete and the small pore sizes present. For the limewater-cured samples shown in
Figure 6, there is a peak close to −40 °C for the 0.40 w/cm, 12 ksi, and 15 ksi samples, which most likely corresponds with pore water. The highest strength class mixtures showed no peaks except for a small peak around −20 °C for the 18 ksi mixture, which could be from voids near the surface [
41].
The steam-cured and precast-cured samples showed a similar pattern as the limewater-cured samples, except that the 21 ksi steam-cured sample had a peak around −45 °C instead of −40 °C which also indicates homogeneously nucleated pore water. There were multiple exothermic peaks located between −10 °C and −20 °C for the 12 ksi precast-cured samples and a peak close to −25 °C for the 0.4 w/cm sample which indicates the presence of many pores for these samples. The 12 ksi mixture is the only mixture with significant freezing events above ~−35 °C in the steam-cured and precast-cured concrete. This may explain the mass gain and beginning of damage seen in those two sets of concrete samples, while no other concrete samples showed significant mass gain or RDME decrease during freeze–thaw cycling.
Using Equation (2), the observed DSC peak freezing temperatures were converted into pore radii (nm). For illustration, freezing peaks at −40, −35, −20 and −10 °C correspond to pore radii of ≈2.19, 2.42, 3.80, and 7.04 nm (diameters ≈ 4.4, 4.8, 7.6 and 14.1 nm), respectively. These values are consistent with the very fine nanoscale pore network measured by MIP for the higher-strength mixtures, and support the interpretation that the observed early freezing peaks for the 12 ksi specimens indicate the presence of larger pores that can nucleate ice at higher temperatures, which is consistent with the slight scaling observed for the steam-cured 12 ksi samples.
3.4. Mercury Intrusion Porosimetry Testing
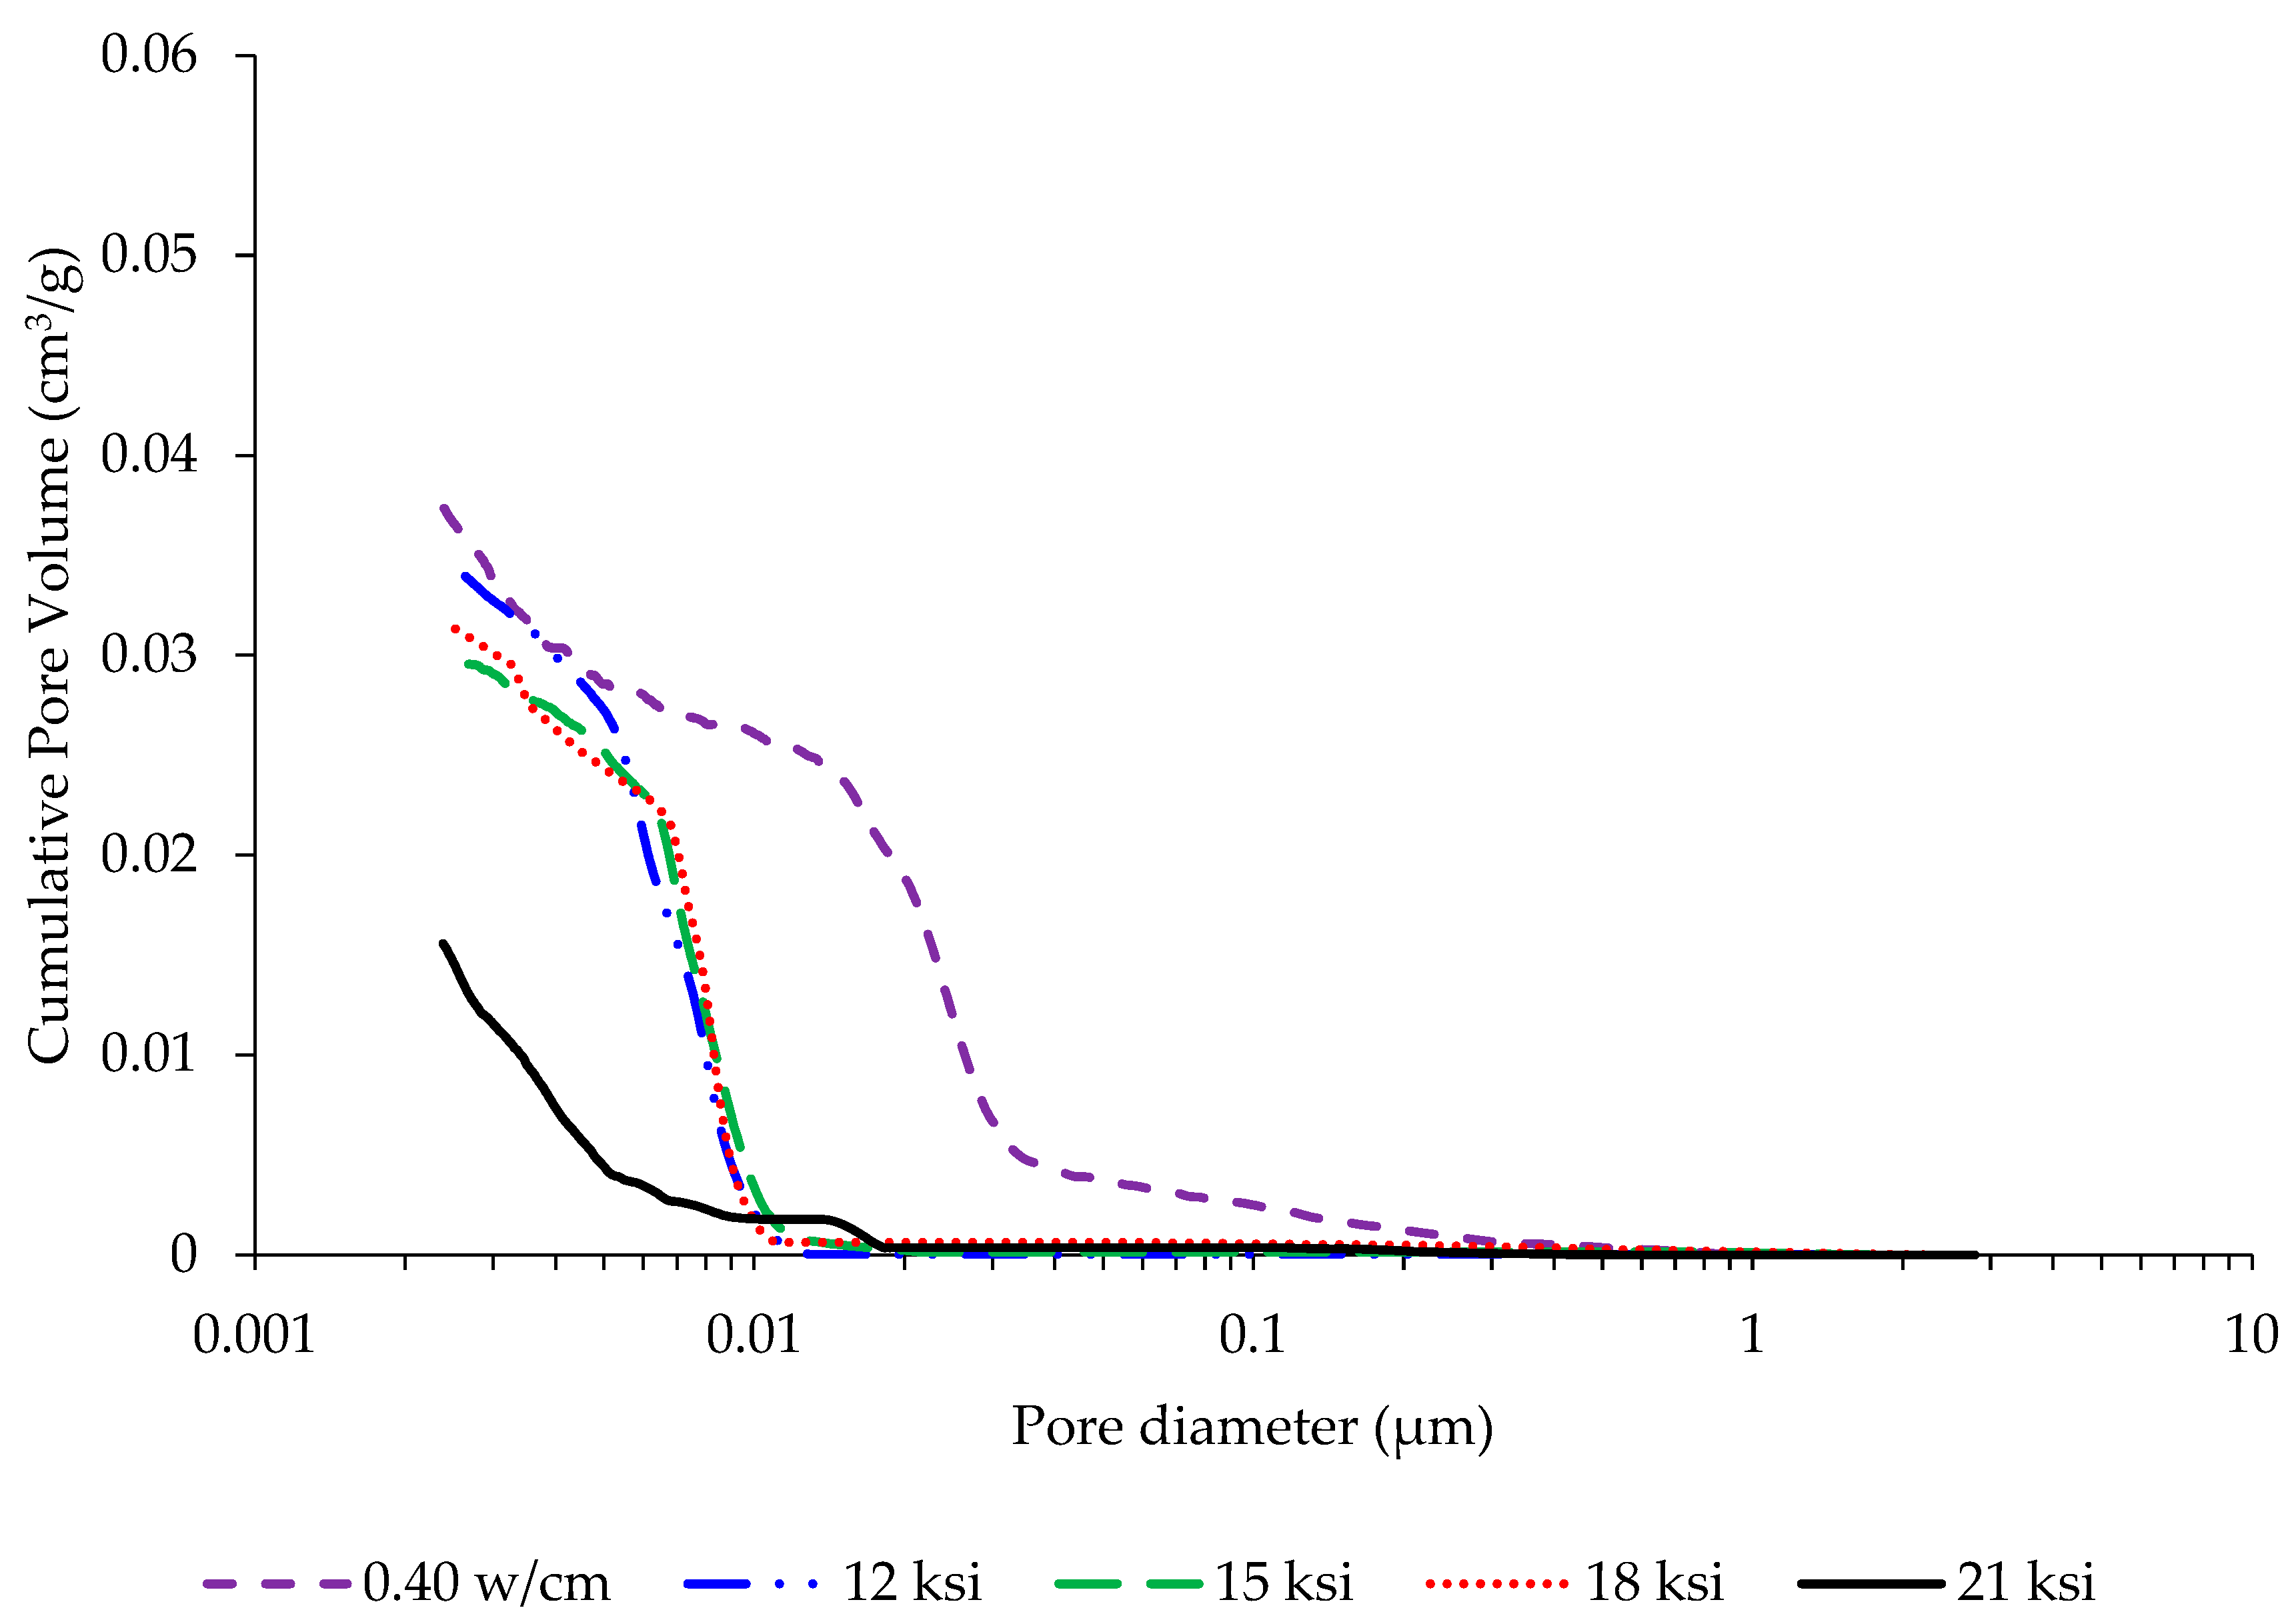
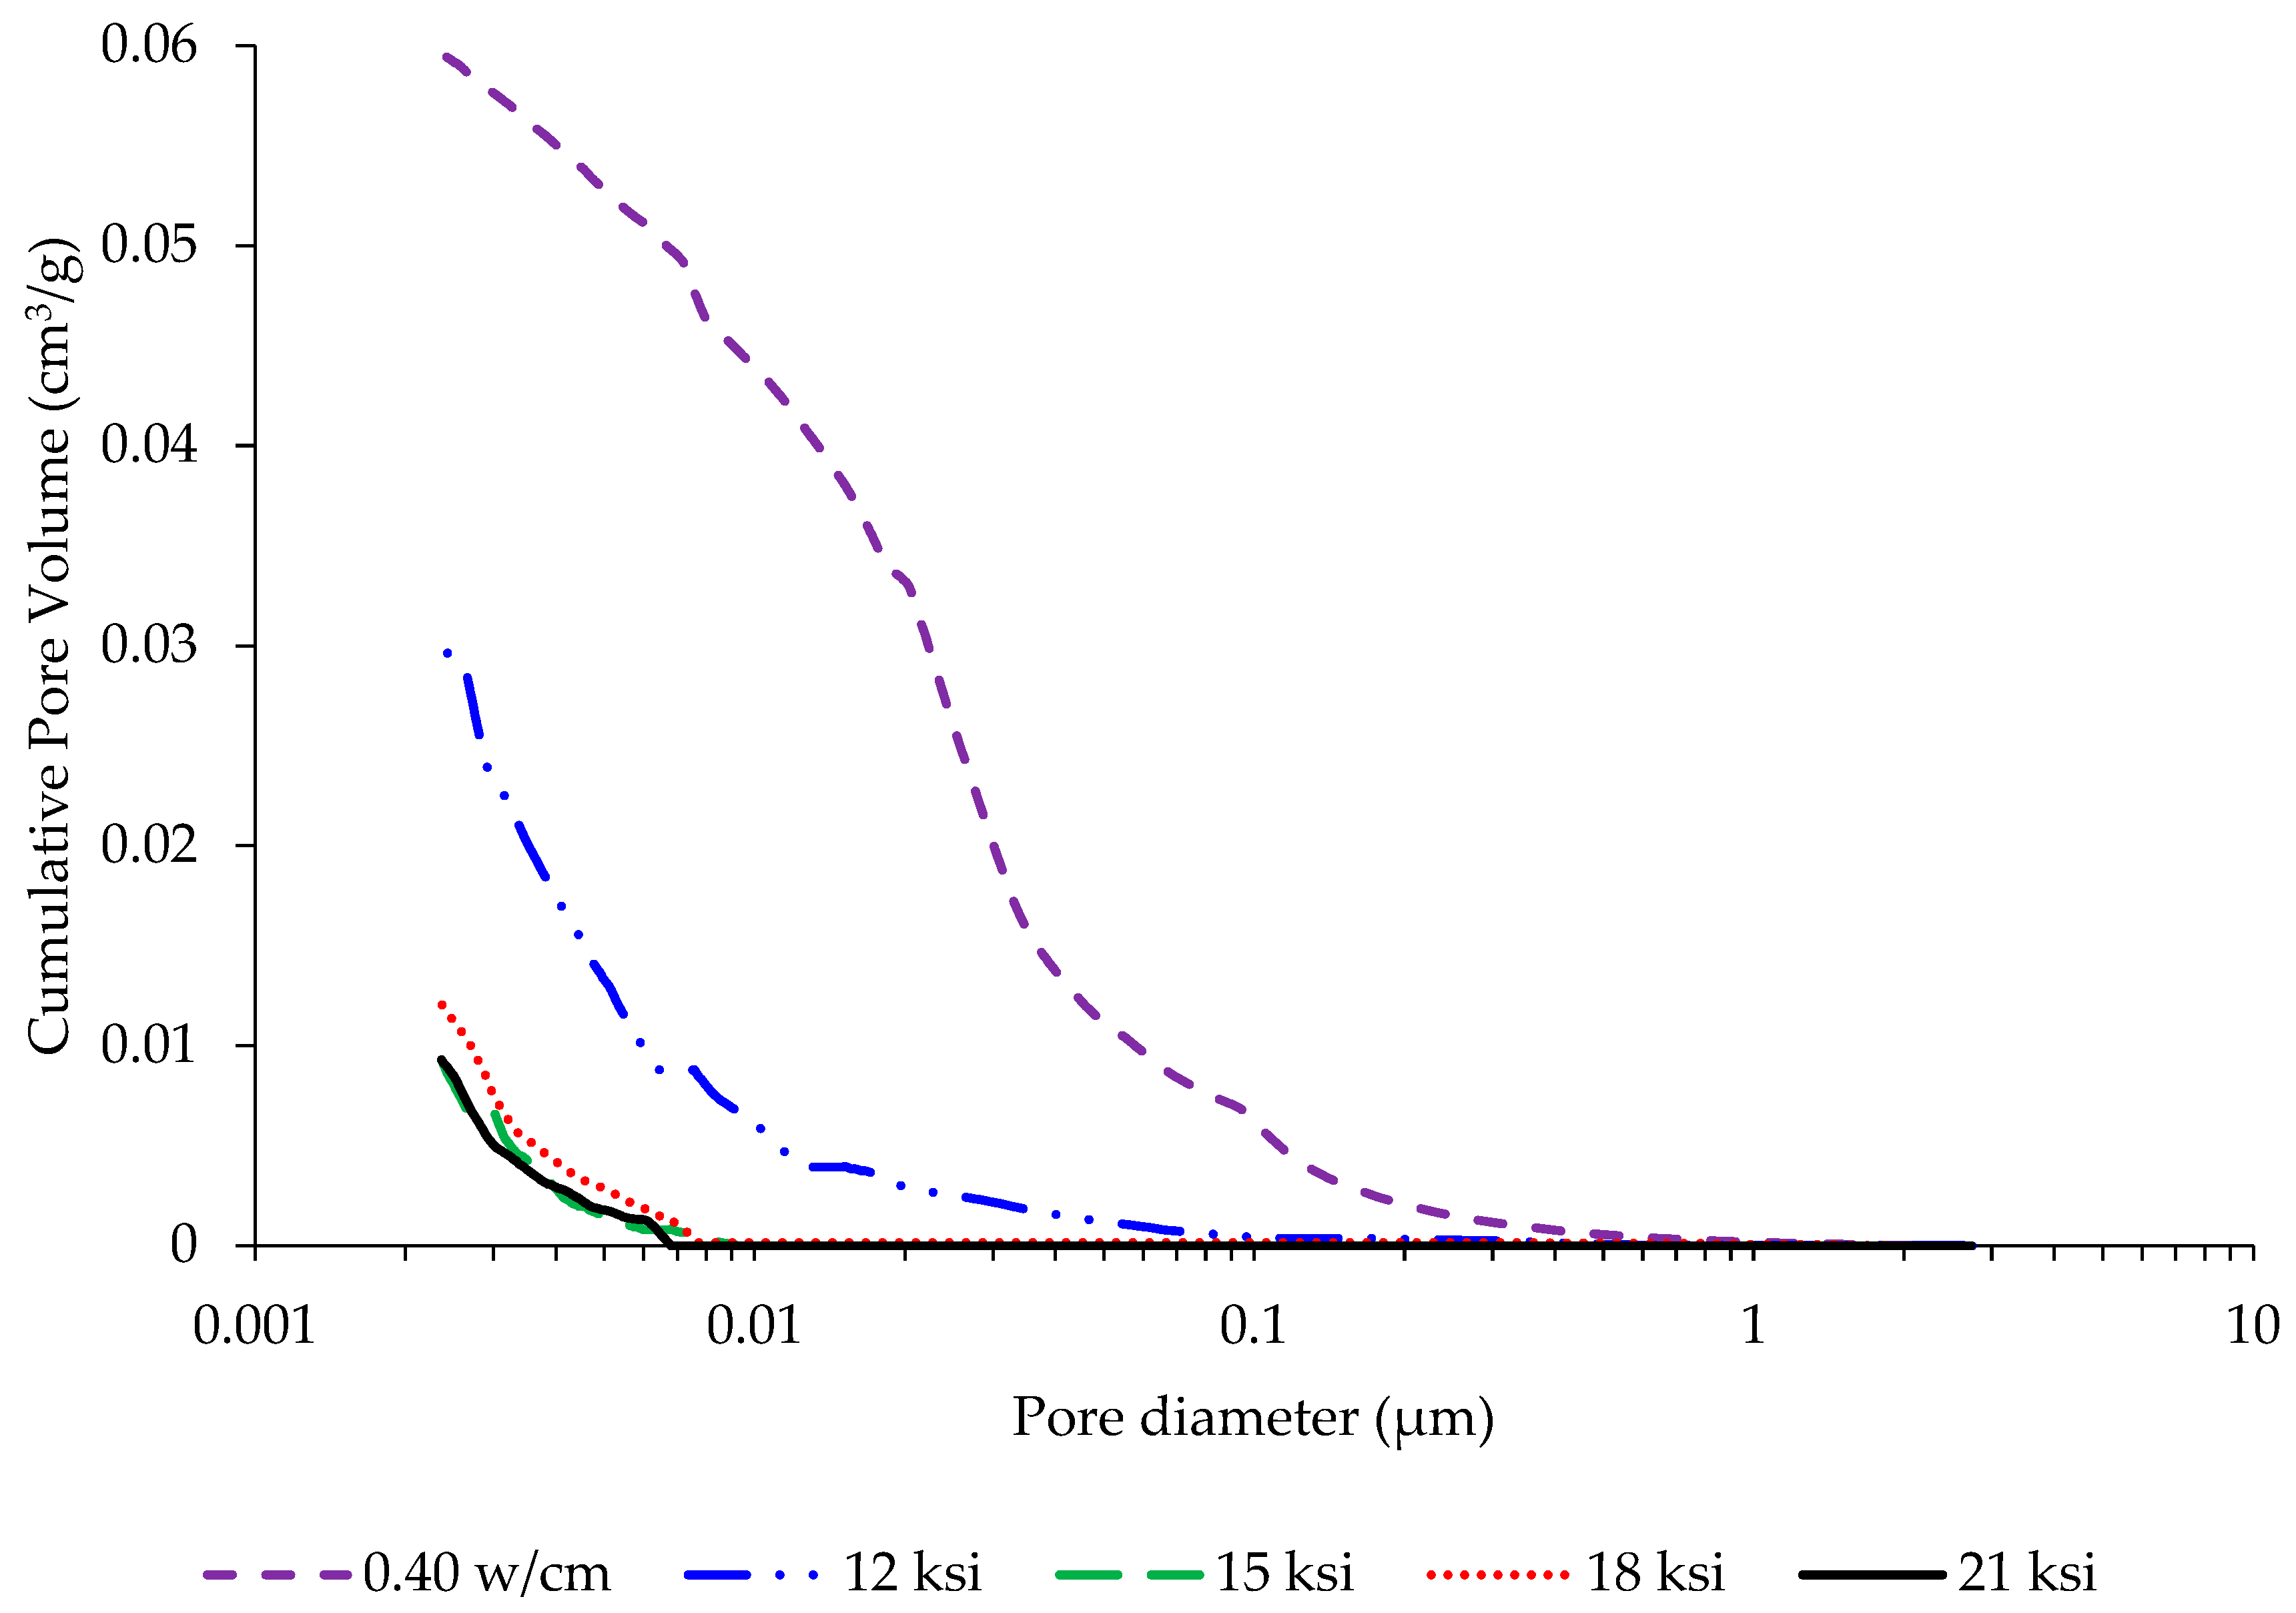
MIP was measured for all the mixtures and compared to a normal concrete mixture with a 0.40 w/cm. The cumulative pore volume and pore size distribution of the limewater-, steam-, and precast-cured samples are shown in
Figure 9,
Figure 10 and
Figure 11, respectively. It can be clearly seen that the concrete mixtures for all the strength classes had lower porosities than the normal-strength concrete mixture, which confirms the refinement of their pore structures.
The critical pore diameter (d
c) reflects the pore connectivity as it is the smallest pore size diameter of the subset of the largest pores which creates a connected path throughout the whole sample, and it can be obtained from the derivative of the pore distribution curve (the maximum of the dV/dP curve) [
42]. It can be clearly seen that the pore size curve of the UHPC mixtures for all of the strength classes shifted towards smaller pore diameters when compared to the normal concrete. Therefore, the critical pore dimeters for the 0.40 w/cm concrete limewater-, steam-, and precast-cured samples (0.027 μm, 0.03 μm, and 0.032 μm) were almost two times greater than the critical pore diameters of the UHPC mixtures, which is consistent with lower permeability or penetrability of the UHPC samples.
It can be seen from the cumulative mercury intrusion data for all the curing types used that the strength was inversely related to the volume of intruded mercury. Samples for the highest strength mixture, 21+ ksi, had intruded volumes that were about one-third of those obtained for the 0.4 w/cm control concrete mixture (0.02 cm3/g and 0.06 cm3/g), respectively, which was expected as a higher water content leaves more void space as the free water is consumed by hydration or lost through evaporation.
Limewater-cured and precast-cured specimens showed a similar trend with respect to their pore sizes. The steam-cured specimens showed lower porosities for the higher-strength mixtures, 21, 18, and 15 ksi, compared to the other two curing methods. However, the steam-cured 12 ksi specimens showed a higher porosity and critical pore diameter than the samples cured by the other two methods, which correlate well with the increased mass gain and RDME reduction, and could explain why the steam-cured samples from that mixture showed some damage during freeze–thaw testing.
In general, when compared to normal concrete, the test results showed the UHPC samples had very small pore size diameters, less than 0.01 μm, confirming their dense microstructure [
43,
44,
45]. For the concrete mixtures in this study, samples with higher strengths had lower mercury intrusion volumes and lower volumes of pores. When looking at the effect of curing methods on the samples, limewater and precast curing methods showed similar trends for their critical pore diameters. The precast curing method lowered the strength slightly, showing the negative effect of high temperature after placement. The steam curing method showed a positive effect in forming a good microstructure for all the mixtures except for the 12 ksi mixture, for which the samples’ permeabilities increased and the strengths decreased at later ages. Lower strengths and higher permeabilities are a typical consequence of high temperatures on normal and high strength concretes, however, not for UHPC. Therefore, the 12 ksi mixture may have suffered from the cross-over effect typically seen with normal-strength concrete when experiencing high temperature curing, with some pores with diameters in the 0.01 to 0.1 micrometer range. This is in line with some of the results of other studies conducted for UHPC with higher strengths than those used in this study [
40,
46].

