1. Introduction
Unmanned aerial vehicles (UAVs), or drones, were developed initially for military applications, with costs so prohibitive that their use in the civilian sector was not feasible. Moreover, in the United States, UAVs were restricted for civil purposes until 2006, when the Federal Aviation Administration (FAA) officially issued the first commercial UAV permit [
1]. Since then, UAVs have been used in different civil areas, such as construction safety improvement [
2] and the assessment of various infrastructure systems [
3]. These technologies are comparatively new in transportation infrastructure system (e.g., roads and bridges) assessment, which have a lot of potential and unique qualities [
4], including the installation of various spatial data collection sensors. Optical cameras, infrared thermal, light detection and ranging (LiDAR), and ground penetrating radar (GPR) are examples of equipment and sensors that can be assembled in UAVs to collect real-time and accurate data. Besides general static photos and videos, panchromatic and multispectral picture data can be acquired simultaneously using digital sensors. Many researchers argue that UAVs have become more time-efficient and cost-effective data-collecting machines than traditional equipment [
5,
6]. In addition, UAVs can easily reach some areas where it is very tough and unsafe for someone to go for investigative purposes. For instance, assessing the damage to bridge structures [
7] and examining live roadway conditions [
8]. Moreover, UAVs are safe to maneuver in small spaces; multirotor UAVs are especially very easy to control safely from the ground station. For these advantages, the number of civil UAVs is increasing. In 2015, the number of small UAVs actively registered was 137,705; in 2021, this number increased to 1,374,918 [
9]. However, some limitations and barriers are still present in these applications, such as adverse weather conditions affecting flight missions and limited battery life [
10]. Moreover, flight mission parameters are crucial to consider and can significantly influence the quality of output products in assessing transportation infrastructure systems [
11]. Additionally, ensuring the security and reliability of UAV operations is critical, particularly in sensitive infrastructure contexts where data confidentiality, protection from signal interference, and defense against cyber threats are essential considerations [
12]. Hence, it is essential to investigate the adaptation conditions, benefits, and challenges/barriers of UAV technologies in assessing transportation infrastructure systems in the real field.
Furthermore, proper post-processing of data collected by UAVs is crucial for effectively and efficiently investigating infrastructure systems. Many open-source and commercial post-processing tools use different structure-from-motion (SfM) techniques. Due to the varying SfM techniques, processing times differ, and the quality of the output products varies. Therefore, it is essential to determine which type of post-processing tools are feasible for assessing transportation infrastructure systems in the practical field.
However, the current state of utilizing UAVs and the post-processing software in assessing real-life transportation infrastructure systems is not adequately disclosed. Also, their benefits, challenges, and potential future use cases in the practical field are not addressed thoroughly. Due to insufficient information and a lack of solid data on the practical applications of UAV technologies, the majority of professionals continue to prefer in-person investigations of transportation infrastructure systems, despite the process being cumbersome, inefficient, and potentially unsafe [
13]. Regardless of the numerous benefits and technical potential, despite a few limitations, the adoption rate of UAV utilization is minimal [
14]. Moreover, the adoption among transportation agencies has not yet reached its full potential. Indeed, prior surveys and reviews suggest that UAV implementation in transportation has been gradual and uneven. As early as 2016, a national survey found that 33 state Departments of Transportation (DOTs) (66% of the entire DOTs) were either using or actively considering UAVs for various inspection tasks [
15], signaling widespread interest. However, by 2020, only about 21% of DOTs reported having actually utilized UAVs for bridge inspections, with an additional 26% planning to do so in the future [
16]. This indicates that many agencies were still in exploratory or pilot phases at that time. Other studies have been limited in scope or scale; for example, ref. [
17] surveyed UAV use in bridge programs but included only 19 respondents across 16 state DOTs, while a regional study by [
18] in Gulf Cooperation Council countries found that only about 26% of construction organizations had used UAVs, highlighting significant unrealized opportunity. Furthermore, existing literatures show that there remains a notable empirical gap in understanding the current state of UAV adoption on a broad scale and the practical challenges that transportation agencies face in integrating these technologies into their workflows. In particular, previous research has seldom quantified how extensively transportation agencies across an entire nation are implementing UAVs, nor has it fully explored what operational barriers and technology needs those agencies perceive on the ground. Therefore, more research is needed to increase the use of UAV technologies in assessing transportation infrastructure systems by transportation agencies. Thus, validated and comprehensive practical field data and information are required to demonstrate their effectiveness, reliability, and advantages over traditional inspection methods, along with potential research aimed at addressing current limitations and enhancing their practical implementation.
Therefore, this research study aims to investigate the use of UAVs by different state DOTs and the Federal Highway Administration (FHWA) to examine transportation infrastructure systems. To evaluate the infrastructure systems practically, this study quantitatively analyzes the advantages and limitations, as well as current expectations of UAVs and their corresponding post-processing software. Moreover, as this technology has the potential to be an integral part of transportation infrastructure management, its futuristic features are also discussed. This will allow researchers and the relevant industry to concentrate on these areas to improve the effectiveness and efficiency of UAV technology.
3. Methodology
A comprehensive questionnaire survey was created and administered using the Qualtrics online platform and sent to all 50 state DOTs and the FHWA in the United States. The questionnaire survey was divided into five sections: (i) Current scenario of UAV applications for different use cases in DOTs and the FHWA; (ii) Benefits; (iii) Challenges/barriers; (iv) Current expectations from UAVs and post-processing tools; and (v) Futuristic features of UAVs. For each section, one or more questions were asked (shown in
Table 2). The design of the questionnaire, including the predefined response categories for UAV sensor types and post-processing tools, was grounded in a targeted thematic review of domain literature, with particular guidance from [
29], both of which surveyed UAV use in bridge infrastructure systems. These publications helped identify standard technologies and practices adopted by transportation agencies, and their findings were used to structure the multiple-choice options in our survey. This study adopted a pragmatic research philosophy, focusing on the utility and applicability of findings to real-world infrastructure assessment contexts. The pragmatic stance emphasizes methodological flexibility and outcome-oriented design, consistent with the goals of generating actionable insights for transportation agencies. Rather than adhering strictly to either positivist or interpretivist paradigms, the approach was problem-driven, allowing for empirically grounded decisions regarding survey structure and data interpretation, as also advocated in related infrastructure research.
3.1. Questionnaire Section 01: Current Scenario of UAV Applications for Different Use Cases in DOTs and the FHWA
While developing the questions in this section, several logics were set. For example, when a positive response was found for the first question titled “Is your agency currently utilizing Drones/UAVs?”, the associate question titled “Does your agency have a plan to utilize Drones/UAVs in the future?” did not appear. The DOTs and FHWA, who were utilizing UAVs, were asked the following questions to understand the current scenario of UAV applications. The first one was “Which type(s) of infrastructure system does your agency assess?” Four infrastructure systems, highways/roads, bridges, pedestrian infrastructures, and culverts, were given multiple choices for this question. Moreover, another option was for the respondent to write about other infrastructure systems that their DOT assesses. The second question was, “What is/are the typical use case(s) for Drones/UAVs in your agency?” Here, five use cases: damage inspection, condition monitoring, code violation checking, construction inspection, and construction documentation were provided as multiple choice, along with a use case writing input option. The question titled “Which type(s) of sensors does your agency use?” was the last question of this section for the DOT that uses UAVs for infrastructure system assessment. A total of six pre-selected sensors, including optical camera, infrared (IR) thermal, LiDAR, ground-penetrating radar (GPR), lightweight portable radiometer (LPR), and tetra-cam multispectral camera, were given in the multiple-choice options. Also, an option for inputting other sensors was included. On the other hand, the DOT(s) and FHWA personnel who were not currently utilizing UAVs for infrastructure system assessments but had plans to use them in the future were asked three further questions. These questions included the infrastructure system type, use cases, and sensors they wanted to be involved in later. If they had no plan to assess the infrastructure systems utilizing UAVs, the algorithm would take them to the end of the survey.
3.2. Questionnaire Section 02: Benefits of UAV
The second section of the questionnaire was about the benefits of utilizing UAV technology for infrastructure system assessment. Six benefits were identified from the literature and included in the questionnaire form to determine whether DOTs and the FHWA benefited from those perspectives in the real field. The respondents could select one or more benefits and input other ones not in the options. The six given options were time effective, cost effective, safe, high quality of data/image, quantity of data collection compared to traditional methods, and data analysis flexibility. However, there would have been a possibility that different respondents could interpret different meanings of the benefits keywords. Therefore, examples were given after every option to let them know how the benefits should be measured. After the time-effective option, an example was given: it would be determined based on initial setup, the time needed to collect data vs. traditional methods, and post-data analysis time requirements. Cost effectiveness would be calculated by considering the initial setup, the cost of UAV compared to traditional data collection equipment, human resources, and post-data analysis costs. Also, it was mentioned that safety would be considered based on the potential accidents that might occur during the on-field assessment and while working on a hazardous site or condition. The accuracy and homogeneity of data and the clarity of RGB/thermal images were the factors that defined the high quality of the data/image. The quantity of data collection compared to traditional methods meant comparing the collected data volume by both methods in a certain period. Lastly, after the data analysis flexibility option, it was clarified that this benefit would be considered based on the analysis method of UAV and on-field data, data analysis software availability, and automated data analysis.
Moreover, this questionnaire determined the area where the DOTs and FHWA benefited from UAV technology and numerically assessed how much they benefited in that area. Those who selected a particular benefit option were later asked to rate their selection using a Likert scale from 1 (the least) to 5 (the most). In this study, Likert scale responses were treated as interval data. This treatment was justified because clear definitions and detailed examples were provided for each benefit option, guiding respondents toward a consistent interpretation of the intervals between scale points. Therefore, arithmetic means were utilized to summarize respondents’ ratings, allowing straightforward interpretation of the central tendency of perceived benefits across DOTs and the FHWA. The interpretation of this range differs from one benefit to another, and the details are shown in
Table 2.
3.3. Questionnaire Section 03: Challenges/Barriers
At the beginning of this section, the question was first asked whether the DOT and FHWA experts or their agencies faced any challenges or barriers while utilizing UAVs for infrastructural system assessments. Those who answered positively were further asked to rate the challenge(s) and barrier(s) they or their agency encountered while utilizing UAVs on a Likert scale from 0 to 10. Where 0 indicates minimal to no challenge or barrier, whereas the value of 10 implies the most severe effects of the selected challenge on the employment of UAVs. Similar to Questionnaire Section 02, Likert scale responses were treated as interval data. A total of 12 challenges and barriers were pre-determined, besides the option that the respondents could add any other limitations that they experienced.
3.4. Questionnaire Section 04: Current Expectations from UAVs and Post-Processing Tools
The main goal of this section is to identify the current expectations of DOT and FHWA personnel or their agencies for each UAV and post-processing software. Therefore, three questions were asked: “What capability(s) do you or your agency prefer to add to a drone/UAV?” “What capability(s) do you or your agency prefer from post-processing software?” and “What type(s) of post-processing software do you or your agency prefer to use, and what is the reason(s)?”
For the first question, nine UAV capabilities were given as multi-select multiple-choice options. These options were: longer flight time, fast data collection, accurate data collection, ease of data collection, high-quality data collection, easy maneuvering, automated operation, real-time data collection preview, and multiple data collecting sensors installed at a time. For the second question of the section, three options: open source, commercial, and in-house developed software were given, and the respondents were able to choose one or more options. Moreover, the reasons for the DOT and FHWA personnel or their agency’s preference for using a particular software were investigated. The aim of the assessment was to ascertain the expectations of different types of post-processing software, not the capabilities of each one.
Finally, regarding the expected post-processing software capabilities, seven multi-select multiple-choice options were inserted in the questionnaire form. The seven capabilities were included in the form as easy data inputting capability, fast data processing, accurate result generation, high-quality result production, good visualization, automating report generation, and automating problem identification. For both the first and third questions of this section, the respondents could write their own or the agency’s preferences that were not mentioned in the options.
3.5. Questionnaire Section 05: Futuristic Features of UAVs
In this final section, the futuristic features of UAVs were identified to enhance the efficiency of this technology and utilize it as a daily assessment tool for transportation infrastructure systems. The DOT and FHWA personnel answered one question: “Which futuristic feature(s) can be more beneficial if equipped with Drones/UAVs?” based on eight pre-determined multi-select multiple-choice options. These options were solar power features, more improved battery systems (not traditional lithium polymer/ion), automatic fall prevention features, advanced bad weather tackling systems, artificial intelligence to obtain data from target objects automatically, improved lighting system, real-time virtual reality (VR) system, and improved controlling system (with VR/augmented reality (AR), eye-tracking, and automated data collection maneuvering from confined space without collision).
Upon completion of the data collection period, all survey responses were compiled and analyzed within the Qualtrics environment. The analyzed data and statistical outputs produced by the platform constitute the foundation of the findings presented in the Results section.
4. Results
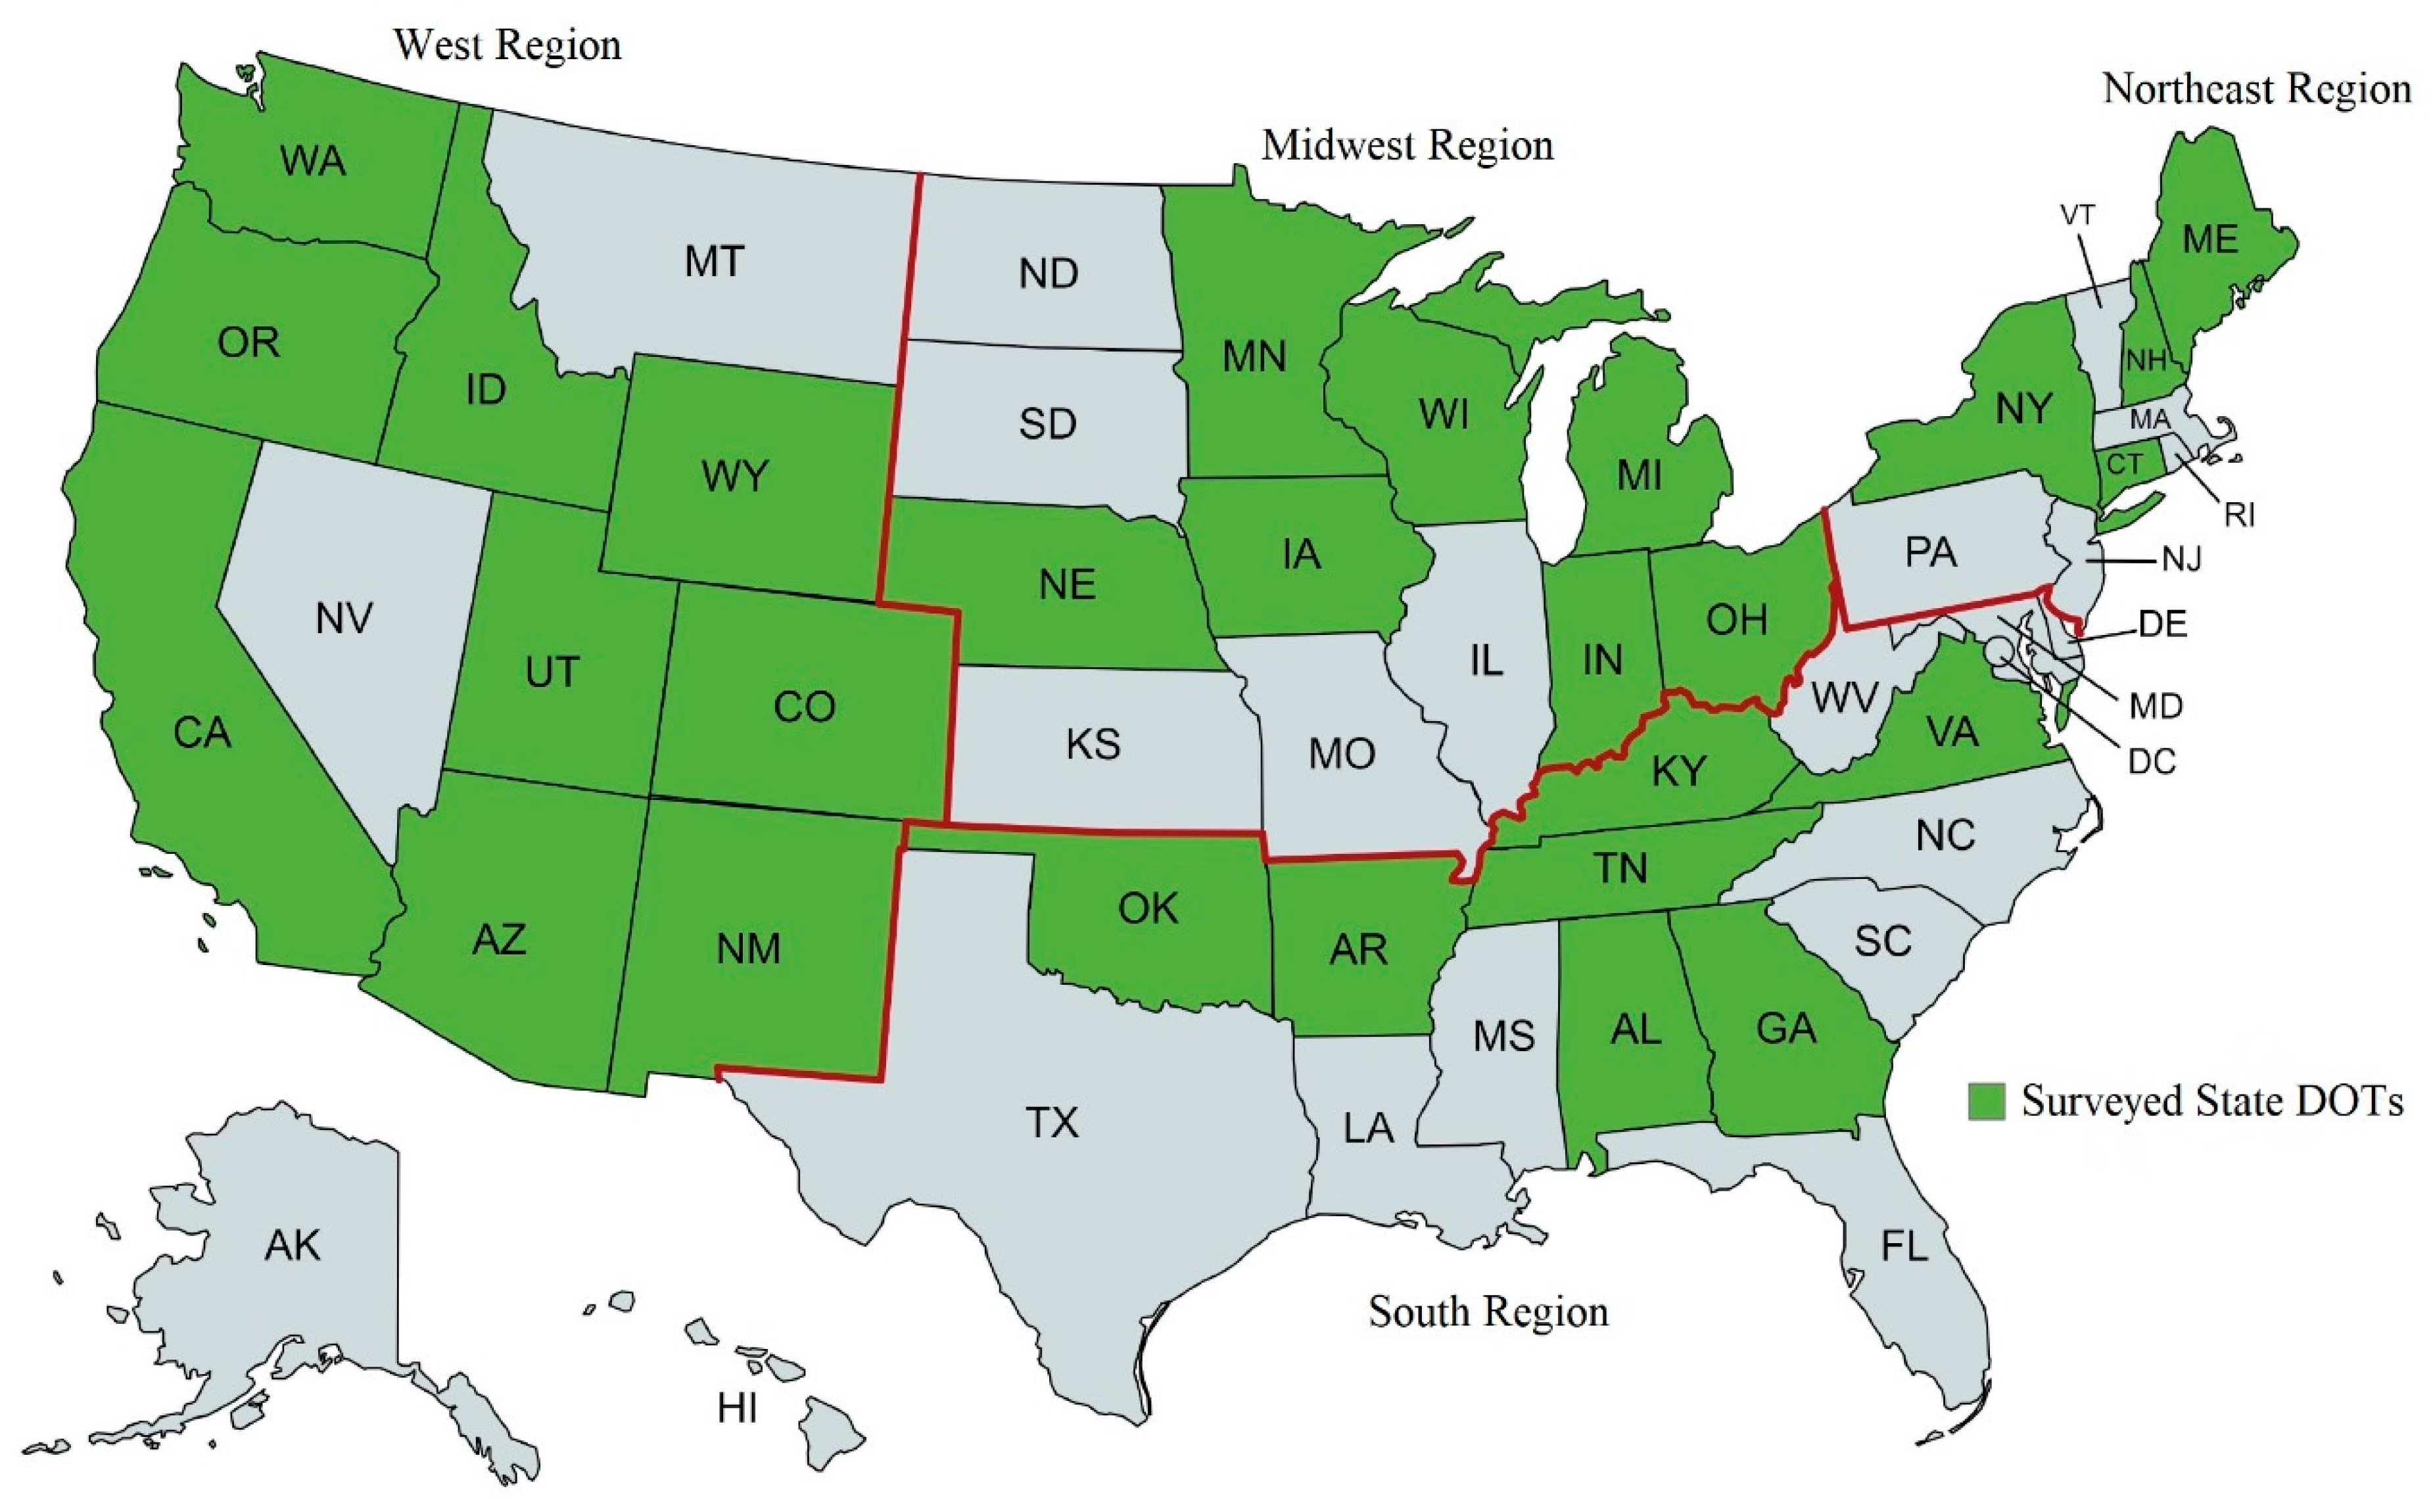
A total of 35 complete responses were recorded from UAV specialists and operators of 27 DOTs and the FHWA. The responding state agencies were from Alabama, Arizona (2), Arkansas, California, Colorado, Connecticut, Georgia (2), Idaho (2), Indiana, Iowa, Kentucky, Maine, Michigan, Minnesota, Nebraska, New Hampshire, New Mexico, New York, Ohio, Oklahoma, Oregon, Tennessee, Utah, Virginia, Washington (3), Wisconsin (2), and Wyoming (2). The numbers in brackets indicate the respondent number from the DOTs. Only one expert from the FHWA completed the questionnaire form. Several partial or incomplete responses were also recorded; however, these were not considered in this study. The states where the responses were recorded are indicated in
Figure 1. All of the states can be divided into four geographic regions: Northeast, Midwest, South, and West [
35]. The survey covers 44% of the Northeast, 58% of the Midwest, 44% of the South, and 69% of the West.
4.1. Current UAV Applications at the DOTs and FHWA for Various Use Cases of Transportation Infrastructure System Assessment
All respondents, except the New York State DOT, indicate that they are currently utilizing UAVs for assessing their infrastructure systems. Therefore, 34 personnel from 26 DOTs and the FHWA responded to questions about their current assessment of different infrastructure systems, use cases of the systems, and the sensors they are using. Therefore, in this section, the survey results are described based on the responses of 34 personnel.
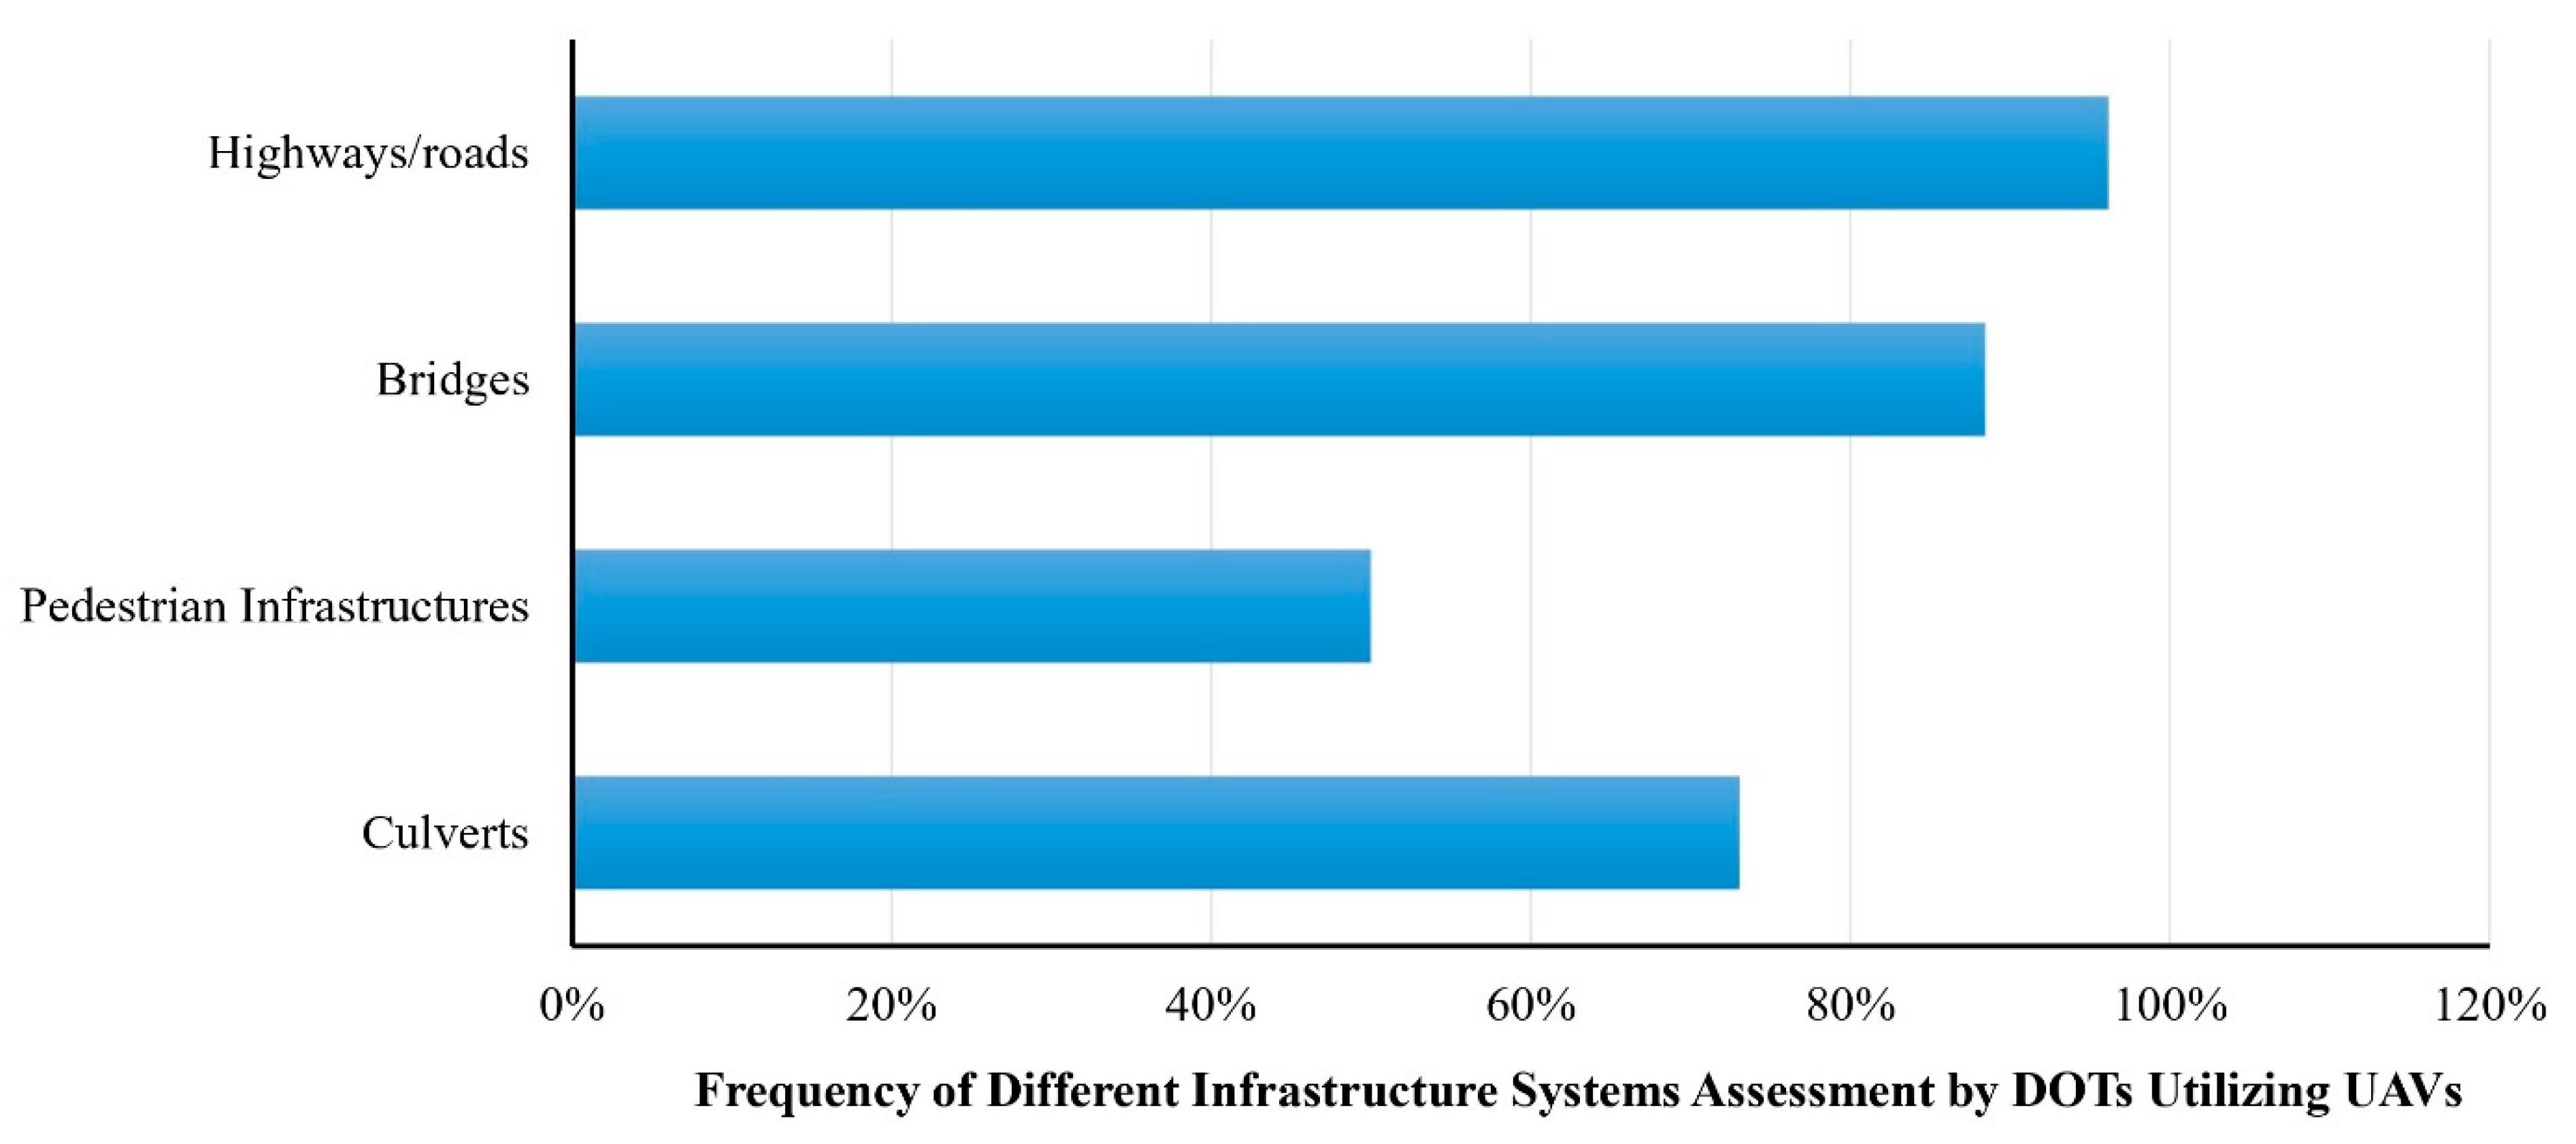
According to the survey, 94% of respondents indicated that 25 DOTs and the FHWA are currently utilizing UAV technology to assess highways/roads (
Figure 2). Only the New Mexico DOT does not assess highways/roads using UAVs. On the other hand, Oklahoma DOT, Tennessee DOT, and Virginia DOT currently do not use UAVs in the assessment of bridges. Relatively few DOTs (50%) evaluate the condition of pedestrian infrastructures using UAVs, and these are: Alabama DOT, Colorado DOT, Connecticut DOT, Georgia DOT, Indiana DOT, Kentucky DOT, Michigan DOT, Minnesota DOT, Nebraska DOT, Ohio DOT, Oregon DOT, Washington DOT, and Wisconsin DOT.
However, 19 out of 26 DOTs (73%) are currently investigating culverts employing UAV technology. Thus, culverts are the third most frequently assessed infrastructure system using UAV technology. The results also indicate that the FHWA does not currently assess pedestrian infrastructure and culverts using UAVs. Therefore, it can be understood that the most frequently assessed infrastructure systems by UAVs are highways/roads, followed by bridges, culverts, and pedestrian infrastructures (
Figure 2).
Beyond these four major transportation infrastructure systems, several DOTs assess different types of other systems using UAVs. The California DOT uses UAVs to investigate slopes for rockfall or slides, as well as construction and traffic incidents outside of highways, roads, bridges, and culverts. Furthermore, the Georgia DOT employs UAV technology to monitor and evaluate the condition of waterways and railroads. Additionally, UAVs are used to assess airports (Indiana, Iowa, and Michigan DOTs), railroads (Iowa DOT), high mast lighting (Maine and Minnesota DOTs), and stockpiles (Maine DOT). Moreover, several water infrastructure assets, such as seawalls and wetland mitigation banks, are examined by the New Hampshire and Wisconsin DOTs using UAVs. Unlike all four major transportation infrastructure systems, Ohio DOT uses UAV technology to evaluate the condition of noise walls and salt barns.
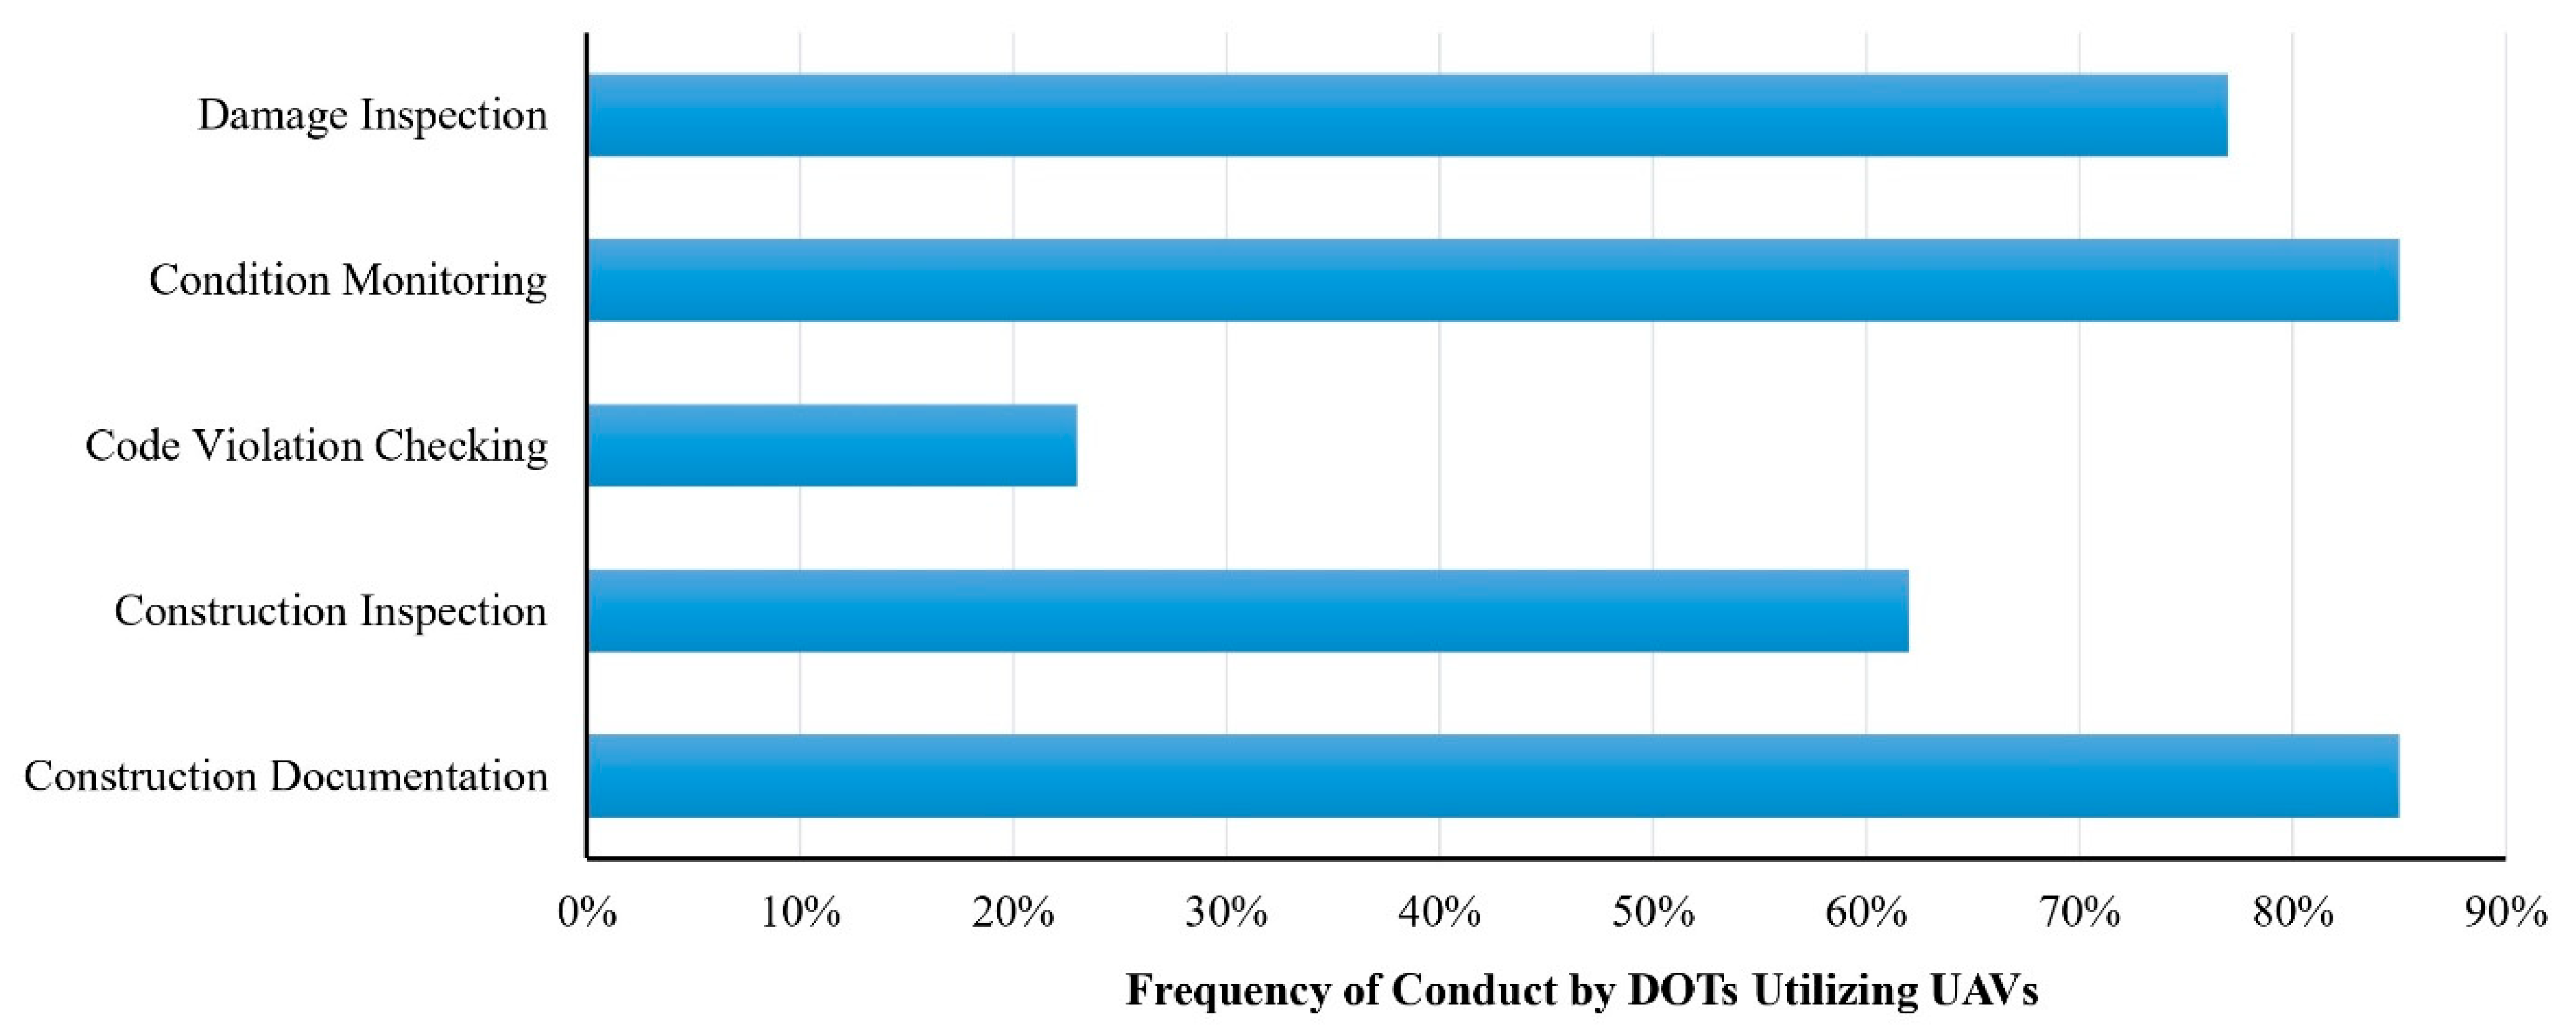
According to the 34 personnel, 26 DOTs and the FHWA assess the above infrastructure systems for many use cases (shown in
Table 3). The FHWA primarily utilizes UAVs for construction inspection and construction documentation; however, the number of use cases is higher among DOTs. Condition monitoring of infrastructure systems and construction documentation are the two most frequent use cases, involving 22 DOTs (85% of 26 DOTs). Additionally, 20 DOTs (77%) conduct damage inspections, the second most frequent use case involving UAV technology. In addition, construction inspection and code violation detection are the two least used cases, with 16 DOTs (62%) and 6 DOTs (23%) conducting these, respectively (
Figure 3).
Beyond these five given use cases, some DOTs employ UAVs for surveying, traffic management, terrain modeling, educational training, and emergency management.
Furthermore, respondents indicated that several sensors are being used for different use cases by the agencies (
Table 3). Among the sensors, the optical camera is the conventional one where the respondents from all the agencies specify its current operation. However, no information was found from the Oklahoma DOT regarding sensor utilization. LiDAR and IR thermal sensors are in second and third positions, respectively, as the most frequently deployed sensors with UAVs, based on 59% and 47% of respondents’ indications. In addition, GPR, LPR, and tetra-cam multispectral cameras are three less common sensors that state agencies employ in the field. Unlike all responding state agencies, Ohio DOT uses magnetometers and eco-sounders beyond optical cameras, IR thermal cameras, LiDAR, GPR, and tetra-cam multispectral cameras. Moreover, the Maine DOT has dabbled with an IR thermal sensor, and the Tennessee DOT has tried out the same sensor on bridges before as a test.
Although the New York State DOT is not currently assessing transportation infrastructure systems using UAVs, it plans to utilize this technology to inspect highways, roads, bridges, and culverts. However, their primary focus is on using UAVs for damage inspection, condition monitoring of bridges, mapping, and surveying. Additionally, they aim to use UAVs for construction inspections, documentation, and traffic incident monitoring. Furthermore, the respondent from the New York State DOT expresses their agency’s interest in employing optical cameras, IR, and LiDAR sensors while assessing transportation infrastructure systems.
4.2. Benefits of Utilizing UAVs for Infrastructure System Assessment
From the survey responses of 34 DOT and FHWA personnel in this section, time effectiveness, safety, and cost effectiveness were identified as the top benefits of using UAVs for transportation infrastructure system assessment. More than 90% of the respondents indicated that they receive more frequent advantages in these three areas than in the remaining benefits listed in the survey form. 91% of respondents specify that UAV applications are more cost effective than traditional infrastructure system assessment regarding initial setup, data collection equipment, human resources, and post-data analysis costs. The lowest frequently witnessed benefit of employing UAVs is the data analysis flexibility, which may be because UAV is a relatively new technology for use in infrastructure systems. Hence, there is still a need for more enhancement in the existing data analysis tools.
Moreover, based on the respondent’s rating, each benefit is further assessed to determine its impact on the UAV flight mission.
Table 4 summarizes the results. The mean rating of all benefits falls between 3.95 and 4.28, indicating the significance of the benefits gained from using UAVs in managing transportation infrastructure systems.
Here, all SDs are moderate (around 0.5–0.7), indicating reasonable response consistency. No variance is unusually high (all below 0.52); therefore, no benefit showed extreme disagreement. Thus, SD and variance did not change the classification outright (since none of the benefits had a borderline mean and high SD/variance that would call reliability into question), they confirmed that the mean ratings are trustworthy for classifying the impact. Therefore, based on the mean rating and Likert scale shown in
Table 2, the UAV application is found to be most effective in time, safety, cost, data/image quality, and data collection quantity. Also, the application is found to be moderately effective in data analysis flexibility.
4.3. Challenges/Barriers to Utilizing UAVs for Infrastructure System Assessment
While UAV technology provides numerous benefits, most DOT and FHWA personnel (88%) indicate that they or their agency face challenges/barriers to using UAVs to inspect their transportation infrastructure systems.
Table 5 provides the frequency and significance of the negative impact of barriers encountered while employing UAVs for monitoring and collecting data for infrastructure systems. According to the statistics of the survey results, UAV flight missions are significantly affected by weather conditions, ranked as the most frequent limitation among the 12 given in the survey form. Of DOT and FHWA personnel and/or their agency, 85% are currently facing this limitation, and the significance of its impact on UAV missions is moderate (4.52). It can also be noticed that rigorous FAA rules and flying in controlled airspace are the second most frequent challenges for UAV applications. Moreover, these two challenges have a similar, relatively moderate impact on the UAV flight mission. Among these challenges/barriers, hiring licensed and trained remote pilots has a relatively significant negative influence on UAV flight missions, yet it has a moderate impact.
On the other hand, specific challenges/barriers have minimal and infrequent negative impacts on UAV operations, which can be categorized into three groups: social, hardware-related, and environmental. Social barriers include complaints about breaching people’s privacy and noise generation, which have the lowest and rarest impact. Hardware-related challenges include the difficulty of replacing the intended sensor(s) and the memory shortage for collecting huge amounts of data, which could be overcome through ever-advancing technologies. In contrast, the environmental barriers include UAVs getting hit by obstacles or wildlife (birds).
Besides these twelve challenges/barriers, the agency respondents have identified several other limitations for UAV applications in infrastructure system assessment. These are budget and funding for UAVs; security concerns, particularly with foreign manufactured UAVs; government agency buyoff on UAV use; amount of time spent on planning, preparing, and logging flights; developing effective use cases; showing value to deliverables; cost of LiDAR capable UAVs; cost of spectral imaging with UAV; safety of UAV operator along roadways; data privacy; performing inspections and maintenance on the UAV; amount of time spent updating software on controllers and platforms; and crop dusters.
4.4. Current Expectations of DOTs and the FHWA from UAVs and Post-Processing Tools
The survey findings indicate that agencies have specific, evolving expectations to enhance both UAV performance and post-processing capabilities. The following subsections describe key focus areas identified in the survey: (1) Capabilities that are preferred to add on to every UAV, which discusses hardware features that DOTs and the FHWA desire for improved UAV operations; (2) Utilization preference on different types of post-processing tools, summarizing agencies’ software choices and the reasons behind them; and (3) Capabilities that are preferred to add to every post-processing tool, highlighting essential functionalities respondents expect from data processing software to enhance usability, accuracy, and efficiency. These subsections collectively provide a detailed look at current needs and expectations to guide future UAV and software advancements.
4.4.1. Capabilities That Are Preferred to Add to Every UAV
Based on the responses from 33 DOT and FHWA personnel (1 state DOT employee did not respond to this part), the top two expectations from UAVs are longer flight time and automated operation. Of respondents, 79% indicated that they need a longer UAV flight time than they currently experience to complete their infrastructure system monitoring seamlessly. Also, many UAVs do not offer automated flights or have mobile/controller applications to collect data under pre-defined commands. Hence, 73% of respondents hope for this automated flight feature for UAVs.
The next three most frequently expected current features are accurate data collection, high-quality data collection, and easy maneuvering, with 55%, 52%, and 48% of responses recorded, respectively. Other features that agencies infrequently demand include easier data collection and real-time preview of collected data. The rarely demanded attributes are using multiple sensors simultaneously and fast data collection. The other UAV capabilities that some agency personnel wish for are easier and custom flight planning for specific infrastructure systems, ease of data geotagging, downloading, and data synchronizing, flights in tight spaces, such as under bridges, video streaming, a smart controller, and a longer transmission range, as well as a non-GPS navigation system.
4.4.2. Utilization Preference on Different Types of Post-Processing Tools
This survey found that out of 26 DOTs, 23 DOTs (88%) prefer utilizing commercial post-processing tools for infrastructure system assessment, whereas the FHWA prefers using open-source software. Only the Connecticut DOT uses both open-source and in-house-developed software. Moreover, the Maine DOT utilizes open-source and commercial post-processing tools, while the New Mexico DOT uses only open-source software.
Table 6 summarizes the preferences for different types of post-processing tools among the various DOTs and the FHWA, as well as the reasons for choosing each software.
From the survey responses, it was found that commercial post-processing tools provide numerous benefits in the infrastructure system assessment process. Among these benefits, ease of use, reliability, interoperability, and customer support are very common. Additionally, the Ohio DOT indicates that hiring a professional team for software will always provide a better experience than using open-source or internal development. State agencies are more concerned with time and efficiency than with cost, as time is generally the largest expense in budgeting. The Wisconsin DOT cites a shortage of skilled personnel as the primary reason for choosing commercial software over developing in-house post-processing software.
4.4.3. Capabilities That Prefer to Add to Every Post-Processing Tool
According to the 34 DOT and FHWA experts who answered the questionnaire, the top three preferred capabilities for post-processing tools are easy data inputting capability, accurate result generation, and high-quality result production. Approximately 90% of the respondents recorded easy data inputting capability as the most preferred, while 85% and 82% of personnel expressed a preference for accurate result generation and high-quality result production, respectively. Furthermore, about 75% of agency personnel hope that post-processing software will provide good visualization of output products such as point cloud models, orthomosaic maps, and 3D textured mesh models. Approximately 70% of the respondents prefer a fast data processing capability for each post-processing tool. The two least preferred universal capabilities of post-processing tools are automatic problem identification and automated report generation. Other capabilities that some agency personnel currently want with every post-processing tool are the easy data sharing/exchanging capability, cloud-based support, adjusting capability with processing settings, and adding GCPs.
4.5. Futuristic Features of UAVs
The survey responses indicate that 85% of the agencies believe the top futuristic feature of UAVs could involve improved battery systems that can replace traditional lithium ion/polymer batteries for longer flight times. Also, automatic fall prevention and artificial intelligence to automatically obtain data from target objects are two other futuristic features respondents desire to see in UAV technology. Moreover, about 40% of the respondents would like to have UAVs capable of tackling adverse weather conditions more effectively in the future. In addition, improved lighting and control systems are two demanding futuristic features that around one-third of the agencies expect UAVs to be equipped with. Furthermore, some respondents believe that incorporating a real-time VR system with UAV technology would be beneficial in the future for assessing transportation systems. Finally, a small number of experts advocate for UAVs powered by solar energy, which can supply additional power to the UAV system and provide longer flight times.
5. Discussion
The results presented in the above section offer a comprehensive view of UAV adoption patterns across state DOTs and the FHWA, detailing agency priorities, challenges, and anticipated future uses for transportation infrastructure system assessment. However, these quantitative findings also prompt more profound questions regarding how such patterns align with the broader technological landscape, the barriers identified in the literature, and the readiness of agencies to implement advanced UAV-based workflows. The following discussion section contextualizes these findings within the current body of research, critically examining areas of convergence, disconnect, and emerging opportunities.
To begin, it is crucial to consider the characteristics of the survey sample itself. The geographic distribution of respondents, in particular, may influence how the findings should be interpreted and generalized. The survey results provide a valuable snapshot of how U.S. DOTs integrate UAV technologies into transportation infrastructure assessments. Still, potential regional biases must be acknowledged to understand the broader implications. Of the 27 state DOTs (and the FHWA) that participated, the distribution of responses was uneven across regions. Notably, the Western region was highly represented, with responses from 69% of Western states. In contrast, participation from the Northeast and South was much lower, at only 44% of states in each of those regions. This imbalance suggests a geographic bias in the sample, with Western states potentially overrepresented and Northeastern states underrepresented.
Also, the survey findings clearly show the current extent and diversity of UAV technology applications among the agencies for transportation infrastructure system assessments. The data indicates a significant level of adoption, with nearly all responding agencies (96%) actively utilizing UAVs for assessing highways and roads. This broad acceptance aligns with the extensive road networks managed by DOTs, suggesting UAVs’ suitability for scalable, efficient monitoring and data collection over expansive geographic areas. However, the adoption rate is noticeably lower for pedestrian infrastructures (50%), which may reflect distinct operational priorities or lower perceived value of UAV technology for such facilities. The relatively limited application in pedestrian contexts may result from factors, such as lower complexity or reduced access constraints, compared to highways, bridges, or culverts, where UAVs often demonstrate clear advantages in safety, access, and data collection efficiency. Furthermore, it is essential to note that UAV operations in urban areas, particularly over pedestrian infrastructure, are subject to stricter regulatory controls due to safety, privacy, and noise concerns. These heightened restrictions often require special waivers or compliance measures, likely contributing to the lower adoption rates for UAV use in pedestrian infrastructure assessments as identified in this study.
Assessment of bridges and culverts is significantly widespread and frequent, emphasizing UAV technology’s effectiveness in difficult-to-access environments, where traditional inspection methods can be challenging, costly, or unsafe. Certain state DOTs indicated specialized use cases beyond standard applications, such as rockfall monitoring by the California DOT, waterways and railroad assessment by the Georgia DOT, and airport condition inspections by Indiana, Iowa, and Michigan DOTs. These applications demonstrate the flexibility and adaptability of UAV technologies to fulfill diverse and unique infrastructure management needs.
The utilization of sensor technology further underscores the diverse capabilities employed by DOTs, with optical cameras being universally used by all responding DOTs and the FHWA. This universal adoption suggests the high reliability, ease of use, and cost effectiveness of optical sensors. LiDAR (59%) and IR sensors (47%) emphasize growing interest in advanced data collection methods capable of detailed structural assessments and condition monitoring, particularly for bridges and culverts. Furthermore, several specialized sensors, including GPR, magnetometers, and multispectral cameras, were noted, indicating specific situational needs that extend beyond conventional visual inspections. The adoption of these sophisticated sensors underscores a broader trend toward more detailed, precise, and predictive infrastructure management practices.
In examining UAV use cases, condition monitoring and construction documentation emerged as predominant, suggesting that DOTs perceive the most immediate and substantial benefits from regular infrastructure monitoring and detailed project record-keeping. Damage inspections also ranked highly, indicating the critical role of UAVs in rapidly assessing structural integrity post-event or during routine maintenance. Notably, fewer DOTs reported conducting code violation checks using UAVs, potentially due to regulatory constraints, limited awareness of UAV capabilities, or operational prioritization. This finding presents an opportunity for future research to explore barriers and facilitators to adopting UAVs for compliance and regulatory monitoring.
The survey identified significant benefits of UAV use, notably time effectiveness, safety, and cost effectiveness, each of which was indicated by over 90% of respondents. The high mean ratings (between 3.95 and 4.28 out of 5) for all benefits reflect the considerable impact UAVs have on enhancing transportation infrastructure assessments. Specifically, safety emerged as the highest-rated benefit, underscoring the value UAVs provide by reducing human exposure to hazardous inspection environments. Despite these advantages, data analysis flexibility was found less frequently, suggesting potential areas for improvement in UAV post-processing tools and methodologies. Also, the survey results indicate a notably low preference among respondents for using automated report generation tools during post-processing of UAV data. This cautious stance toward automation aligns with well-documented barriers to adopting digital workflows in infrastructure assessment. Prior studies have identified technical integration challenges, workforce resistance, and compatibility concerns as key obstacles impeding the uptake of new digital tools in practice [
36]. In other words, although advanced technologies are available to streamline data analysis and report compilation, transportation agencies may remain hesitant due to concerns over reliability, required expertise, and the adaptability of such tools within existing workflows.
As reviewed earlier in the literature, state-of-the-art methods, such as machine learning and automated data extraction, have demonstrated significant potential for enhancing UAV-based infrastructure inspections. For instance, researchers have developed image analysis algorithms capable of automatically measuring crack dimensions and detecting corrosion from UAV imagery. Deep learning techniques, such as convolutional neural networks, have been used to identify structural defects across large datasets with high accuracy, offering the promise of reduced manual effort and increased consistency in inspection reporting. However, the survey findings reveal a persistent gap between the technological capabilities presented in current research and their actual implementation by public agencies. This disconnect is further underscored by the contrast between the strong emphasis placed on high-quality data collection and the relatively low prioritization of automated post-processing tools. While agencies clearly value precise data acquisition, there appears to be less willingness to adopt technologies that could optimize downstream workflows. This discrepancy highlights a broader misalignment in the UAV data lifecycle, where front-end accuracy is prioritized, but end-to-end digital integration remains underdeveloped. Bridging this gap will require not only technological readiness but also targeted investments in training, support, and process alignment to enable more widespread and confident adoption of automation in infrastructure system assessment.
Moreover, numerous challenges were specified, including weather-related disruptions, rigorous FAA regulations, and airspace control limitations. However, the challenge with the highest negative impact on operations is hiring licensed and trained remote pilots, highlighting the need for targeted workforce development initiatives. Conversely, sensor replacement difficulties and environmental risks, such as wildlife interactions, were less significant, though they remain operational considerations. Also, one of the critical challenges found in this study is data privacy. Recent studies have introduced the software-defined networking (SDN) paradigm as a transformative solution for improving UAV communication reliability, scalability, and security [
37]. SDN decouples control and data forwarding functions, enabling more flexible and programmable UAV networks that are critical for multi-UAV deployments in transportation contexts.
Current expectations from UAV technology emphasize longer flight durations and enhanced automation capabilities, reflecting desires to streamline operations and improve productivity. Expectations for post-processing software primarily include easy data input, accurate result generation, and high-quality outputs, with a strong preference for commercial software due to its reliability, ease of use, and comprehensive support. Respondents anticipate UAV advancements such as improved battery systems, artificial intelligence integration for automatic data collection, and enhanced weather resilience. These futuristic features would substantially increase UAV operational capacity and effectiveness, broadening their applicability across various transportation infrastructure scenarios.
Compared to existing literature, [
16], this research provides broader coverage of infrastructure systems (roads, bridges, culverts, and pedestrian infrastructure), extensive geographic representation, and a comprehensive quantitative analysis of current practices, sensor utilization, barriers, and anticipated technological advancements. Also, this holistic and data-rich approach enhances the relevance and applicability of the findings, distinguishing this study by addressing gaps noted in the research of [
29], which exclusively covered bridge infrastructure and included survey results from only 19 respondents across 16 DOTs.
6. Conclusions
UAVs can effectively and efficiently be used in transportation infrastructure systems. Researchers are investigating various aspects of this technology and discovering numerous advantages. Also, although some challenges are encountered, researchers have attempted to overcome them. However, intensive research can fail if this technology is not applied in the practical field or does not achieve the desired benefits. Therefore, it is vital to understand the current situation of incorporating UAVs in the practical field for assessing transportation infrastructure systems. Additionally, it is essential to uncover the alignment of the current research directions for UAV technology with practical uses, unveil the benefits and challenges experienced by the UAV pilots and specialists, and identify the current and future expectations from this technology. Hence, this study conducted a questionnaire survey among different agencies to determine the current scenario of UAV applications for transportation infrastructure system assessment. The online questionnaire form was deployed to all DOTs and the FHWA, and a total of 35 complete responses were recorded from 27 agencies.
The questionnaire form was divided into five sections. In the first section, the current scenario of UAV applications for different use cases in DOTs and the FHWA is determined by several interactive questions with logic. It was found that, except for 1 state DOT, 26 other agencies are currently utilizing UAVs for infrastructure system assessment. Highways/roads and bridges are the top two infrastructure systems that are being assessed by most agencies using UAV technology. According to the survey responses, of the DOTs that utilize UAVs for infrastructure system assessment, 96% of DOTs employ UAVs to monitor their highways/roads, while 88% use this technology for bridges. In 2020, 21% of DOTs reported their utilization of UAVs for bridge inspection, whereas 26% were planning to use this technology in the future [
16]. Compared to the findings of the present survey, it is evident that the DOTs have been transitioning rapidly toward using UAVs in transportation infrastructure system assessment. Furthermore, it is worth mentioning that monitoring the condition of infrastructure assets is the most common UAV application, in which optical camera sensors and photogrammetry techniques are most commonly used. It should be noted that the infrastructure assets, use cases, and sensor utilization described in this study show the current scenario of UAV applications for transportation infrastructure system assessment in the practical field.
Moreover, this study identifies and synthesizes the benefits and challenges/barriers that the DOTs and FHWA are experiencing. It is found that the three most frequent benefits of UAV applications are time effectiveness, safety, and cost effectiveness compared to the traditional inspection methods. Additionally, according to the analysis of survey responses, the relative importance of these top benefits is very effective and very safe. On the other hand, about 90% of respondents indicate that either they or their agency encounters challenges/barriers while utilizing UAVs. The most frequent challenge they face is weather conditions, which can significantly impact UAV flights. The least frequent and impactful barrier was found to be the noise generated by UAVs. Several other limitations that the agencies currently encounter are described in this study. In addition, this study includes a questionnaire section to determine and assess the current expectations of DOTs and the FHWA from UAV and post-processing tools. Most respondents wish for longer UAV flight times, which can save time and cost, and improve the efficiency of transportation infrastructure system assessment. Moreover, it was found that most DOTs prefer to utilize commercial software for many reasons, such as ease of use, reliability, interoperability, and customer support. Nevertheless, the FHWA prefers to employ open-source software. Besides, the top three current expectations of the agencies from post-processing software include top data inputting capabilities, accurate result generation, and high-quality result production. UAV and post-processing tool manufacturers could take these findings into account to improve their products by either enhancing existing features or integrating new ones.
Finally, the last section of the questionnaire identifies the top futuristic features to be included in UAV technology. Of respondent experts, 85% believe that the most futuristic aspect of UAVs could be upgraded battery systems that can replace the existing lithium ion/polymer batteries for longer flying times. Automatic fall avoidance and artificial intelligence to autonomously collect data from target items are the other two top futuristic characteristics, which more than 50% of the respondents desire UAV technology to incorporate. Due to its widespread application in evaluating transportation infrastructure systems, UAV technology must be advanced to include the top futuristic characteristics. Future researchers should also focus on these areas, along with the challenges/barriers that the agencies encounter. Moreover, research should focus on hardware, software, sensors, and communication vulnerabilities, identifying threats such as signal interference, cyberattacks, and data breaches. These insights underscore the importance of advancing UAV systems that are not only operationally efficient but also fortified against evolving cybersecurity challenges, ensuring safe, secure, and reliable transportation infrastructure systems management. Therefore, mitigating the challenges/barriers and expanding the practical use of UAVs across diverse infrastructure systems and promoting their routine application in transportation system assessments will further enhance UAVs’ effectiveness, efficiency, and suitability in the transportation industry.


