Article

Optimizing the Use of Fly Ash as Partial Replacement of Fine Aggregate and Cement in Portland Cement Concrete Mixes

1
Department of Civil Engineering and Construction Management, University of West Florida (UWF), 11000 University Parkway, Pensacola, FL 32514, USA
2
Department of Civil and Environmental Engineering, Kennesaw State University (KSU), Marietta Campus, 655 Arntson Drive, Marietta, GA 30060, USA
*
Author to whom correspondence should be addressed.
CivilEng 2025, 6(3), 33; https://doi.org/10.3390/civileng6030033
Submission received: 24 April 2025 / Revised: 17 May 2025 / Accepted: 12 June 2025 / Published: 20 June 2025
(This article belongs to the Section Construction and Material Engineering)

Abstract

This study is a preliminary investigation of the independent utilization of two types of fly ash (FA)–FA Type C and FA Type F-as partial replacement of fine aggregate (sand) and cement in Portland cement concrete (PCC) mixes. The main objective was to determine an optimum substitution range for each type of FA that would offer well-performing concrete in terms of workability, compressive strength, and durability. To this end, multiple concrete batches were prepared, incorporating each type of FA at four different levels: 5%, 10%, 15%, and 20% by weight of fine aggregate replacement and 10%, 20%, 30%, and 40% by weight for cement replacement. Then, concrete samples (100 mm diameter × 200 mm tall cylinders) were cast from each batch and were moisture-cured for 7, 14, and 28 days prior to testing. The addition of FA contributed positively to the strength development at specific replacement levels: all percentages for both FA Type C and Type F for fine aggregate replacement and up to 30% FA content for both Type C and F for cement replacement, 10% for both FA Type C and Type F provided the higher strength for aggregate replacement, and 10–20% for both types of FA provided the higher strength for cement replacement. Furthermore, these additions of FA exhibited comparable workability and durability except for FA Type F, which did not exhibit comparable workability for aggregate replacement. FA Type C can be recommended for both early and long-term strength for fine aggregate replacement, whereas FA Type C is suggested to be used for early strength and Type F provides for long-term strength for cement replacement. Type C provides better durability and Type F provides better workability for cement replacement.

1. Introduction

The proliferation of fly ash (FA), a by-product of coal burning has become a pressing global issue, leading to significant environmental challenges. According to the American Coal Ash Association (ACAA), nearly 38 million tons of fly ash were generated in 2016 and about 22 million tons (57%) were reused in beneficial applications, including concrete production, flowable fill, embankments, agriculture, mining applications, road pavement, soil amendments, material recovery, and waste stabilization, while the rest of the production was sent to disposal basins [1]. In response, FA management and beneficial usage measures are being employed, both proactive and reactive, to minimize the amount of FA being sent to landfills. Within the building industry, the FA has a wide range of applications [2]. The use of FA as a partial substitute for Portland cement in concrete is commonly used in large volumes [3]. The use of FA for soil stabilization, which was the subject of this study report, was only 0.34% of the total FA generated in the USA and 1% for waste stabilization. In the road base and sub-base, the use was 1%, with structural fills and embankment over 5% [2]. The stabilization of clayey soil with multiple percentages of FA with a maximum of 12.5 percent was investigated in a study [4], and it was found that the highest California bearing ratio (CBR) and unconfined compressive strength (UCS) were present in the soil mixture with 7.5 percent FA. Another study [5] examined the short- and long-term behavior of the soil treated with 5, 10, 15, and 20 percent FA material. No substantial difference between the results of Proctor and a direct correlation between the content of FA and the maximum dry density (MDD) was shown in the results of this analysis. For 80% of the soil samples analyzed, the soil mixture with 20 percent FA showed the highest MDD.
While fly ash is commonly used as a replacement for cement, its use as a partial replacement for fine aggregates has also been studied with promising results. Fly ash can act as an alternative to fine aggregates, providing a more sustainable option. The use of fly ash as a fine aggregate replacement is particularly beneficial in reducing the demand for natural sand, which is increasingly being depleted [6].
Research by Gupta et al. [7] demonstrated that replacing fine aggregates with fly ash in proportions up to 30% resulted in increased workability and slightly improved compressive strength, with minimal impact on other properties such as water absorption and durability. The study emphasized the need for careful control of fly ash particle size, as it can influence the overall mix design and performance of the concrete. In contrast, a study by Siddique [8] showed that replacing fine aggregates with fly ash resulted in a slight decrease in compressive strength, particularly at higher replacement levels, due to the lower specific gravity and finer texture of fly ash compared to natural sand. Nonetheless, the study also concluded that fly ash could be used as a partial replacement for fine aggregates in non-structural concrete or in mixes where strength is not the primary concern.
Fly ash is commonly used as a partial replacement for cement in concrete, as it improves the workability, reduces the heat of hydration, and enhances the long-term strength and durability of concrete [9]. Several studies reported the effectiveness of fly ash in improving the properties of concrete, such as compressive strength, porosity, and resistance to sulfate attack. Specifically, fly ash contributes to the formation of additional calcium silicate hydrate (C-S-H) gel, which enhances the strength and durability of concrete over time [10]. For instance, Kumar et al. [11] investigated the influence of fly ash as a partial replacement for cement in concrete and found that replacing up to 30% of cement with fly ash resulted in concrete with superior workability, reduced bleeding, and enhanced durability against chloride penetration and sulfate attack. However, they also found that higher replacements (above 30%) could lead to reduced early-age strength, which needs to be compensated for by optimizing the water–cement ratio and curing conditions.
The incorporation of fly ash in concrete not only improves material properties, but also contributes to sustainability goals. Fly ash reduces the carbon footprint of concrete by lowering the amount of cement required, which in turn reduces CO2 emissions associated with cement production. Economically, the use of fly ash can reduce the cost of concrete production. Fly ash is often available as a by-product at a lower cost than cement, and its use can mitigate the increasing prices of cement and fine aggregates. This can result in more cost-effective concrete mixes, particularly for large-scale construction projects [12].
Previous research demonstrated the promising outcomes of utilizing FA in construction and building materials, which encompass performance, economic, and environmental benefits. However, there is still a lack of practical designs for different types of FA. Addressing this gap, a study was conducted to investigate the individual utilization of two types of FA (Type C and F) as partial replacements for fine aggregate and cement in Portland cement concrete mixes. The primary objective of this study was to determine the optimal substitution rate for FA, leading to the formulation of concrete mixes that result in good performance in terms of workability, compressive strength, and durability. To achieve this goal, multiple concrete batches were prepared, incorporating each type of FA material at four different levels: 5%, 10%, 15%, and 20% by weight of fine aggregate replacement and 10%, 20%, 30%, and 40% by weight for cement replacement. Concrete samples in the form of cylinders with 100 mm (4-inch) diameter and 20 mm (8-inch) height were cast from each batch and cured for 7, 14, and 28 days prior to testing. Additionally, the chemical characteristics of each waste material were reviewed based on the study [13] that conducted FTIR and SEM experiments to explain and to support the understanding of strength development mechanisms and the evolution of microstructures in recycled concrete. The optimized utilization of FA in concrete not only holds the potential to bolster effective waste management practices, it also promises to reduce disposal costs and mitigate reliance on raw materials for construction purposes [14]. Furthermore, it aligns with the current waste management goals as underscored by recent literature [15].

2. Materials and Experimental Program
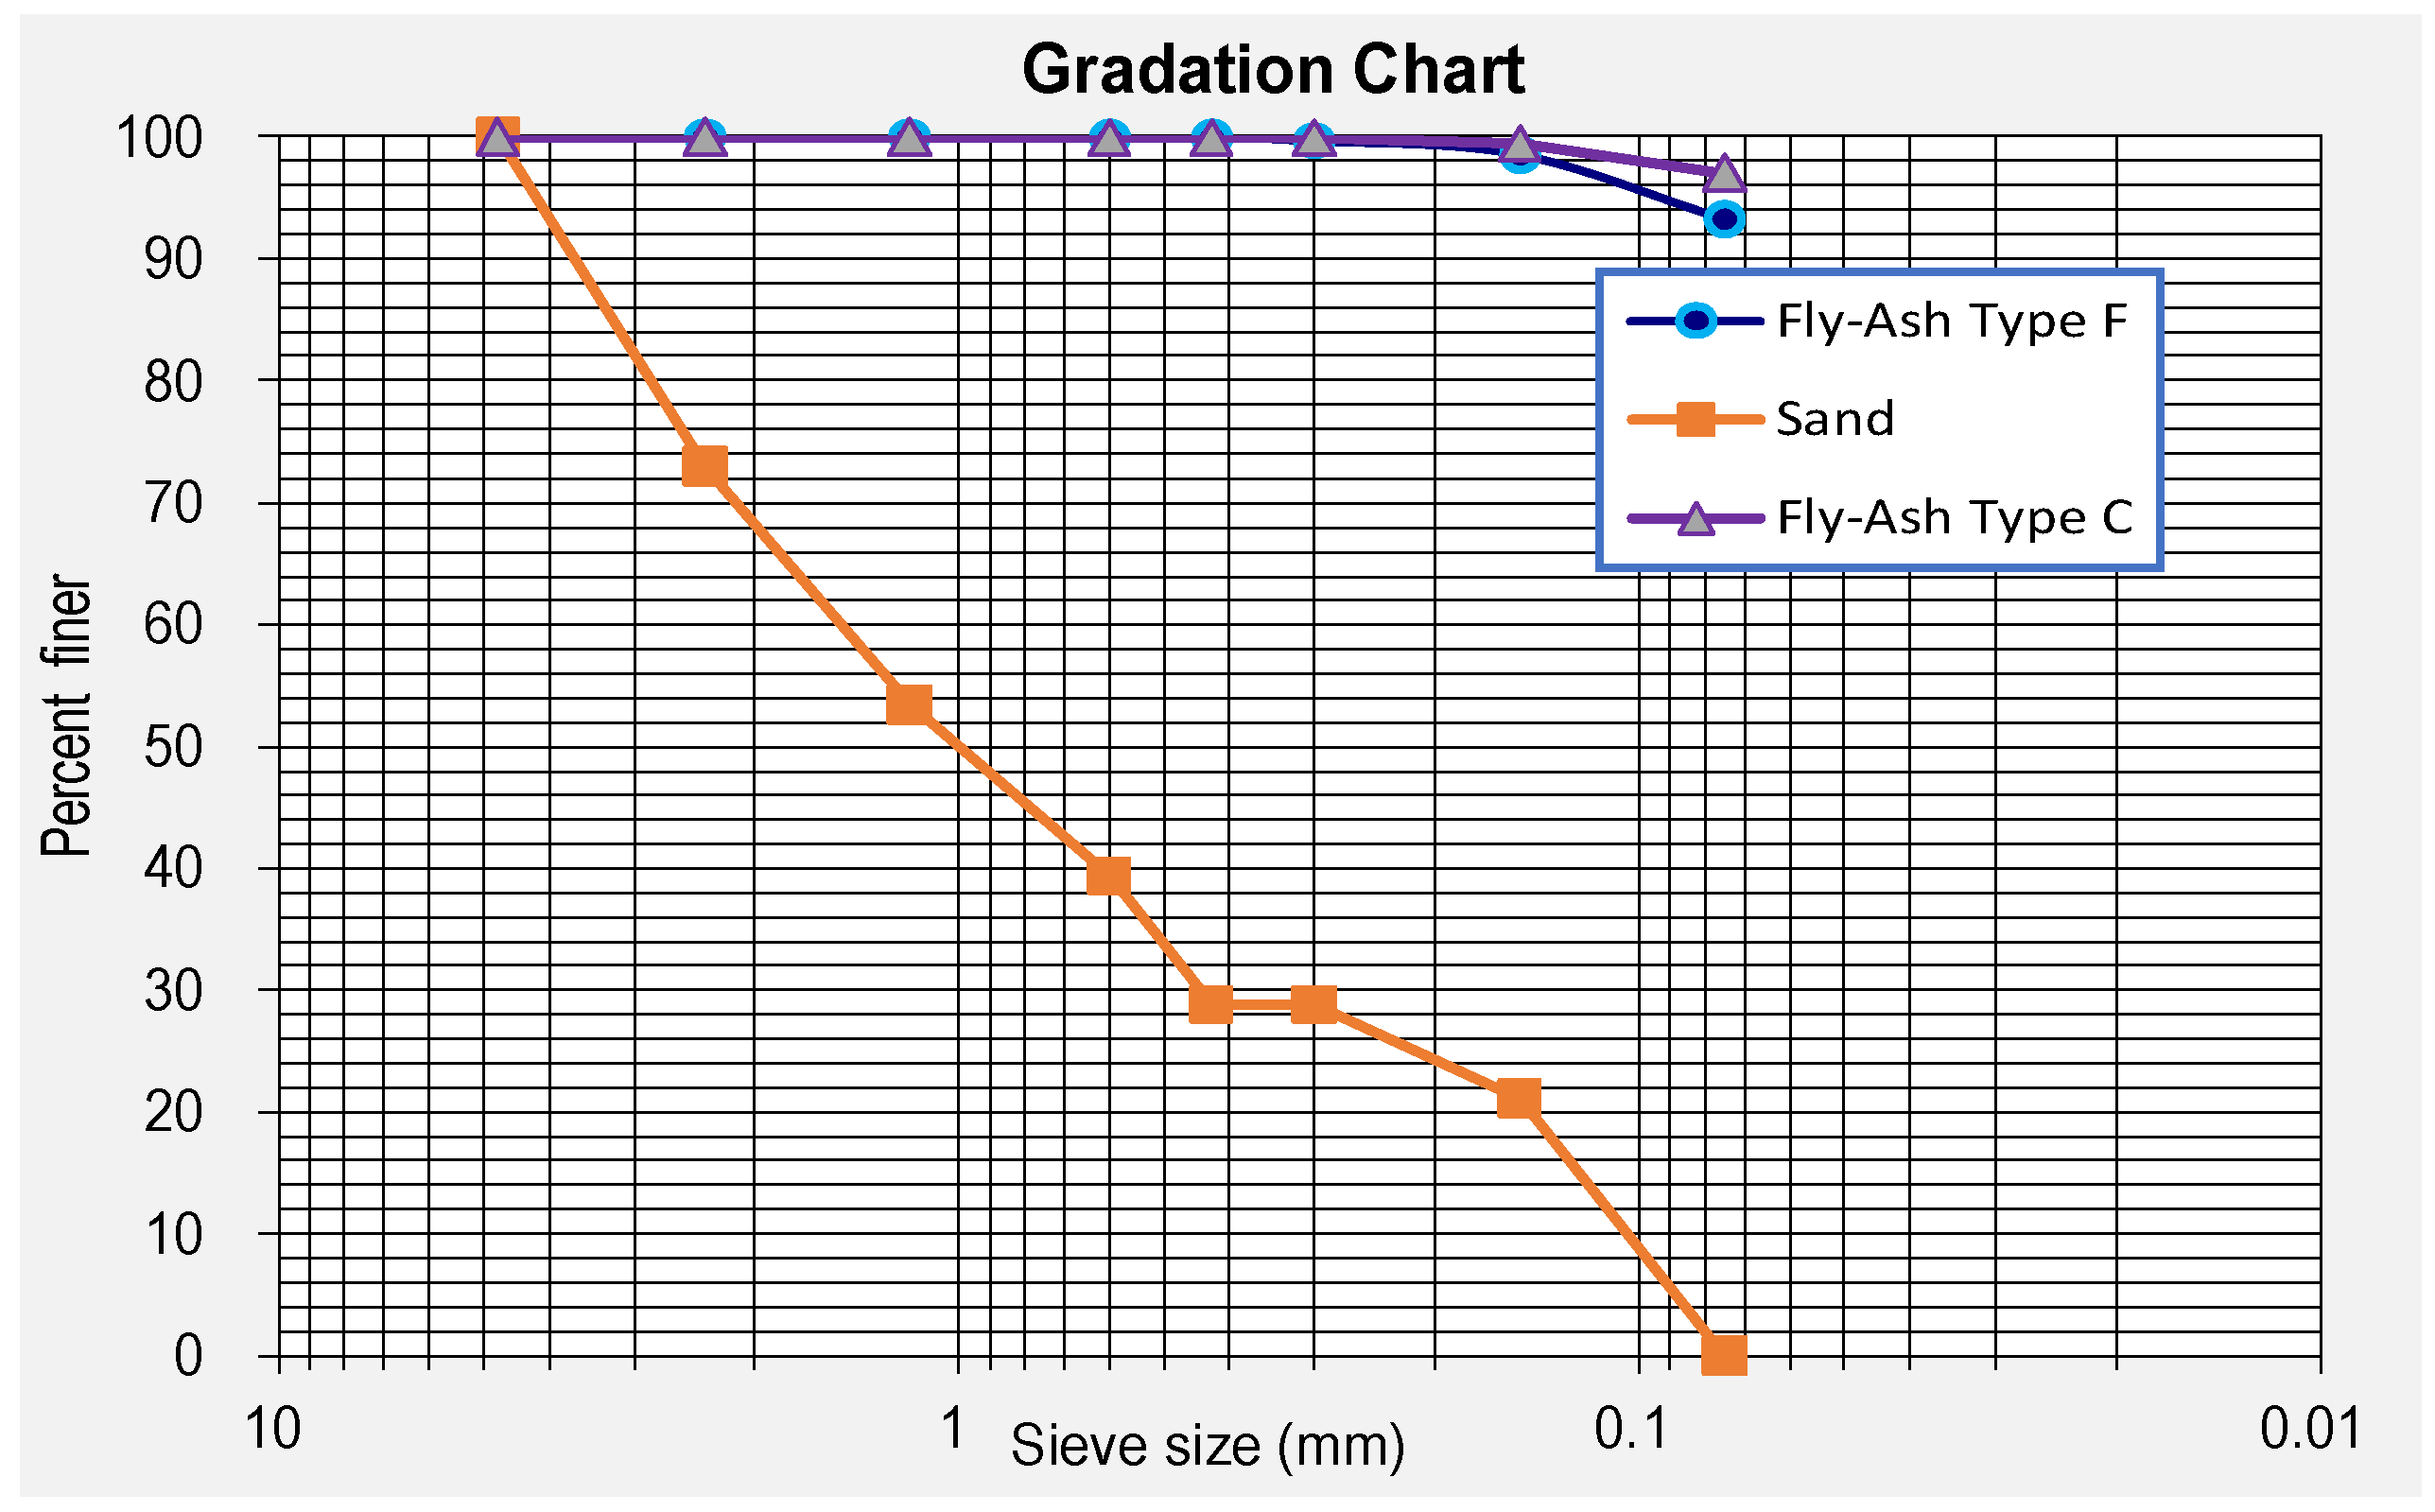
2.1. Fly Ash

The fly ash (FA) sample was collected from a local Georgia Power coal plant (Plant Bowen) located in Bartow County, Georgia. The plant usually burns 1100 tons of coal an hour, the equivalent of three 95-car trainloads a day [16]. The FA samples used in this study were both Type C and Type F [17].
The composition of oxides present in “Type C” and “Type F” FA as reported in the literature can be found elsewhere [18], as listed in Table 1.
Figure 1 shows a gradation chart developed for FA samples and fine aggregate (sand) used in this study. Mechanical sieving was used for the coarse-grained portion and hydrometer analysis was used for the fine-grained portion of the material for grain size distribution, in accordance with ASTM D2487-06, ASTM D422, D1140, and AASHTO T88 and ASTM D7928-17. No other gradation analysis was provided as the D60, D30, D10, etc. for FA can not be determined from Figure 1.

2.2. Concrete Batches and Samples

Table 2 [19] presents key design parameters and their corresponding target values utilized for the control mix. Type I/II cement sourced from Leigh Hanson Company in Doraville, GA, USA was batched with aggregate blends. Both coarse aggregate (designated as #57 coarse aggregate) and #810 fine aggregate (#810) were obtained from a quarry in Augusta, GA, USA. In the case of the recycled batches, most of the target values remained consistent with those of the control mix. A fraction of fine aggregate was replaced by both FA Types F at four rates: 5%, 10%, 15%, and 20% by weight of sand, and a fraction of cement was replaced by both FA types at four rates: 10%, 20%, 30%, and 40% by weight of cement. It should be noted there are no other cementitious materials than Portland cement in any concrete batches to better evaluate the effects of FA utilization on strength gain. Further, no chemical additive was added in the PCC mixes.
After mixing, each batch was tested for workability and then cast into 100 mm (4-inch) diameter and 200 mm (8-inch) tall cylinders for moisture curing. The hardened concrete cylinders were tested for performance evaluations at 7, 14, and 28 days. For each FA and each fraction replacement, nine cylinders were prepared at each FA content.

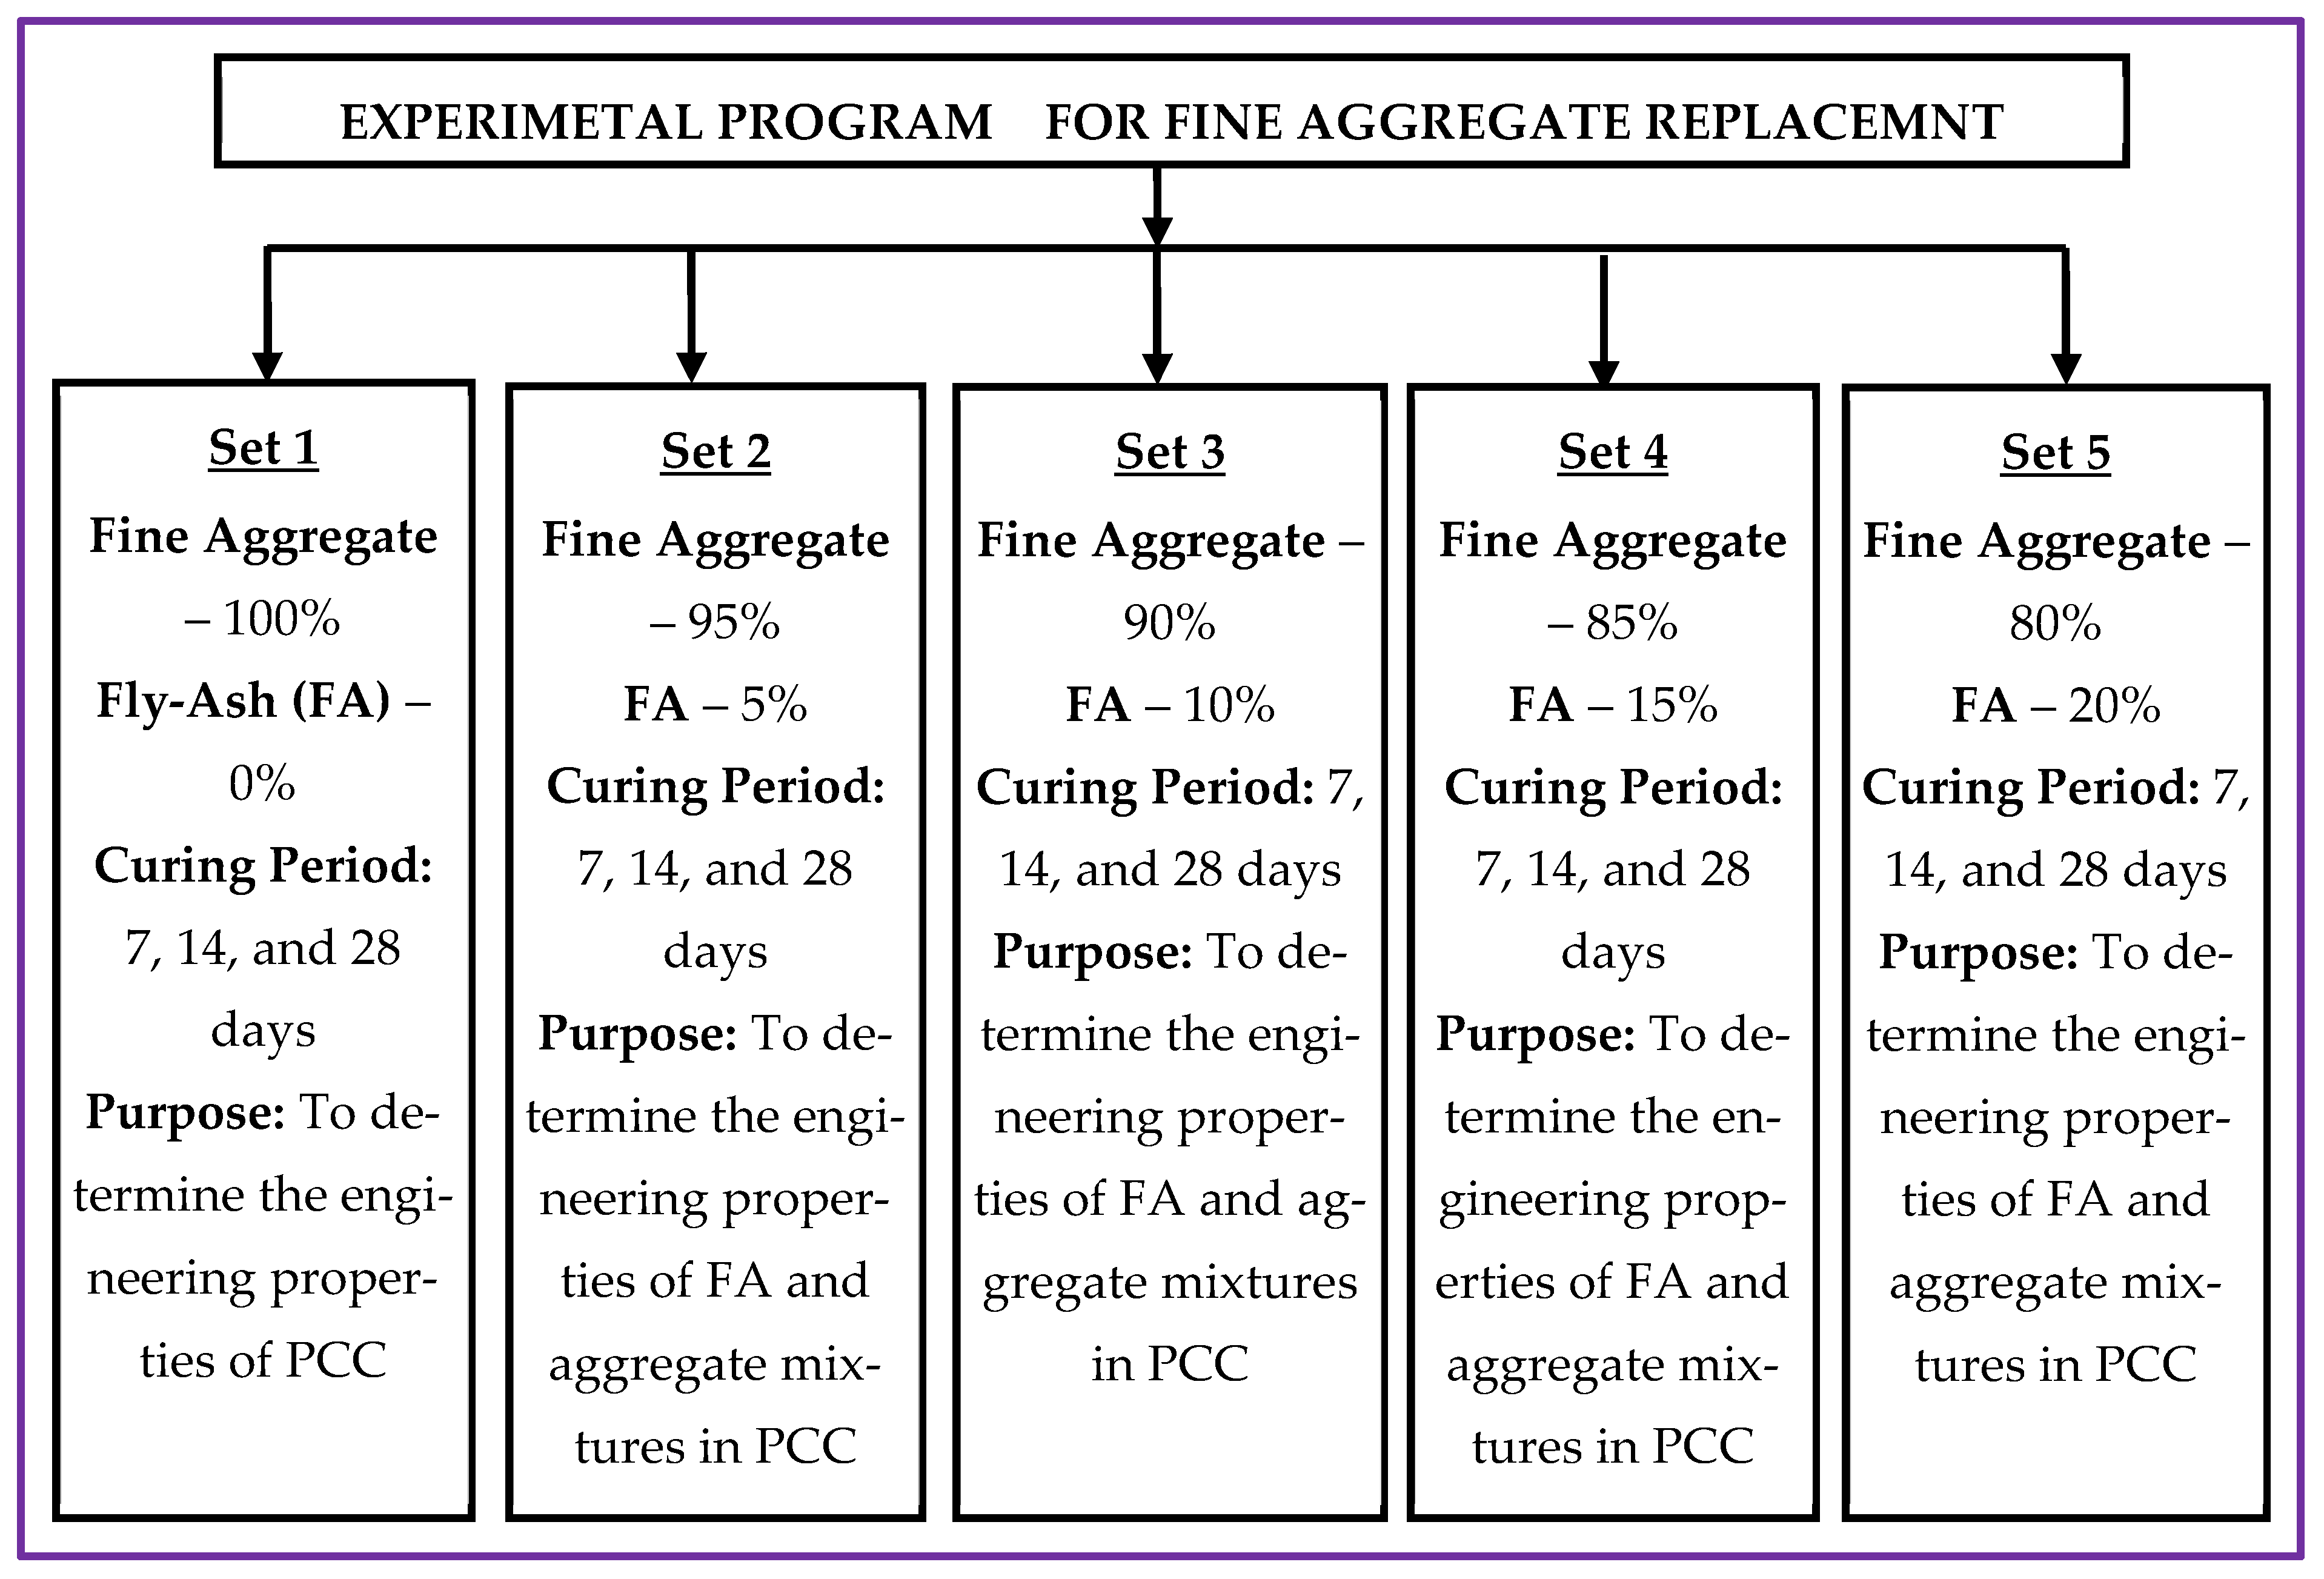
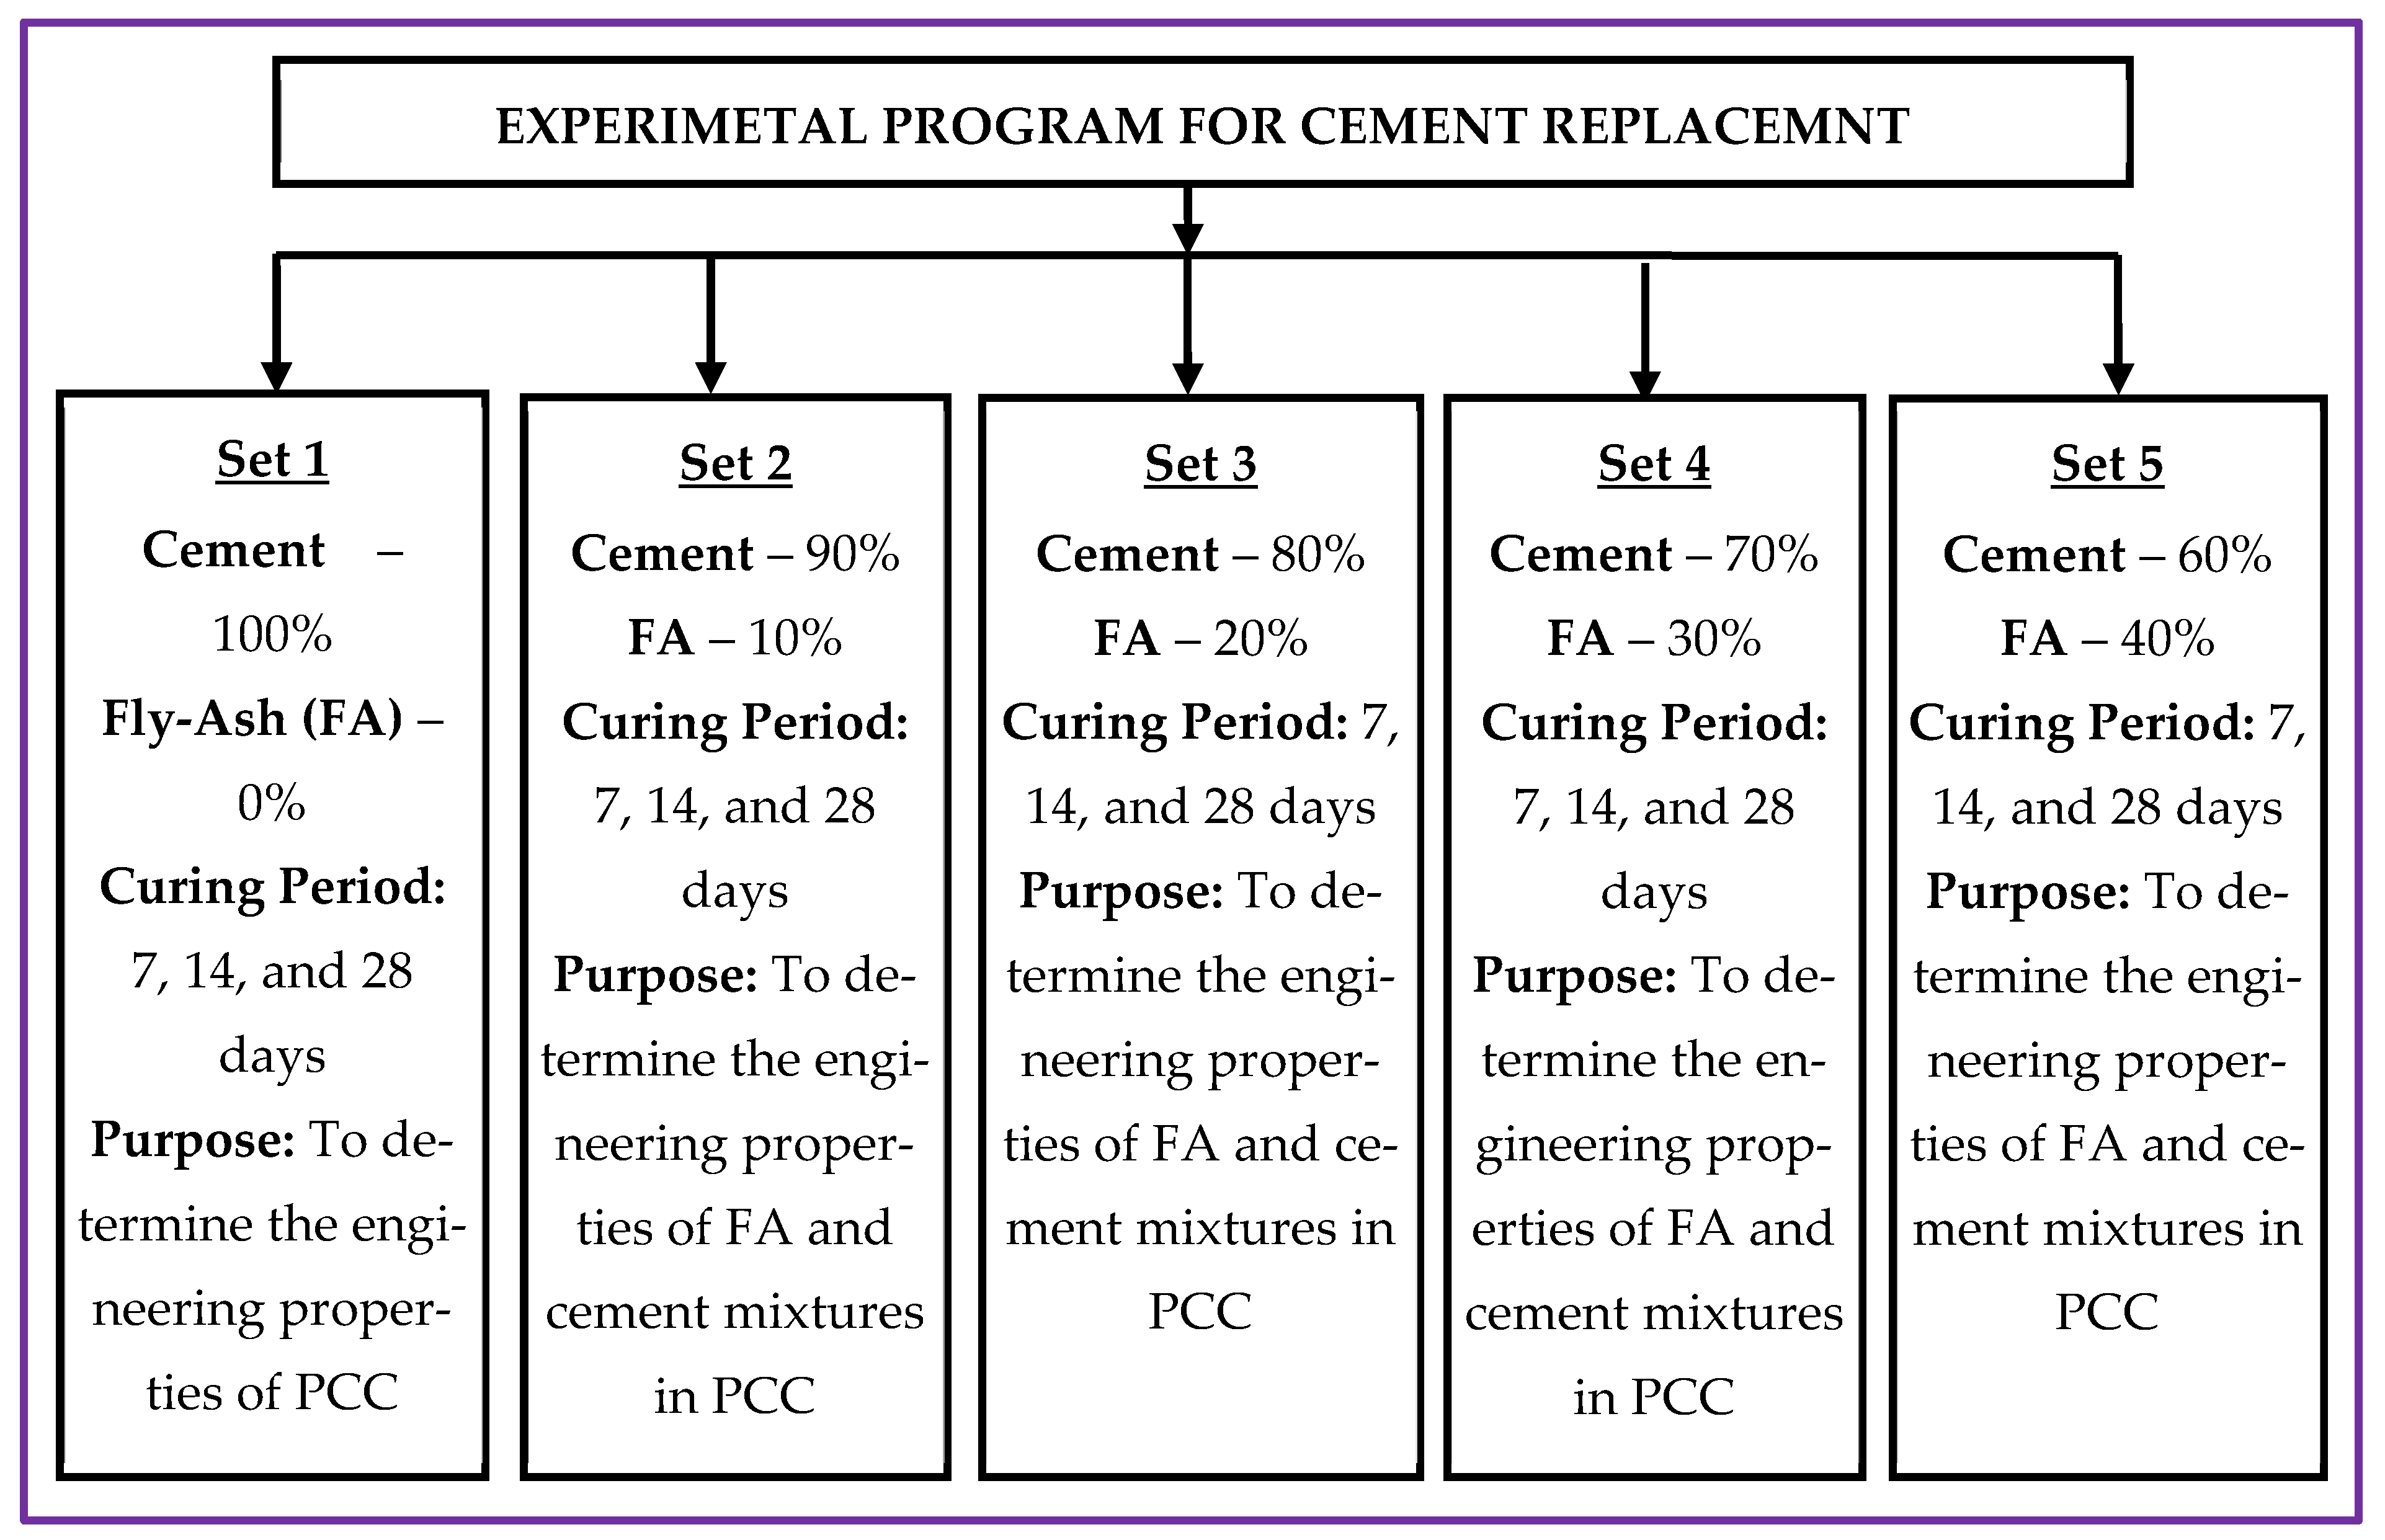
2.3. Experimental Program

Five sets of experiments were run to accomplish the objectives of this study. The flowcharts in Figure 2 and Figure 3 show the experimental setups with other relevant information for each type of FA. The percentages of FA replaced with fine aggregate (Figure 2) and with cement (Figure 3) and the curing periods were arbitrarily selected.
The selection of laboratory tests was guided by their relevance in evaluating both the fresh and hardened performance of concrete containing fly ash. The slump measurement was employed to assess workability, which directly influences concrete’s pumpability, placement, and finishing characteristics—properties critical in construction applications, particularly where fly ash can significantly modify flow behavior. Compressive strength indicates the key structural performance and durability potential and is extensively used to quantify the effectiveness of pozzolanic reactions in blended cementitious systems. Electrical resistivity is effective in measuring concrete’s resistance to chloride ion penetration and assessing the characteristics of pore structure. Adopted in this study, surface resistivity is a tool used to evaluate the durability of concrete incorporating FA. No Fourier transforms infrared spectrometer (FTIR) spectroscopy and scanning electron microscope (SEM) analyses were performed to identify the chemical structure in each FA type, however, the analyses performed in a study [13] were used to explain the chemical and physical structure effects of FA on concrete strength.
Following procedures specified in ASTM C143, the workability of fresh concrete was checked with slump measurements for both the control and recycled batches. With the slump values compared between the batches, one can understand how recycled waste should affect workability. Conventional slump controllers such as water and admixtures were not part of the testing variables.
A surface resistivity technique (the Wenner probe) was employed to test concrete durability according to AASHTO TP9. A main hypothesis was that the waste materials incorporated should change pore size distribution and the shape of the interconnections in the concrete’s microstructure and thus influence the service life of concrete under adverse environmental conditions. there are few studies that suggest other applications for the surface resistivity test. Some authors, such as Lübeck et al. [20], Chen et al. [21], Bem et al. [22], and Mendes et al. [23], observed that the concrete resistivity increases as the compressive strength increases, whereas Medeiros-Junior and Lima [24] report that electrical resistivity measurements can be used to predict the compressive strength of Portland cement pastes. For this reason, it is expected that the surface electrical resistivity test can be used to estimate the compressive strength and tensile strength of concrete due to the test’s susceptibility to variations in the material’s microstructure, as well as the fact that these concrete properties increase with the progress of the cement hydration [25]. A series of surface resistivity tests were conducted on cylinders at 7, 14, and 28 days, followed by compressive strength tests. Test setups and procedures described in ASTM C39 were followed and a servo hydraulic loading machine (Humboldt) was used to capture the peak load.
The data collected from all performance tests were processed to evaluate the impact on FA utilization on concrete to replace sand and cement.

3. Results and Discussions

3.1. Impact of FA on Workability

Figure 4 summarizes the slump measurements for all fresh cement concrete samples. The experiments were conducted in triplicate for each batch and curing age. Overall, slump significantly increased from the control batch (0% FA content) as FA content increased for all scenarios (Figure 4a,b,d), except for FA Type F when replacing sand (Figure 4c). FA Type C improves workability, making concrete easier to mix and place, which is particularly relevant for applications such as pumpable concrete [26,27]. In contrast, FA Type F reduces workability during fine aggregate replacement (Figure 4c) due to its lower calcium content and slower reaction rate (Table 1), though it improves workability during cement replacement (Figure 4d).
Use of higher FA Type C content (15–30%) can enhance flowability, though content above 10% may result in mixes that are overly fluid, increasing shrinkage and permeability. A high content of FA Type F may reduce slump and produce stiff mixes. For a balanced outcome, a moderate FA Type C (10–20%) is recommended. For applications requiring increased durability, such as those exposed to aggressive environments (e.g., chloride or sulfate exposure), lower FA Type F content (≤10%) is more suitable. Standards such as ASTM C1202, C666, and C1012 help define performance thresholds for such durability-focused scenarios [28,29,30]. FA Type C is better for high workability requirements ideal for pumpable concrete and mass pours, whereas FA Type F is more appropriate for mixes targeting enhanced durability. Admixtures (e.g., water reducers, superplasticizers) may be adjusted to optimize performance depending on the specific design needs and target applications.

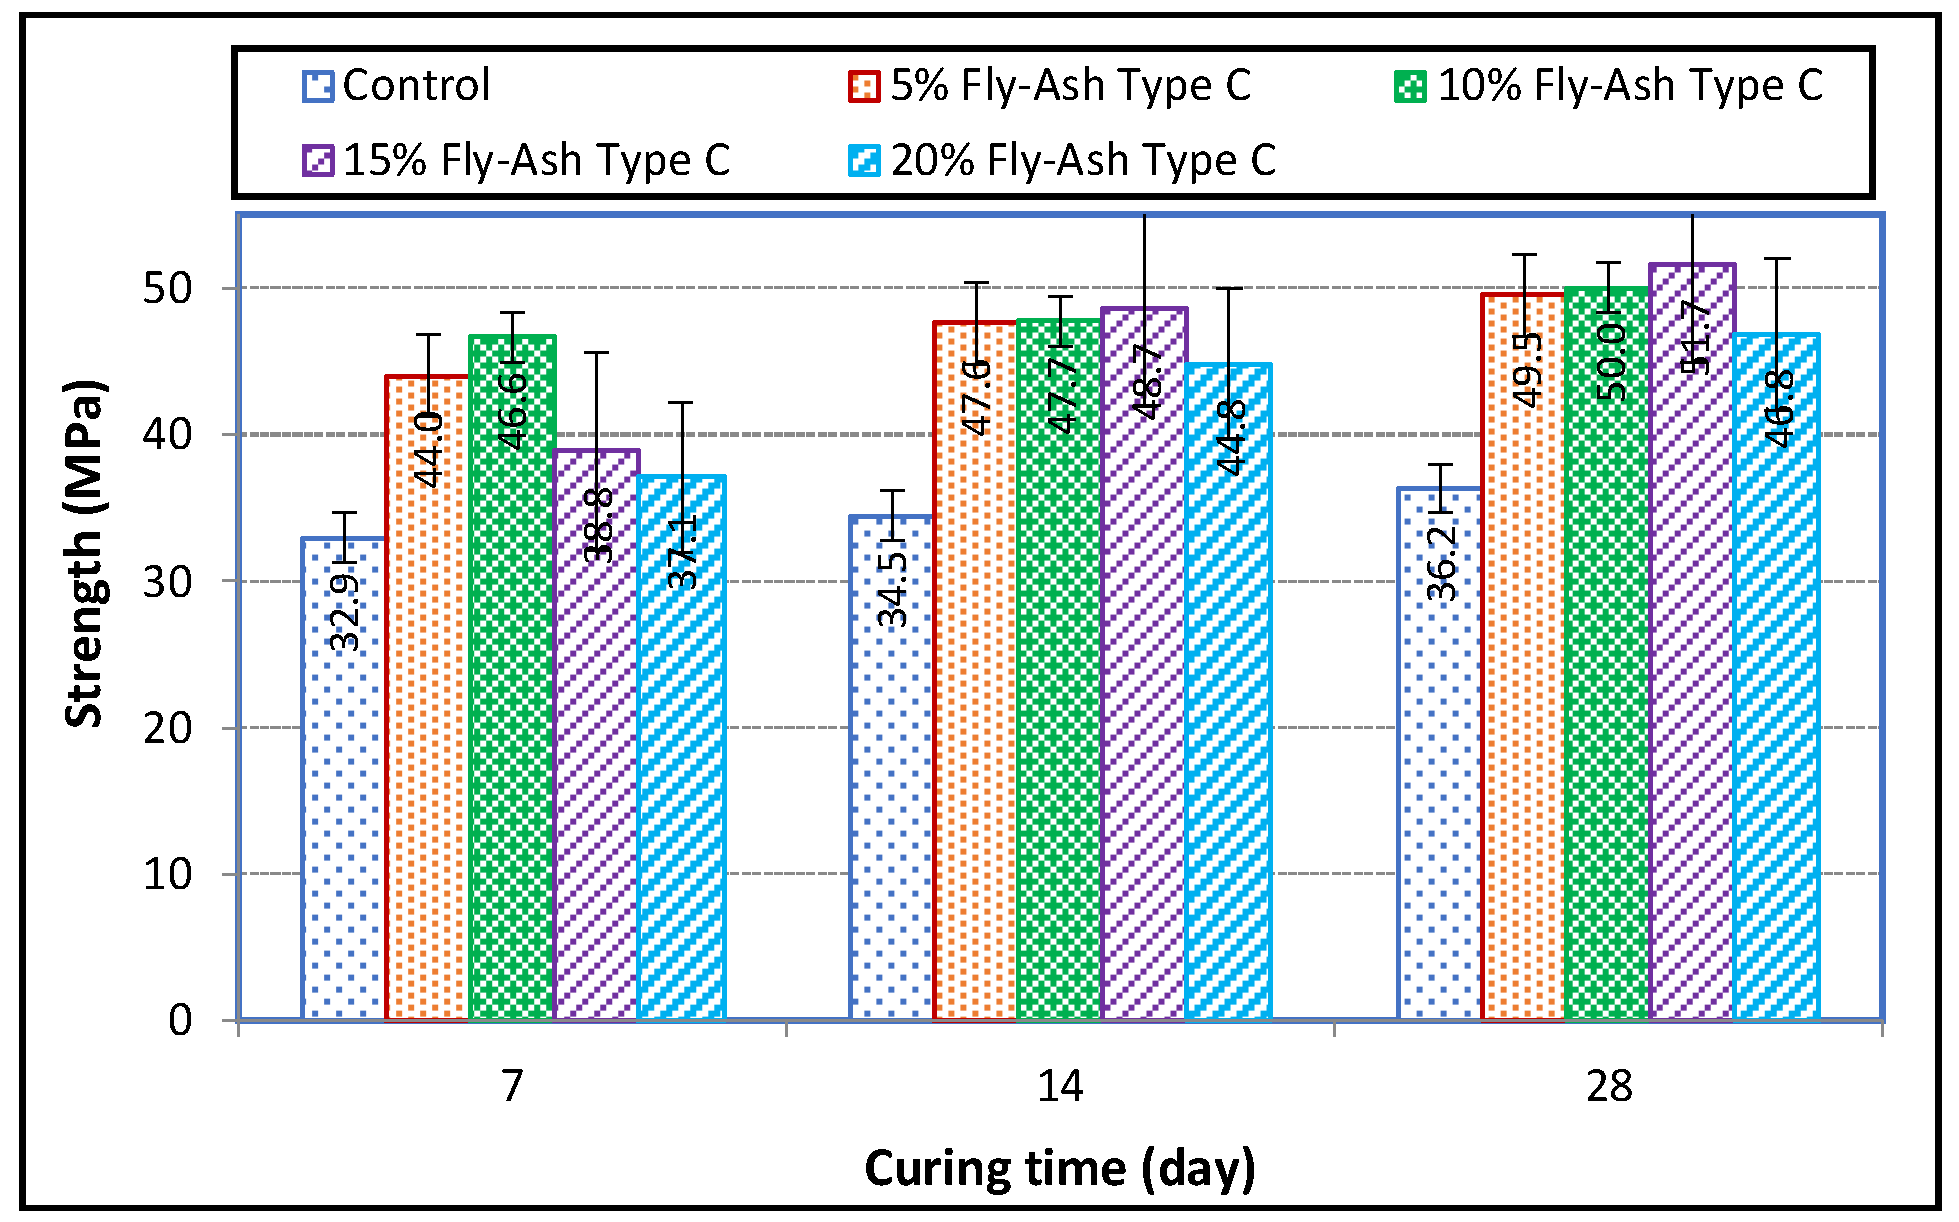
3.2. Impact of FA on Strength and Durability

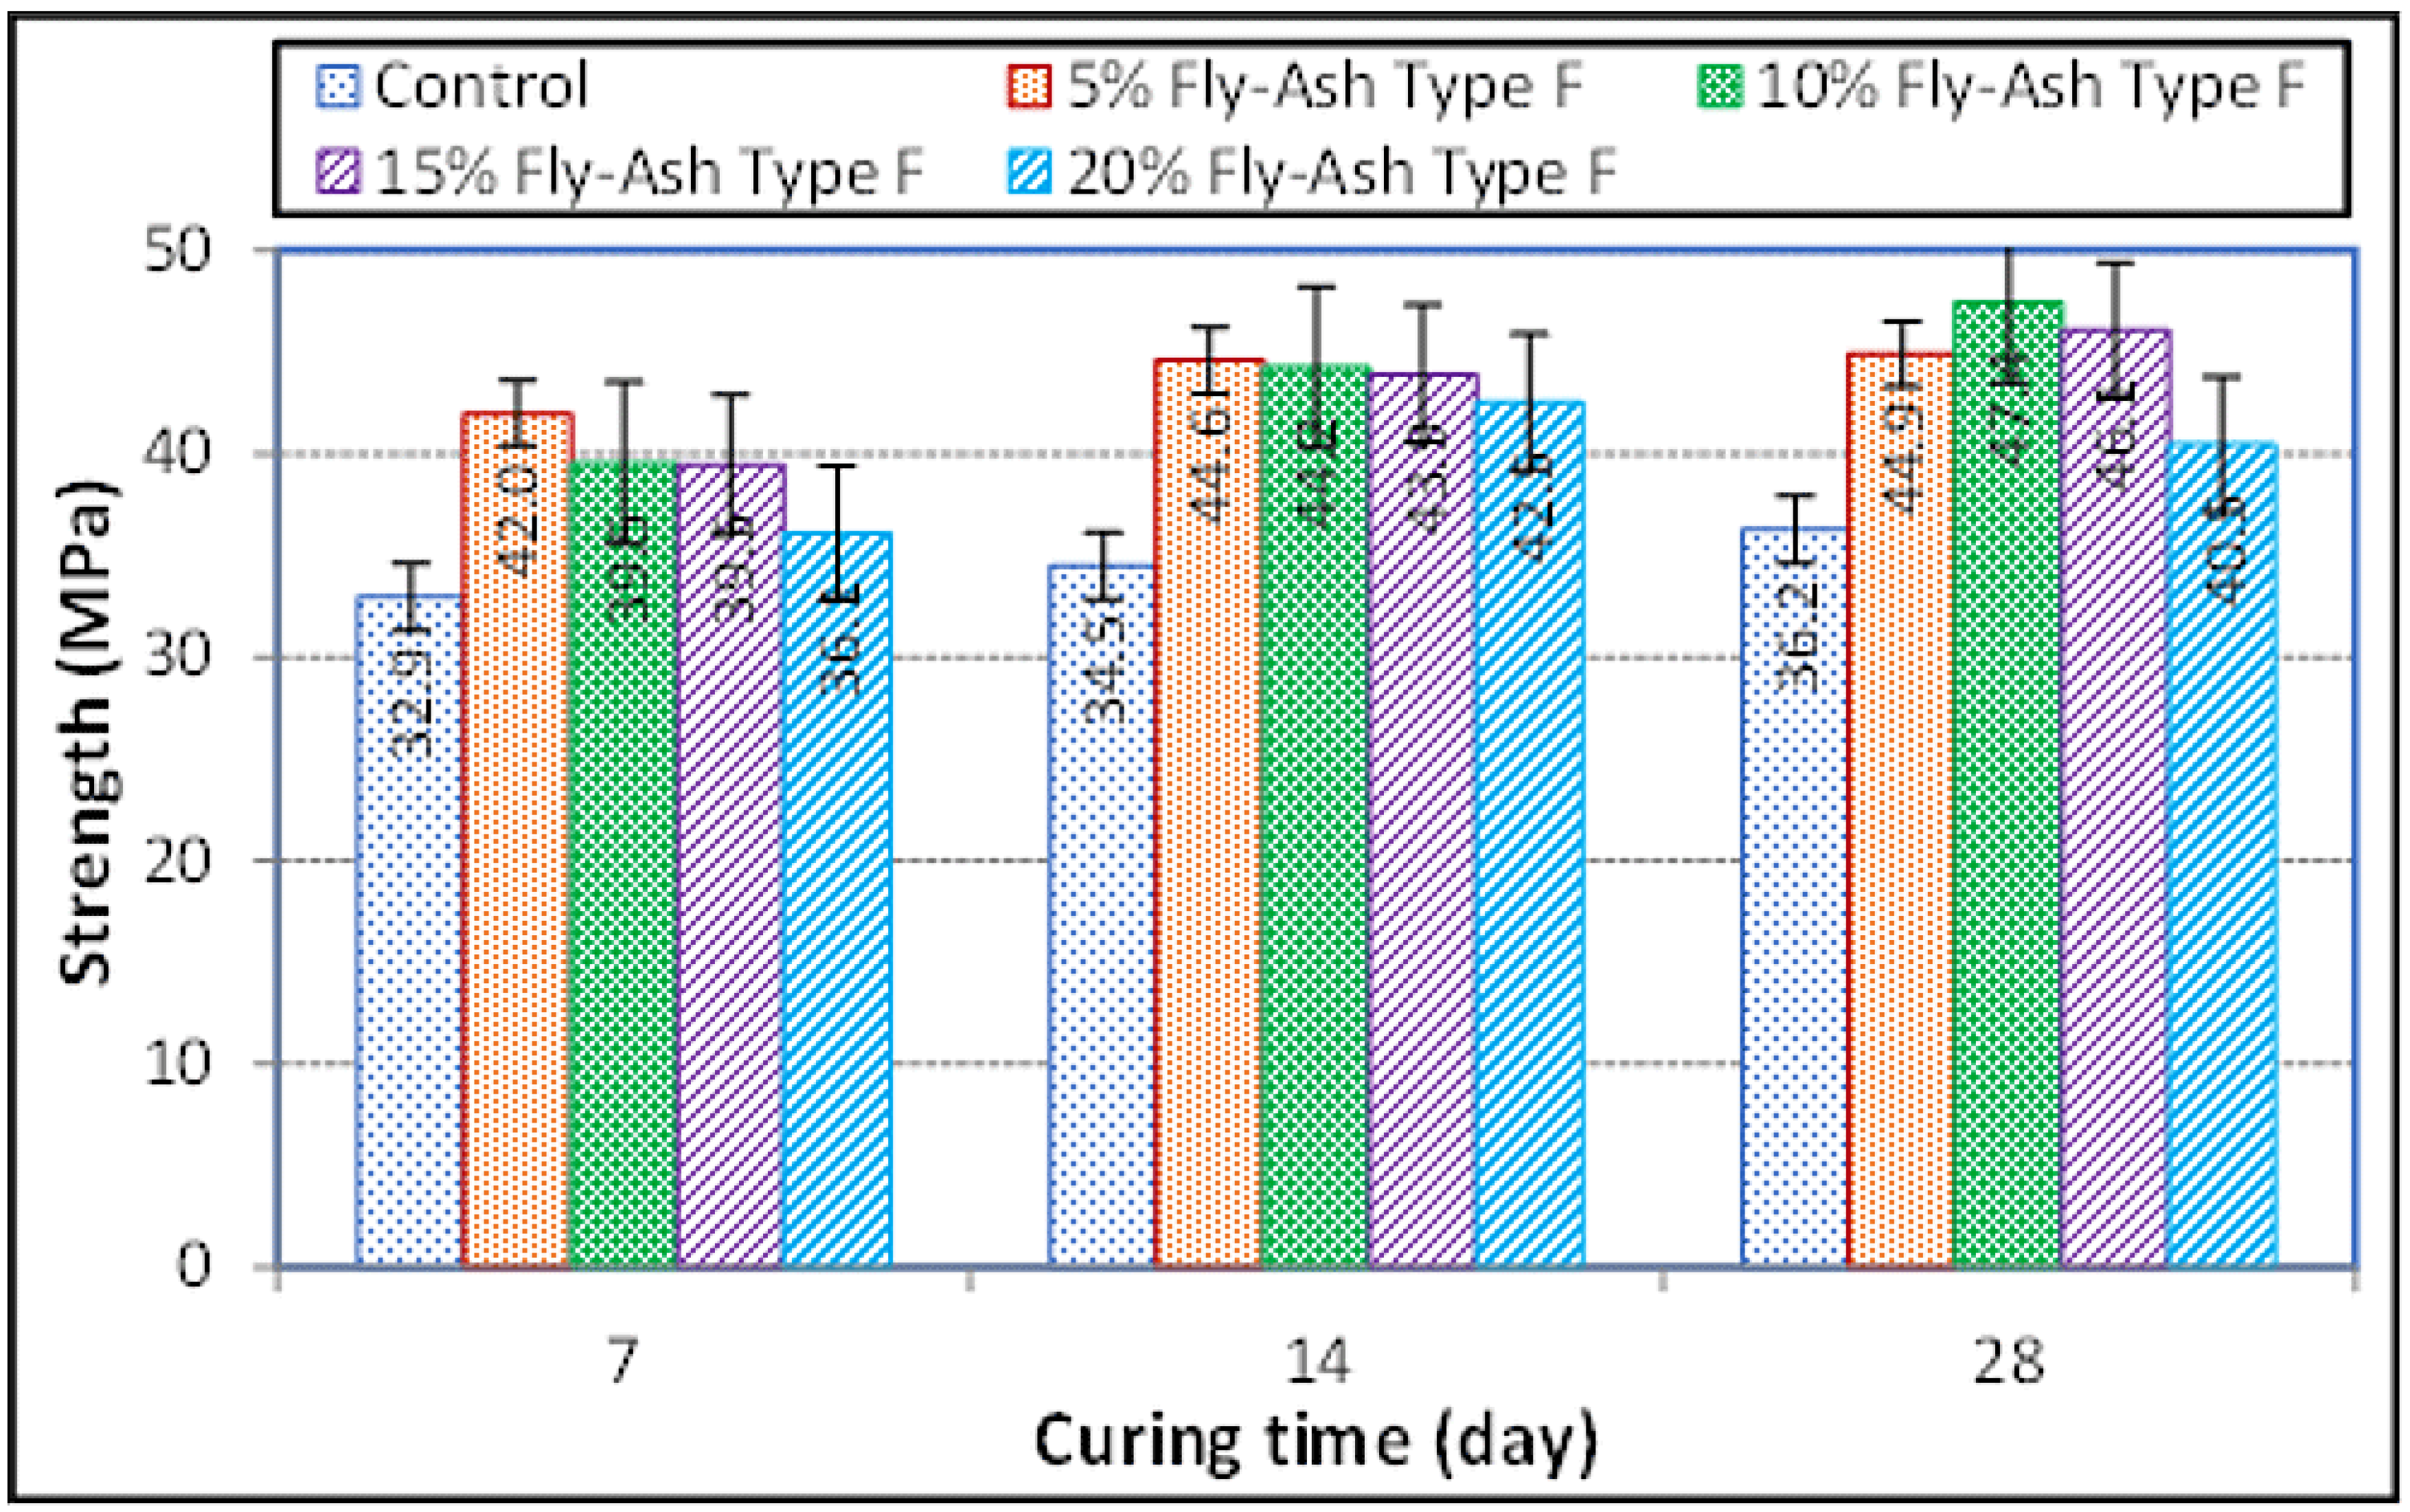
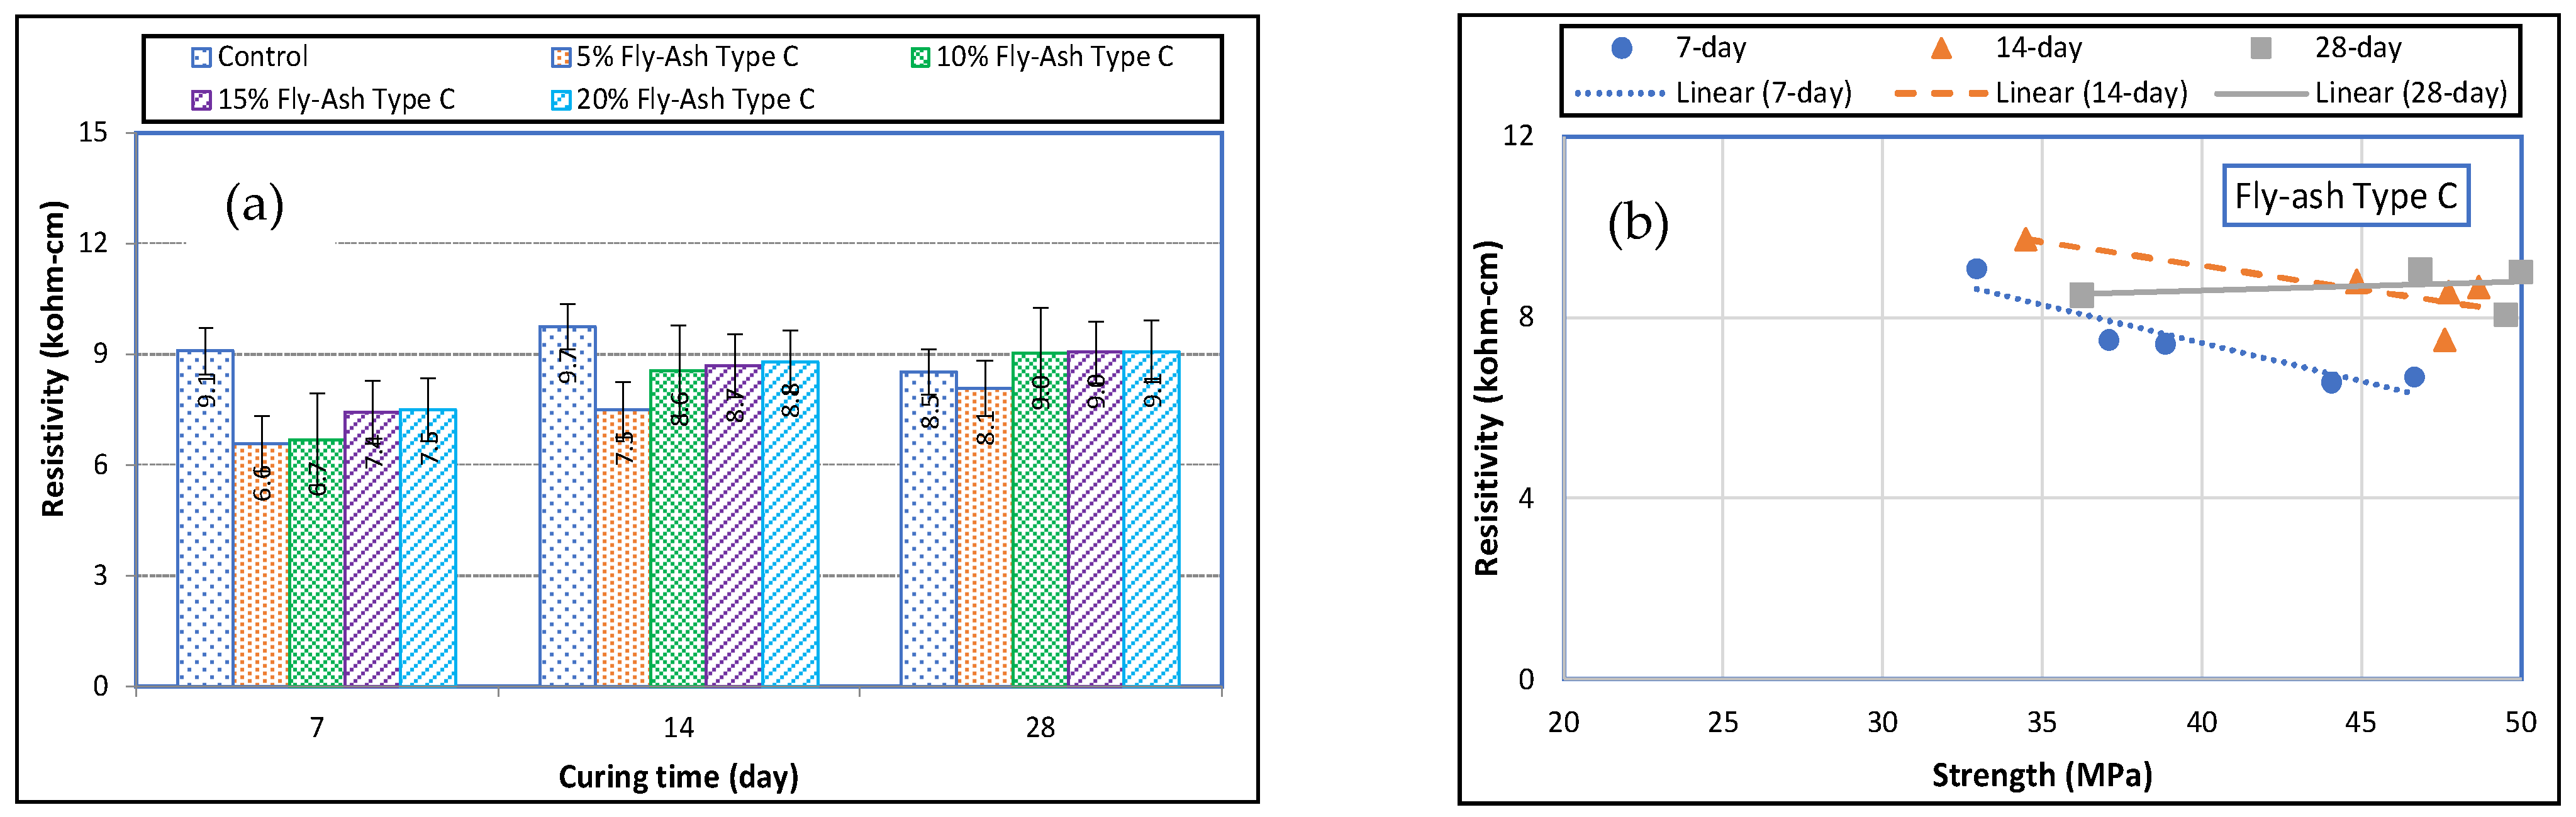
3.2.1. Fine Aggregate Replacement

As seen in Figure 5, compressive strength in control samples increases over time from ~32.9 MPa at 7 days to ~36.5 MPa at 28 days, sufficiently meeting the minimum strength requirement of 21 MPa at 28 days. FA improves compressive strength in concrete compared to control mixes due to the pozzolanic reactions from FA. In concrete samples cast with 5% FA Type C, compressive strength reached ~41 MPa at 7 days, ~47.6 MPa at 14 days, and ~49.5 MPa at 28 days. Ten percent (10%) achieves the highest strength among all mixes at each curing age (~44 MPa at 7 days, ~49 MPa at 14 days, and ~50.5 MPa at 28 days). Fifteen percent (15%) is slightly lower than the 10% mix, but still higher than the control. Twenty percent (20%) shows a decreasing trend in strength compared to lower FA Type C content, though it is still stronger than the control. The 10% FA Type C mixture gives the highest strength at all curing ages. Overall, high FA Type C content (≥15%) has very little effect, as beyond 10%, increasing FA reduces strength slightly, suggesting an optimal replacement percentage of 10% for sand replacement.
Figure 5 also illustrates the relationship between FA Type C content (%) and strength (MPa) at different curing ages (7, 14, and 28 days). Polynomial trend lines are fitted for each curing period, showing how strength varies with FA content. Strength increases as FA content rises up to around 10% and then declines beyond this point. The trend is consistent across all curing ages (7, 14, and 28 days). Seven-day strength (blue dots and dotted trendline) starts lower than the other ages but follows a similar trend and peaks around 10% FA Type C before declining. The 14-day strength (orange triangles and dashed trendline) shows significant improvement over the 7-day strength and also peaks at 10% content. The 28-day strength (gray squares and solid trendline) shows the highest overall strength values and follows the same peak trend at 10% FA before declining slightly. The polynomial equations given describe the strength variation for each curing age. R2 values (close to 1.0) indicate a strong fit, meaning the model accurately represents the data. The equations confirm that FA Type C around 10% yields the highest strength. Therefore, optimal FA Type C content seems to be 10% for sand replacement, as it gives the highest strength across all curing periods. Longer curing improves strength, as 28-day strength is significantly higher than 7-day strength, highlighting the pozzolanic activity of FA, which develops strength over time. However, excess FA (>10%) lowers strength, which could be likely due to dilution of cementitious materials or slower hydration reactions.
Concrete mixed with FA type F resulted in the strength gains compared to control samples. Figure 6 shows the effect of different percentages of FA Type F on strength (MPa) over different curing periods (7, 14, and 28 days). It is structured similarly to the previous FA Type C (Figure 7a), allowing for comparison. At 5% of FA Type F content, strength increases significantly over the control at all ages, and it peaks around 42 MPa at 28 days. The 10% content produces the highest strength values at all curing ages (~44 MPa at 28 days). This suggests an optimal fly ash content of around 10% for both types of FA. At 15% and 20% FA Type F content, strength is lower than the 10% mix, but still higher than the control. The reduction in higher FA percentages suggests diminishing strength gains beyond 10%.
Both FA types improve strength over the control. FA Type C (Figure 5) resulted in slightly higher strength than FA Type F. This may indicate that FA Type C is more reactive at early ages, whereas FA Type F has a slower pozzolanic reaction. Optimal replacement for both types of FA is around 10%. FA Type F enhances strength but requires an optimal percentage (~10%) to maximize benefits. Overuse of FA (>10%) results in a decline in strength, possibly due to slower reaction rates or dilution of cementitious material. For both FA types curing time significantly improves strength, with 28-day strength being the highest across all mixes.
Figure 6 also illustrates the relationship between FA Type F content (%) and strength (MPa) at different curing ages (7, 14, and 28 days), with polynomial trend lines fitted for each dataset. Similar to FA Type C, strength increases as FA content increases up to about 10%, and beyond 10%, strength starts to decline indicating diminishing benefits at higher FA content. FA Type C had slightly higher peak strength values than Type F, especially at earlier curing ages. Type F develops strength more gradually, suggesting a slower pozzolanic reaction compared to Type C. Similar to Type C, 10% FA Type F provides the best strength performance. Early-age strength (7-day) is lower, meaning FA Type F may require more curing time for full benefits. Higher FA content (>10%) also reduces strength, which is likely due to dilution effects or slower hydration reactions.
Table 3 shows which FA type is better under different criteria in sand replacement. Based on this table information, it appears that FA Type C performs better at higher FA contents. FA Type F shows a sharper decline at >10%, making it less effective for high replacement levels.
Use FA Type C if one needs higher early and long-term strength and use FA Type F if one prioritizes long-term durability and sustainability but expect slower strength gain. For best performance, keep FA content at 10% for both types.
In Figure 7a, the resistivity for FA Type C replacing sand—an indicator of concrete durability—controls (no FA) consistently have the highest resistivity at all ages (~9.5 kohm·cm). FA mixtures have lower resistivity than control, suggesting higher ionic movement (lower durability). At 7 days, resistivity is the lowest but increases with curing time. Higher FA content (>10%) results in slightly higher resistivity at later ages, which could indicate slower pore refinement due to pozzolanic reactions. Overall, FA Type C reduces resistivity compared to control, but values improve with time as pozzolanic reactions refine the pore structure that can mean slightly lower durability in aggressive environments (chloride/sulfate exposure). Resistivity improves over time, meaning pozzolanic reactions eventually refine the pore structure. Higher FA content (>10%) slightly improves resistivity, indicating better long-term durability. Strength and resistivity have flat to negative correlations (Figure 8b) for all curing periods, suggesting that denser and stronger concrete tends to be more conductive.
Figure 8a shows the resistivity for FA Type F replacing sand. Similar to FA Type C, controls (no FA inclusion) consistently do not have the highest resistivity at all ages. Resistivity increases for 14 and 28 days. This suggests that as hydration continues, the concrete becomes more resistive to electrical flow, likely due to reduced porosity and increased refinement of pore structure. Mixes with higher percentages of FA Type F (e.g., 15% and 20%) exhibit higher resistivity values than the control mix.
Figure 8b illustrates the relationship between electrical resistivity and compressive strength for mixtures containing FA Type F across different curing periods. At 7 and 14 days, a slight inverse trend is observed as resistivity tends to decrease as strength increases. This may be attributed to early-age mixtures achieving higher strength despite still having relatively interconnected pores, which facilitate ionic movement and result in lower resistivity. Conversely, at 28 days, this trend reverses, with higher resistivity corresponding to greater strength, likely reflecting ongoing pozzolanic activity that refines the pore structure and enhances both strength and durability. The subtle shifts in trend lines across curing ages highlight that electrical resistivity does not always correlate directly with compressive strength, especially at early stages [31]. These findings suggest that the influence of FA Type F on strength and durability is both time- and dosage-dependent, with delayed pozzolanic reactions becoming more prominent at later curing stages.
FA Type F improves resistivity when replacing sand by refining the pore structure, making concrete more durable and resistant to moisture and chloride penetration. However, strength does not always increase with resistivity—there is a complex relationship between the two, especially at different curing stages. Higher FA content leads to better durability (higher resistivity) but may slightly reduce early-age strength before long-term pozzolanic reactions contribute to strength gain.

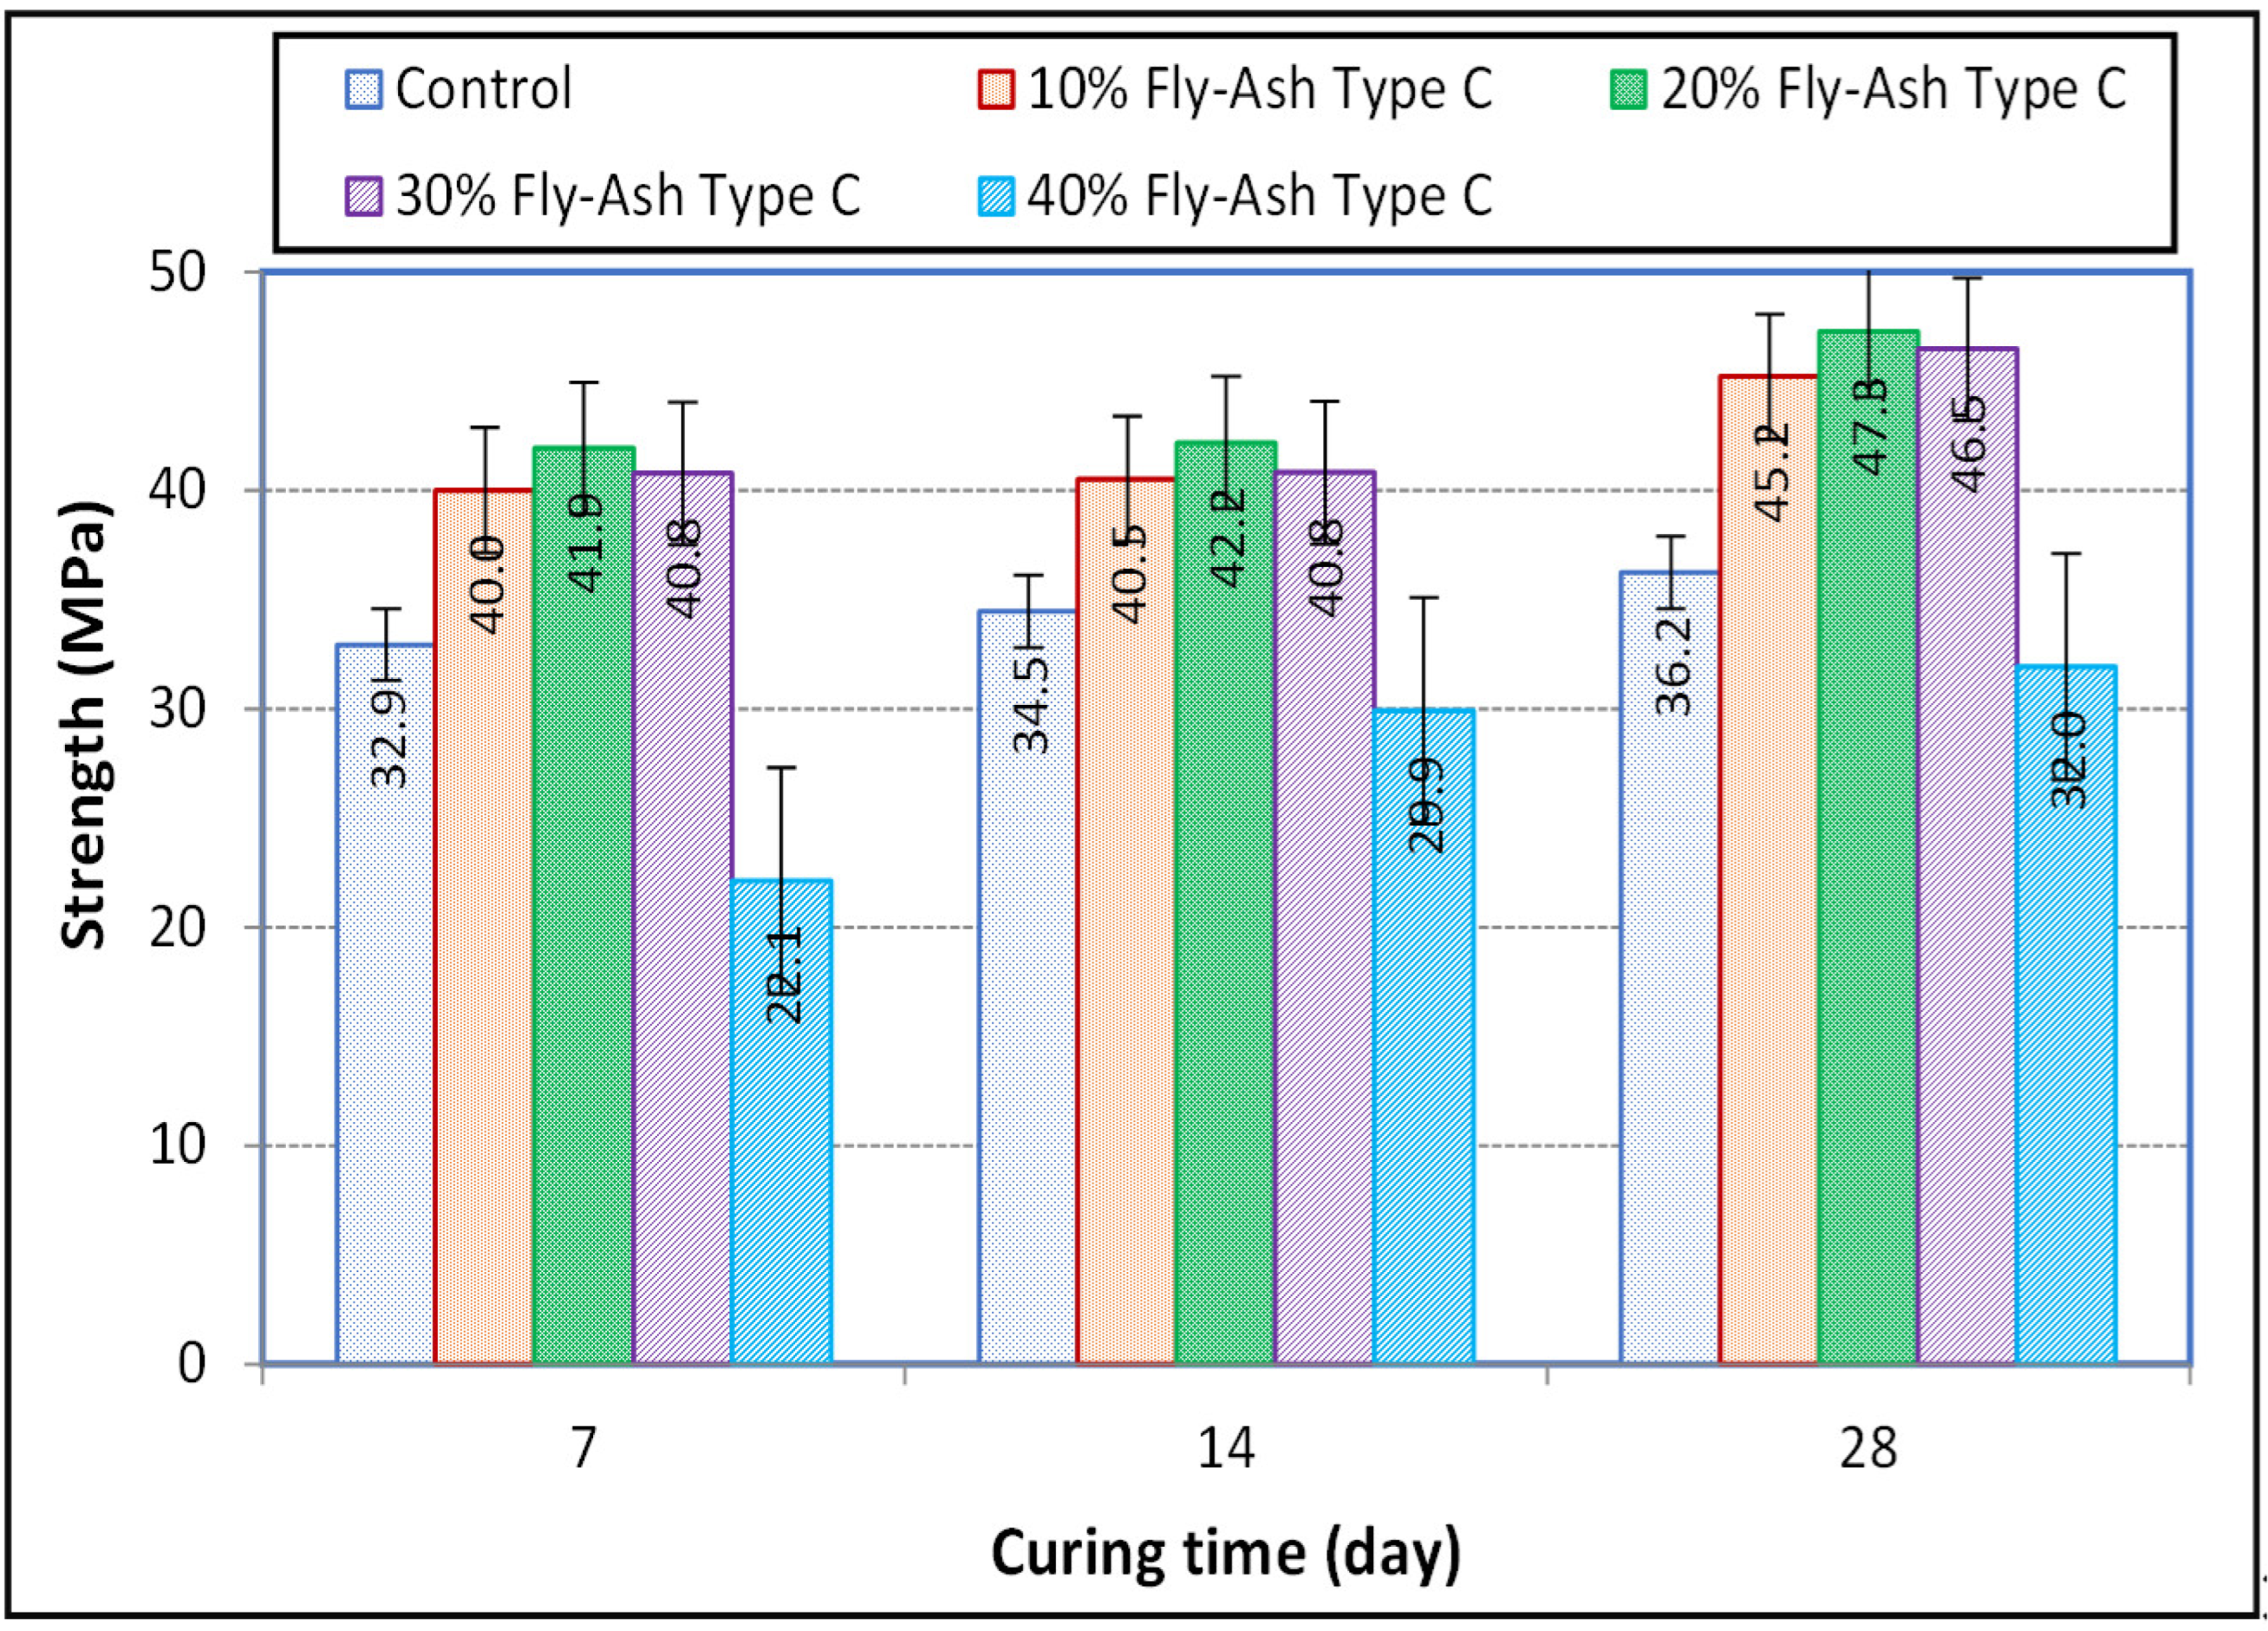
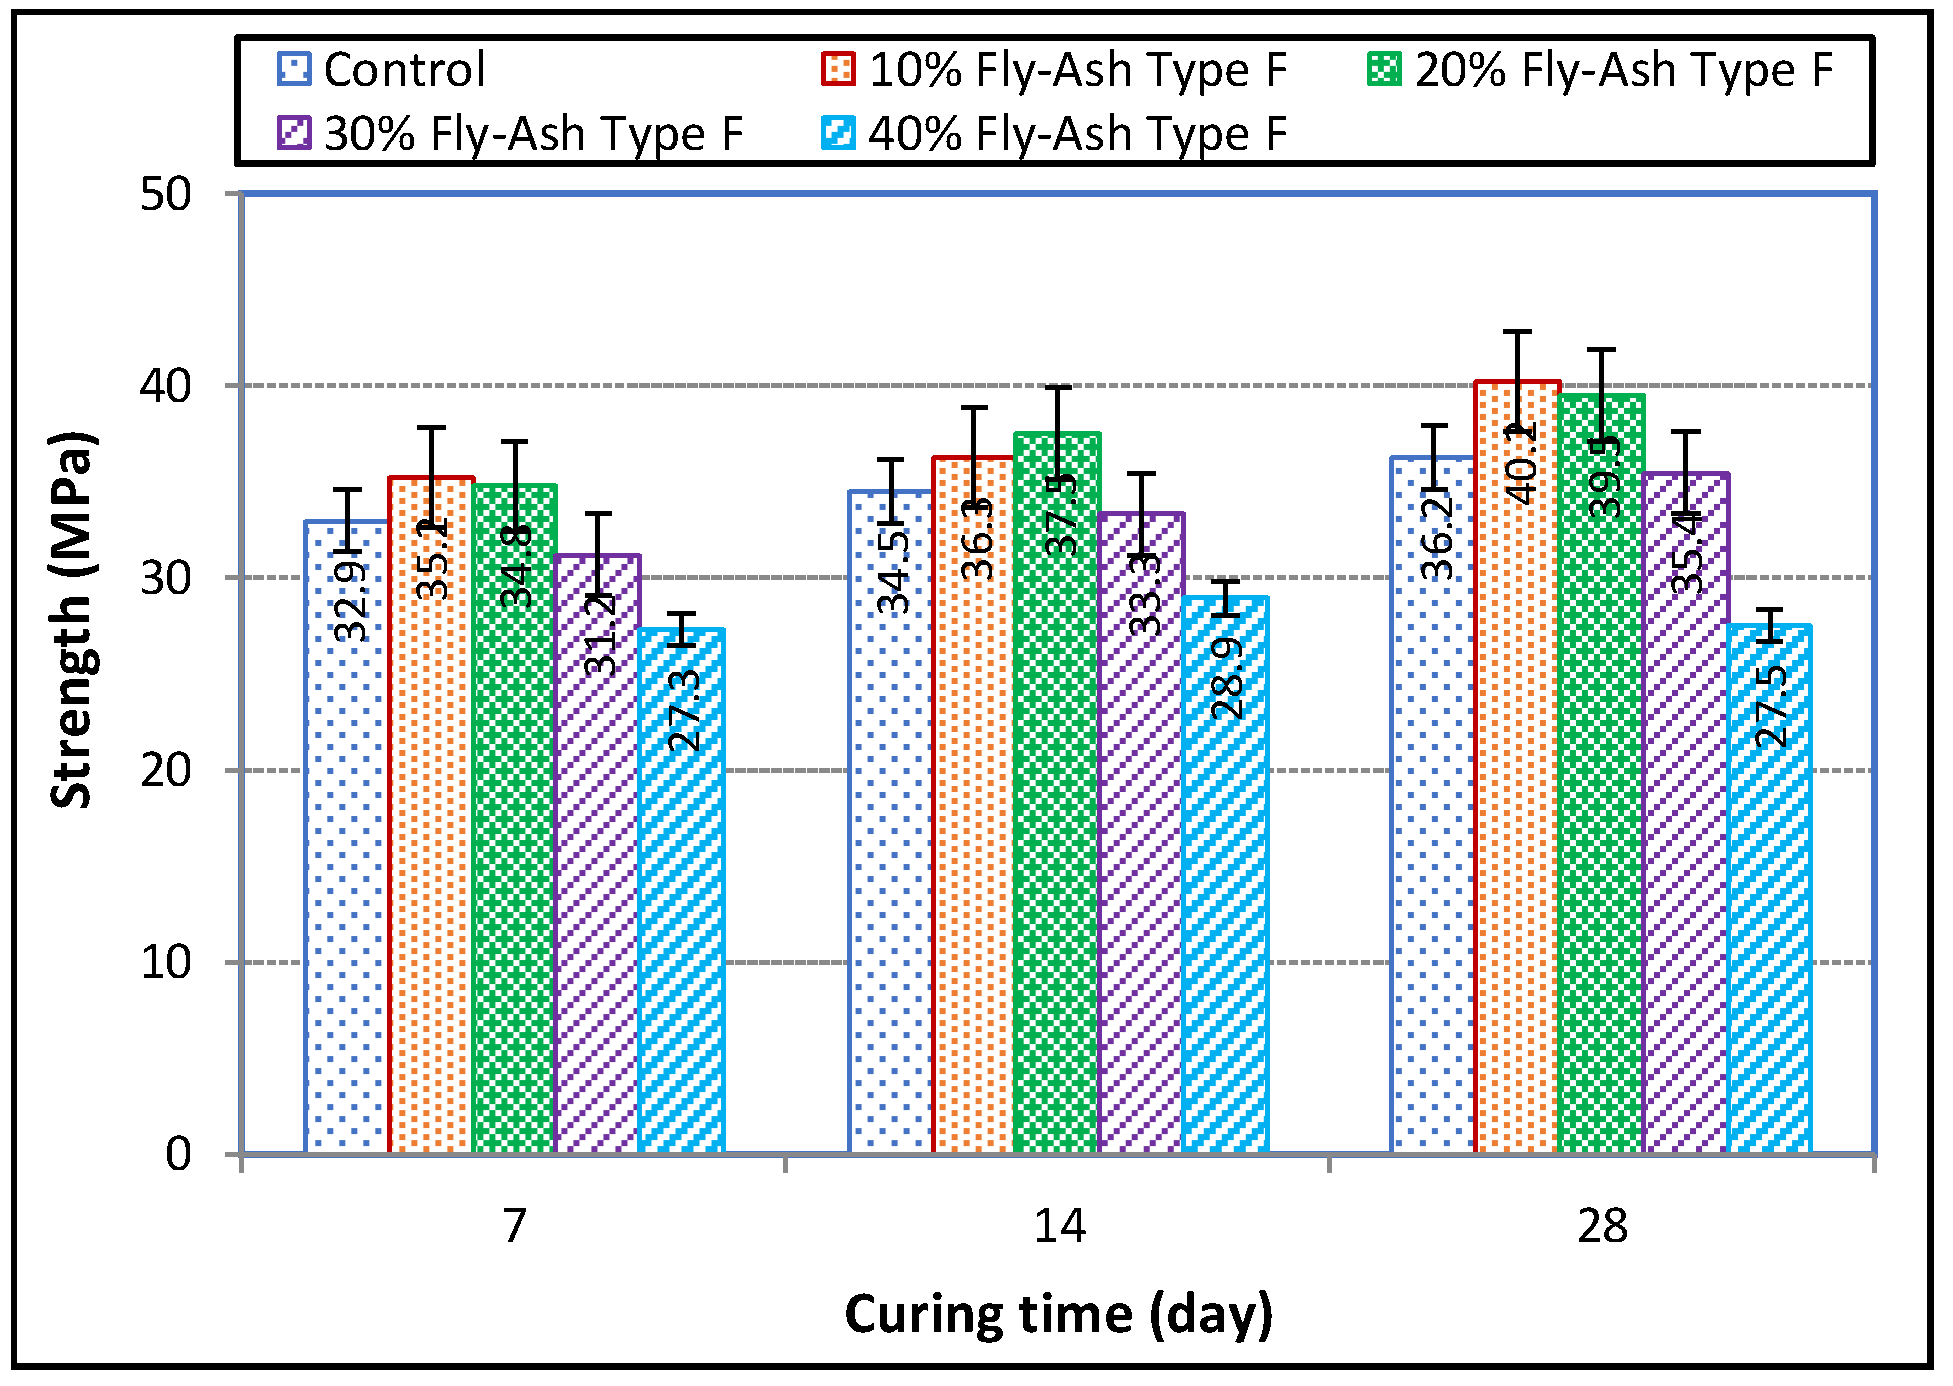
3.2.2. Cement Replacement

Figure 9 illustrates the influence of FA Type C when replacing cement in the PCC on the compressive strength of concrete over different curing times. For all mixes, strength improves from 7 to 28 days, indicating continued hydration and pozzolanic activity of fly ash. The rate of strength gain varies depending on the FA content. Mixes with 10% and 20% FA Type C show higher strength than the control mix at all curing ages. This suggests that a moderate FA replacement improves strength due to its pozzolanic reaction, which enhances the concrete’s microstructure. The pozzolanic behavior in blended cements significantly contributes to improvements in both strength and durability by reacting with calcium hydroxide to form additional calcium silicate hydrate (C–S–H) gel, which densifies the microstructure and enhances mechanical properties [32]. This reaction not only increases the compressive strength compared to plain Portland cement, but also improves durability by reducing porosity and permeability, leading to longer service life under aggressive environments [33]. Furthermore, the incorporation of pozzolanic materials reduces the clinker content and associated CO2 emissions, aligning with sustainability goals [34]. X-ray diffraction (XRD) analysis is a well-recognized technique used to demonstrate pozzolanic activity by identifying the reduction in portlandite (Ca(OH)2) peaks and the formation of new crystalline and amorphous phases such as C–S–H gel in blended cements [35]. Studies have shown that blended cements containing pozzolanic additions, such as basalt powder, exhibit decreased intensity of Ca(OH)2 peaks after hydration, indicating consumption by pozzolanic reaction, alongside the appearance or increase in C–S–H and other mineral phases [36]. Similarly, infrared spectroscopy complements these findings by detecting characteristic bands related to calcium hydroxide and C–S–H gel shifts, confirming the pozzolanic addition optimal for FA content for strength falls into a range of 10–20%. Concrete mixes with 30% and 40% FA Type C exhibit lower strength compared to lower replacement cases, especially at early ages. This is likely due to slower hydration and dilution effects from the replacement of cement with fly ash.
Figure 9 shows a peak strength around 20% FA Type C, indicating that moderate FA replacement enhances strength. Beyond this point (>20% fly ash C), strength starts to decline. At 7 days, the strength is significantly lower for higher FA content (30–40%), confirming that early-age strength development is slower due to delayed pozzolanic reactions. The polynomial equation for 7-day strength has a steeper curve, indicating greater sensitivity to FA content. At 28 days, strength still follows the same trend, but decreases more gradually for higher fly ash percentages. This suggests that while high FA content negatively impacts early-age strength, long-term curing mitigates some of these effects. Across all curing periods, the peak strength occurs around 20% FA Type C, confirming that this is the optimal replacement level for strength enhancement when replacing cement.
Overall, moderate FA Type C (10–20%) improves strength, as seen in both figures. Excessive FA (>20%) reduces strength, especially at early ages, due to delayed hydration. Curing time helps mitigate strength loss, but high FA content remains suboptimal even at 28 days.
Figure 10 presents the compressive strength (MPa) at different curing times (7, 14, and 28 days) for concrete mixes with varying percentages of FA Type F (10%, 20%, 30%, and 40%), alongside a control mixture, while an attempt has been made to replace the cement. As seen in Figure 11a, all mixes show a progressive increase in strength from 7 to 28 days, as expected due to continued hydration and pozzolanic activity. The 30% and 40% FA Type F mixes show lower strength than the control mix, especially at early ages. This is likely due to delayed hydration reactions and a reduced cementitious material content, slowing early strength gain. The 10% and 20% FA Type F mixes exhibit higher or comparable strength to the control mix at all curing ages. This suggests that a moderate FA replacement enhances strength development by improving the concrete microstructure. So, the optimal FA content is 10–20% for strength.
Figure 10 also shows the relationship between FA Type F content (%) and strength (MPa) at different curing ages. Strength peaks around 20%, indicating that moderate FA replacement improves strength. Beyond this point (>20% FA Type F), strength begins to decline. At 7 days, strength is significantly lower for high FA content (30–40%), confirming that early hydration is slower with increased fly ash replacement. At 28 days, the overall trend remains the same, but the strength values improve, showing that FA Type F contributes to long-term strength gain. However, strength still declines at higher fly ash percentages (>20%), emphasizing the negative impact of excessive replacement. Across all curing times, optimal strength occurs around 20% FA Type F, confirming that this percentage provides the best balance between strength gain and pozzolanic benefits.
Overall, moderate FA Type F (10–20%) improves strength, as seen in both graphs (Figure 10). Excessive FA Type F (>20%) reduces strength, especially at early ages, due to slower hydration. Curing time enhances strength, but high FA content remains suboptimal even at 28 days. Therefore, optimal strength occurs around 20% FA Type F for cement replacement.
Based on the comparative analysis (Table 4), FA Type C is better for early strength and higher durability (resistivity), making it ideal for fast-track construction and precast elements. FA Type F is better for long-term strength gain and improving workability, making it suitable for marine structures and high-performance concrete.
Figure 11 analyzes the influence of FA Type C on resistivity and strength in concrete. Figure 11a tracks resistivity over curing time, while Figure 11b investigates the relationship between strength and resistivity. As shown in Figure 11a, the control mix shows an increase in resistivity over time, indicating the development of a denser microstructure due to hydration. All FA mixes show lower resistivity than the control mix at all curing ages. This suggests that FA Type C reduces electrical resistivity, possibly due to its impact on pore structure and conductivity. The 30% and 40% FA Type C mixes have the lowest resistivity values, suggesting that excessive replacement increases the connectivity of pores and slows down hydration, leading to higher conductivity. Some mixes (especially the control) show slightly higher resistivity at 14 days than at 28 days, indicating a temporary reduction in pore connectivity before later-age reactions affect conductivity.
The trend lines (Figure 11b) indicate a weak positive correlation—as strength increases, resistivity also slightly increases. However, the correlation is not strong, meaning resistivity alone is not a direct indicator of strength. At 7 days, most data points are in the lower resistivity range, which aligns with incomplete hydration and a more porous structure. The 7-day trend line (dotted blue) has the lowest slope, reinforcing that early-age hydration plays a role in electrical properties. The 28-day mix (solid gray line) generally has higher strength and resistivity, confirming that continued hydration and pozzolanic activity densify the microstructure. Increased FA Type C content results in lower resistivity (as seen in Figure 12b), particularly at higher replacement levels. However, strength does not decrease as significantly with moderate fly ash additions, suggesting that a balance between resistivity and strength can be achieved with optimal replacement levels.
FA Type C reduces resistivity, especially at high replacement levels, likely due to increased pore connectivity. Strength and resistivity have a weak positive correlation, suggesting that other factors (e.g., hydration, pore structure) influence both properties. Moderate FA Type C (10–20%) maintains strength while reducing resistivity, making it the optimal range for durability.
The bar chart (Figure 12a) presents resistivity (kohm-cm) at different curing times (7, 14, and 28 days) for concrete mixes containing different FA Type F replacement levels (10%, 20%, 30%, and 40%), along with a control mix. The control mix consistently exhibits the highest resistivity, confirming a denser microstructure due to ongoing hydration reactions. All FA mixes demonstrate lower resistivity compared to the control mix at all curing ages. This suggests FA Type F increases electrical conductivity, which is likely due to its impact on pore structure and hydration kinetics. The 30% and 40% FA Type F mixes have the lowest resistivity values, meaning that at high replacement levels, the material becomes more conductive due to a potentially more connected pore structure. The control mix shows higher resistivity at 14 days than at 28 days, which might indicate a temporary reduction in pore connectivity before later-age reactions influence the microstructure.
The scatter plot (Figure 12b) analyzes the relationship between compressive strength (MPa) and resistivity (kohm-cm) at 7, 14, and 28 days, with trend lines for each curing period. Unlike FA Type C, fly ash Type F shows a slightly negative correlation—as strength increases, resistivity decreases. This suggests that fly ash Type F’s role in modifying pore structure might lead to higher strength but lower electrical resistivity. At 7 days, most data points are in the lower strength range with low resistivity, indicating incomplete hydration and a more porous structure. The 7-day trend line (dotted blue) is nearly flat, meaning resistivity does not change significantly with strength at early ages. The 28-day mix (solid gray line) shows a downward trend, confirming that as the concrete strengthens, its resistivity drops. This aligns with the expectation that FA Type F refines the pore structure, leading to stronger but more conductive (lower resistivity) concrete.
Overall, FA Type F reduces resistivity, with higher replacement levels leading to lower resistivity. There is a weak negative correlation between strength and resistivity, suggesting that FA Type F enhances strength but increases conductivity. Moderate FA Type F (10–20%) provides a good balance between strength and resistivity, making it an optimal choice for durability.

4. Conclusions, Recommendations, and Future Research

Incorporating fly ash as a partial replacement for both cement and fine aggregates in Portland cement concrete mixes offers significant environmental, economic, and performance benefits. Optimizing fly ash content in concrete requires careful consideration of mixed proportions, material properties, and curing conditions. While there are challenges in terms of variability and curing time, the overall advantages of using fly ash, such as enhanced durability, sustainability, and reduced material costs, make it a viable alternative to traditional concrete mix designs.
From this study, the potential benefits of replacing the fine aggregate and cement with FA (Types C and F) within concrete mixes include the reduction in FA destined for landfills and the cost savings for fresh raw materials. With regards to the specific FA produced in the USA and used in this study, several conclusions and recommendations can be made. However, there are few questions, such as what happens if several types of FA are mixed together and used to replace fine aggregate and cement. To answer this question, a further study might be focused on the combinations of FA used to replace fine aggregate and cement within the same mix.

4.1. Conclusions

High workability and moderate resistivity were obvious for all percentage FA contents for both types of FA; except for FA Type F replacing fine aggregate, 40% FA Type F content replacing cement did not provide meaningful strength that was at least equal to or greater than that of the control. As a result, this study does not recommend including FA Type F more than 30% in concrete mixes as cement replacements. The optimum FA Type C and Type F appeared to be 10% for sand replacement. The optimum FA Type C appeared to be 10–20% and Type F appeared to be 20% for cement replacement.
In case of fine aggregate replacement, FA Type C provides both early and 28-day strength. In case of cement replacement, FA Type C provides early strength and Type F provides long-term strength. Type C is better for durability and Type F is better for workability. Based on the study, no reasonable and acceptable empirical correlation between surface resistivity and strength can be established as supported by another study [19] on several other recycled waste materials.

4.2. Recommendations and Future Research

Due to the varying chemical compositions of the waste materials generated in different areas, these study results may not be used blindly, and more rigorous and comprehensive investigations on the performance of FA as well as the combinations of different types of FA to be used to replace sand and cement in the same mix are needed in future research.

Author Contributions

Conceptualization, M.A.K. and Y.S.; methodology, M.A.K. and Y.S.; formal analysis, M.A.K. and Y.S.; investigation, M.A.K., Y.S., I.A. and S.S.; resources, M.A.K. and Y.S.; data curation, I.A. and S.S.; writing—original draft preparation, M.A.K.; writing—review and editing, M.A.K. and Y.S.; visualization, M.A.K., Y.S., I.A. and S.S.; supervision, M.A.K. and Y.S.; project administration, M.A.K. and Y.S.; funding acquisition, M.A.K. and Y.S. All authors have read and agreed to the published version of the manuscript.

Funding

This research was partially funded (only materials) by KSU Office of Undergraduate Research (OUR) under the program undergraduate research and creative activity (URCA).

Institutional Review Board Statement

Not applicable.

Informed Consent Statement

Not applicable.

Data Availability Statement

The data presented in this study are available upon request.

Acknowledgments

The authors acknowledge the funding from the Office of Undergraduate Research of Kennesaw State University for this study.

Conflicts of Interest

The authors declare no conflict of interest.

References

  1. ACAA American Coal Ash Association (ACAA). 2016 Production and Use Survey Results News Release. Available online: https://acaa-usa.org/publications/production-use-reports/ (accessed on 28 May 2018).
  2. Al-Sharif, M.M.; Attom, F.M. A geoenvironmental application of burned wastewater sludge ash in soil stabilization. Environ. Earth Sci. 2014, 17, 2453–2463. [Google Scholar] [CrossRef]
  3. Mahvash, S.; López-Querol, S.; Bahadori-Jahromi, A. Effect of class F fly-ash on fine sand compaction through soil stabilization. Struct. Eng. Civ. Eng. 2007, 3, e00274. [Google Scholar] [CrossRef] [PubMed]
  4. Yadav, A.K.; Gaurav, K.; Kishor, R.; Suman, S.K. Stabilization of alluvial soil for subgrade using rice husk ash, sugarcane bagasse ash and cow dung ash for rural roads. Int. J. Pavement Res. Technol. 2016, 10, 254–261. [Google Scholar] [CrossRef]
  5. White, D.J.; Harrington, D.S.; Thomas, Z. Fly-Ash Soil Stabilization for Non-Uniform Subgrade Soil. Volume I: Engineering Properties and Construction Guidelines; IHRB Project TR-461, FHWA Project 4; Iowa Highway Research Board: Ames, IA, USA, 2005.
  6. Li, H.; Zhang, L. Fly ash as a fine aggregate replacement in concrete. Cem. Concr. Compos. 2016, 71, 38–47. [Google Scholar]
  7. Gupta, S.; Rani, P.; Sharma, P. Use of fly ash for the development of sustainable construction materials. In New Materials in Civil Engineering; Butterworth-Heinemann: Oxford, UK, 2020; pp. 677–689. [Google Scholar] [CrossRef]
  8. Siddique, R. Effect of fly ash on the properties of concrete. Constr. Build. Mater. 2015, 87, 103–107. [Google Scholar]
  9. Zhang, S. Application of fly ash in concrete: A review. J. Build. Mater. 2017, 15, 91–99. [Google Scholar]
  10. Rashid, M.M.; Aslam, M.M.; Zaman, M. Fly ash as a sustainable alternative material in concrete mixes: A review. J. Sustain. Dev. 2016, 9, 140–151. [Google Scholar]
  11. Kumar, R.; Kaur, H.; Bansal, P. Effect of fly ash on concrete properties. Int. J. Civ. Eng. 2018, 8, 125–132. [Google Scholar]
  12. Padhy, P.K.; Mishra, P.K. Fly ash utilization for sustainable construction: A review. J. Clean. Prod. 2021, 319, 128679. [Google Scholar]
  13. Fauzi, A.; Nuruddin, M.F.; Malkawi, A.B.; Abdullah, M.M.A.B. Study of fly ash characterization as a cementitious material. Procedia Eng. 2016, 148, 487–493. [Google Scholar] [CrossRef]
  14. Souliman, M.I.; Abd El-Hakim, R.; Davis, M.; Gc, H.; Walubita, L. Mechanistic and Economic Impacts of Using Asphalt Rubber Mixtures at Various Vehicle Speeds. Adv. Civ. Eng. Mater. 2018, 7, 347–359. [Google Scholar] [CrossRef]
  15. Karim, M.A.; Corazzini, B. The current status of MSW disposal and energy production: A brief review of waste incineration. MOJ Ecol. Environ. Sci. 2019, 4, 34–37. [Google Scholar] [CrossRef]
  16. Georgia Power’s Plant Bowen Environmental Management System. Available online: http://www.georgiapower.com/company/research-conservation-and-stewardship/management-closures/plant-list/plant-bowen.html (accessed on 21 September 2020).
  17. Karim, M.A.; Hassan, A.S.; Kaplan, A. Optimization of Soil to Fly-Ash Mix Ratio for Enhanced Engineering Properties of Clayey Sand for Subgrade Use. Appl. Sci. 2020, 10, 7038. [Google Scholar] [CrossRef]
  18. Hemalatha, T.; Ramaswamy, A. A review on fly ash characteristics—Towards promoting high volume utilization in developing sustainable concrete. J. Clean. Prod. 2017, 147, 546–559. [Google Scholar] [CrossRef]
  19. Karim, M.A.; Seo, Y.; Vargas, B.; Rosales, K.; Parrar, C.; Henry, M.; Yun, A. Optimum Use of Recycled Waste Materials as Partial Replacement of Fine Aggregate in Portland Cement Concrete Mixes. J. Waste Manag. Recycl. Technol. 2024, 2, 1–7. [Google Scholar] [CrossRef]
  20. Lübeck, A.; Gastaldini, A.L.G.; Barin, D.S.; Siqueira, H.C. Compressive strength and electrical properties of concrete with white Portland cement and blast-furnace slag. Cem. Concr. Compos. 2012, 34, 392–399. [Google Scholar] [CrossRef]
  21. Chen, C.-T.; Chang, J.-J.; Yeih, W. The effects of specimen parameters on the resistivity of concrete. Constr. Build. Mater. 2014, 71, 35–43. [Google Scholar] [CrossRef]
  22. de Bem, D.H.; Lima, D.P.B.; Medeiros-Junior, R.A. Effect of chemical admixtures on concrete’s electrical resistivity. Int. J. Build. Pathol. Adapt. 2018, 36, 174–187. [Google Scholar] [CrossRef]
  23. Mendes, S.E.; Oliveira, R.L.; Cremonez, C.; Pereira, E.; Pereira, E.; Medeiros-Junior, R.A. Electrical resistivity as a durability parameter for concrete design: Experimental data versus estimation by mathematical model. Constr. Build. Mater. 2018, 192, 610–620. [Google Scholar] [CrossRef]
  24. Medeiros-Junior, R.A.; Lima, M.G. Electrical resistivity of unsaturated concrete using different types of cement. Constr. Build. Mater. 2016, 107, 11–16. [Google Scholar] [CrossRef]
  25. Araujo, C.C.; Meira, G.R. Correlation between concrete strength properties and surface electrical resistivity. Rev. IBRACON Struct. Mater. J. 2022, 15, e15103. [Google Scholar] [CrossRef]
  26. ASTM C143; Standard Test Method for Slump of Hydraulic-Cement Concrete. ASTM International: West Conshohocken, PA, USA, 2015. [CrossRef]
  27. ASTM C1611; Standard Test Method for Slump Flow of Self-Consolidating Concrete. ASTM International: West Conshohocken, PA, USA, 2021. [CrossRef]
  28. ASTM C1202; Standard Test Method for Electrical Indication of Concrete’s Ability to Resist Chloride Ion Penetration. ASTM International: West Conshohocken, PA, USA, 2022. [CrossRef]
  29. ASTM C666; Standard Test Method for Resistance of Concrete to Rapid Freezing and Thawing. ASTM International: West Conshohocken, PA, USA, 2017. [CrossRef]
  30. ASTM C1012; Standard Test Method for Length Change of Hydraulic-Cement Mortars Exposed to a Sulfate Solution. ASTM International: West Conshohocken, PA, USA, 2024. [CrossRef]
  31. Seo, Y.; Kim, J.H. Synergistic Impact of Entrained Air and Fly Ash on Chloride Ingress in Concrete Pavement: An Electrical Resistivity Model Approach. Buildings 2025, 15, 1215. [Google Scholar] [CrossRef]
  32. Menéndez, E.; Sanjuán, M.; García-Roves, R.; Argiz, C.; Recino, H. Durability of Blended Cements Made with Reactive Aggregates. Materials 2021, 14, 2948. [Google Scholar] [CrossRef] [PubMed]
  33. Bediako, M.; Adjaottor, A.A.; Gawu, S.K.Y.; Amankwah, E.O. Compressive strength and durability properties of pozzolan obtained from co-fired clay and rice husk. Cogent Eng. 2020, 7, 1811453. [Google Scholar] [CrossRef]
  34. Sanjuán, M.Á.; Andrade, C.; Mora, P.; Zaragoza, A. Carbon Dioxide Uptake by Cement-Based Materials: A Spanish Case Study. Appl. Sci. 2020, 10, 339. [Google Scholar] [CrossRef]
  35. Abo Hashem, I.A.; Gaber, G.A.; Ahmed, A.S.I.; Gha, N.A.A. Assessment of blended cement containing waste basalt powder: Physicomechanical and electrochemical impedance spectroscopy investigations. Discov. Appl. Sci. 2024, 6, 380. [Google Scholar] [CrossRef]
  36. Moropoulou, A.; Bakolas, A.; Anagnostopoulou, S. Composite materials in ancient structures. Cement. Concr. Compos. 2005, 27, 295–300. [Google Scholar] [CrossRef]
Figure 1. Particle size distribution of FA Type C, FA Type F, and fine aggregate (sand).
Civileng 06 00033 g001
Figure 2. Flowchart for the experimental program for fine aggregate replacement.
Civileng 06 00033 g002
Figure 3. Flowchart for the experimental program for cement replacement.
Civileng 06 00033 g003
Figure 4. Workability of PCC mixed with FA.
Civileng 06 00033 g004
Figure 5. Compressive strength of PCC mixed with FA Type C for fine aggregate replacement.
Civileng 06 00033 g005
Figure 6. Compressive strength of PCC mixed with FA Type F for fine aggregate replacement.
Civileng 06 00033 g006
Figure 7. Concrete resistivity of samples mixed with FA Type C for fine aggregate replacement (a) Curing time vs. Resistivity (b) Strength vs. Resistivity.
Civileng 06 00033 g007
Figure 8. Concrete resistivity of samples mixed with FA Type F for fine aggregate replacement (a) Curing time vs. Resistivity (b) Strength vs. Resistivity.
Civileng 06 00033 g008
Figure 9. Compressive strength of PCC mixed with FA Type C for cement replacement.
Civileng 06 00033 g009
Figure 10. Compressive strength of PCC mixed with FA Type F for cement replacement.
Civileng 06 00033 g010
Figure 11. Concrete resistivity of samples mixed with FA Type C for cement replacement (a) Curing time vs. Resistivity (b) Strength vs. Resistivity.
Civileng 06 00033 g011
Figure 12. Concrete resistivity of samples mixed with FA Type F for cement replacement (a) Curing time vs. Resistivity (b) Strength vs. Resistivity.
Civileng 06 00033 g012
Table 1. Percent range of element oxides present in “Type C” and “Type F” fly ash [18].
ElementOxideConcentration (%)
Type CType F
Calcium (Ca)CaO15.1–54.80.50–14.0
Silicon (Si)SiO211.8–46.437.0–62.1
Aluminum (Al)Al2O32.6–20.516.6–35.6
Iron (Fe)Fe2O31.4–15.62.6–21.2
Magnesium (Mg)MgO0.1–6.70.3–5.2
Potassium (K)K2O0.3–9.30.1–4.1
Sodium (Na)Na2O0.2–2.80.1–3.6
Sulfur (S)SO31.4–12.90.02–4.7
Phosphorus (P)P2O50.2–0.40.1–1.7
Carbon (C)TiO20.6–1.00.5–2.6
Manganese (Mn)MnO0.03–0.20.03–0.1
Table 2. Concrete mixture design for control batch.
Ingredient Target
Cement (Type I/II) 448.52 kg/m3 (28.0 lb/ft3)
Fine aggregate (#810) 744.86 kg/m3 (46.5 lb/ft3)
Coarse aggregate (#57) 983.54 kg/m3 (61.4 lb/ft3)
Water 201.83 kg/m3 (12.6 lb/ft3)
Strength (28-day) 20.68 MPa (3000 psi)
Table 3. Summary table showing which FA Type is better in fine aggregate replacement.
Criteria FA Type C FA Type F
Early strength (7-day) Civileng 06 00033 i001 Higher Civileng 06 00033 i002 Lower
Long-term strength (28-day) Civileng 06 00033 i003 Higher Civileng 06 00033 i004 Slightly lower
Best FA percentage 10% 10%
Performance at high FA (>10%) Civileng 06 00033 i005 Holds strength better Civileng 06 00033 i006 Drops more
Pozzolanic reactivity Civileng 06 00033 i007 Faster Civileng 06 00033 i008 Slower
Best use cases Where early strength is needed (e.g., precast concrete, rapid construction). Where long-term durability is prioritized (e.g., mass concrete, sulfate-resistant structures).
Table 4. Summary table showing which FA Type is better in cement replacement.
Criteria FA Type C FA Type F Better Option
Strength development High early strength due to higher calcium content Moderate initial strength, but improves with curing Type C (early strength), Type F (Long-Term Strength)
Resistivity (durability indicator) Higher resistivity (better durability) Lower resistivity (more conductive) Type C (better for durability)
Optimal replacement (%) 20–30% for best performance 10–20% for balanced strength and durability Type C (more effective at higher dosages)
Pozzolanic activity Faster reaction, and contributes to early strength Slower reaction, and enhances long-term strength Type C (faster reaction), Type F (long-term gain)
Workability Similar workability but may need more water Improves workability, and reduces water demand Type F (better workability)
Best use cases Pavements, precast elements, applications and needing early strength High-performance concrete, marine environments, long-term strength applications Depends on application
Disclaimer/Publisher’s Note: The statements, opinions and data contained in all publications are solely those of the individual author(s) and contributor(s) and not of MDPI and/or the editor(s). MDPI and/or the editor(s) disclaim responsibility for any injury to people or property resulting from any ideas, methods, instructions or products referred to in the content.

