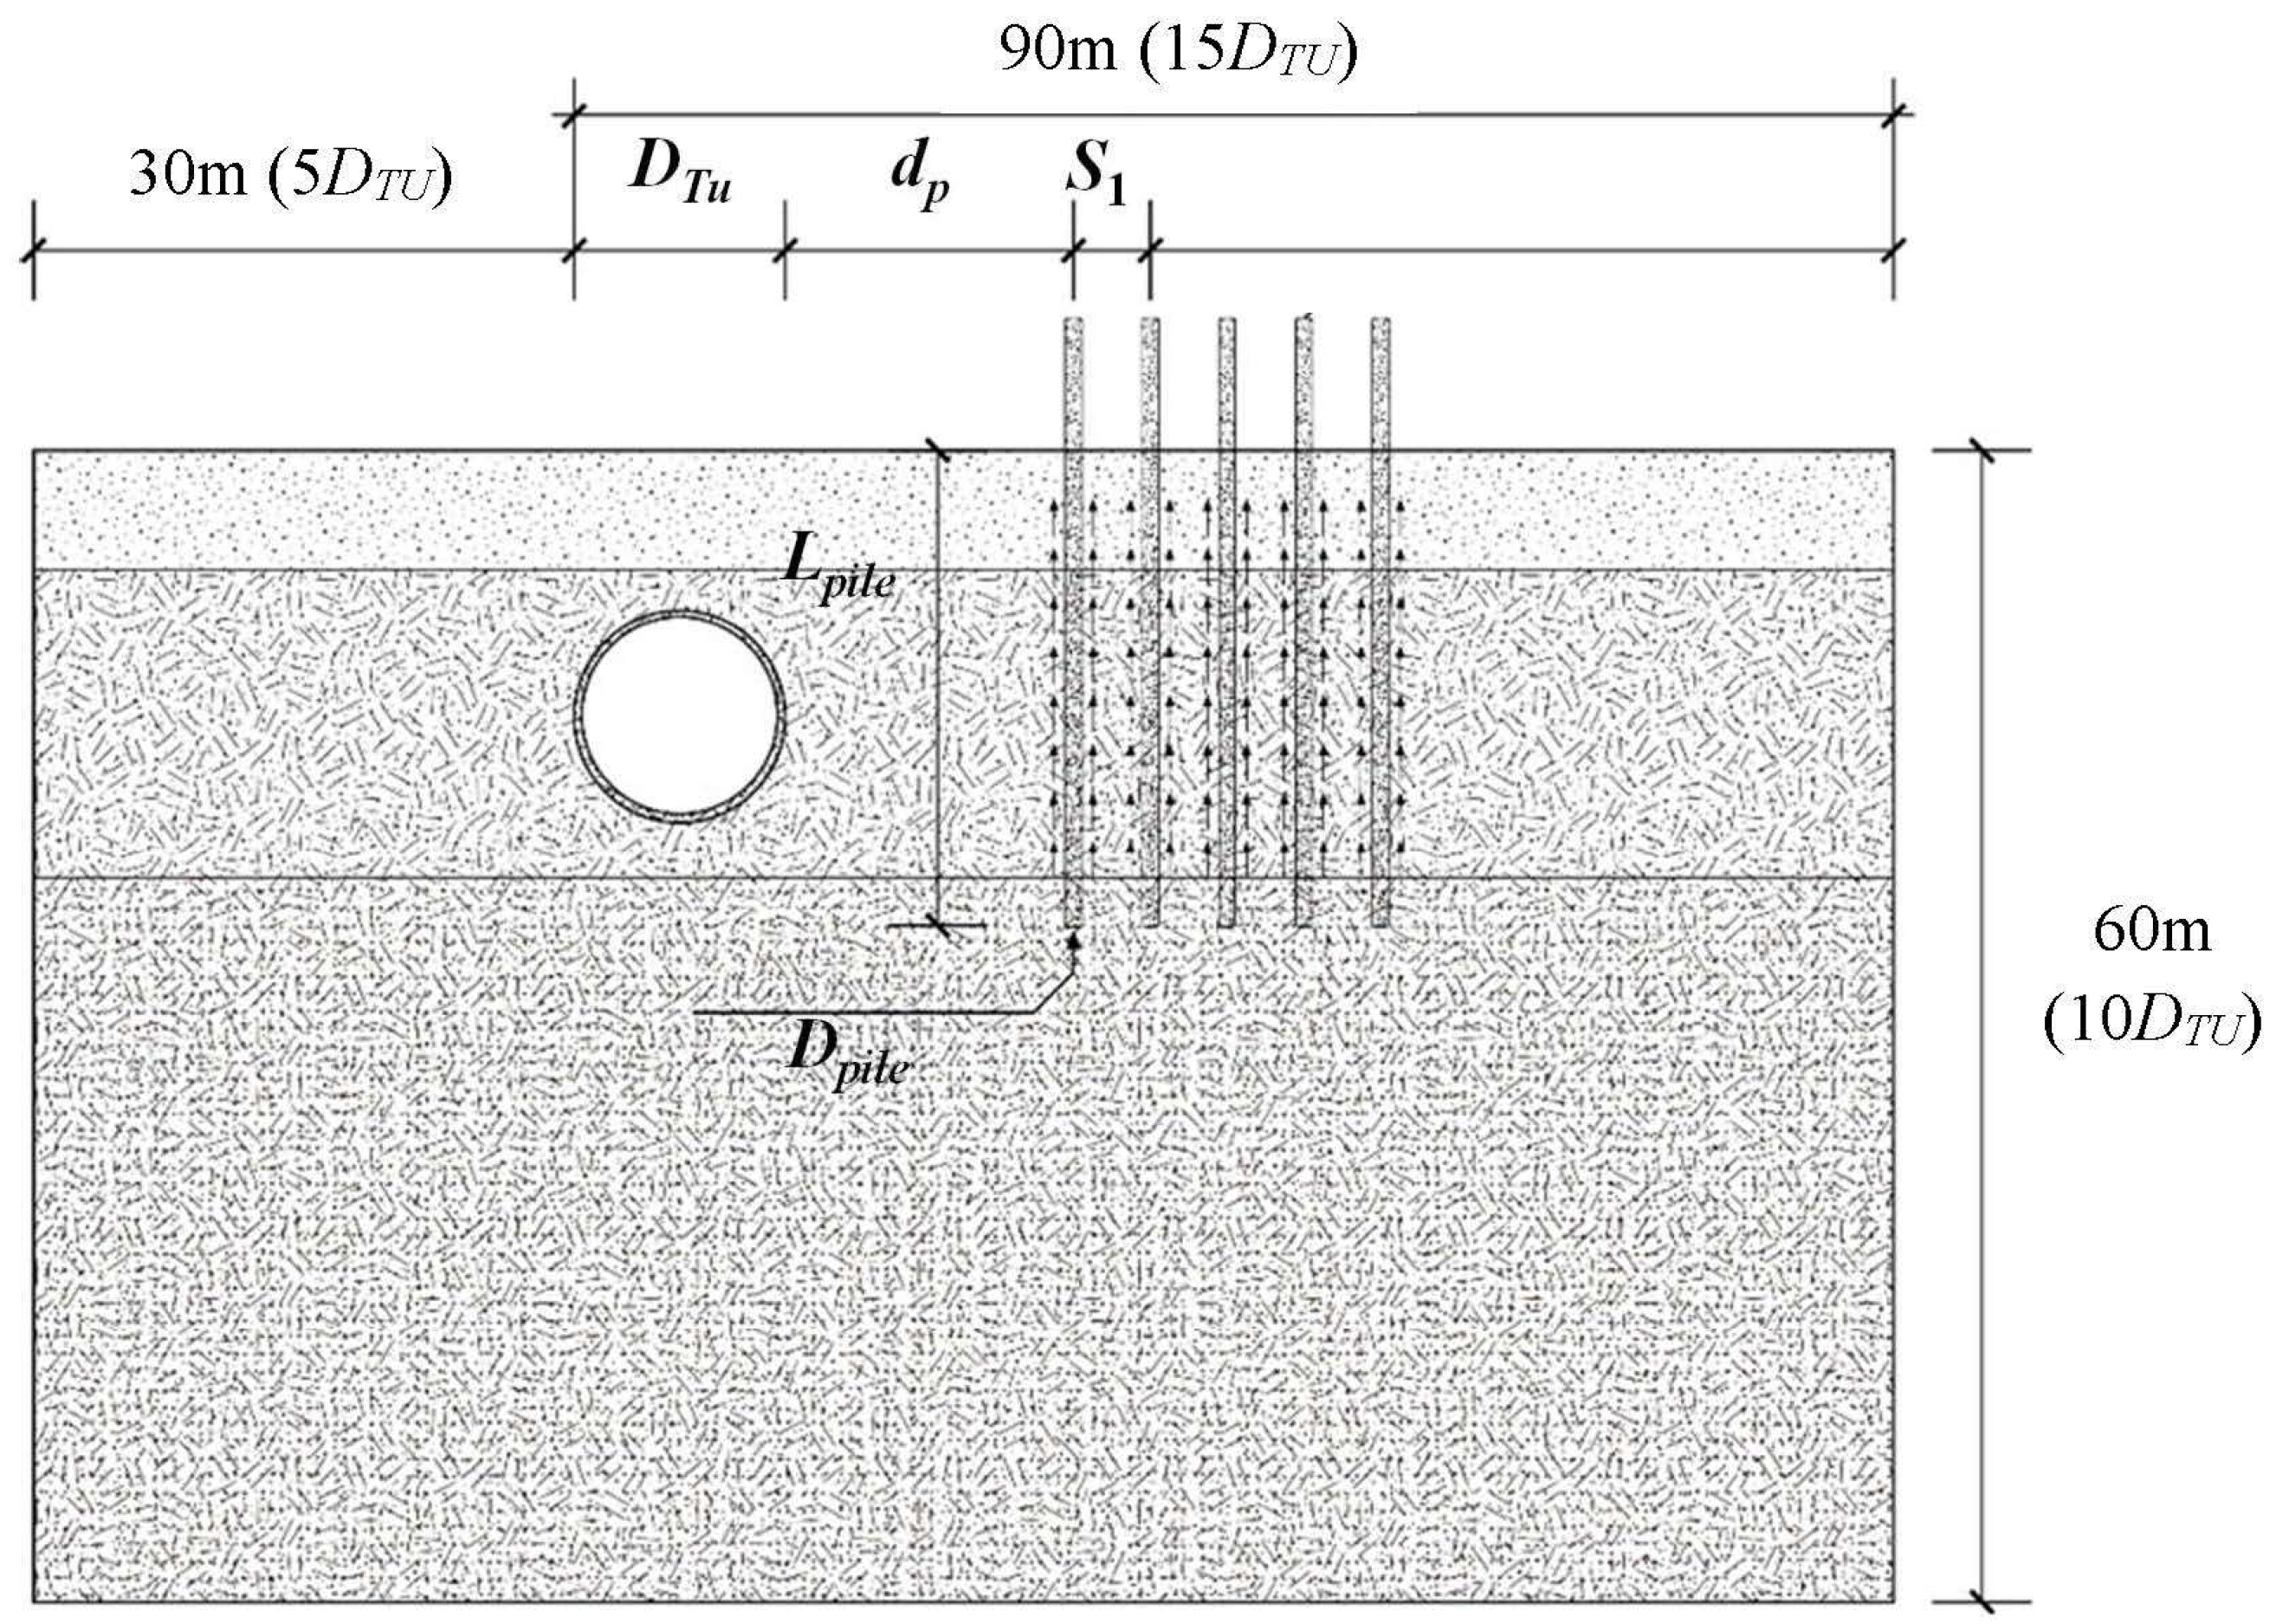
Figure 1.
Schematic diagram of geometric parameters of pile–tunnel interaction. DTu, the outer diameter of the subway tunnel; dp, net distance; S1, transverse pile spacing; Dpile, pile diameter; Lpile, pile length.
Figure 1.
Schematic diagram of geometric parameters of pile–tunnel interaction. DTu, the outer diameter of the subway tunnel; dp, net distance; S1, transverse pile spacing; Dpile, pile diameter; Lpile, pile length.
Figure 2.
Schematic diagram of the geometric parameters of the pit–tunnel interaction. HTu, subway tunnel burial depth; dFP, net distance; HFP, depth of foundation pit; BFP, pit width.
Figure 2.
Schematic diagram of the geometric parameters of the pit–tunnel interaction. HTu, subway tunnel burial depth; dFP, net distance; HFP, depth of foundation pit; BFP, pit width.
Figure 3.
Schematic diagram of the geometric parameters of the shallow foundation–tunnel interaction. HTu, Subway tunnel burial depth; dSF, Shallow foundation–subway tunnel clearance; qSF, Shallow foundation load; LSF,2, Shallow base lateral distribution range.
Figure 3.
Schematic diagram of the geometric parameters of the shallow foundation–tunnel interaction. HTu, Subway tunnel burial depth; dSF, Shallow foundation–subway tunnel clearance; qSF, Shallow foundation load; LSF,2, Shallow base lateral distribution range.
Figure 4.
Effect of the number of group pile rows on the overall settlement of group pile foundation.
Figure 4.
Effect of the number of group pile rows on the overall settlement of group pile foundation.
Figure 5.
Effect of group pile rows on underpass tunnels.
Figure 5.
Effect of group pile rows on underpass tunnels.
Figure 6.
Effect of the number of group pile rows on the maximum settlement displacement
of the underpass tunnel [
22,
23].
Figure 6.
Effect of the number of group pile rows on the maximum settlement displacement
of the underpass tunnel [
22,
23].
Figure 7.
Schematic diagram of the horizontal and vertical arrangement of the pile foundation plan.
Figure 7.
Schematic diagram of the horizontal and vertical arrangement of the pile foundation plan.
Figure 8.
Effect of Lpile/Dpile on the overall settlement of group pile foundation.
Figure 8.
Effect of Lpile/Dpile on the overall settlement of group pile foundation.
Figure 9.
Schematic diagram of the value of the displacement field decay function ψ(r).
Figure 9.
Schematic diagram of the value of the displacement field decay function ψ(r).
Figure 10.
Schematic diagram of the law of
—
[
12,
24].
Figure 10.
Schematic diagram of the law of
—
[
12,
24].
Figure 11.
The impact of on subway tunnels.
Figure 11.
The impact of on subway tunnels.
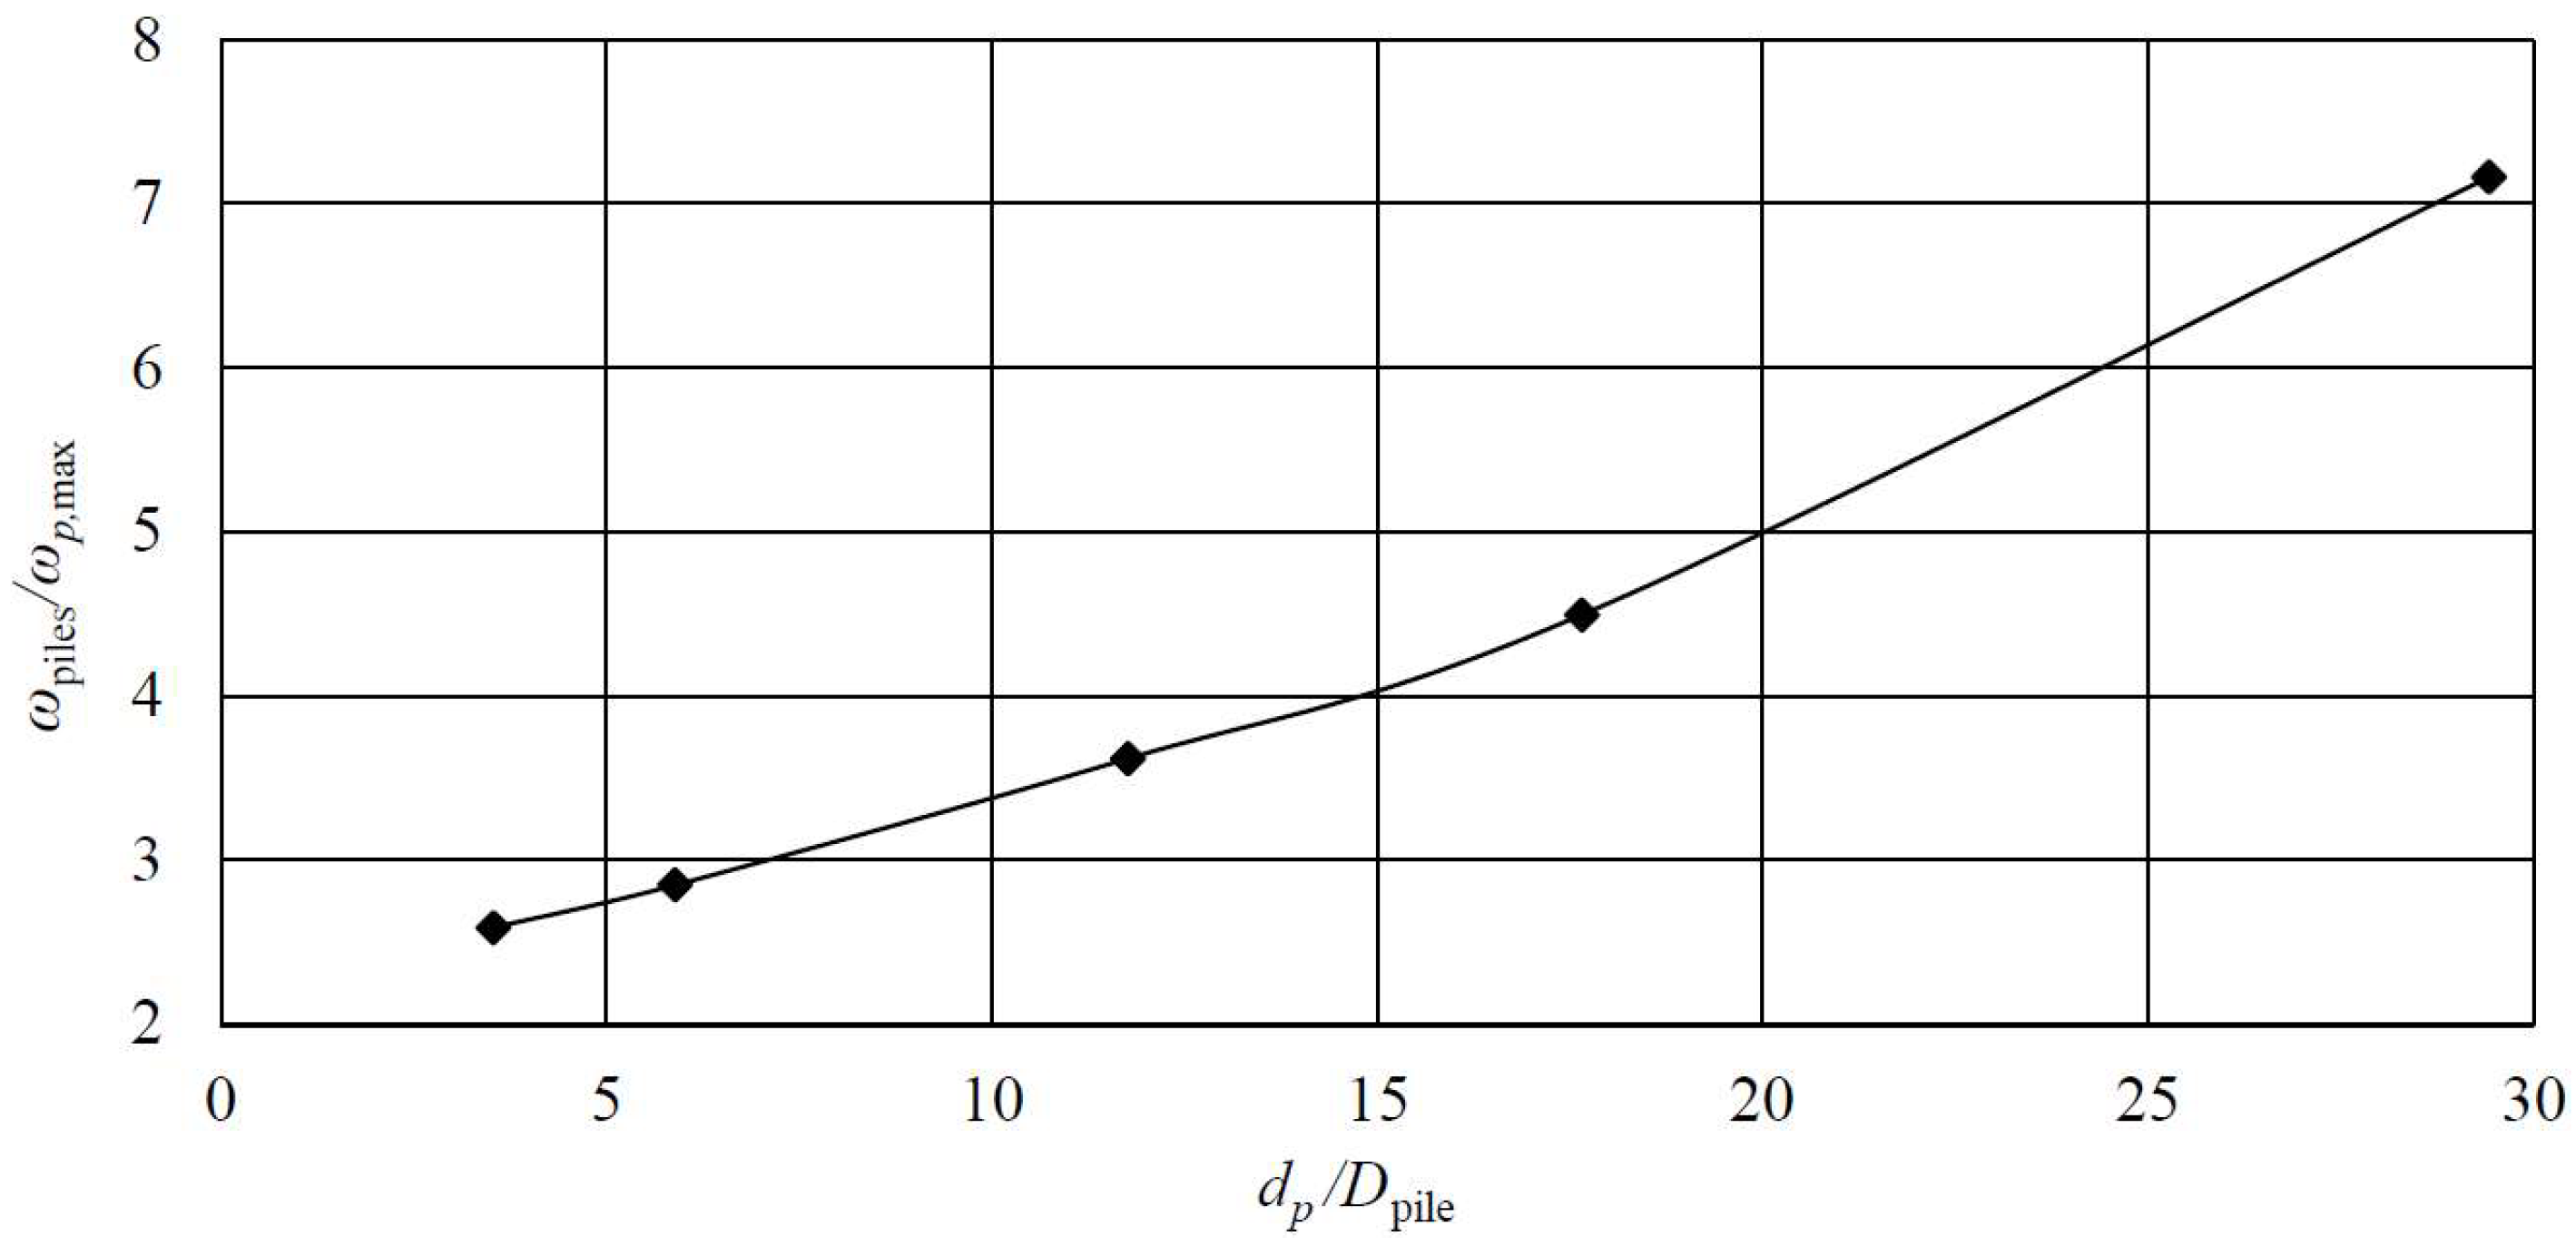
Figure 12.
The influence of
dp/D
pile on the settlement displacement of a subway tunnel [
12,
22,
24,
26].
Figure 12.
The influence of
dp/D
pile on the settlement displacement of a subway tunnel [
12,
22,
24,
26].
Figure 13.
relationship curve.
Figure 13.
relationship curve.
Figure 14.
Deflection distribution of infinitely long elastic foundation beam under local uniform load.
Figure 14.
Deflection distribution of infinitely long elastic foundation beam under local uniform load.
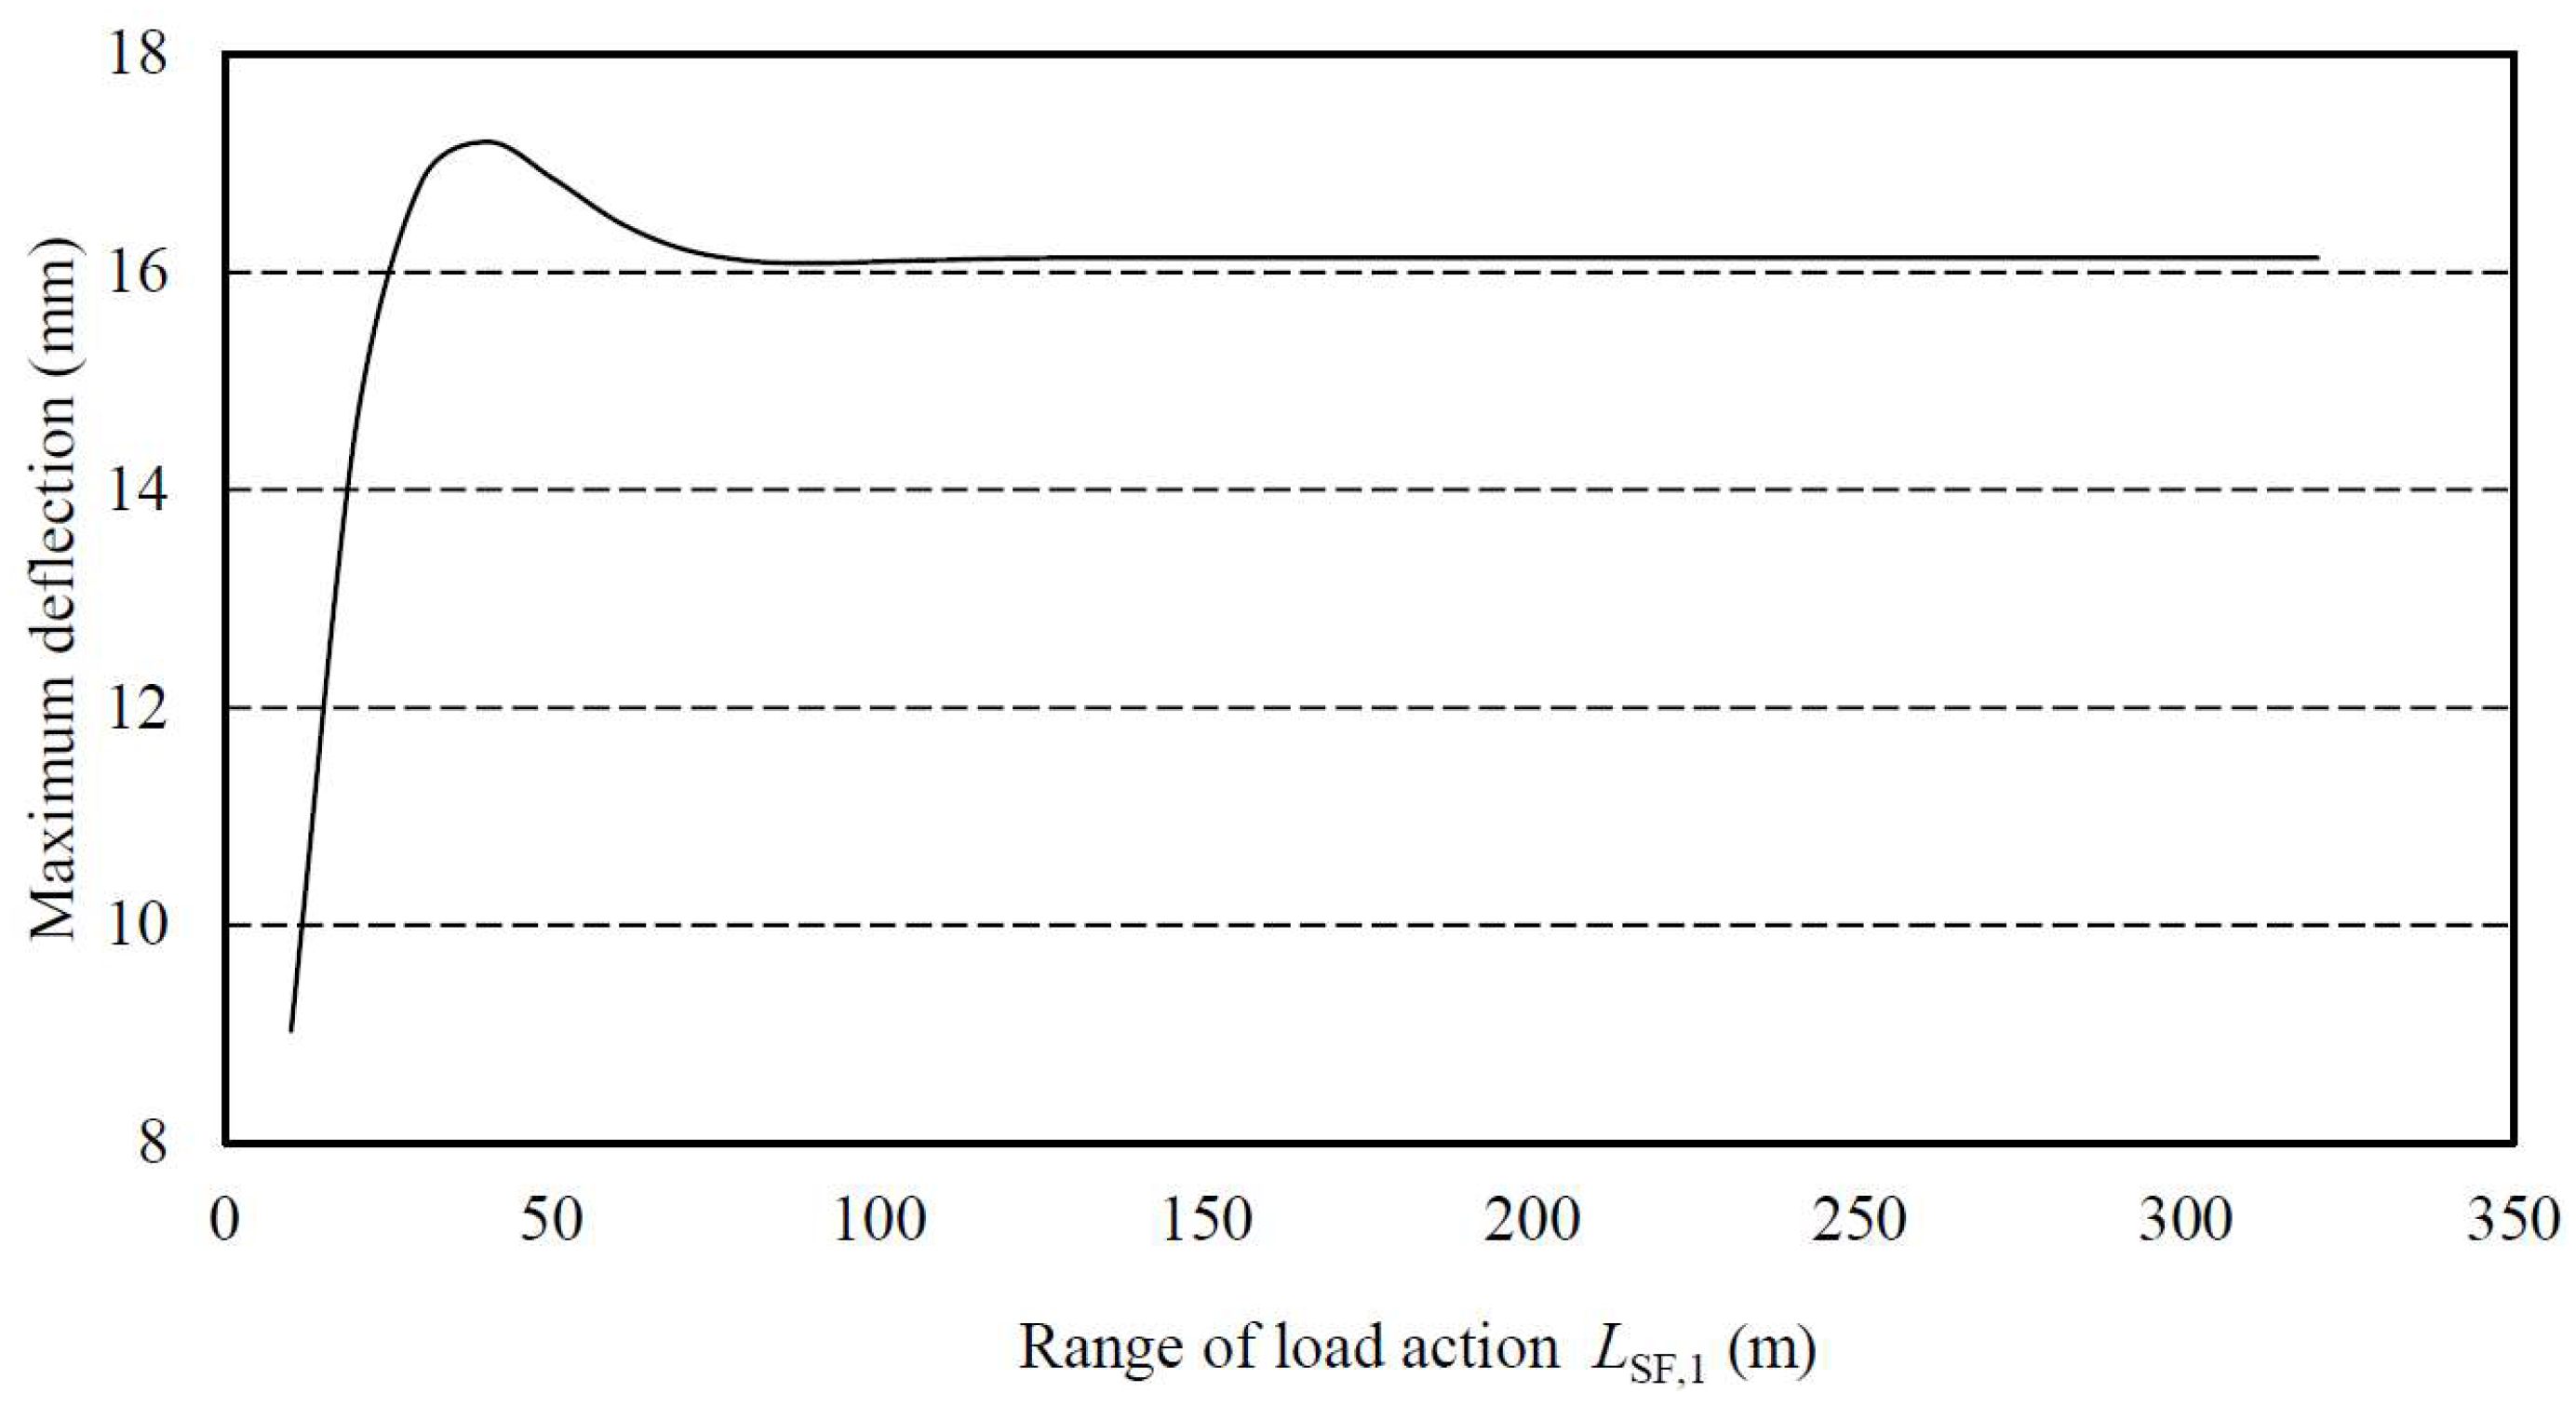
Figure 15.
Variation in the maximum deflection of the underpass tunnel under different load action.
Figure 15.
Variation in the maximum deflection of the underpass tunnel under different load action.
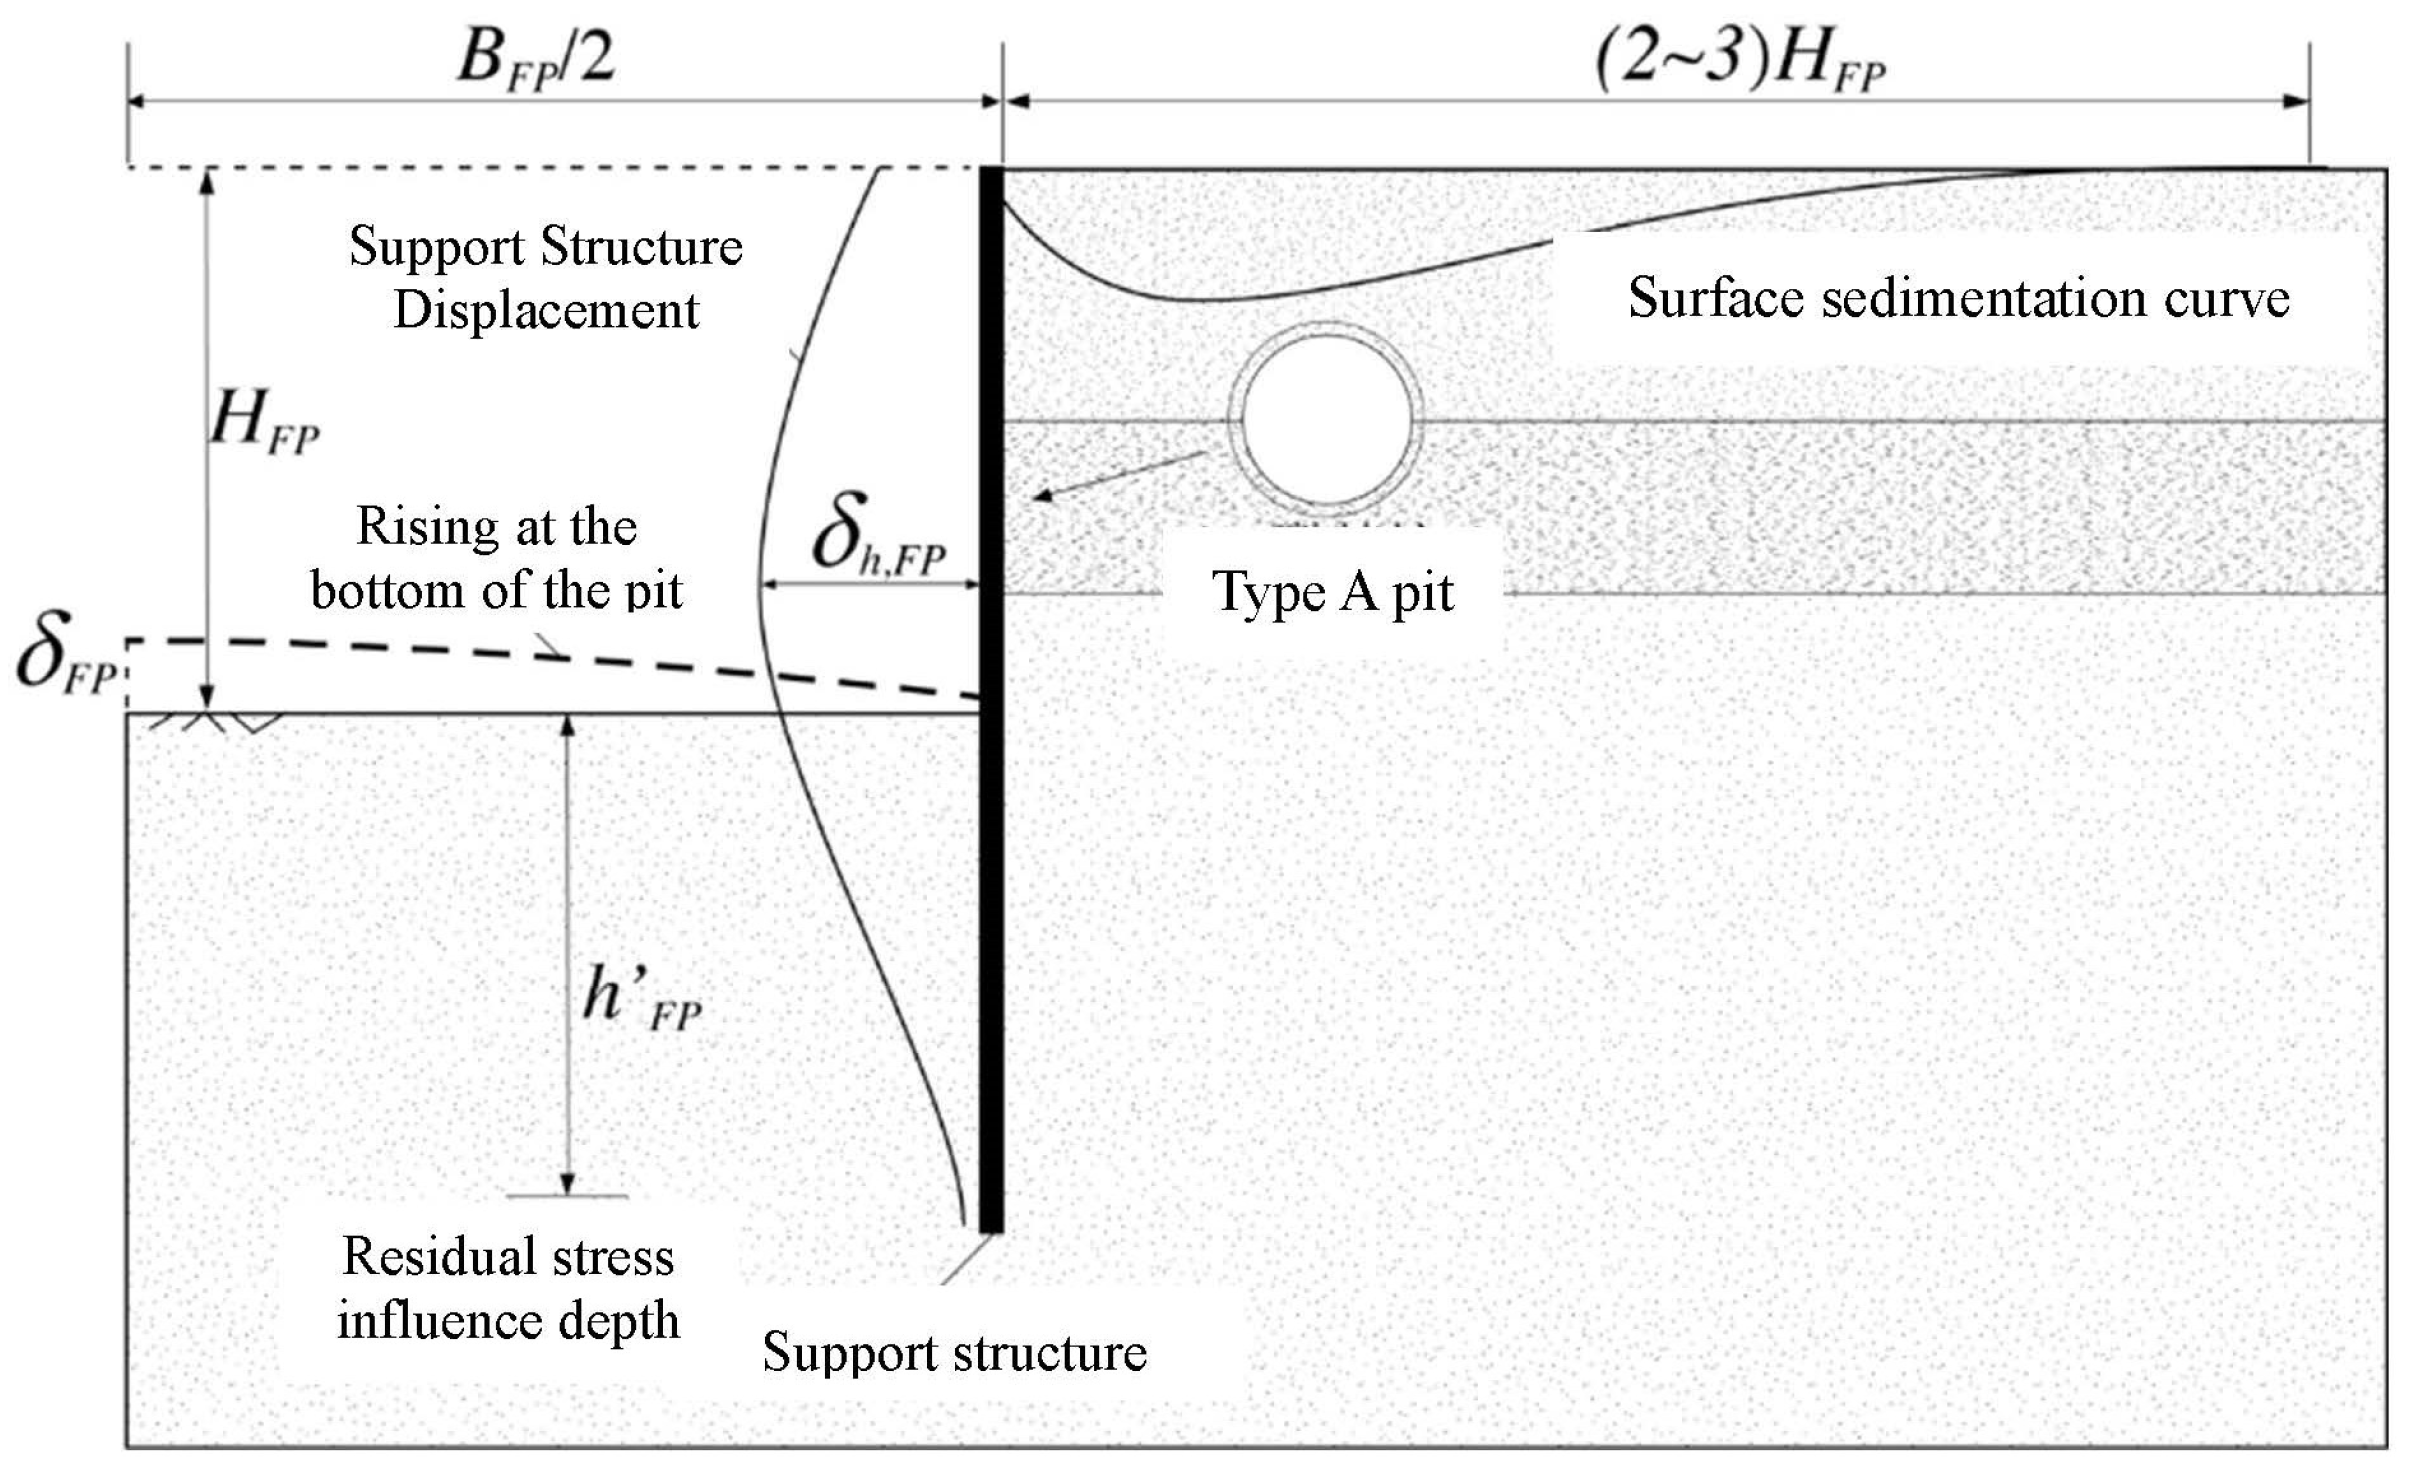
Figure 16.
Schematic diagram of the depth of residual stress influence. BFP, pit width; HFP, excavation depth; h’FP, residual stress influence depth; δFP, soil uplift at the bottom of the foundation pit; δh,FP, the maximum lateral displacement of the pit enclosure.
Figure 16.
Schematic diagram of the depth of residual stress influence. BFP, pit width; HFP, excavation depth; h’FP, residual stress influence depth; δFP, soil uplift at the bottom of the foundation pit; δh,FP, the maximum lateral displacement of the pit enclosure.
Figure 17.
Influence of pit–subway tunnel clear distance () on tunnel vertical displacement ().
Figure 17.
Influence of pit–subway tunnel clear distance () on tunnel vertical displacement ().
Figure 18.
Influence of pit–subway tunnel clear distance () on tunnel horizontal displacement ().
Figure 18.
Influence of pit–subway tunnel clear distance () on tunnel horizontal displacement ().
Figure 19.
Effect of pit–metro tunnel clear distance () on tunnel vertical displacement ().
Figure 19.
Effect of pit–metro tunnel clear distance () on tunnel vertical displacement ().
Figure 20.
Effect of pit–metro tunnel clear distance () on tunnel horizontal displacement ().
Figure 20.
Effect of pit–metro tunnel clear distance () on tunnel horizontal displacement ().
Figure 21.
Fitted graph of pit width and underpass tunnel vertical displacement correction [
46,
47].
Figure 21.
Fitted graph of pit width and underpass tunnel vertical displacement correction [
46,
47].
Figure 22.
Uplift displacement of pit bottom under different excavation depths.
Figure 22.
Uplift displacement of pit bottom under different excavation depths.
Figure 23.
Schematic diagram of type A pit. BFP, pit width; HFP, excavation depth; h’FP, residual stress influence depth; δFP, soil uplift at the bottom of the foundation pit; δh,FP, the maximum lateral displacement of the pit enclosure.
Figure 23.
Schematic diagram of type A pit. BFP, pit width; HFP, excavation depth; h’FP, residual stress influence depth; δFP, soil uplift at the bottom of the foundation pit; δh,FP, the maximum lateral displacement of the pit enclosure.
Figure 24.
Schematic diagram of type U pit. BFP, pit width; HFP, excavation depth; h’FP, residual stress influence depth; δFP, soil uplift at the bottom of the foundation pit; δh,FP, the maximum lateral displacement of the pit enclosure.
Figure 24.
Schematic diagram of type U pit. BFP, pit width; HFP, excavation depth; h’FP, residual stress influence depth; δFP, soil uplift at the bottom of the foundation pit; δh,FP, the maximum lateral displacement of the pit enclosure.
Table 1.
Scope of protected areas for rail transit in selected cities in China.
Table 1.
Scope of protected areas for rail transit in selected cities in China.
| Cities, Implementation Time | Scope of Protected Areas (m) | Special Scope of Protected Areas (m) |
|---|
| (1) | (2) | (3) | (4) | (1) | (2) | (3) | (4) |
|---|
| Nanjing, 2009; Suzhou, 2011; Fuzhou, 2013; Qingdao, 2015; Dongguan, 2016; Chengdu, 2017; Shijiazhuang, 2017; Guiyang, 2018; Jinan, 2019; Xiamen, 2019; Xuzhou, 2019 | 50 | 30 | 10 | 100 | 5 | 3 | 5 | 50 |
| Nanning, 2016; Lanzhou, 2017; Wenzhou, 2019 | 50 | 30 | 10 | 100 | 5 | 5 | 5 | 50 |
| Zhengzhou, 2016; Urumqi, 2018 | 50 | 30 | 10 | 100 | 10 | 5 | 5 | 50 |
| Wuxi, 2014; Luoyang, 2020 | 50 | 30 | 10 | 100 | 10 | 10 | 5 | 50 |
| Xi’an, 2011 | 50 | 30 | 10 | 100 | 10 | 5 | 3 | 20 |
| Foshan, 2010; Hangzhou, 2012 | 50 | 30 | 10 | 100 | 5 | 3 | 3 | -- |
| Kunming, 2011 | 50 | 30 | 10 | 100 | 5 | 3 | 5 | -- |
| Shaoxing, 2021 | 50 | 30 | 10 | 100 | 5 | 3 | -- | -- |
| Shanghai, 2002; Guangzhou, 2008; Ningbo, 2012; Harbin, 2013; Beijing, 2015; Changchun, 2015 | 50 | 30 | 10 | 100 | -- | -- | -- | -- |
| Wuhan, 2012; Changsha, 2013; Nanchang, 2016 | 50 | 30 | 10 | 150 | -- | -- | -- | -- |
| Chongqing, 2011; Shenyang, 2018 | 50 | 30 | 10 | 200 | -- | -- | -- | -- |
| Tianjin, 2006; Shenzhen, 2015; Dalian, 2015; Huhhot, 2021 | 50 | 30 | 10 | -- | -- | -- | -- | -- |
| Hefei, 2017 | 50 | 30 | -- | -- | 15 | 15 | 10 | -- |
Table 2.
Numerical analysis of stratigraphic parameter indicators.
Table 2.
Numerical analysis of stratigraphic parameter indicators.
| Geological Layer | Soil Capacity Above Water Level (kN·m−3) | Soil Capacity Below Water Level
(kN·m−3) | Permeability Coefficient (m·day−1) | Poisson’s Ratio | Elastic Modulus (kPa) | Cohesive Forces (kPa) | Angle of Internal Friction (°) | Angle of Dilation (°) | Interface Strength Reduction Factor |
|---|
| Mixed fill | 16.0 | 18.0 | 0.29376 | 0.35 | 8000 | 8 | 10.0 | 0.8 | rigid |
| Powdered soil | 14.4 | 18.4 | 0.3752 | 0.31 | 19,000 | 13 | 23.5 | 0.8 | rigid |
| Plastic clay | 14.2 | 18.5 | 0.003456 | 0.35 | 16,000 | 26 | 18.6 | 0 | 0.7 |
| Hard plastic clay | 15.5 | 19.2 | 0.001210 | 0.28 | 35,000 | 62 | 21 | 0 | rigid |
Table 3.
List of pile foundation engineering model parameters.
Table 3.
List of pile foundation engineering model parameters.
| Unchanged Parameters | Variable Parameters |
|---|
| Pile Diameter Dpile | Group Pile Length-to-Width Ratio Lc/Bc | Number of Group Pile Rows | Pile Length | Transverse Pile Spacing S1 | Longitudinal Pile Spacing S2 | Net Distance dp |
|---|
| 1 m | 1 | 1~5 rows | 30~80 Dpile | 3~7 Dpile | 3~7 Dpile | 3~20 m |
Table 4.
Numerical analysis of material parameters index.
Table 4.
Numerical analysis of material parameters index.
| Parameter Name | Lining | Pile Foot | Buildings | Diaphragm Walls |
|---|
| Material type | Elastic | Elastic | Elastic | Elastic |
| Axial stiffness (kN·m−1) | 1.40 × 10⁷ | 2.00 × 10⁶ | 1.00 × 10¹⁰ | 7.5 × 10⁶ |
| Flexural stiffness (kN·m) | 1.43 × 10⁵ | 8.00 × 10³ | 1.00 × 10¹⁰ | 1.0 × 10⁶ |
| Equivalent thickness (m) | 0.35 | 0.219 | 3.464 | 1.265 |
| Capacity (kN·m−2) | 8.4 | 2 | 25 | 10.0 |
| Poisson’s ratio | 0.15 | 0.2 | 0 | 0.0 |
Table 5.
Material properties of lateral supports (anchor rods).
Table 5.
Material properties of lateral supports (anchor rods).
| Parameter Name | Lateral Supports |
|---|
| Material type | Elastic |
| Axial stiffness (kN) | 2.0 × 10⁶ |
| Support spacing (m) | 5.0 |
| Fmax,comp (kN) | 2.0 × 10¹⁵ |
| Fmax,tens (kN) | 1.0 × 10¹⁵ |
Table 6.
List of model parameters of foundation pit project.
Table 6.
List of model parameters of foundation pit project.
| Unchanged Parameters | Variable Parameters |
|---|
| Enclosure Insertion Depth | Subway Tunnel Burial Depth HTu | Pit Width BFP | Depth of Foundation Pit HFP | Pit–Underpass Tunnel Clear Distance dp |
|---|
| 45 m | 10.6 m | 10~40 m | 3~25 m | 5~35 m |
Table 7.
List of parameters of shallow foundation engineering model.
Table 7.
List of parameters of shallow foundation engineering model.
| Unchanged Parameters | Variable Parameters |
|---|
| Subway Tunnel Burial Depth HTu | Shallow Foundation Load qSF | Shallow Base Lateral Distribution Range LSF,2 | Shallow Foundation–Subway Tunnel Clearance dSF |
|---|
| 10.6 m | 50~120 kPa | 8~40 m | 5~50 m |
Table 8.
Numerical simulation results of pile foundation engineering.
Table 8.
Numerical simulation results of pile foundation engineering.
| Variable Parameters | Tunnel Rumble Displacement (mm) |
|---|
| Number of group pile rows | 1 row | −4.83 |
| 2 rows | −7.65 |
| 3 rows | −9.62 |
| 4 rows | −10.99 |
| 5 rows | −11.93 |
| Transverse pile spacing S1 | 3 m | −14.09 |
| 4 m | −12.93 |
| 5 m | −11.93 |
| 6 m | −11.15 |
| 7 m | −10.45 |
| Longitudinal pile spacing S2 | 3 m | −17.91 |
| 4 m | −14.33 |
| 5 m | −11.93 |
| 6 m | −10.25 |
| 7 m | −8.96 |
| Pile foundation–underpass tunnel clearances dp | 3 m | −15.65 |
| 5 m | −11.93 |
| 10 m | −7.69 |
| 15 m | −5.59 |
| 20 m | −3.57 |
| Pile length Lpile | 30 m | −15.88 |
| 40 m | −14.44 |
| 50 m | −13.12 |
| 70 m | −11.93 |
| 100 m | −9.86 |
Table 9.
Numerical simulation results of foundation pit project.
Table 9.
Numerical simulation results of foundation pit project.
| Variable Parameters | Tunnel Rumble
Displacement (mm) | Tunnel Lateral
Displacement (mm) |
|---|
| Pit width BFP | 10 m | 7.16 | 7.02 |
| 15 m | 12.17 | 11.93 |
| 20 m | 16.37 | 16.04 |
| 25 m | 19.86 | 19.46 |
| 30 m | 22.52 | 22.07 |
| 35 m | 24.68 | 23.69 |
| 40 m | 26.20 | 25.15 |
| Pit–underpass tunnel clear distance dp | 5 m | 19.21 | 18.44 |
| 10 m | 12.17 | 11.68 |
| 15 m | 10.28 | 9.87 |
| 20 m | 8.67 | 8.49 |
| 25 m | 5.80 | 5.69 |
| 30 m | 3.37 | 3.40 |
| 35 m | 2.72 | 2.74 |
| Depth of foundation pit HFP | 3 m | 5.42 | 5.47 |
| 6 m | 6.04 | 6.10 |
| 10 m | 12.17 | 12.29 |
| 25 m | 22.25 | 22.47 |
Table 10.
Numerical simulation results of shallow foundation engineering.
Table 10.
Numerical simulation results of shallow foundation engineering.
| Variable Parameters | Tunnel Rumble Displacement/mm |
|---|
| Shallow foundation load qSF | 50 kPa | −9.66 |
| 60 kPa | −11.57 |
| 70 kPa | −13.44 |
| 80 kPa | −15.30 |
| 90 kPa | −17.12 |
| 105 kPa | −19.84 |
| 120 kPa | −22.51 |
| Shallow base lateral distribution range LSF,2 | 8 m | −16.49 |
| 10 m | −19.84 |
| 15 m | −26.84 |
| 20 m | −32.41 |
| 25 m | −36.75 |
| 30 m | −40.25 |
| 35 m | −42.91 |
| 40 m | −44.98 |
| Shallow Foundation–Subway Tunnel Clearance dSF | 5 m | −25.43 |
| 10 m | −19.84 |
| 15 m | −15.68 |
| 20 m | −12.45 |
| 25 m | −9.94 |
| 30 m | −8.27 |
| 35 m | −6.55 |
| 40 m | −5.14 |
| 50 m | −2.87 |
Table 11.
Effect of increasing the number of piles in the transverse/longitudinal direction on
[
12].
Table 11.
Effect of increasing the number of piles in the transverse/longitudinal direction on
[
12].
| Direction of Additional Piles | Number of Piles |
|---|
| 2 | 3 | 5 |
|---|
| Vertical | 68% | 38% | 27% |
| Horizontal | 51% | 25% | 17% |
Table 12.
Numerical simulation results of the number of group pile rows.
Table 12.
Numerical simulation results of the number of group pile rows.
| Pile Length Lpile (m) | Tunnel Rumble Displacement (mm) |
|---|
| 30 | −15.88 |
| 40 | −14.44 |
| 50 | −13.12 |
| 70 | −11.93 |
| 100 | −9.86 |
Table 13.
Reference table for pile length correction factor under different Lpile/Dpile.
Table 13.
Reference table for pile length correction factor under different Lpile/Dpile.
| Lpile/Dpile | 5 | 10 | 15 | 20 | 25 | 30 | 40 | 50 | 60 | 70 | 80 | 90 | 100 |
|---|
| Correction factor χL,p | 1.98 | 1.72 | 1.56 | 1.43 | 1.33 | 1.25 | 1.11 | 1 | 0.91 | 0.8 | 0.8 | 0.7 | 0.7 |
Table 14.
Numerical simulation results of pile spacing.
Table 14.
Numerical simulation results of pile spacing.
| Variable Parameters | Tunnel Rumble Displacement |
|---|
| Transverse pile spacing S1 | 3 m | −14.09 mm |
| 4 m | −12.93 mm |
| 5 m | −11.93 mm |
| 6 m | −11.15 mm |
| 7 m | −10.45 mm |
| Longitudinal pile spacing S2 | 3 m | −17.91 mm |
| 4 m | −14.33 mm |
| 5 m | −11.93 mm |
| 6 m | −10.25 mm |
| 7 m | −8.96 mm |
Table 15.
Numerical simulation results of shallow foundation load.
Table 15.
Numerical simulation results of shallow foundation load.
| qSF (kPa) | Tunnel Rumble Displacement (mm) |
|---|
| 50 | −9.66 |
| 60 | −11.57 |
| 70 | −13.44 |
| 80 | −15.30 |
| 90 | −17.12 |
| 105 | −19.84 |
| 120 k | −22.51 |
Table 16.
Numerical simulation results of LSF,2.
Table 16.
Numerical simulation results of LSF,2.
| LSF,2 (m) | Tunnel Rumble Displacement (mm) |
|---|
| 8 | −16.49 |
| 10 | −19.84 |
| 15 | −26.84 |
| 20 | −32.41 |
| 25 | −36.75 |
| 30 | −40.25 |
| 35 | −42.91 |
| 40 | −44.98 |
Table 17.
Numerical simulation results of dSF.
Table 17.
Numerical simulation results of dSF.
| dSF (m) | Tunnel Rumble Displacement (mm) |
|---|
| 5 | −25.43 |
| 10 | −19.84 |
| 15 | −15.68 |
| 20 | −12.45 |
| 25 | −9.94 |
| 30 | −8.27 |
| 35 | −6.55 |
| 40 | −5.14 |
| 50 | −2.87 |
Table 18.
Maximum lateral displacement statistics of the enclosure structure for different engineering cases.
Table 18.
Maximum lateral displacement statistics of the enclosure structure for different engineering cases.
| No. | References | City | Type of Enclosure | δh,FP-HFP |
|---|
| (1) | Liao et al. (2015) [34] | Suzhou | Diaphragm wall | δh,FP = 0.20%HFP |
| (2) | Bored pile | δh,FP = 0.13%HFP |
| (3) | Wang et al. (2010) [35] | Shanghai | Bored pile | δh,FP = 0.55%HFP |
| (4) | Tan and Wang (2013) [36] | Shanghai | Diaphragm wall | δh,FP = 0.26%HFP |
| (5) | Wei et al. (2014) [37] | Hangzhou | Diaphragm wall | δh,FP = 0.23%HFP |
| (6) | Li et al. (2007) [38] | Shanghai + Hangzhou | Sheet pile + support | δh,FP = 0.30%HFP |
| (7) | Tang and Liao (2019) [39] | Xuzhou | Diaphragm wall | δh,FP = 0.063%HFP |
Table 19.
Summary of pit excavation cases adjacent to existing subway tunnels [
41,
42].
Table 19.
Summary of pit excavation cases adjacent to existing subway tunnels [
41,
42].
| No. | Project Location | (m) | Soil Profile | dFP (m) | Tunnel Depth of Burial | Support Conditions | ωFP (mm) | (mm) |
|---|
| 1 | Shanghai Nanjing Road | 14.4 | Silty clay | 9 | 13 | Diaphragm wall +3 support | −10 | 10.00 |
| 2 | Shanghai Daning Commercial Center | 8 | Silty clay | 7.5 | 11.8 | Gravity dam + Pile + Steel brace | +7.1 | 4 |
| 3 | Shanghai Hengfeng Road | 10 | Sandy chalky soil + Silty clay | 7.2 | 12.4 | Diaphragm wall + Cross brace | −3.3 | 4 |
| 4 | Shanghai Xujiahui | 21 | Silty clay | 25 | 11 | Diaphragm wall | −5.54 | / |
| 5 | Guangzhou Huangsha Avenue | 12 | Sandy soil | 6 | 10 | Diaphragm wall + 2 Steel pipe angle brace | −12.3 | 7.8 |
| 6 | Shanghai Jing’an Temple | 24.3 | Silty clay | 15 | 15.8 | Diaphragm wall+ Steel brace | −1.3 | 3 |
| 7 | Shanghai Nanjing West Road | 14.6 | Silty clay | 12.1 | 9.4 | Diaphragm wall + Steel brace | +5.5 | / |
| 8 | Shanghai Pacific Plaza | 10.1 | Powdery clay + Silty clay | 3.8 | 10 | Diaphragm wall + Bored pile | −9.5 | 17.1 |
| 9 | Shanghai Nanjing West Road | 20 | Powdery clay + Silty clay | 5.4 | 8.5 | Diaphragm wall + Steel brace | −17.37 | 6.5 |
| 10 | Shanghai Hong Kong Plaza | 15.8 | Powdery clay + Silty clay | 3.9 | 12.4 | Diaphragm wall + Steel brace | 0 | 13.1 |
| 11 | Shanghai Hong Kong Plaza | 8.3 | Powdery clay + Silty clay | 5.9 | 12.7 | Diaphragm wall + Steel brace | −6.07 | 8.5 |
| 12 | Shanghai Huangpu District | 9.2 | Powdery clay + Silty clay | 3.8 | 12.7 | Diaphragm wall+ Steel brace | +6 | / |
| 13 | Shanghai South Xizang Road | 4.95 | Silty clay | 11.5 | 10 | Bored pile | 5.71 | / |
| 14 | Shanghai People’s Square | 11.5 | Silty clay | 7 | 7 | Diaphragm wall | 4 | / |
| 15 | Shanghai Luwan Center | 17.725 | Silty clay | 7.5 | 7.5 | Diaphragm wall + Steel brace | 10 | 10 |
| 16 | Shanghai | 22.12 | Silty clay | 12.7 | 5.7 | Diaphragm wall + Corner brace | −10 | 15 |
| 17 | Guangzhou Tianhe District | 20.2 | Silty clay | 6 | 14.8 | Rotary pile + Reinforced concrete brace | +1.3 | 3.9 |
| 18 | Shanghai | 22.3 | Silty clay | 2 | 6.6 | Diaphragm wall + Steel brace | +8.2 | 1.5 |
| 19 | Beijing | 15.5 | Powdery clay + Powdered fine sand | 5 | 16.39 | Diaphragm wall + Soil nailing wall | / | 5.4 |
| 20 | Guangzhou Linhe Village | 8.3 | Strongly weathered muddy sandstone | 12.2 | 8.5 | Rotary pile + Internal brace | +0.2 | 2 |
| 21 | Shanghai International Plaza | 11.1 | / | 5 | / | Bored pile + Horizontal brace | +5.3 | 8.7 |
| 22 | Shanghai | 9.2 | / | 3.8 | 12.7 | Diaphragm wall + Steel brace | / | / |
| 23 | / | 14.9 | / | 6.5 | / | Diaphragm wall + Steel brace | −5.5 | / |
| 24 | Guangzhou | 18 | / | 10 | / | - | −1.97 | 3.81 |
| 25 | Foshan Lingnan Tiandi | 13.9 | Medium-fine sand | 24.8 | 13.4 | Diaphragm wall + Concrete support | / | 5 |
| 26 | / | 15 | / | 10 | 21 | - | 7 | 5 |
| 27 | Taipei | / | / | 15 | 13 | Bore pile | −30 | 52 |
| 28 | Hangzhou Xiasha | 15.65 | Sandy chalky soil | 4.5 | 9.1 | Diaphragm wall + Bored pile | −9.94 | 3.1 |
| 29 | Suzhou Industrial Park | 12.2 | / | 9.5 | 11.4 | / | −6.5 | 2.9 |
| 30 | Zhengzhou | 11.4 | / | 11 | 13.7 | / | 2.5 | 6 |
| 31 | Shenyang Youth Street | 17.5 | / | 8 | 7.5 | / | 4 | 7 |
Table 20.
Numerical simulation results of pit–underpass tunnel clearances.
Table 20.
Numerical simulation results of pit–underpass tunnel clearances.
| Clearance Between Foundation Pit and Subway Tunnel (m) | Tunnel Rumble
Displacement (mm) | Tunnel Lateral Displacement (mm) |
|---|
| 5 | 19.21 | 18.44 |
| 10 | 12.17 | 11.68 |
| 15 | 10.28 | 9.87 |
| 20 | 8.67 | 8.49 |
| 25 | 5.80 | 5.69 |
| 30 | 3.37 | 3.40 |
| 35 | 2.72 | 2.74 |
Table 21.
Numerical simulation results of pit width.
Table 21.
Numerical simulation results of pit width.
| BFP (m) | Tunnel Rumble Displacement (mm) | Tunnel Lateral Displacement (mm) |
|---|
| 10 | 7.16 | 7.02 |
| 15 | 12.17 | 11.93 |
| 20 | 16.37 | 16.04 |
| 25 | 19.86 | 19.46 |
| 30 | 22.52 | 22.07 |
| 35 | 24.68 | 23.69 |
| 40 | 26.20 | 25.15 |
Table 22.
Numerical simulation results of foundation pit depth.
Table 22.
Numerical simulation results of foundation pit depth.
| HFP (m) | Tunnel Rumble Displacement (mm) | Tunnel Lateral Displacement (mm) |
|---|
| 3 | 5.42 | 5.47 |
| 6 | 6.04 | 6.10 |
| 10 | 12.17 | 12.29 |
| 25 | 22.25 | 22.47 |
Table 23.
Definition and overview of category A and B indicators.
Table 23.
Definition and overview of category A and B indicators.
| Main Factor Type | A Indicators | B Indicators |
|---|
| Pile Foundation Works | Pile length Lpile | Group pile size and pile load qpile |
| Pile spacing Sp |
| Pile foundation–subway clear distance dp |
| Shallow Foundation Engineering | Shallow foundation–subway clearance dSF | Shallow foundation load qSF |
| Longitudinal distribution range of shallow foundation load LSF,1 |
| Shallow foundation load lateral distribution range LSF,2 |
| Foundation Pit Project | Pit–subway clear distance dFP | Width of foundation pit excavation BFP |
| Length of pit excavation LFP |
| Excavation depth of foundation pit HFP |
Table 24.
Summary of the sensitivity of each sub-factor under the three main factors.
Table 24.
Summary of the sensitivity of each sub-factor under the three main factors.
| Main Factors | Sub-Factors | Indicator | Sensitivity Analysis |
|---|
| Pile foundation engineering | Pile length Lpile | A | , its sensitivity is weak. |
| Pile spacing Sp | A | , its sensitivity is high. |
| Pile foundation–subway clear distance dp | A | , its sensitivity is weak. |
| Group pile size | B | When the group pile size n × n is larger than 10 × 10, its sensitivity is weaker. |
| Pile load qpile | B | Within twice the working load of the monopile, its sensitivity is high. |
| Shallow Foundation Engineering | Shallow foundation–subway clearance dSF | A | , its sensitivity is weak. |
| Shallow foundation load qSF | B | Stronger sensitivity. |
| Longitudinal distribution range of shallow foundation load LSF,1 | B | , its sensitivity is weaker. |
| Shallow foundation load lateral distribution range LSF,2 | B | , its sensitivity is weaker. |
| Foundation Pit Project | Pit–subway clear distance dFP | A | , its sensitivity is weaker. |
| Width of foundation pit excavation BFP | B | Weak sensitivity. |
| Length of pit excavation LFP | B | , its sensitivity is weaker. |
| Excavation depth of foundation pit HFP | B | Stronger sensitivity. |


 ,
, 


