1. Introduction
Concrete is one of the most widely used building materials globally and is valued for its durability and strength. Many reinforced concrete structures experience significant deterioration due to early aging issues, leading to substantial rehabilitation costs, and a major cause of early concrete degradation is carbonation [
1]. The carbonation process reduces the pH of the pore solution of concrete, which weakens the protective layer around the steel reinforcements, making them more likely to corrode over time [
2]. Most calcium-based cementitious building materials undergo cementation, and cement hydration products such as portlandite calcium hydroxides (Ca(OH)
2) and sodium and potassium hydroxides provide the material with a pH of about 12.5. The pH level is influenced by natural elements from the built environment, including elements that can introduce carbonation, reduce the material pH, and subject the material to subsequent corrosion [
3,
4]. The pH level can also impact other hydrates, including ettringite and hydrotalcite. Papadakis et al. (1991) [
5] described cementitious material carbonation as a physicochemical process and outlined several natural carbonation mechanisms, including the dissolution of solid Ca(OH)
2 in pore water and diffusion of dissolved CO
2 in pore water. Carbon dioxide (CO
2) from the atmosphere reacts with calcium hydroxide (Ca(OH)
2) in the cement matrix to form calcium carbonate (CaCO
3). Hence, pore water plays a critical role in the carbonation of cementitious material. Several factors govern the rate and extent of carbonation in concrete, including CO
2 concentration, moisture and relative humidity, porosity, permeability, and temperature. High atmospheric CO
2 concentrations, especially in urban areas, accelerate the rate of carbonation [
6]. Carbonation is most favorable at 50–70% relative humidity because too much moisture prevents the diffusion of CO
2, while dryness limits the dissolution of CO
2 in pore water [
7]. More permeable and porous concrete experiences faster carbonation and curing conditions, and mix design becomes important [
8].
Throughout the life cycle of a concrete structure, the atmospheric environment (through dry-wet cycles) would naturally induce carbonation in cementitious materials, even at normal atmospheric temperatures [
7,
9,
10]. While such carbonation can be viewed positively as a sequestration potential for anthropogenically emitted CO
2 [
11,
12], there is also the potential for introducing early aging of cementitious building materials [
13].
In addition to atmospheric carbon dioxide (CO
2) and sulfur dioxide (SO
2), which can induce carbonation [
10], thermal processes, such as elevated temperatures and fires, can also result in building material carbonation. Structural fires, whether natural or anthropogenic, can induce carbonation of concrete [
14,
15]. Building materials for thermal energy storage can reach high temperatures (greater than 400 °C [
16,
17,
18]) and elevated temperatures during nuclear power generation [
19,
20]. Oliveira et al. (2019) [
16] showed that fire can accelerate carbonation and impact the durability of cementitious materials. Fire-damaged cementitious materials are also likely to be exposed to chloride ingress, which is a critical damaging factor for reinforcements [
17]. Finally, the use of recycled building materials as part of C&DW (construction and demolition waste) for new constructions can inadvertently include carbonated materials into the material performance and significantly reduce the performance of the constructed facility [
21,
22].
Carbonation of cementitious materials is a process of moisture intrusion that allows CO
2 to form a weak carbonic acid that reacts with the calcium hydroxide inherent in the cementitious material [
6]. The outcome is the formation of calcium carbonate and the reduction in the alkalinity of the cementitious material. The carbonation reaction process occurs through a series of chemical equations, as outlined below [
23]:
Calciferous phases in cementitious materials, including CH, C-S-H, and unreacted clinkers, can also react with the penetrated CO
2 to generate calcium carbonate and calcium-modified silica gel, leading to different chemical and mineralogical compositions compared with uncarbonated material [
24].
In cement-based materials, the pH value is primarily controlled by the amount of (Ca(OH)
2), and carbonation naturally changes the pH level of the material. Data on the variability of pH levels in cement-based materials are fundamental for gaining a deeper insight into the aging processes of these materials and their long-term performance in concrete structures [
25]. Understanding pH variations in cement-based materials is crucial because it provides valuable information regarding their chemical stability and potential for deterioration over time.
One of the most widely employed methods for determining the pH levels of cement-based materials is the use of chemical indicators. These indicators are either natural dyes or weak acids, and they play a pivotal role in quantifying the concentration of H
+ ions present in a solution. Their function is based on the principle of dissociation, wherein H
+ ions detach from the indicator, leading to a noticeable change in the indicator’s color. The pH value is then derived by taking the logarithm of the H
+ ion concentration in the solution, which in turn enables us to classify the solution as acidic, basic, or neutral. It is worth noting that various indicators are specifically tailored to different pH ranges, depending on the specific analysis requirements [
26,
27].
Cement-based materials are inherently highly alkaline right from the outset, typically starting with a pH level of around 13.5 [
28]. This elevated pH level is predominantly a result of the hydration process that occurs in the microstructure of cement as it reacts with water. For example, the hydration of calcium, sodium, and potassium oxides in Portland cement contributes significantly to the alkalinity of cement-based materials.
In the realm of research focused on concrete, the phenolphthalein solution is a commonly used indicator for monitoring changes in pH levels [
29,
30,
31]. Chinchón-Payá et al. (2016) [
26] suggested an alternative to phenolphthalein in mortars and concrete by using a solution containing curcumin as an indicator. This method involves exposing a cement sample to a curcumin solution, which produces a red color in regions with alkaline reserves (pH ~12) and turns yellow in areas that have undergone carbonation (pH ≤ 9).
European Standard (EN 14630:2006) [
32] incorporates the use of phenolphthalein. This is to ascertain whether a sufficient layer of uncarbonated concrete remains to safeguard the reinforcement throughout the remaining intended lifespan of the structure. Phenolphthalein exhibits a pH range between 8.3 and 10.0, and its color undergoes distinct transitions within this range. Specifically, it remains colorless when the pH is below 8.3, takes on a light purple hue within the pH range of 8.3 to 10.0, and reverts to a colorless state when the pH exceeds 10.0. Within the partially carbonated zone, owing to the coexistence of Ca(OH)
2 and CaCO
3, the pH level in the pore solution is higher than that observed in the fully carbonated zone (typically around 8.5 to 9), yet lower than the pH recorded in the non-carbonated zone (approximately 12.5 to 13). In practical scenarios, when a phenolphthalein solution is applied to the surface of partially carbonated concrete, it typically assumes a purple hue. Conversely, when applied to fully carbonated concrete, the phenolphthalein solution remains colorless. This differentiation is of paramount significance, as research indicates that the corrosion rate of rebar remains constant when the surface pH of the rebar is less than 9. This specific region, characterized by a surface pH value below 9, is denoted as the fully carbonated zone [
29].
While carbonation of cementitious building materials is a well-studied subject, the effects of extremely high temperatures on building material carbonation have not been extensively investigated. Oliveira et al. (2019) [
15] used phenolphthalein solution to determine the carbonation penetration depth of concrete exposed to fire and concluded that temperature exposure may not translate to a deeper carbonation depth. Choi et al. (2017) [
31] used image processing techniques to help delineate the temperature effect of post-fire building material with phenolphthalein solution due to induced carbonation. Finally, Hu et al. (2018) [
33] used a colorimeter to quantify the color changes in burnt cemented clay bricks. Similar to [
31], Hu et al. (2018) [
33] applied color indicators to the surface of burnt concrete and observed the surface color change.
In this paper, the data from [
33] were acquired and analyzed extensively using automated image processing to facilitate the carbonation detection process. Specifically, image processing techniques were applied to both the RGB and CMYK color schemes. Consequently, this study aims to assess the carbonation properties of fire-exposed cement paste using cutting-edge image processing techniques to quantify the carbonation depth through primary color analysis. The goal is to develop a rapid inspection technique to quantify the likely temperature exposure, which can be critical information for both forensic investigation and remedial action planning. By employing phenolphthalein as an indicator, this study suggests the possible development of an automated method for detecting carbonation as a nondestructive, accurate, and efficient way of measuring fire-damaged concrete.
2. Fire Damage to Building Materials
Cementitious building materials undergo significant changes in their mechanical properties when exposed to high temperatures. The changes are dependent on factors such as the mix design, material thickness, moisture content, and duration and intensity of temperature exposure. Describing concrete carbonation as a neutralization process, Feng et al. (2023) [
34] suggested that fire can degrade the carbonation resistance of concrete and result in the reduction of concrete compressive strength and dynamic modulus of elasticity, wherein the loss of carbonation resistance was more significant than the loss of its mechanical properties. The decline in concrete’s carbonation resistance after a fire is attributed not to the reduction in alkalinity but rather to the significant increase in porosity and the formation of harmful pores within the concrete matrix. Contrary to [
15], Feng et al. (2023) [
34] suggested that the carbonation depth involved a transition zone prior to the uncarbonated concrete depth.
Cementitious material carbonization under the influence of fire is a complex phenomenon that can have detrimental effects on fire safety, especially for inhabitants. For example, when concrete is exposed to high temperatures, as in a fire, several significant changes can occur. One of the primary effects is accelerated carbonation. Carbonation involves the gradual penetration of carbon dioxide from the surrounding environment into the concrete’s pore structure, where it reacts with calcium hydroxide to form calcium carbonate (Equation (2)). Elevated temperatures result in the increased decomposition of hydrated compounds in concrete, thereby diminishing its alkalinity. In the event of a fire, the concentration of CO
2 typically escalates, and when fire-damaged concrete is subjected to environments with heightened CO
2 levels, it is anticipated that the carbonation would be substantially accelerated. Microrphological analysis revealed that the chemical compositions of the cement hydration products in the concrete remained the same before and after high-temperature exposure, indicating that no new reaction products were formed. Hydration products like C-S-H, calcium aluminate hydrate, and aft decompose between room temperature and 300 °C. Ca(OH)
2 decomposes between 350 °C and 550 °C, while CaCO
3 decomposes between 600 °C and 800 °C [
34]. The decomposition of calcium silicate hydrate (C-S-H) mainly occurs up to about 200 °C, and the decomposition of calcium hydroxide (Ca(OH)
2) and portlandite (CH) occurs at about 400 °C [
24].
As a result, the concrete’s protective passive layer, typically formed by its high pH, is compromised. This compromised layer can lead to a loss of concrete structural integrity and reduced resistance to further fire-induced deterioration. In a typical fire scenario, the fire primarily affects the surface of the concrete, leading to a substantial temperature gradient. According to ACI 216.1–14 (2014) [
35], there can be a temperature drop of over 300 °C from the fire-exposed surface to a depth of 25 mm in the concrete. This indicates that the fire’s impact is predominantly on the concrete’s surface layer. Therefore, it is crucial to focus on the fire-damage detection of this outer layer to accurately evaluate a structure’s post-fire condition. Understanding and managing building material carbonization under fire conditions are essential for designing fire-resistant structures and ensuring their safety and durability in the face of such extreme events. Hence, this study investigates the influence of high-temperature exposure on the carbonation behavior of cement-based materials, with a focus on fire-damaged concrete. Advanced image processing techniques, such as primary color analysis based on the CMYK color model, are employed to improve the accuracy of carbonation detection.
3. Methodology
3.1. Burnt Test Using Cemented Clay Material
In [
33], cemented clay samples were meticulously crafted in a precisely controlled temperature environment. The preparation involved using a mold measuring 2.78 inches (70 mm) by 2.78 inches (70 mm) by 2.78 inches (70 mm). The cement used is normal Portland cement Type I/II, and the specimen has chemical compositions of calcium oxide (CaO) of 54.6%, silicon dioxide (SiO
2) of 31.7%, aluminum oxide (Al
2O
3) of 7.3%, and ferric oxide (Fe
2O
3) of 1.7%. The cement:sand:clay:water ratio used is 9.6:36:2.4:12.
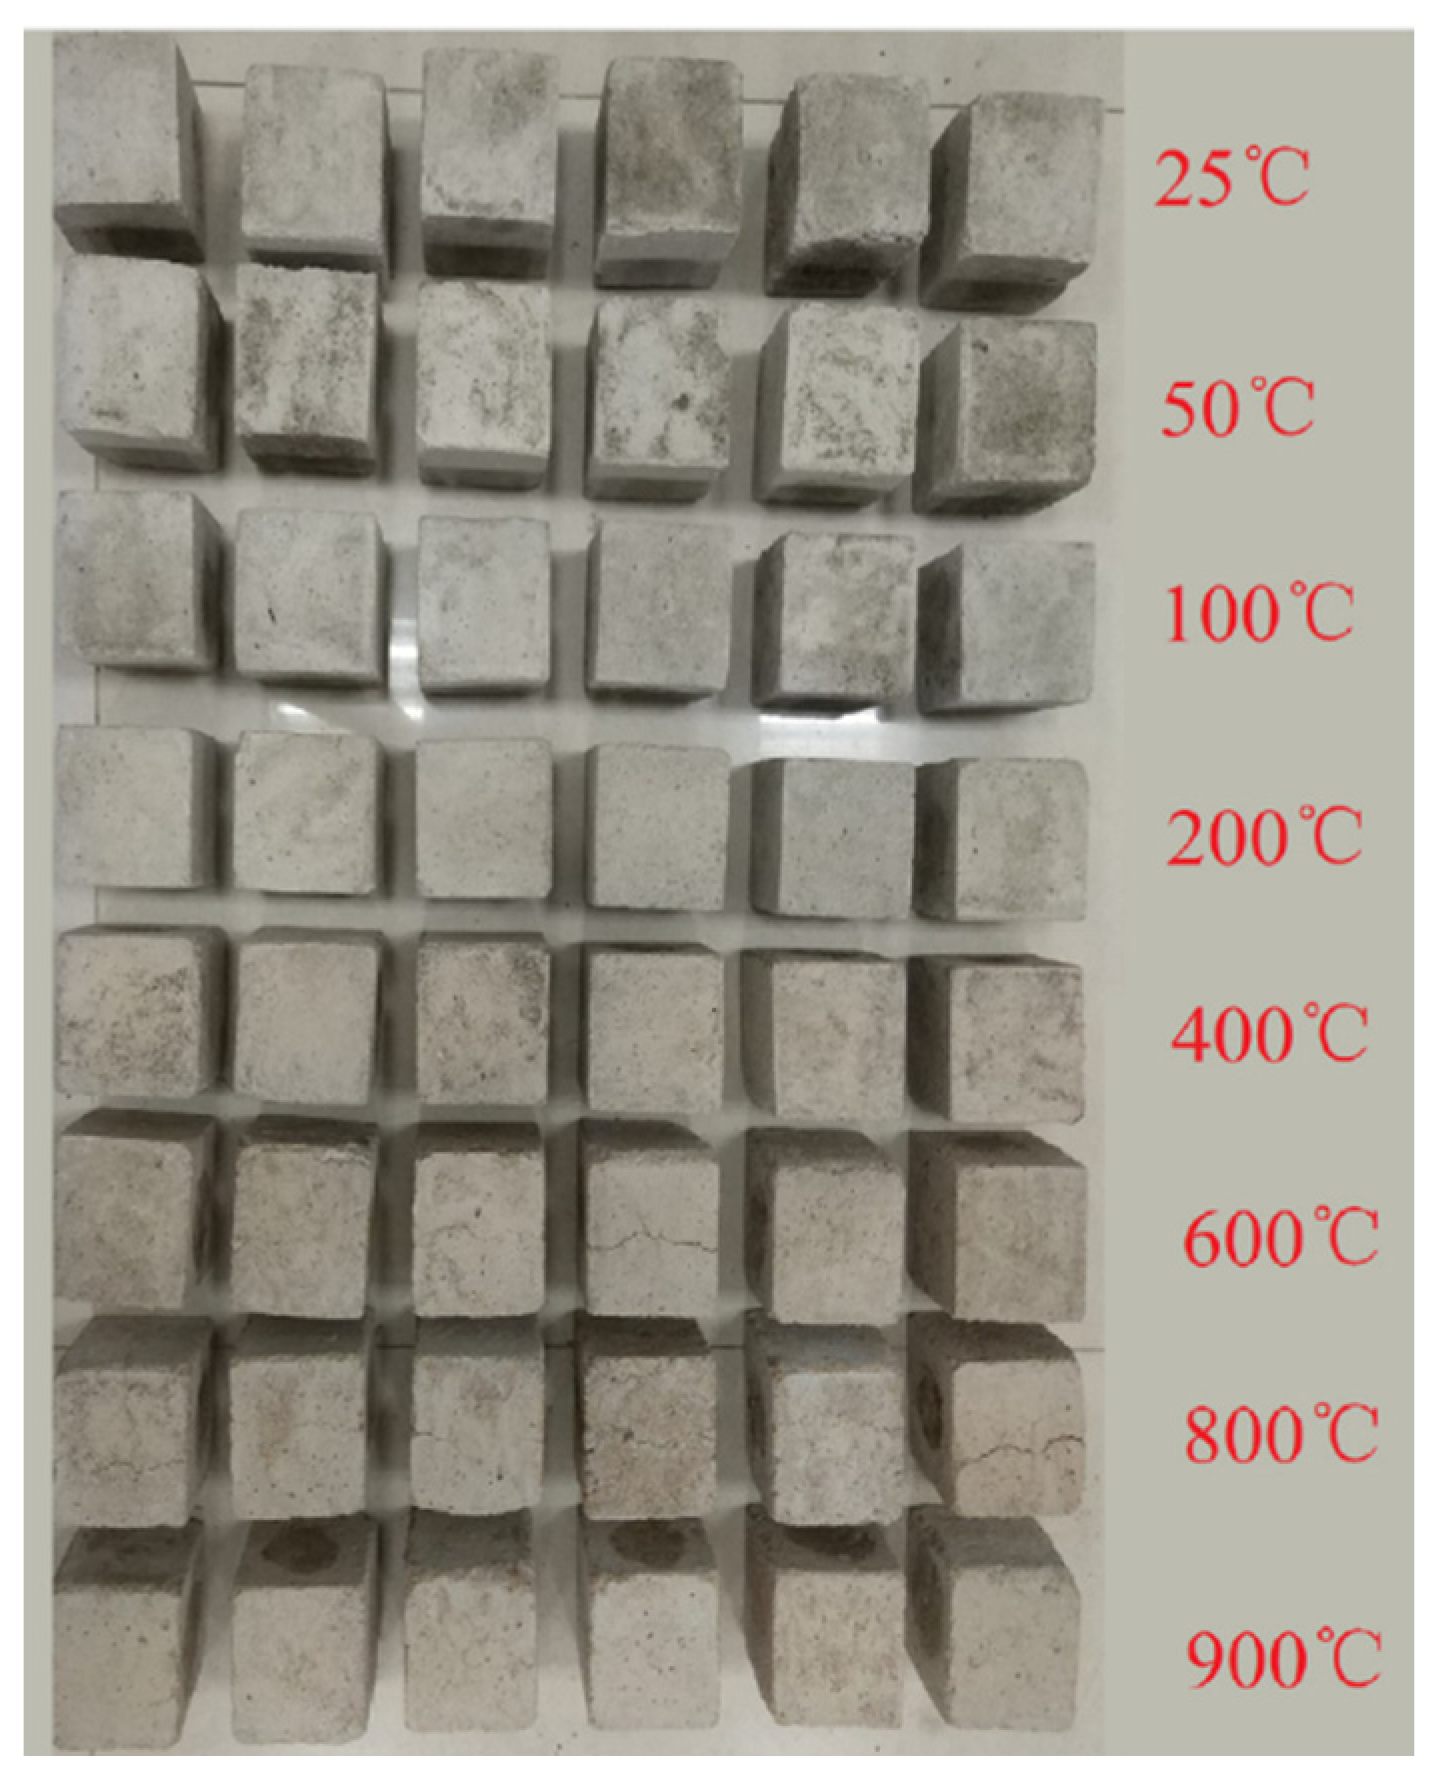
After 28 days, the test specimens were positioned in a controlled-atmosphere furnace and subjected to a gradual temperature increase from 25 °C to 900 °C at a rate of 10 °C per minute. The temperature increments included 25 °C, 50 °C, 100 °C, 200 °C, 400 °C, 600 °C, 800 °C, and 900 °C. Each sample was maintained at its target temperature for 90 min to ensure consistent thermal exposure.
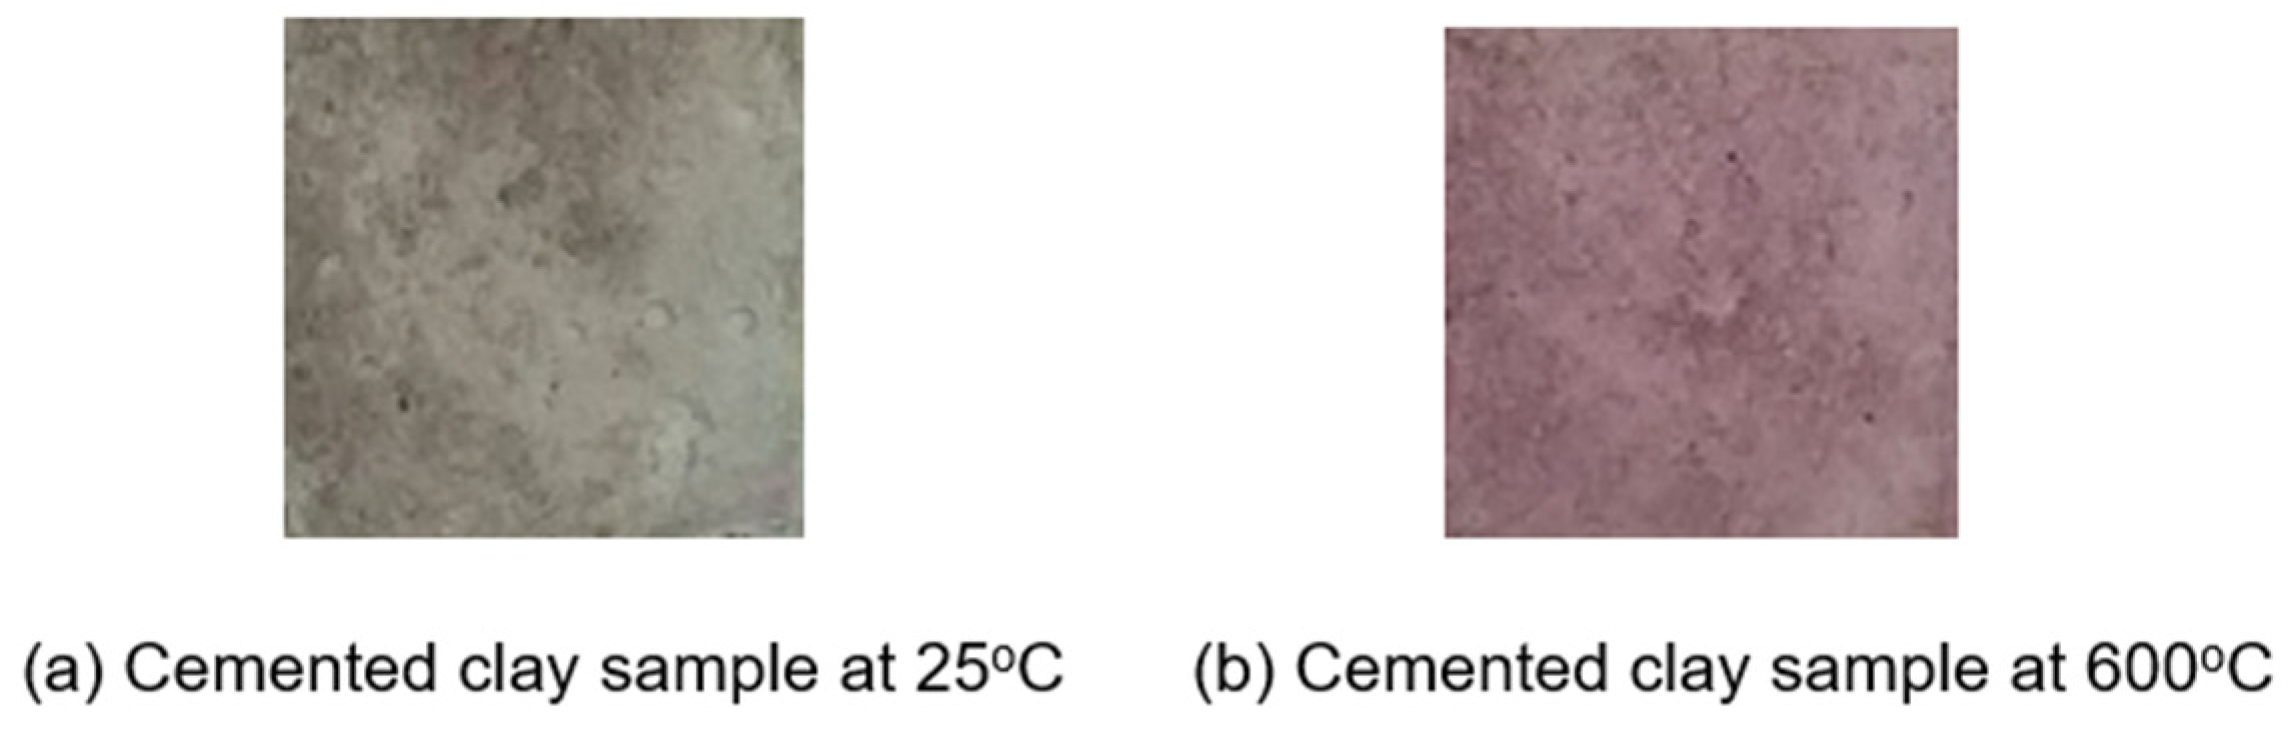
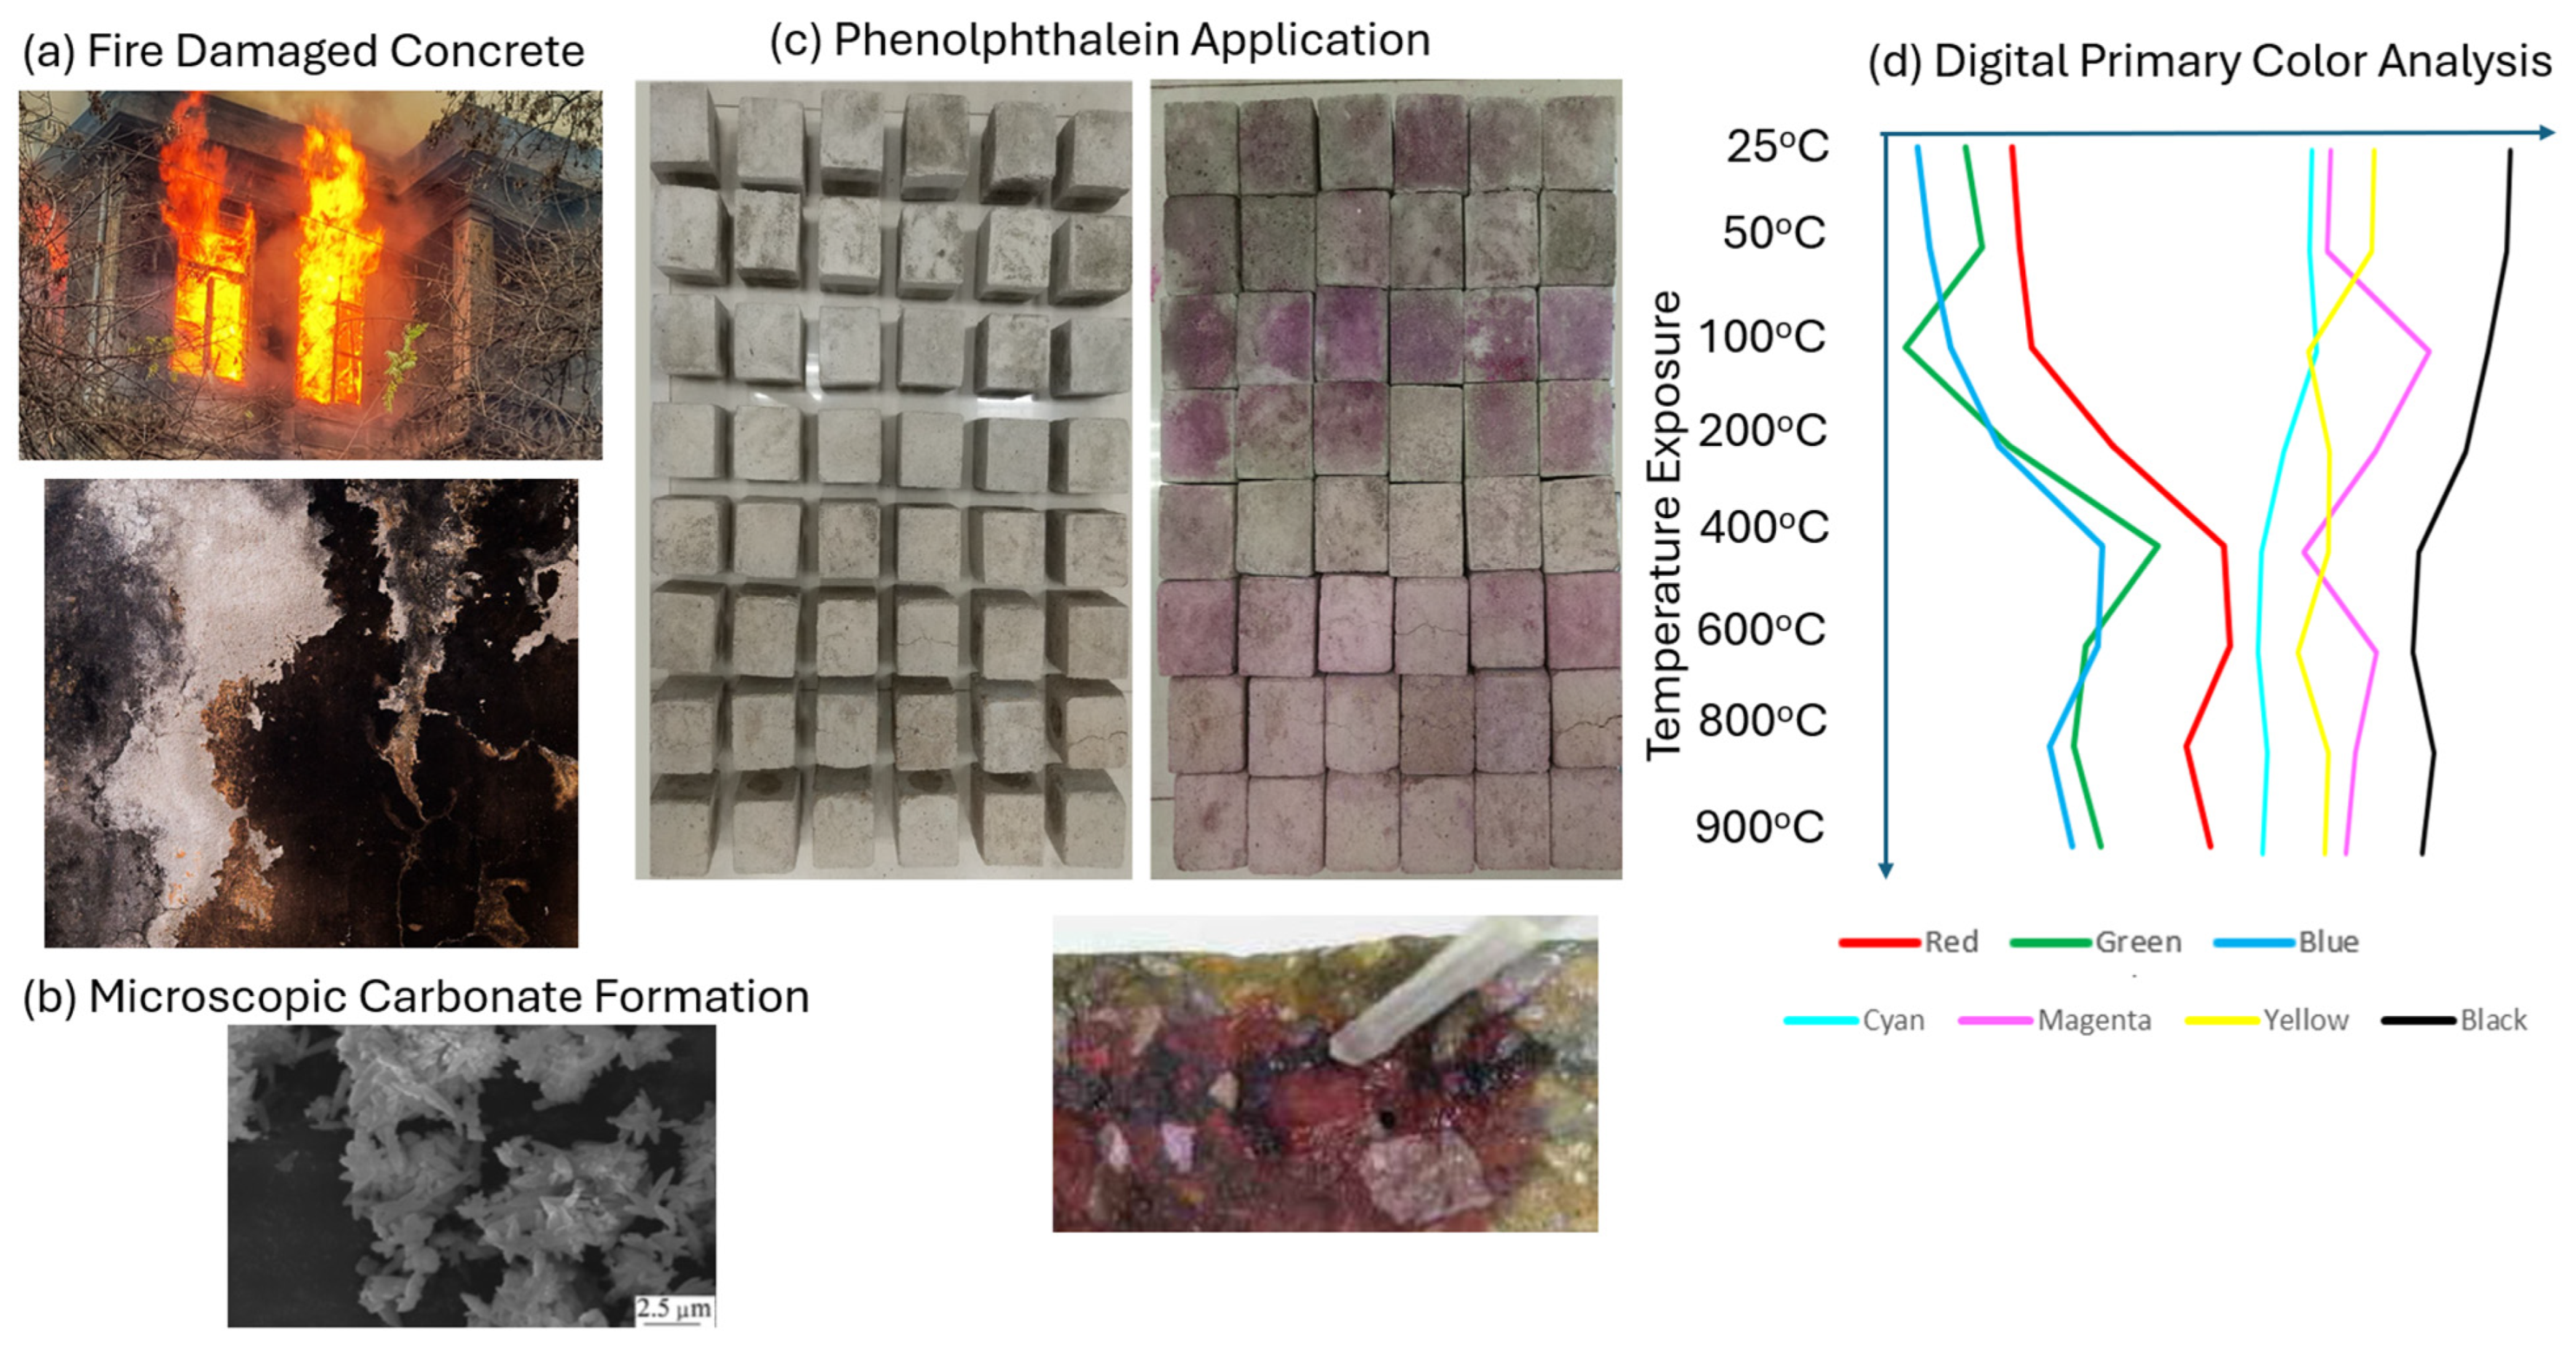
Following heat treatment, the samples were tested using a phenolphthalein reagent. Notably, this test revealed that the surface color of the samples underwent distinct changes at different temperatures. For example,
Figure 1 shows two samples with (
Figure 1a) and without heat exposure (
Figure 1b)— a visual representation of this phenomenon showing the visible changes in surface color after the application of the indicator for a duration of 10 min.
Careful observations reveal a distinct transformation in the color patterns, with deep purple hues emerging in the temperature range of 100 °C to 200 °C, while lighter shades of purple manifest at temperatures exceeding 600 °C.
Figure 2 and
Figure 3 show all the specimens with different levels of heat treatments presented in [
33]:
Figure 2 shows the original specimens, and
Figure 3 shows the specimens after the application of phenolphthalein solution. The images are taken indoors in a well-lit room. No strong light was used to obscure the natural coloring of the specimen, as site inspections are most likely to be performed without light enhancements.
Using digital image processing, it is possible to implement different color-coded schemes, such as primary color codes (RGB for red, green, and blue), to improve fire effects differentiation. A prevalent approach in image analysis, such as for facial recognition, relies on the RGB (Red, Green, Blue) color model, an additive system wherein different combinations of red, green, and blue lights can be used to create a broad spectrum of colors [
27,
36,
37]. Primary color analysis has been recognized to reduce the time for image processing, and Yang et al. (2021) [
38] suggested that primary color analysis for image evaluation automation can help minimize false detection and leakage. In the current study, primary color image processing was used to compare RGB and CMYK color processing. The following describes the workflow of the image processing.
3.2. Image Analysis Workflow
Image processing is a versatile technique used for the extraction, quantification, and comprehensive analysis of image attributes, thereby facilitating the extraction of valuable insights from images. Within the context of concrete materials, numerous researchers have advocated the adoption of image processing methods to investigate various properties and defects (i.e., [
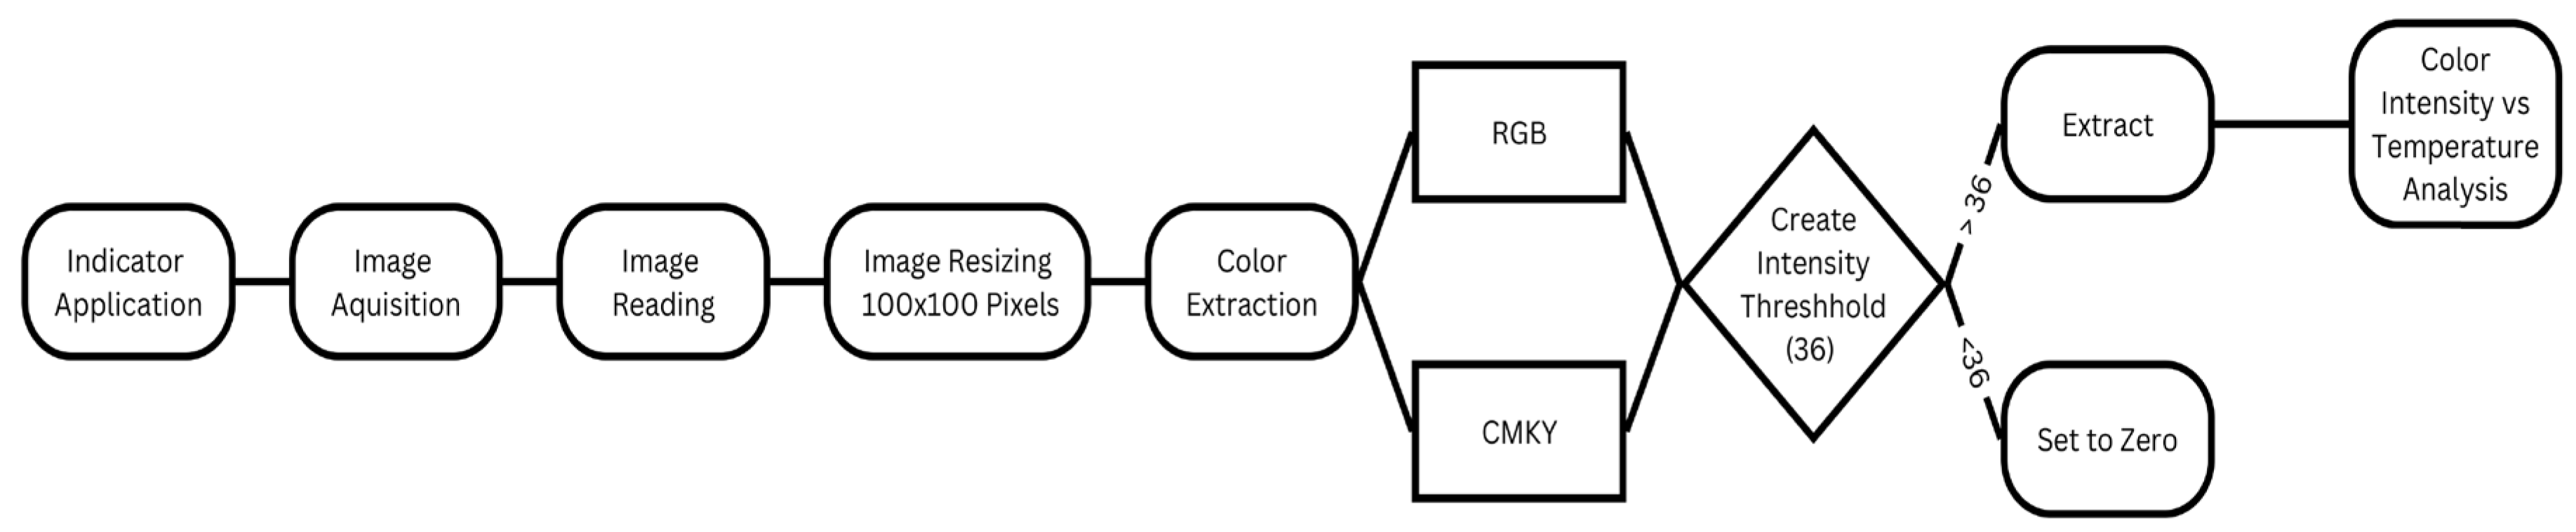
39]). These applications range from the identification and classification of surface cracks in concrete to the assessment of degradation depths in cementitious materials and the monitoring of concrete carbonation using specialized indicators. The color transformations in the phenolphthalein-treated samples were examined using digital image processing techniques through a structured workflow (
Figure 4) [
1,
31]. A notable advantage of employing image processing in these endeavors is its ability to provide an automated and nondestructive testing method. This stands in contrast to subjective approaches, which can introduce biases and inaccuracies, thereby enhancing the precision and reliability of the measurement outcomes.
Figure 4 shows the workflow of the analysis process used in the current study to extract primary color data that is correlated with the degree of fire treatments. Additional image processing techniques, such as spectrum analysis or machine learning, can be employed to further enhance the image analysis process [
1].
The initial phase of image processing involves “extraction”, a process in which the image is dissected into its fundamental components, yielding meaningful data. This entails breaking down an image into pixels and returning a matrix of pixel values.
To determine the best approach for detecting carbonation-related changes, we tested both the RGB (Red, Green, Blue) and CMYK (Cyan, Magenta, Yellow, Black) color models to determine which provided the most accurate results. However, it is essential to recognize that the RGB method has limitations, particularly in identifying white colors. In the RGB model, white is perceived as the culmination of all primary colors, while black signifies the absence of light. This limitation becomes pronounced when dealing with materials like concrete or cemented clay, where the RGB model may misinterpret lighter shades as a high combination of primary colors, potentially hindering the recognition of subtle color changes, as observed with indicator solutions.
An alternative approach to image analysis is the CMYK (Cyan, Magenta, Yellow, Key/Black) color model, which operates as a subtractive system, modifying colors by partially or entirely masking them on a white background. In the context of concrete materials, the CMYK model is more advantageous because it presents lower values of cyan, magenta, and yellow colors. This characteristic facilitates the analysis of color variations induced by substances like phenolphthalein solution, and the magenta component of the CMYK model aligns more closely with the characteristic hue of phenolphthalein in the pH range of 8.3–10.0, enhancing the accuracy of color representation.
The green (RGB model) and magenta (CMYK model) channels were then extracted from the images, and thresholding was used to isolate the pertinent color changes before the images were converted to grayscale. To measure the differences across various temperature exposures, statistical analysis was performed on the extracted color intensity values, including mean and variance computations. In order to provide a quantitative indicator of carbonation depth, pixel distribution analysis was used to determine the percentage of pixels that corresponded to the color changes caused by carbonation.
As shown in
Figure 1,
Figure 1a represents a cemented clay sample at an average room temperature with the addition of phenolphthalein solution [
33].
Figure 1b shows a cemented clay sample at an elevated temperature of 600 °C after applying the phenolphthalein solution. Both models are composed of 100 × 100 pixels.
Table 1 and
Table 2 show the results of the highest intensity of color extraction using the RGB and CMYK methods (intensity values ranging from 0 to 255), respectively.
Comparing
Table 1 and
Table 2 reveals a significant increase in magenta color intensity compared to other colors. While there is an increase in green intensity in the RGB model, it is notable that the RGB color intensities are considerably higher than those in the CMYK model. This suggests that CMYK is more effective in accurately portraying cemented clay colors and detecting color changes triggered by the phenolphthalein solution in concrete samples. Furthermore, the green component in the RGB model and the magenta component in the CMYK model are optimal choices for representing these color variations, with magenta displaying superior performance.
The extraction of green and magenta colors from images and their transformation into grayscale is a cornerstone technique in image analysis and computer vision. In this realm, grayscale images serve as an indispensable tool, simplifying the intricate task of quantifying and visualizing color information. The process comprises several meticulous steps that isolate the desired color components while sidelining the others. Initially, the input images are read, typically utilizing the RGB color space for green and CMYK for magenta. Once loaded, these images are often resized to maintain a consistent resolution, ensuring uniform processing; in our case, we opted for a 100 × 100 pixel resolution.
For the extraction of green, the green channel of the RGB image was singled out, representing the intensity of green in each pixel. Conversely, the magenta channel of CMYK was isolated. A thresholding mechanism was applied to discern green from other colors and consider pixels with values surpassing a specific threshold. In our methodology, we set this threshold at 36, implying that any pixel intensity below 36 is disregarded. The identified green and magenta pixels are then conerveted to grayscale images.
In grayscale, the pixel intensity directly corresponds to the brightness of each pixel. Black signifies the complete absence of brightness (intensity value of 0), while white represents full brightness (intensity value of 255 in an 8-bit grayscale image). The grayscale transformation condenses intricate color data into a single channel, enabling easy visualization and analysis. For green color extraction, areas in the grayscale image that appear white indicate the highest concentration of green, while black regions denote minimal or no green presence. The shades of gray between black and white represent varying levels of green intensity, revealing the spatial distribution of green in the original image. A similar grayscale interpretation is applied to detect magenta. This approach simplifies color analysis, allowing for the precise quantification and comparative assessment of color distribution.
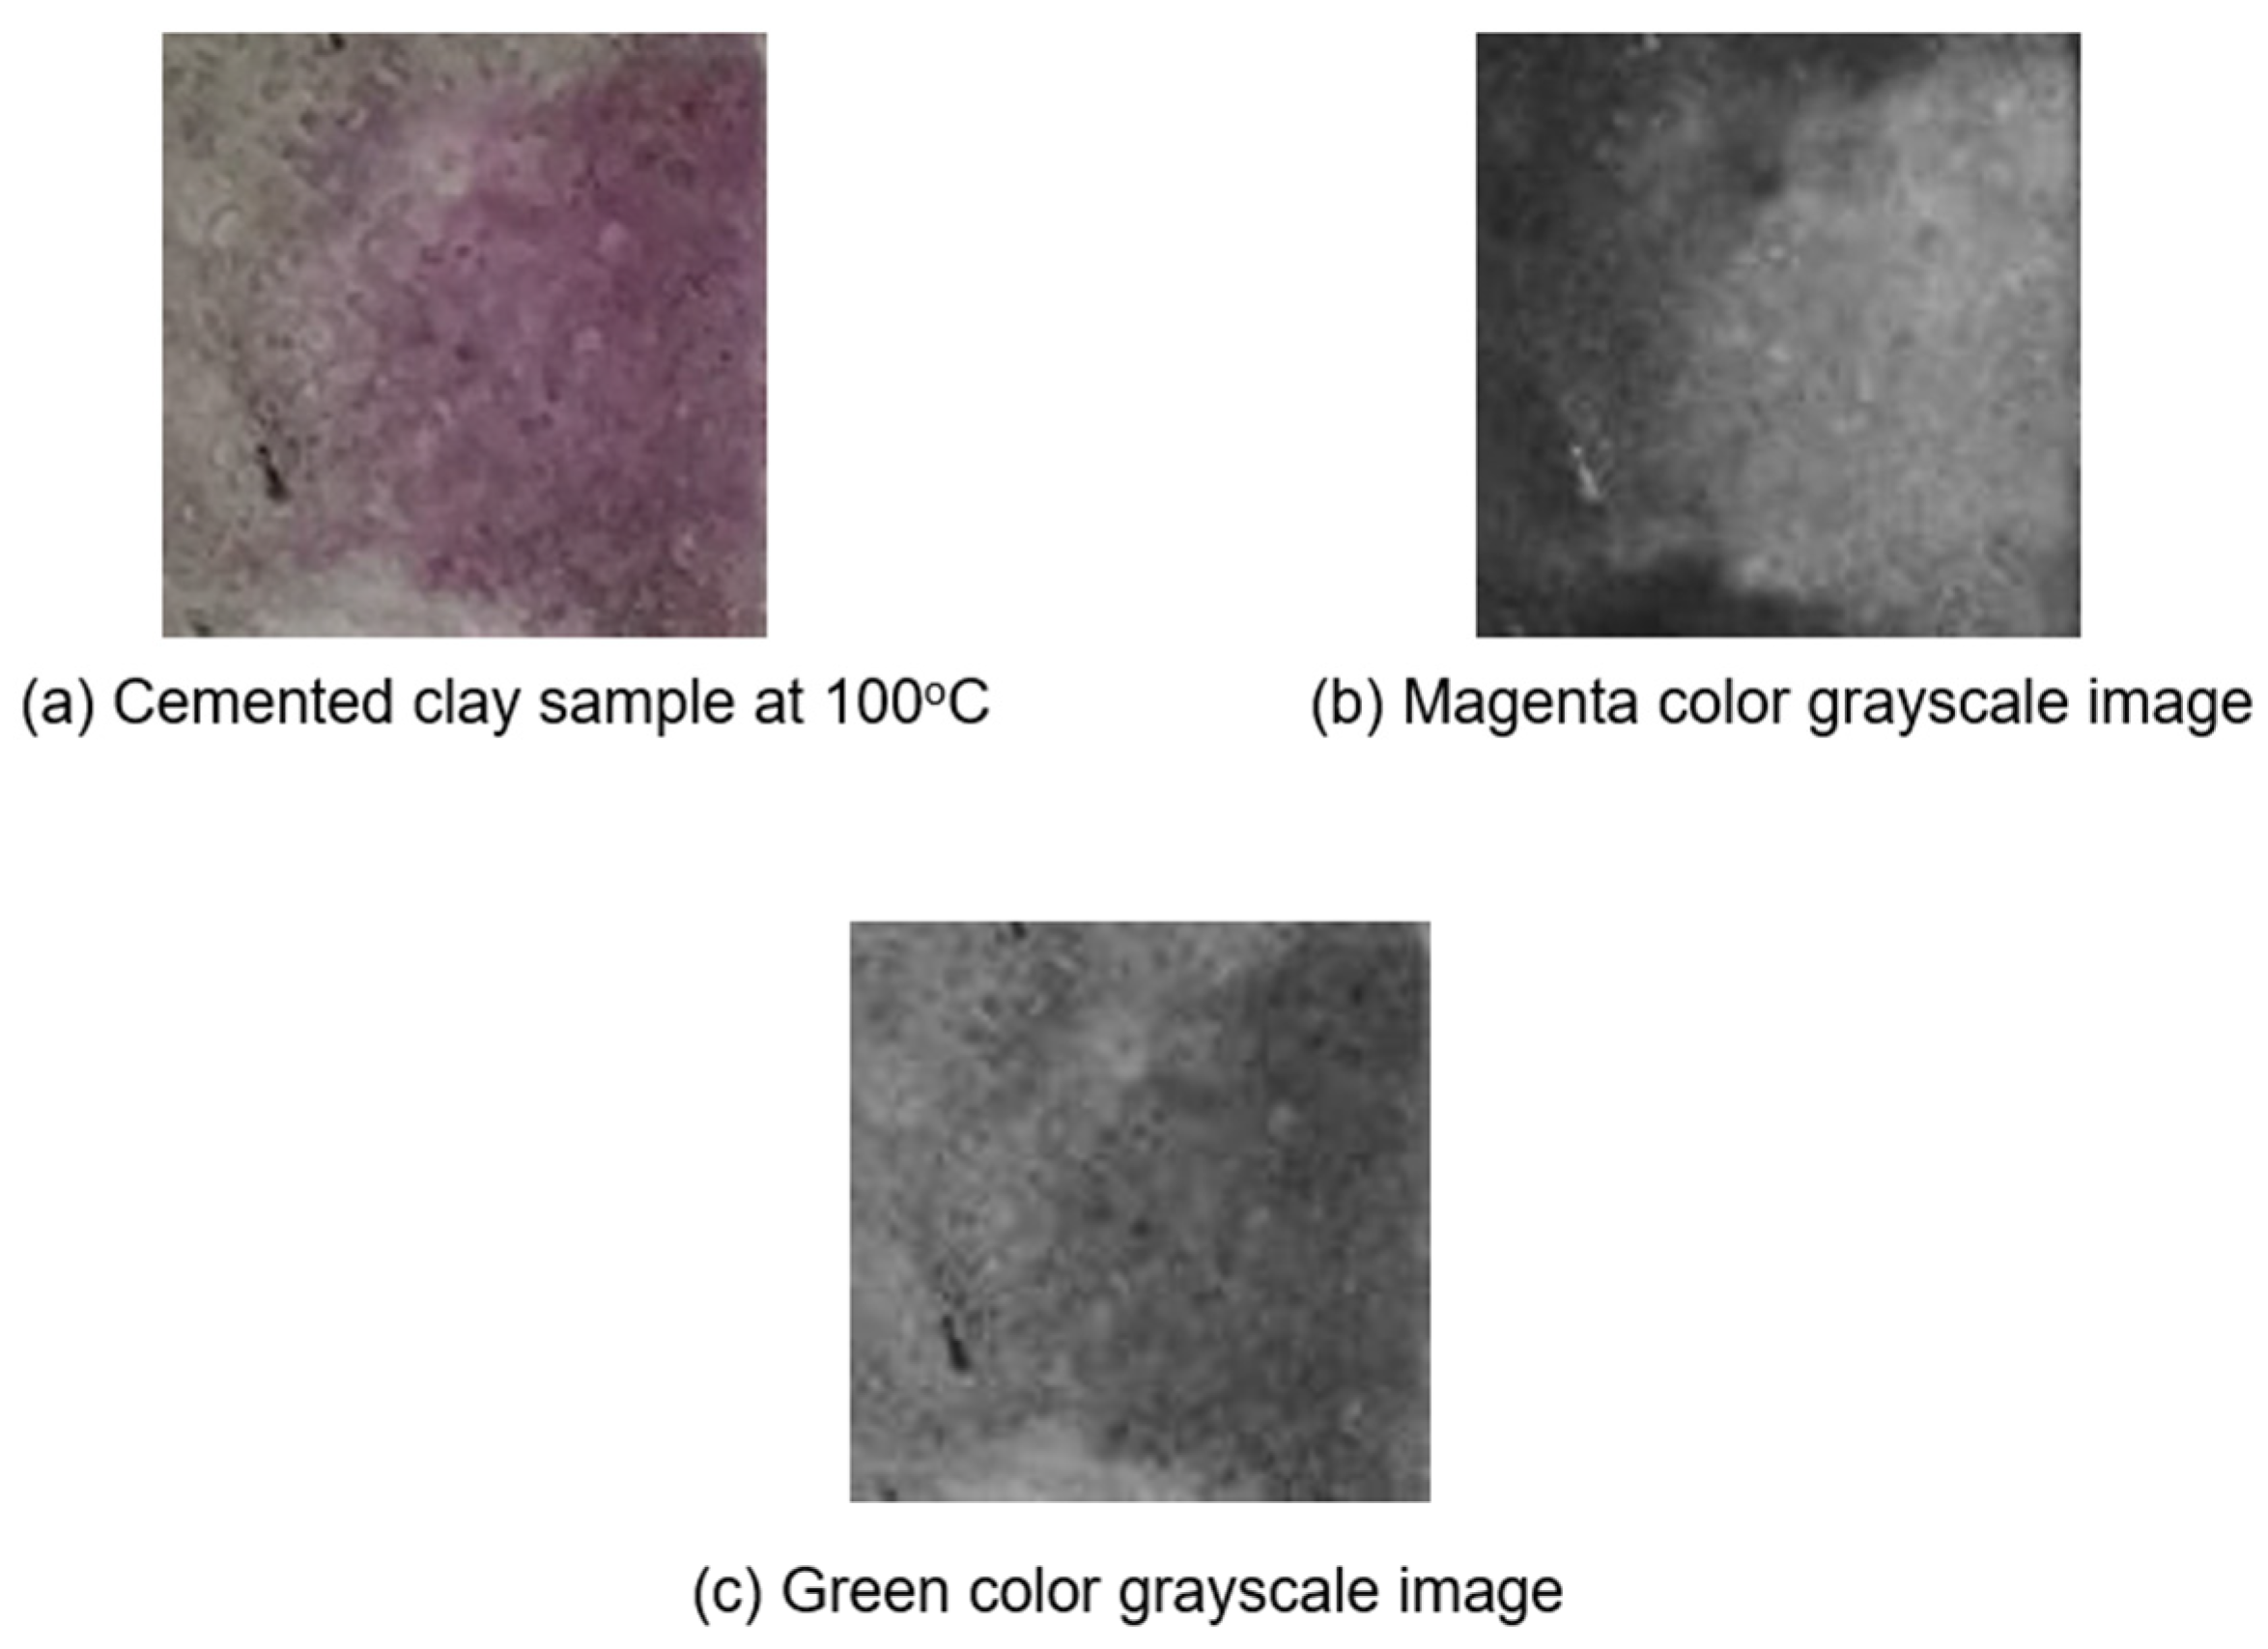
In
Figure 5, a cemented clay sample heated to 100 °C is selected to demonstrate the primary color analysis scheme.
Figure 5a shows a clay sample heated to 100 °C and treated with phenolphthalein solution.
Figure 5b,c show the grayscale extraction of magenta and green, respectively. Upon examination of these grayscale depictions, it is evident that the regions where the phenolphthalein solution imparts a purple hue are characterized by pronounced brightness in the magenta image and predominantly subdued intensity in the green image. Visually,
Figure 5b,c are almost the same in terms of brightness. This observation is critical for analysis.
To initiate the analysis, we compare the entire spectrum of colors extracted from both the RGB and CMYK color models to pinpoint the most representative color for depicting the color changes in samples.
Figure 6 illustrates the average intensity across all colors in the RGB spectrum, and
Figure 7 shows the same average intensity for the CMYK spectrum. As shown, the RGB colors seem to cluster closely (
Figure 6), whereas the CMYK lines are more widely dispersed (
Figure 7). This observation inspired us to examine the primary colors individually.
4. Discussion
It is important to recognize that the two plots (
Figure 6 and
Figure 7) seemingly demonstrate different trends, with RGB curves with slopes moving upward (
Figure 6) and CMYK curves with slopes moving downward (
Figure 7). The upward trend in RGB intensity values can be attributed to its additive color system, which mixes light-based colors and can misinterpret subtle shades. The CMYK model shows a downward trend and functions as a subtractive system, suggesting a more accurate depiction of the color changes caused by carbonation [
40]. This is consistent with the observation of the grayscale images in
Figure 8, which shows the grayscale image representation of all cemented clay samples treated with phenolphthalein solution. It is visually apparent that magenta more accurately depicts the phenolphthalein solution. However, the intensity of magenta is less pronounced than that of the green image.
A careful study of the images in
Figure 3 shows that the bricks with the strongest “pink” color are the bricks at 100 °C and that the bricks at 400 °C are the lightest in “pinkiness”. The color transition is clearly demonstrated in
Figure 6 and
Figure 7, where the slopes are more visible between 100 °C and 400 °C. Thus, this is a limitation of phenolphthalein indicators.
The color extraction values correspond convincingly with the visual changes illustrated in
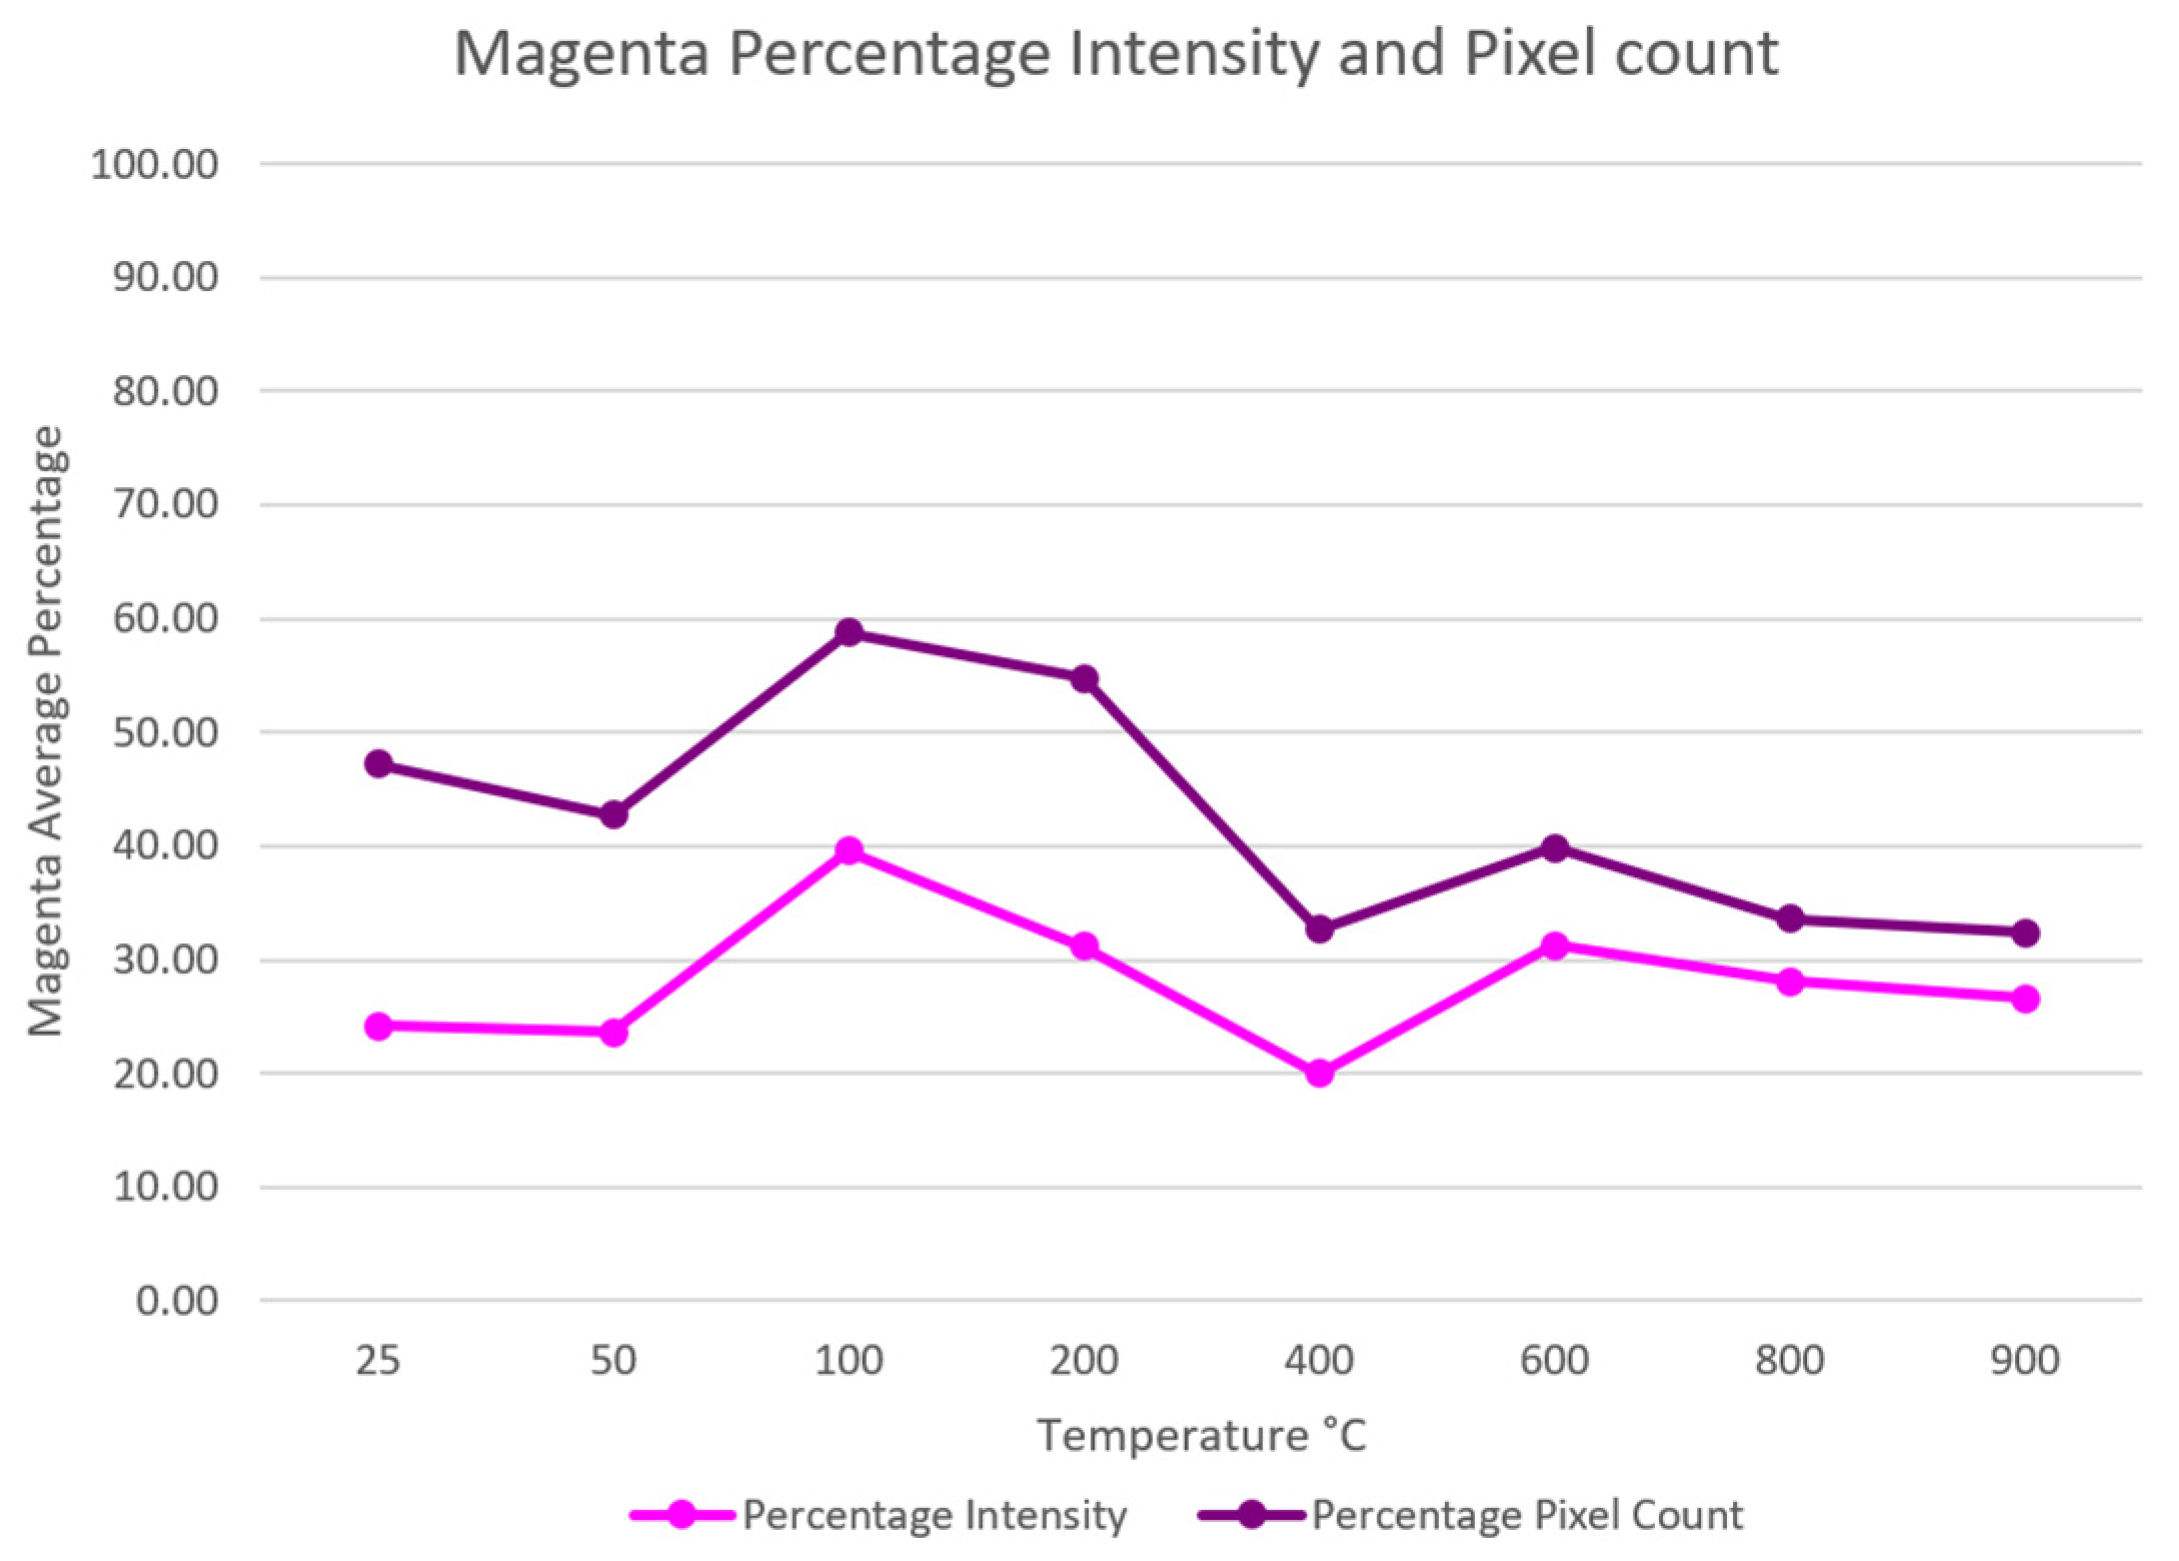
Figure 9, where the maximum and minimum values are presented along with the mean values. To provide further insight into our findings,
Figure 10 offers a comparative analysis of the maximum and average magenta color intensities. Lower values at room temperature likely stem from the fresh concrete having a surface color close to or higher than the upper range detected using phenolphthalein. The higher values observed between 100 °C and 200 °C can be attributed to the decreased acidity of the samples at elevated temperatures [
41]. Furthermore, the transition to lighter colors beyond 400 °C likely occurs because the pH levels approach the limits of phenolphthalein’s detection range or because the higher temperature further reduces the pore water within the speicmens. Further research is necessary because the unexpected light-pink coloration at 400 °C raises the possibility of chemical interactions influencing the performance of phenolphthalein.
Another insightful representation of the color in the sample involves the pixel count. As part of the image processing procedure, the images were resized and standardized to a 100 × 100 pixel size. The count of pixels containing the magenta color is divided by the total number of pixels, yielding the percentage of magenta pixels. To provide a more nuanced understanding, the intensity was quantified as a percentage by dividing the extracted intensity by 255, which represents the maximum intensity value. The percentage values for both the pixel count and intensity pertaining to the magenta color are visually depicted in
Figure 10.
In
Figure 11, the green color intensity of the samples at different temperatures is shown using RGB analysis. Although this green intensity graph falls short of providing the range of color intensity as the magenta color, it does provide a good representation of the variations in phenolphthalein color within the samples between 100 °C to 400 °C. The maximum and minimum values are presented along with the mean values in
Figure 11.
To determine the statistical significance of the primary color analysis, the coefficient of variance (COV) for both magenta and green colors was calculated and is presented in
Figure 12, which shows that the magenta color has higher COV values than the green color. This deviation may be attributed to the inhomogeneity of the solution spread across the surface of the specimens.
It is not known why the 400 °C specimens have the lightest color; nonetheless, the results of the digital color analysis clearly show that the primary color intensity can be a useful tool for enhancing the visual inspection process for quantifying the carbonation level of cemented material exposed to elevated temperatures. The outcome of the current study suggests a nondestructive and nonintrusive method to evaluate the degree of carbonation of cementitious building materials with the potential to speculate the degree of burning (heat exposure) of the material [
33].
Figure 13 summarizes the nonintrusive inspection process. Because burnt surfaces are not necessarily without other burnt materials such as paint (
Figure 13a), hence it is necessary to pre-clean the surfaces by removing the burnt patches or debris. It is also important to select the most representative surfaces for image processing, preferably the strongest color contrasts.
Even though the current study showed more reactions of phenolphthalein in the temperature range between 100 °C to 400 °C, previous studies showed that phenolphthalein has been used to investigate temperatures ranging from 20 °C to 1000 °C [
42,
43]. Further studies should be conducted to identify other color indicators that can help evaluate higher temperatures, such as Alizarin Yellow R. or Thymol Blue [
27]. It is also critical to recognize the suggestion by Iwama et al. (2022) [
44] regarding the importance of carbonation, decarbonation, and re-carbonation of cementitious materials under high-temperature cycles.


 ,
, 


