Article

Stabilization of Clay Subgrade Soil by Using Waste Foundry Sand with a Geogrid

by
Qais Sahib Banyhussan
1,
Jaafar Abdulrazzaq
1,
Ahmed A. Hussein
2,
Anmar Dulaimi
3,4,5,*,
Jorge Miguel de Almeida Andrade
6 and
Luís Filipe Almeida Bernardo
6
1
Highway and Transportation Department, Engineering College, Mustansiriyah University, Baghdad 10052, Iraq
2
School Building Department, Ministry of Education, Baghdad 10082, Iraq
3
Department of Civil Engineering, College of Engineering, University of Kerbala, Karbala 56001, Iraq
4
School of Civil Engineering and Built Environment, Liverpool John Moores University, Liverpool L3 2ET, UK
5
College of Engineering, University of Warith Al-Anbiyaa, Karbala 56001, Iraq
6
GeoBioTec, Department of Civil Engineering and Architecture, University of Beira Interior, 6201-001 Covilhã, Portugal
*
Author to whom correspondence should be addressed.
CivilEng 2025, 6(2), 26; https://doi.org/10.3390/civileng6020026
Submission received: 3 March 2025 / Revised: 25 April 2025 / Accepted: 7 May 2025 / Published: 10 May 2025
(This article belongs to the Section Geotechnical, Geological and Environmental Engineering)

Abstract

:
Various stabilizers, such as jute, gypsum, rice-husk ash, fly ash, cement, lime, and discarded rubber tires, are commonly used to improve the shear strength and overall characteristics of clay subgrade soil. In this study, waste foundry sand (WFS) is utilized as a stabilizing material to enhance the properties of clay subgrade soil and strengthen the bond between clay subgrade soil and subbase material. The materials employed in this study include Type B subbase granular materials, clay subgrade soil, and 1100 Biaxial Geogrid for reinforcement. The clay subgrade soil was collected from the airport area in the Al-Muthanna region of Baghdad. To evaluate the effectiveness of WFS as a stabilizer, soil specimens were prepared with varying replacement levels of 0%, 5%, 10%, and 15%. This study conducted a Modified Proctor Test, a California Bearing Ratio test, and a large-scale direct shear test to determine key parameters, including the CBR value, maximum dry density, optimum moisture content, and the compressive strength of the soil mixture. A specially designed large-scale direct shear apparatus was manufactured and utilized for testing, which comprised an upper square box measuring 20 cm × 20 cm × 10 cm and a lower rectangular box with dimensions of 200 mm × 250 mm × 100 mm. The findings indicate that the interface shear strength and overall properties of the clay subgrade soil improve as the proportion of WFS increases.

1. Introduction

Soil stabilization is an essential engineering technique that aims to improve the properties of subgrade soil, enhancing its performance under pavement loading and mitigating issues such as settlement, excessive compressibility, and low shear strength. Mechanical stabilization, which introduces materials to the soil, and chemical stabilization, which relies on chemical reactions among particles of soil and added substances, are the two main ways to accomplish this procedure [1].
Solid waste management has become a critical global issue due to the rising volumes of waste materials and industrial byproducts. With the scarcity of landfill space and the escalating costs associated with it, the recycling and repurposing of industrial waste products and waste materials have emerged as appealing alternatives to traditional disposal methods [2]. There are various types of industrial waste products and waste materials, and their use in applications such as concrete or soil not only offers economic benefits but also addresses disposal challenges. One of these byproducts is waste foundry sand (WFS), which is generated by metallic and nonmetallic metal casting industries. Foundries typically recycle and reuse the sand multiple times within their operations. However, once the sand cannot be utilized anymore, it is discarded and classified as WFS. Previous studies have shown that WFS can enhance the properties of clay subgrade soil [3,4]. Hence, WFS is used in this study.
The second element used in this study to improve the connect shear strength between the clay subgrade soil and subbase soil is a geogrid. Many engineering purposes are served by geosynthetic products, such as geotextiles, geonets, geogrids, geofoams, geomembranes, geosynthetic clay liners, geopipes, and geocomposites of them. Geogrids work especially well for stabilizing the subgrade in situations using flexible pavement. Materials like polypropylene, nylon, and polyethylene are used to make geogrids, which are then heated, extruded, and cooled to take on their final shape. Compared to other geosynthetic materials, they are appropriate for withstanding tensile stress because of their excellent tensile strength and stiffness. Using geogrids in road pavements can reduce vertical and lateral deformation and increase the bearing capacity and the lateral confinement of the pavement [5,6].
When designing reinforced pavements, interface parameters like soil cohesion and friction angle are crucial. When designing soil-reinforcing structures, two main failure modes are taken into account: direct shear failure at the soil–geosynthetic-support contact and pullout failure, which is caused by insufficient anchorage. Since the direct shear test accurately replicates the contact between soil and the synthetic reinforcement, this paper will focus on the direct shear failure mode. Several studies have investigated different aspects of soil–geosynthetic interactions. For example, Mendes et al. [7] analyzed how the in-soil load–strain behavior is influenced by the condition of geotextile materials, while Mohammad et al. [8] and Nazzal et al. [9] focused on evaluating the mechanical behavior of reinforced pavement materials under repeated and cyclic loading conditions. Nareeman and Fattah [10] studied the effects of reinforcement on the shear strength and settlement behavior of cohesive-frictional soils. Additionally, Ferreira et al. [11] and Vieira et al. [12] conducted experimental work to characterize the shear strength parameters at soil–geogrid and soil–geotextile interfaces under various loading scenarios. Also, Banyhussan et al. [13] provided insights into large-scale shear testing of subbase–subgrade interfaces, highlighting the importance of interface behavior in pavement applications.
It should also be emphasized that, in addition to physical and chemical stabilization methods, bio-mediated approaches—particularly microbial-induced calcite precipitation (MICP)—have gained significant attention in recent years. These techniques offer environmentally friendly alternatives that improve soil strength by promoting calcium carbonate precipitation through microbial activity. Studies have shown the successful application of MICP in improving the physico-mechanical properties of sandy soils [14] (Sharaky et al., 2018), and in enhancing the shear strength of soil–structure interfaces [15] (Bak et al., 2021). A comprehensive review by Xiao et al. (2022) [16] also highlights the potential of biocemented soils for sustainable ground improvement. While the current study does not explore MICP directly, acknowledging these developments provides a broader context for sustainable geotechnical solutions.
There is still a significant research gap regarding the shear resistance of soil–geogrid boundaries under different subgrade soil density and moisture conditions, despite the fact that many experimental studies have evaluated the shear properties of these interfaces. Soil–geogrid–subbase interactions will be specifically examined in this study as it examines and derives the interface shear properties for various density and water content cases in clay subgrade soil with different percentages of WFS (0%, 5%, 10% and 15% from clay subgrade soil).

2. Literature Review

With an increasing need for sustainable construction techniques, the application of waste materials in soil stabilization has attracted a lot of attention lately. The main studies that examine how foundry sand affects the geotechnical properties of soil are compiled in this review of the literature. Abichou et al. [17] investigated the potential of WFS as a hydraulic barrier. The purpose of the study was to determine whether particular factors needed to be taken into consideration when constructing hydraulic barriers using foundry green sand obtained from various sources. Field tests and laboratory experiments were used to assess hydraulic conductivity. Field investigations used sealed double-ring infiltrometers (SDRIs) and two-stage borehole (TSB) permeameters, while the laboratory used flexible-wall permeameters for falling head tests. According to the findings, for foundry sand to function as a hydraulic barrier, it must have a plasticity index greater than 3, a liquid limit above 20, and a hydraulic conductivity lower than 10−7 cm/s, with at least 6% bentonite by weight.
Sharma and Kumar [18] evaluated the effects on the subgrade characteristics of combining clayey soil with fly ash and WFS. The study used WFS from Nahan Foundry and locally accessible clay that was categorized as medium plasticity (CL). Specific gravity, consistency limits, hydrometer analysis, California Bearing Ratio (CBR), and standard proctor tests were among the laboratory tests conducted. The results showed that up to 40% of the sand content raised the highest dry density of clay-foundry mixtures with sand, after which it fell. The mixtures demonstrated potential for use in subgrade construction, as shown by an improvement in CBR values—from 2.44% for untreated soil to 5.10% for the treated soil. Because of the fact that foundry sand is coarser than clay, the ideal moisture content dropped when it was added.
Kumar et al. [19] investigated the viability of stabilizing subgrade soil with fines from WFS that had been sieved through a 10 mm screen. A number of tests, including CBR, plastic limit, direct shear, the maximum dry density (MDD), and liquid limit, were performed after different percentages of WFS (5%, 10%, 15%, and 20%) were added to the soil. According to the study, adding WFS reduced the liquid limit, which in turn helped to lessen drying shrinkage and crack width in clayey soil. By adding WFS, the CBR value rose notably from 8.9 to 18.21, and the angle of friction improved from 22 to 28 degrees, demonstrating an overall improvement in soil properties.
The literature review emphasizes the potential of WFS as a useful soil stabilization additive. The geotechnical characteristics of clayey soils are significantly improved by WFS, increasing their suitability for use in building applications. The results lend credence to the idea that recycling industrial waste helps with sustainable engineering practices in addition to addressing disposal issues. This study proposes a novel experimental framework that integrates the use of WFS as a stabilizer with geogrid reinforcement to enhance clay subgrade soils. A custom-designed large-scale direct shear apparatus is employed to simulate realistic field conditions, allowing for the accurate evaluation of soil–geogrid–subbase interaction. By varying the WFS content, moisture levels, and compaction degrees, this study provides a comprehensive insight into interface shear strength behavior—an area that has received limited attention in the literature.

3. Material Used

3.1. Subbase Material

Subbase granular materials were taken from the Sabeaa Al-Bour location within Baghdad city with Type B (SGM). Table 1 presents the gradation of SGM used for subbase construction. The chemical analysis and physical properties of SGM are listed in Table 2. Based on the sieve data (Table 1), less than 50% passes the 0.075 mm sieve (14.3%), and the soil is coarse-grained. Also, given that more than 50% passes the 4.75 mm sieve (i.e., it is mostly sand) and the gradation appears poorly graded (some jumps in passing % values), the soil can be classified as SP (Poorly Graded Sand) according to the Unified Soil Classification System (USCS).

3.2. Clay Subgrade Soil Layer

The clay subgrade soil was the same as that existing in the Airport of Al-Muthanaa region in Baghdad. Table 3 illustrates the clay properties of subgrade soil. Figure 1 shows the compaction curve. Based on the Atterberg limits (LL = 32%, PL = 21%), Table 3, and grain size distribution, the subgrade soil can be classified as a low-plasticity clay (CL) according to the Unified Soil Classification System (USCS).

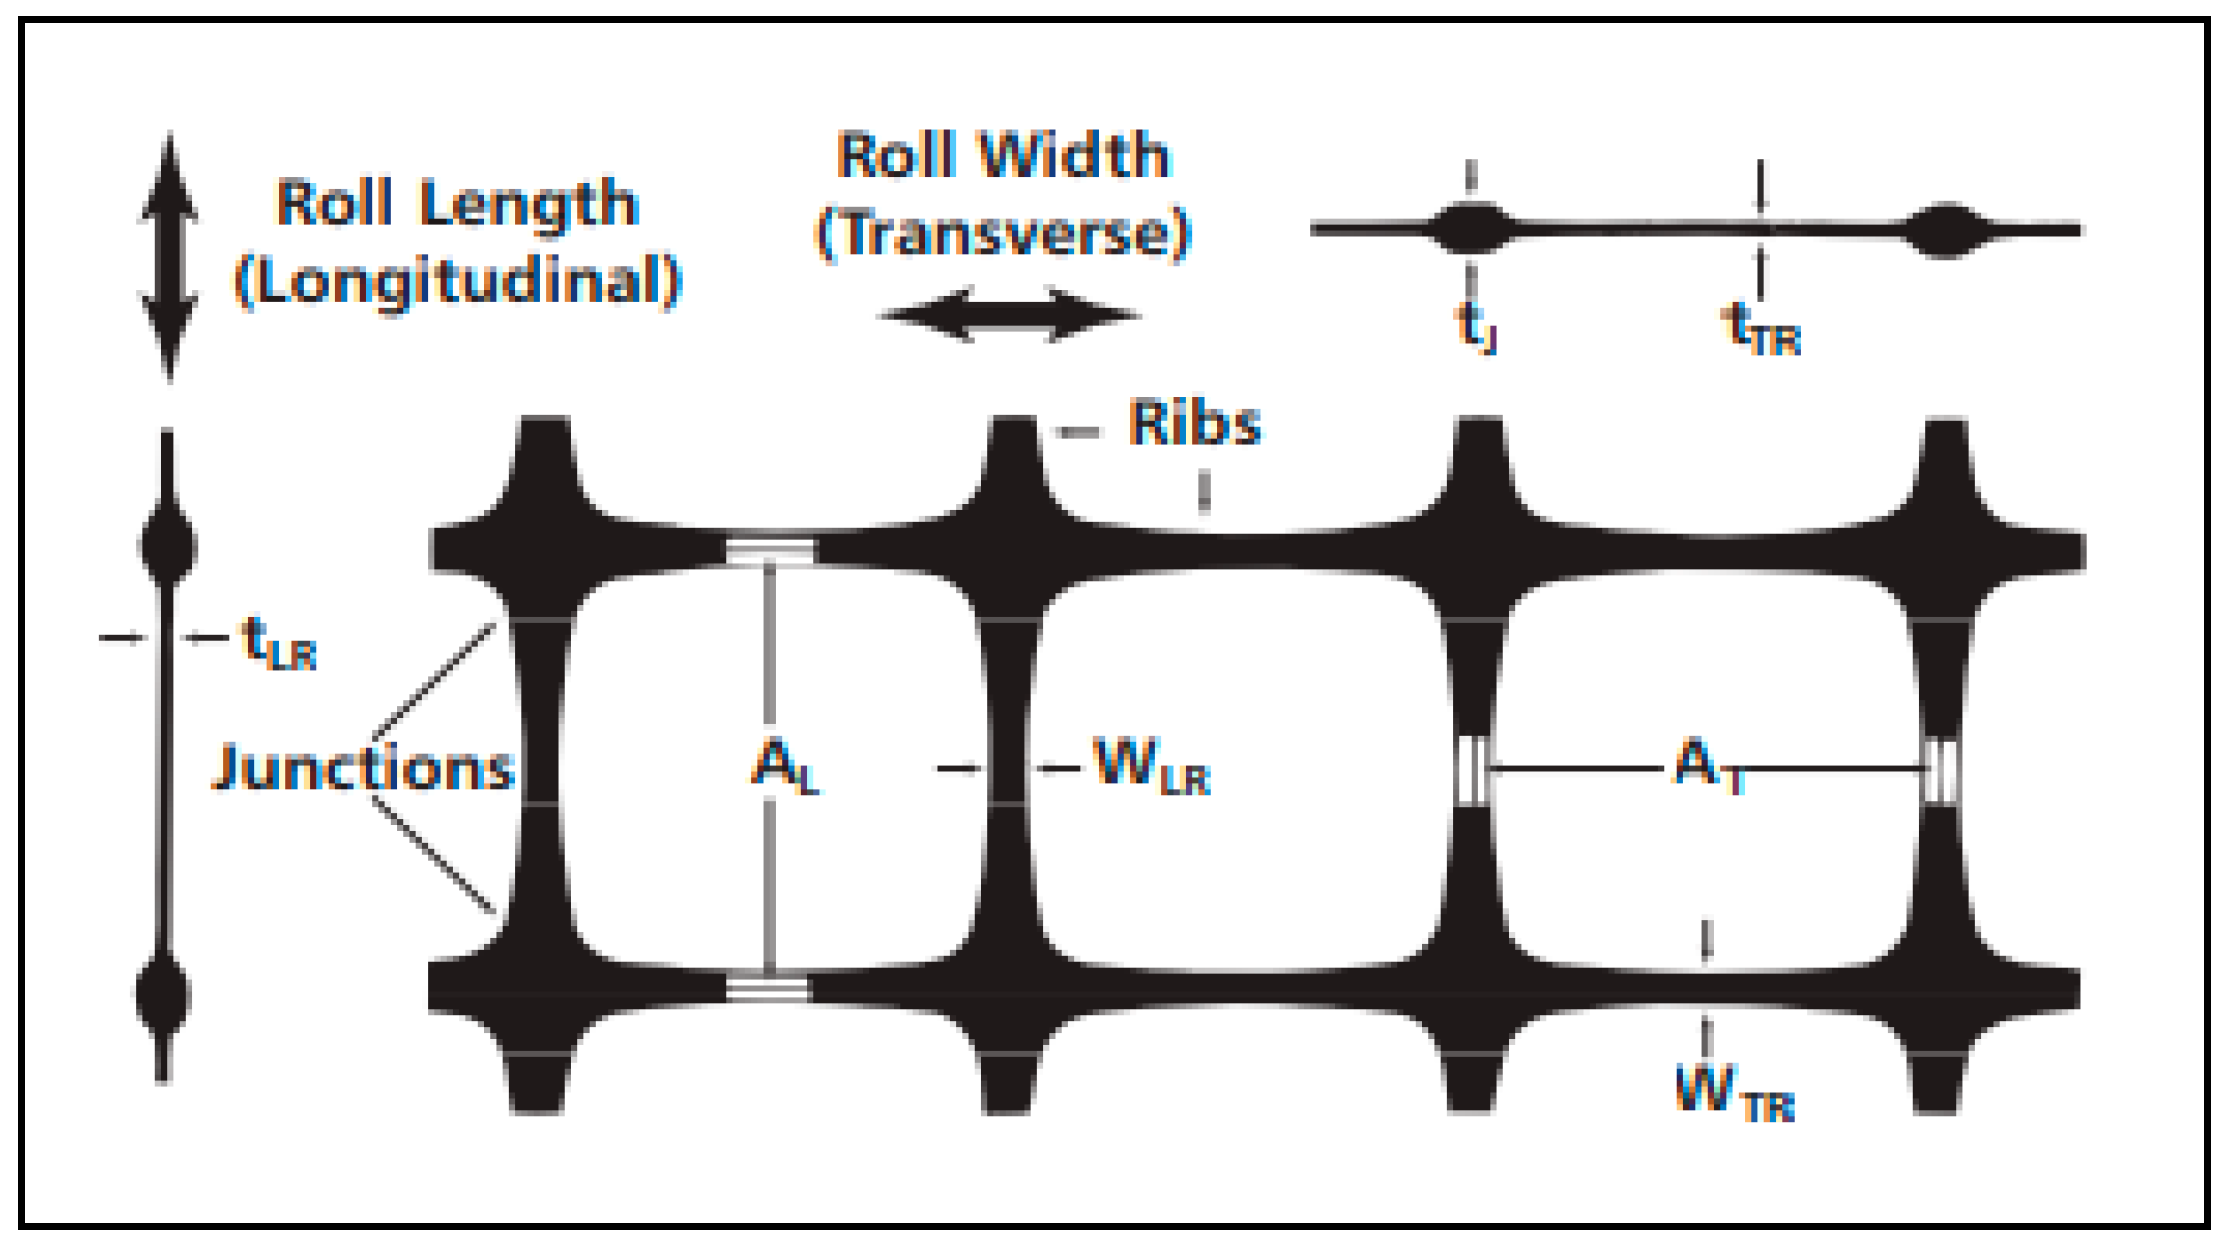
3.3. Biaxial Geogrid BX1100 (G1)

The reinforcement used in this study is the Biaxial Geogrid BX1100 (G1), manufactured by Tensar International (see Figure 2 and Figure 3). This geogrid is made from polypropylene and features a rectangular rib structure. The key properties are summarized in Table 4.

3.4. Waste Foundry Sand

Metal foundries utilize significant quantities of sand in the metal casting process. These foundries often recycle and reuse the sand multiple times within their operations. However, once the sand is no longer suitable for reuse, it is discarded and referred to as WFS. WFS consists of high-quality, identical silica sand, which is primarily used to create molds and cores for both metallic and nonmetallic metal castings. Typically, WFS is composed of less than 5% sea coal, more than 80% high-purity silica sand, 2–5% water, and 5–10% bentonite clay. The metal casting industry generates approximately 100 million tons of WFS annually. The physical and chemical properties of WFS largely depend on the specific casting process and the sector of the industry from which it is derived.

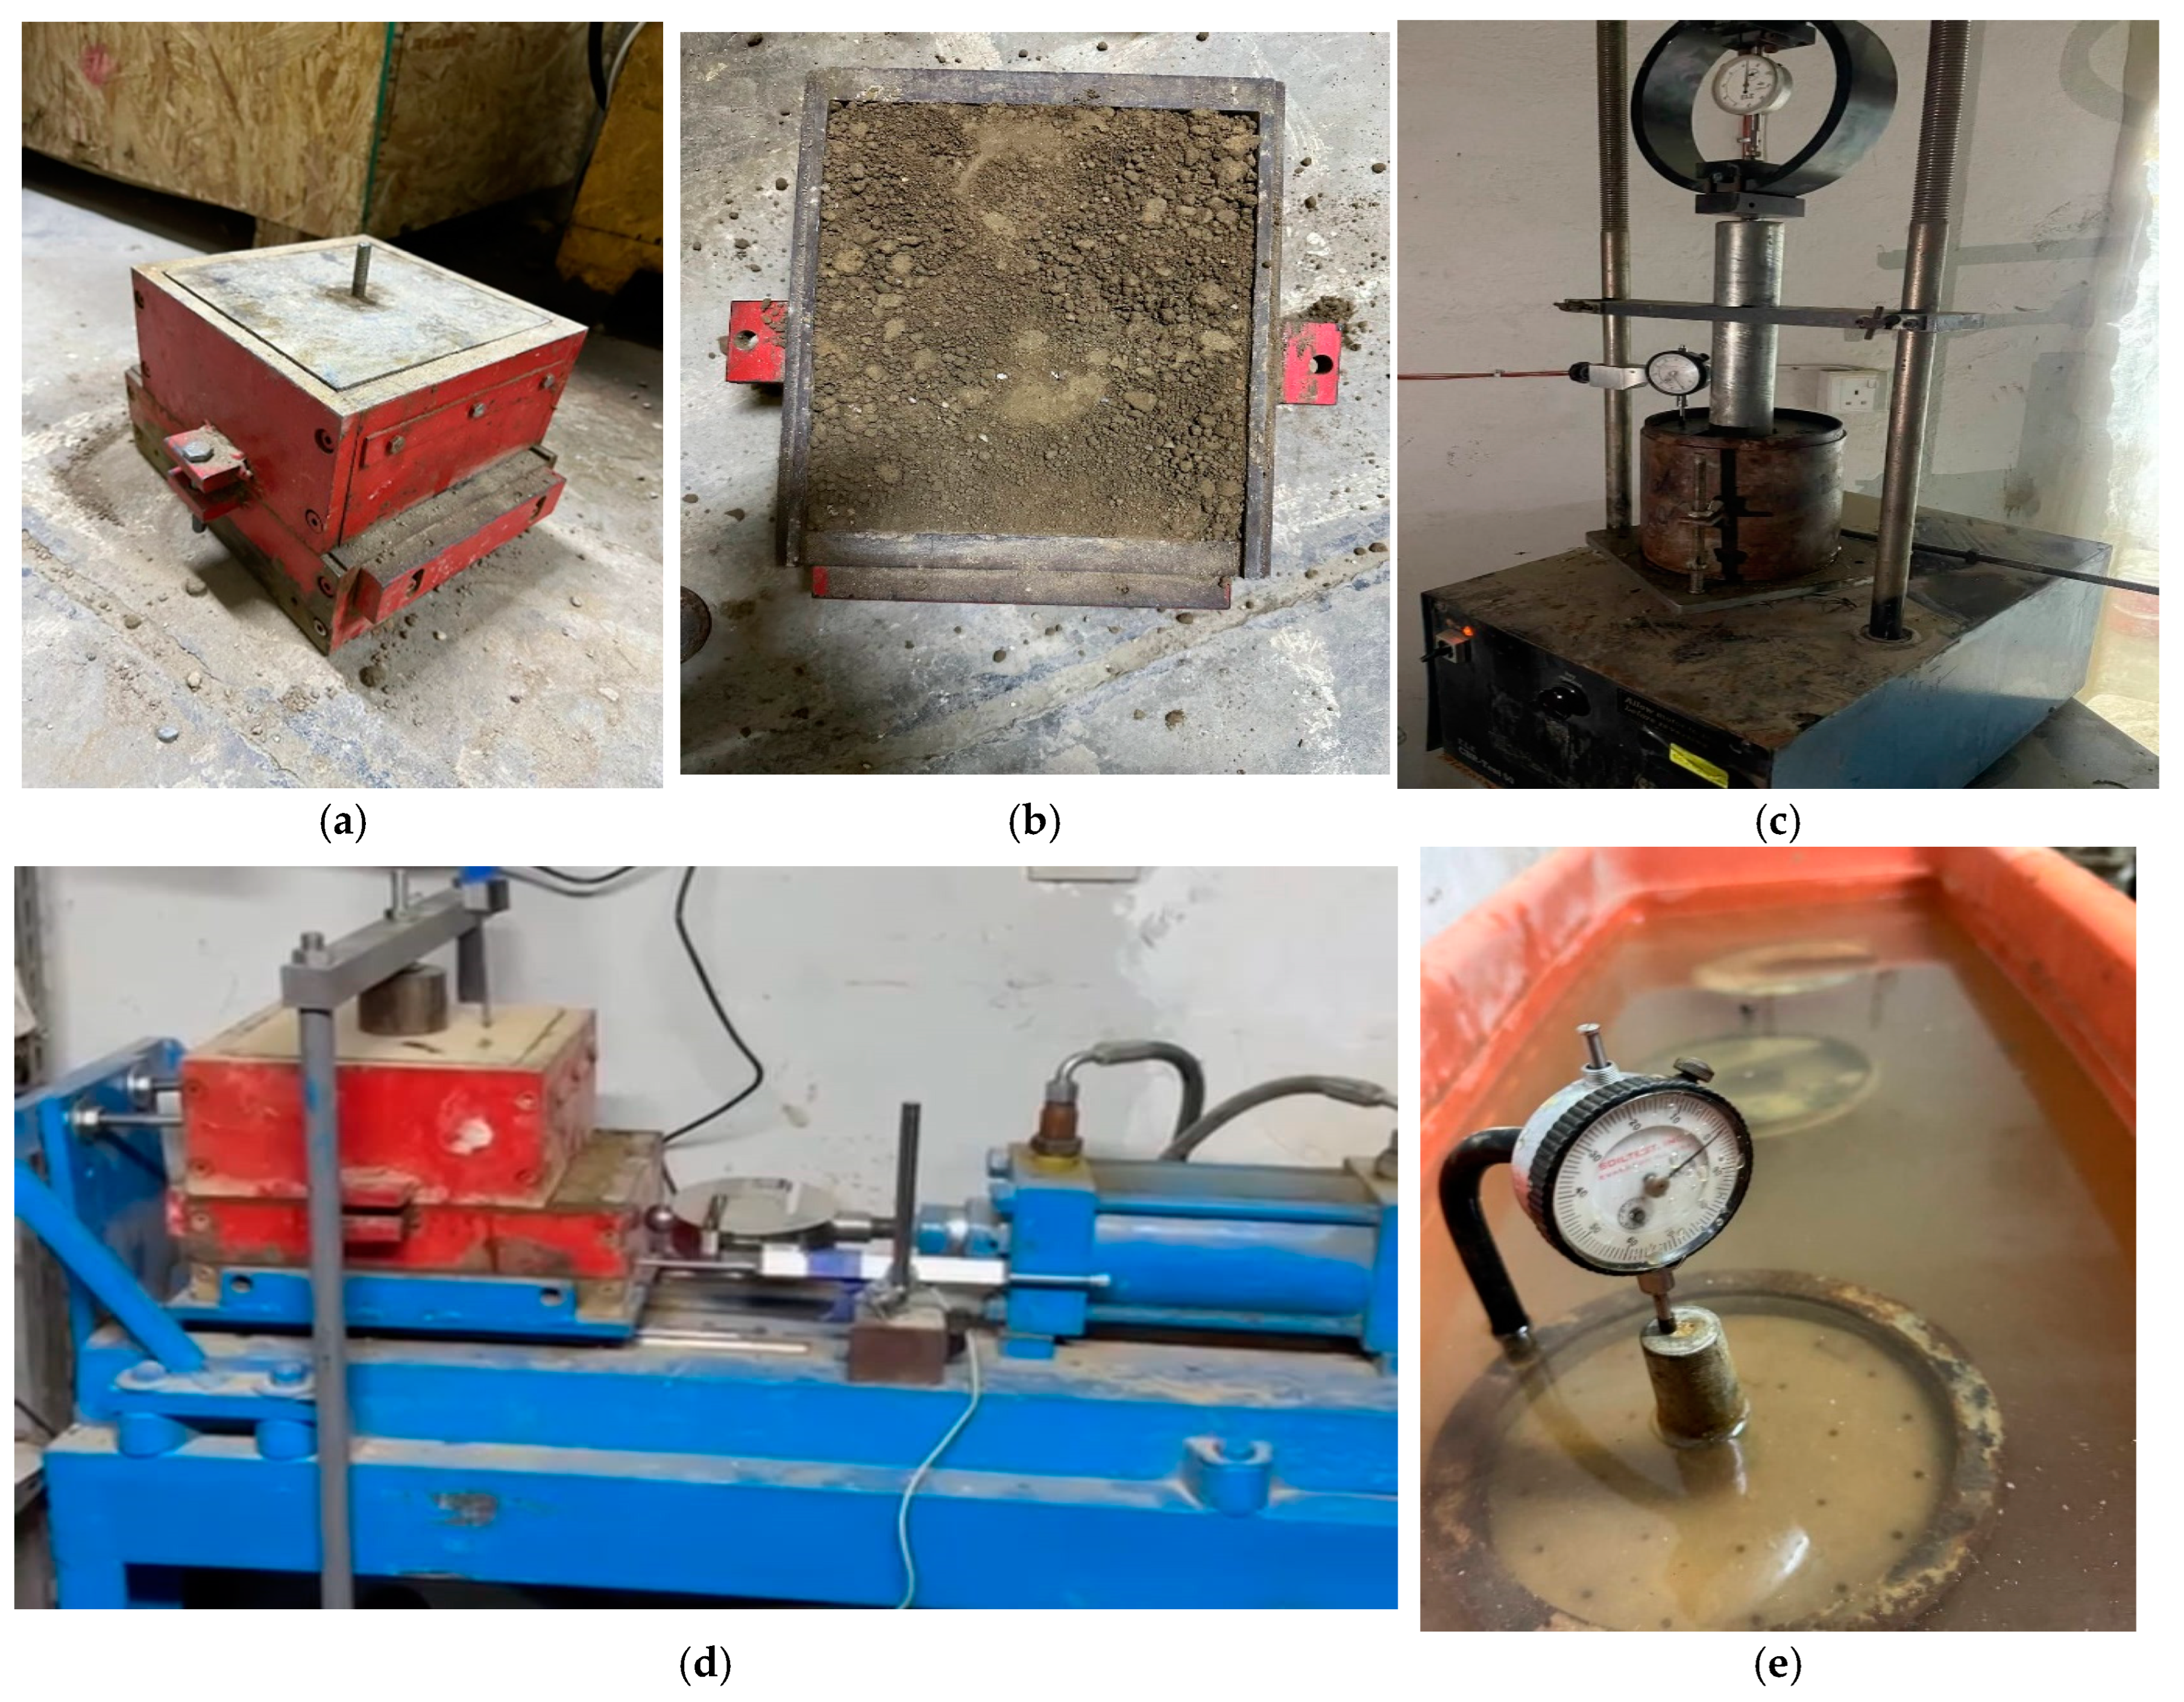
4. Laboratory Testing Program

4.1. Standard Proctor Compaction Test

The test of Proctor compaction is a standard laboratory process used to experimentally identify the optimal moisture content at which a particular soil type reaches its maximum density and achieves its highest dry density. These tests typically involve compacting soil at recognized moisture levels into a cylindrical mold with standardized dimensions, using a controlled amount of compaction effort. The soil is compacted in several equal layers, with each layer subjected to a set number of blows (usually 25) from a hammer of standard weight dropped from a specified height. This procedure is repeated for different moisture contents, and then the dry density is calculated for each case. The relationship between dry density and moisture content is later displayed to create the compacting curve. The peak point of this curve indicates the maximum dry density, and the corresponding moisture content at this point is identified as the optimal moisture content.

4.2. California Bearing Ratio Test

The CBR test is a penetration test used to assess the mechanical strength of base courses, subgrades, natural ground, and roadway construction. The standard field test involves measuring the pressure required to penetrate soil or aggregate using a plunger of specified cross-sectional area. This measured pressure is then compared to the pressure essential to achieve the same penetration in a standard crushed stone material. The CBR value was originally developed to evaluate the bearing capacity of soils for road construction. However, it can also be applied to determine the load-bearing capacity of unpaved airstrips or soils beneath paved airstrips. The CBR value increases with surface hardness. For example, tilled farmland has a CBR of 3, whereas turf or moist clay has a CBR of 4.75. Moist sand could have a CBR of 10. Good quality crushed rock typically has a CBR exceeding 80. The reference material for this test is crushed California limestone, which is assigned a CBR value of 100. As a result, it is not uncommon to encounter CBR values above 100 in highly compacted areas. The CBR value was calculated using Equation (1), where σ and σst are the stress and standard stress at 2.5 and 5 mm, respectively.
CBR% = σ\σst

4.3. Direct Shear Test

The primary target of using the test for the direct shear is to evaluate the shear parameters of the interaction surface between clay subgrade and subbase soil with geogrid and different values of water content and degrees of compaction of clay subgrade soil at different percentages of WFS. The shear parameters are the cohesion (c) between clay and subbase soil and the angle of friction (φ) in the case without geogrid, while in the case of soil reinforced by the geogrid, the parameters are adhesion (ca) between the soil and geogrid and the (δ) angle of friction. The shear strength (π) is calculated using Equations (2) and (3) without and with the geogrid, respectively, where σ is the normal applied stress.
π = c + σ tanφ
π = ca + σ tanδ

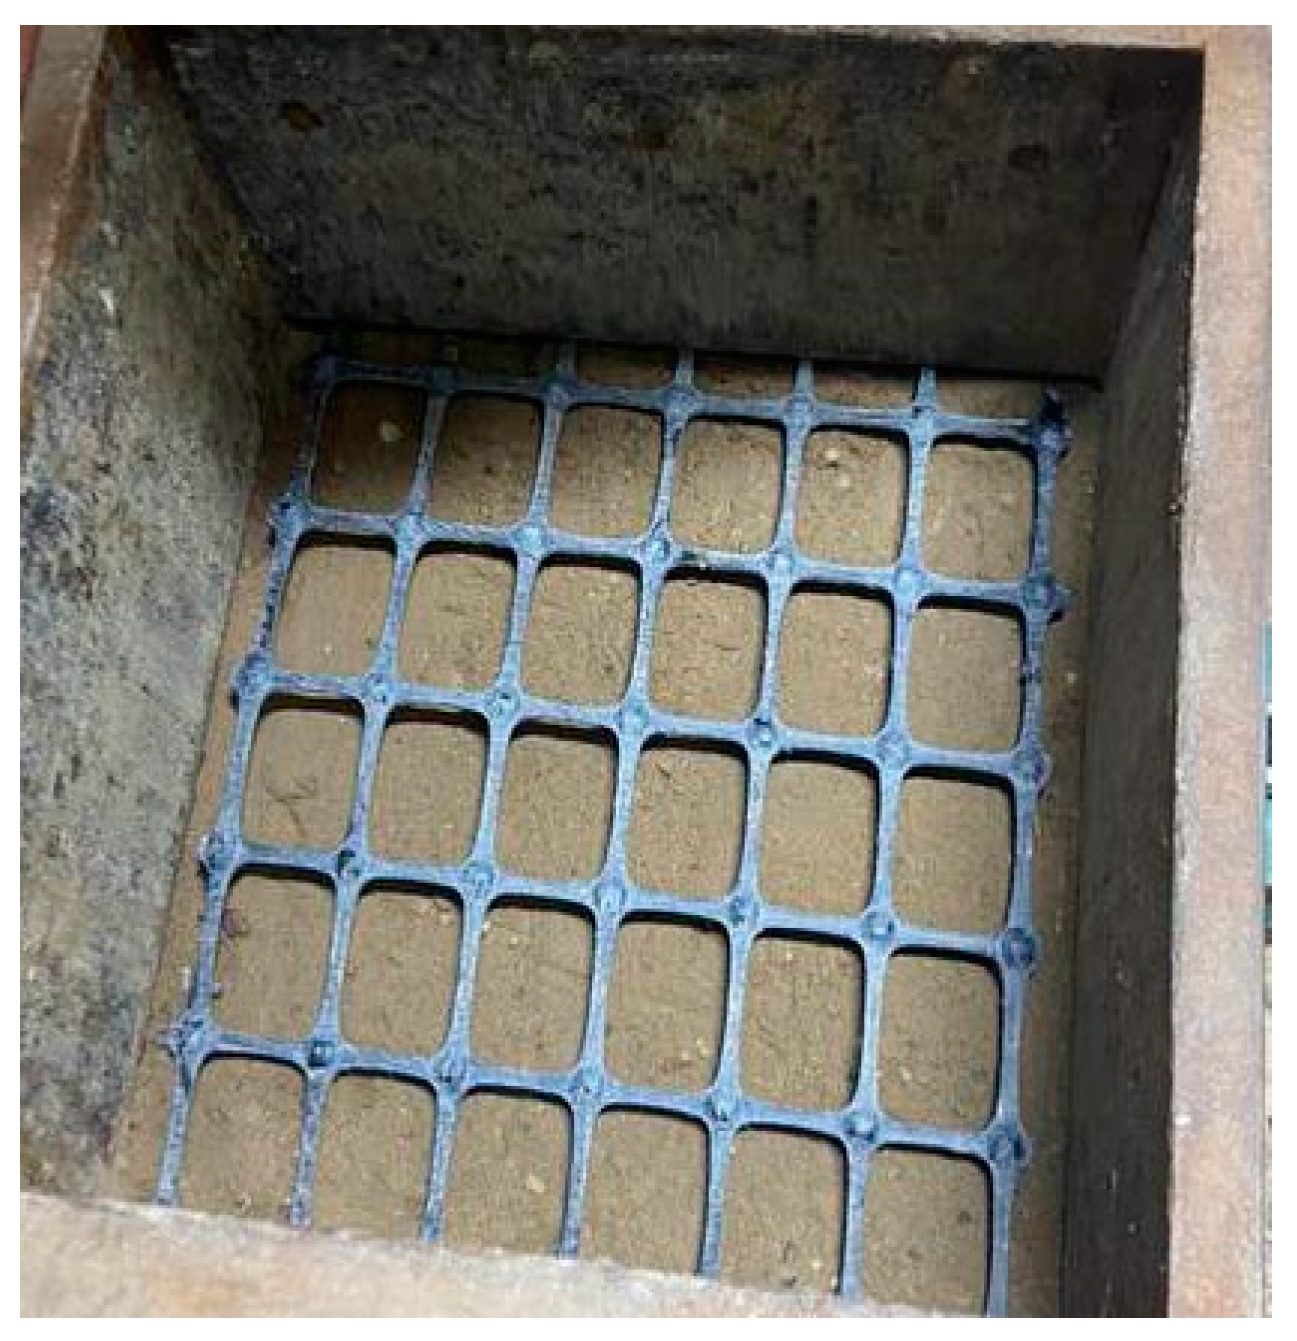
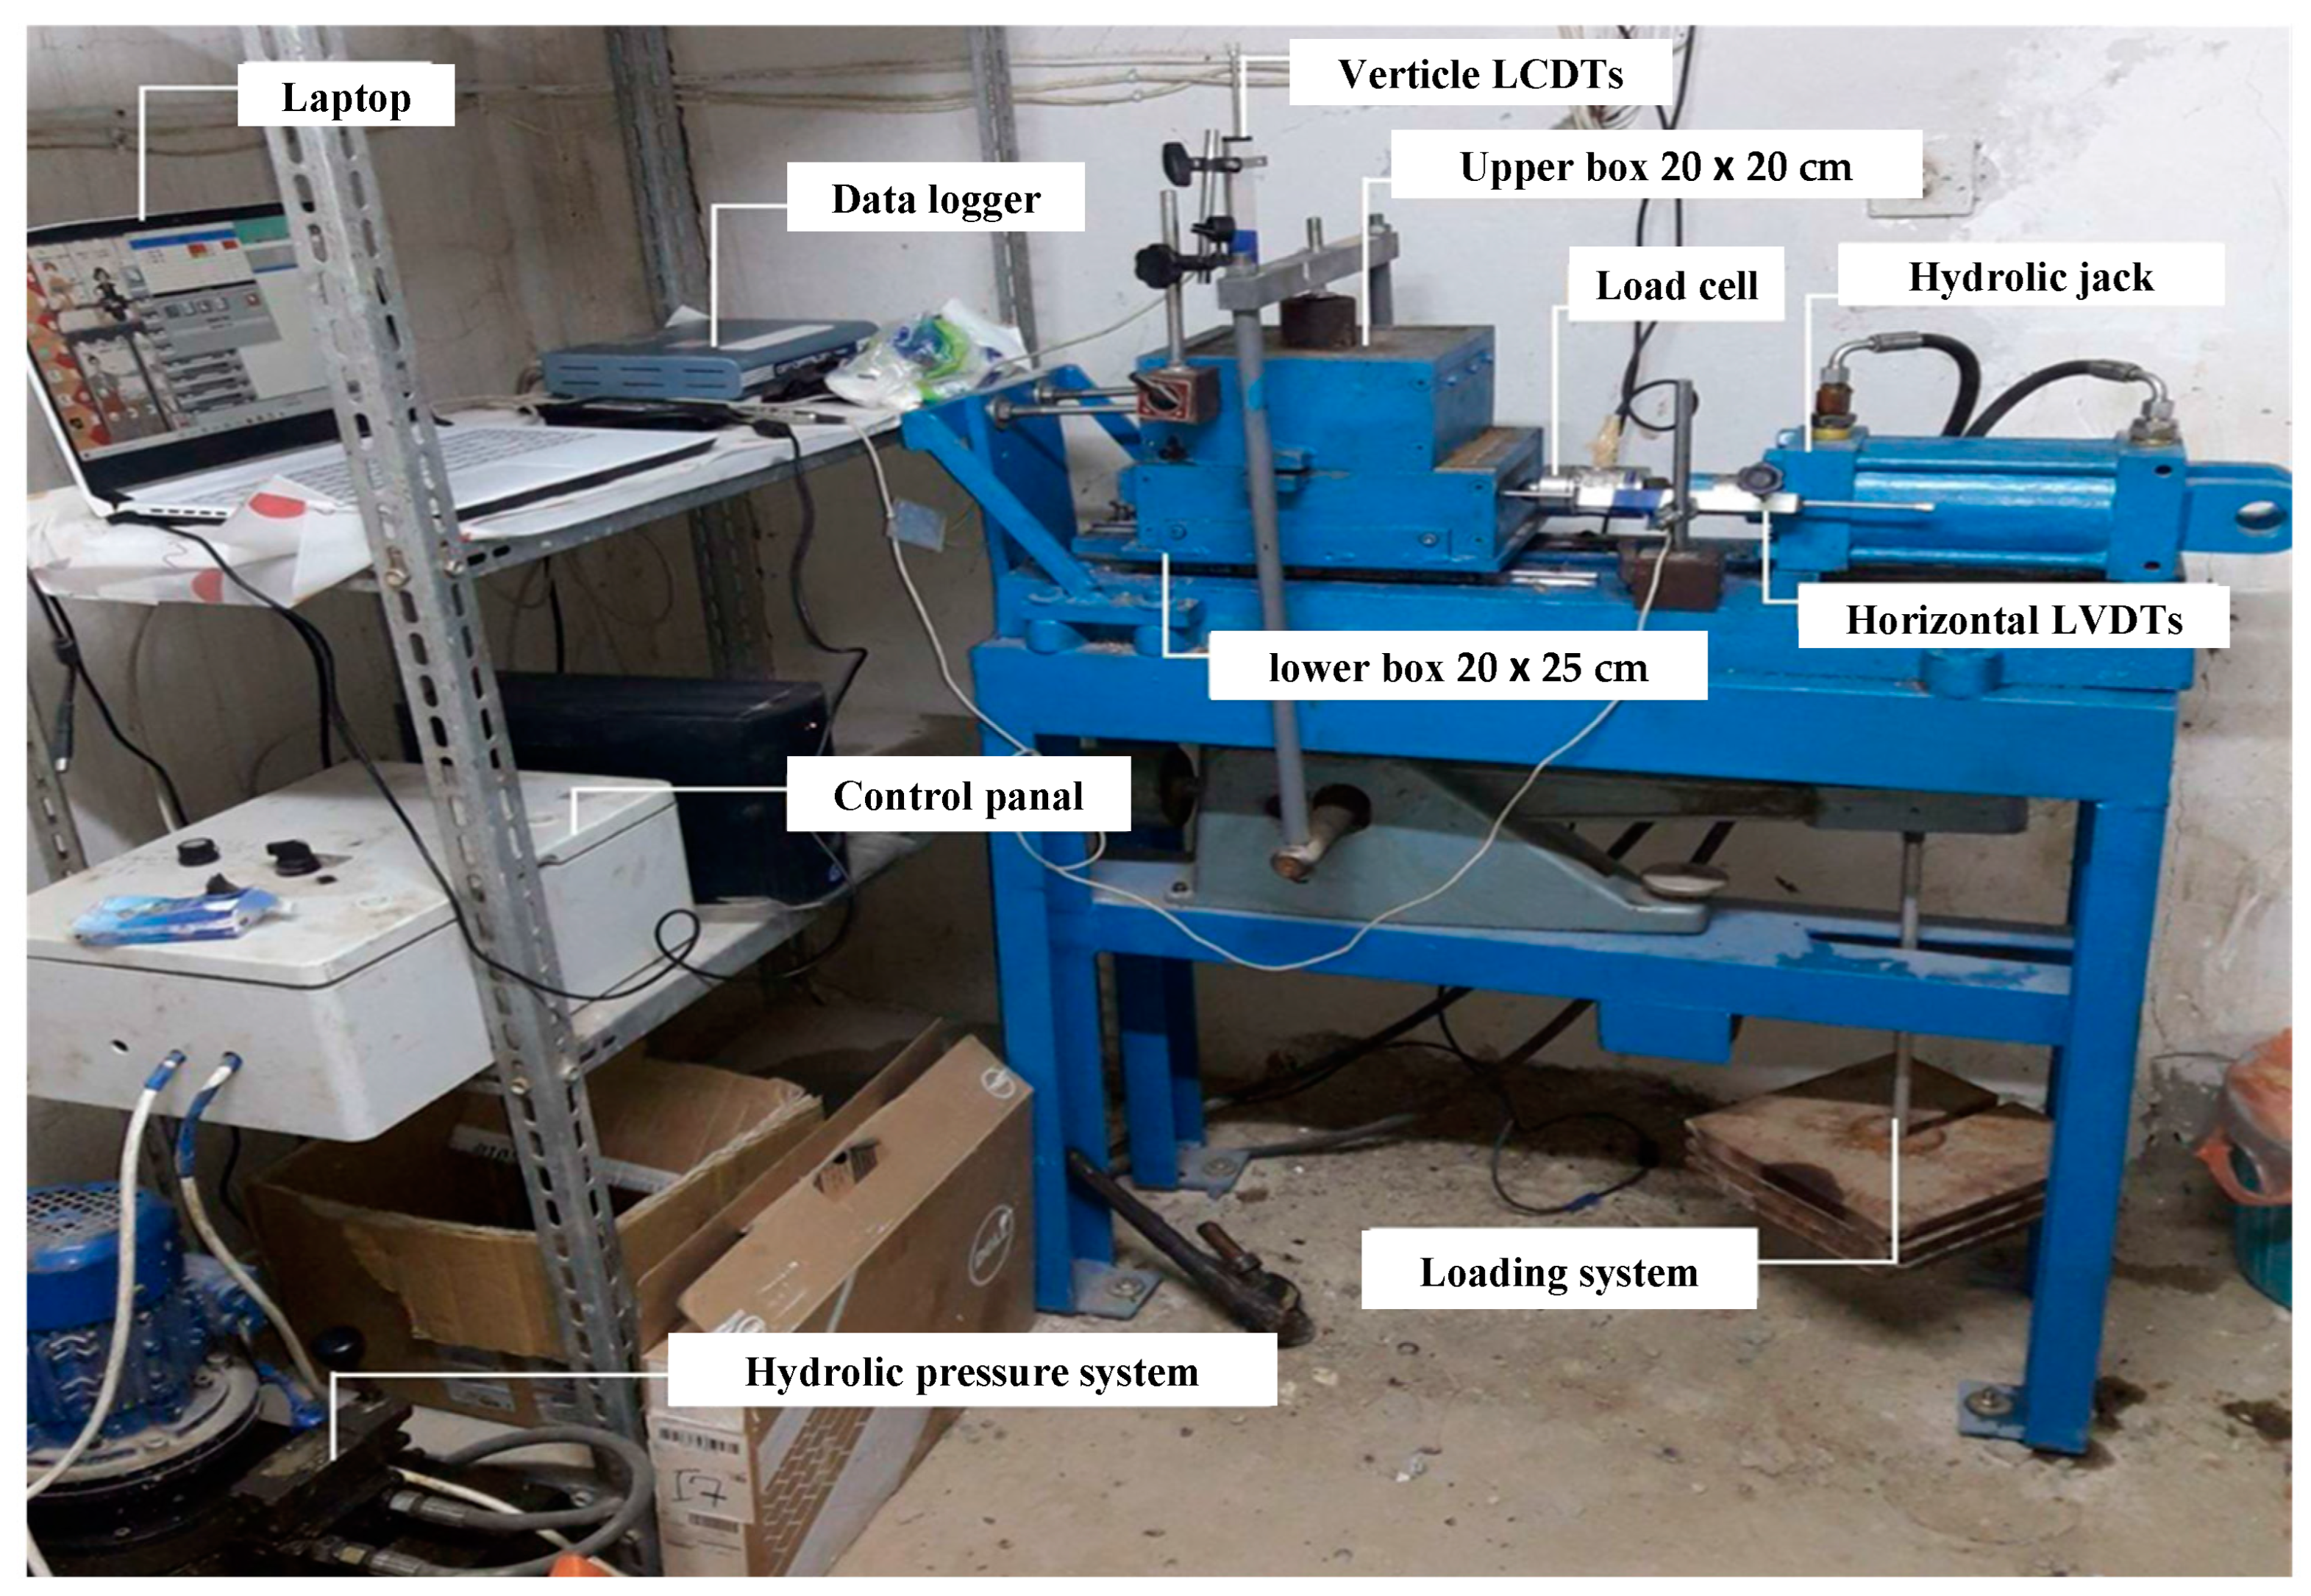
4.4. Large Size Direct Shear Device

A locally manufactured large-size direct shear device consisting of a size box (20 × 20 × 10) cm (upper part) and a size box 20 cm × 25 cm × 10 cm (lower part) is utilized in this study. The lower part is designed to be greater than the upper part to ensure a consistent shearing zone during experimental modeling.
The large-scale direct shear device used in this study was custom-designed to capture the interaction behavior between stabilized subgrade and reinforced subbase layers under conditions that closely replicate field performance. This experimental design is central to the novelty of this work.

4.5. Program for Contact Testing

A total of 24 tests were performed in a large-scale direct shear device with a geogrid for four values of moisture content (8%, 10%, 12%, and 14%) with a maximum dry density (100% degree of compaction), where the normally applied pressures are 25, 50, and 75 kPa, respectively, for all tests [21]. As well as 12 interface tests were performed with optimum water content and a degree of compaction equal to 95% with geogrid at different percentages of WFS (0%, 5%, 10% and 15%).

4.6. Test Setup and Procedure

The testing apparatus includes horizontal load cells (max. capacity: 50 kN) and two linear variable differential transducers (LVDTs) with a ±50 mm range, which capture vertical and horizontal displacements during shear. All measurements are digitally logged using a Data Acquisition System (DAQ). The geogrid is positioned between the clay subgrade soil and the subbase material throughout testing. The design and function of the apparatus align with methodologies outlined by Xu et al. [21], who emphasized the importance of accurate displacement tracking and interface contact control in large-scale direct shear testing. This ensures the robustness of the measured soil–geosynthetic interaction parameters. The setup is shown in Figure 4, with photographs provided in Figure 5.
The geogrid was positioned such that its transverse and longitudinal ribs intersected the shear plane within the test apparatus. During loading, passive resistance is generated as soil particles bear against the ribs, contributing to the overall interface shear strength. Although the setup does not isolate the contribution of individual rib orientations, it effectively simulates field conditions where the interaction mechanisms include both friction and bearing resistance. The measured shear resistance thus represents the combined effect of these mechanisms.

4.7. Failure Criterion

The ASTM D3080 [22] states that at least a 10% horizontal displacement of the box size should be used to shear the specimen, where this would be equal to 20 mm. Youwai et al. [23] found that shear stress can be determined either by taking the peak shear stress value at the end of the test. According to ASTM D5321/D5321M-14 [24], the horizontal displacement may reach 75 mm or any other value specified by the operator, and the test may be concluded once the maximum shear stress is reached. The failure criteria used in this study are based on the peak shear stress.

5. Results and Discussion

This research study aimed to explore the use of WFS for stabilizing clay subgrade soil through comprehensive laboratory experiments. The physical properties of the materials were analyzed to assess their suitability. Using the Modified Proctor test, the MDD and OMC of the clay soil were determined. After evaluating the soil’s physical properties, it was mixed with varying percentages of WFS, and the CBR values were calculated. Additionally, the interface shear strength between the clay subgrade soil and subbase soil, reinforced with geogrid, was evaluated at different WFS percentages (0%, 5%, 10%, and 15% of the clay subgrade soil). The primary goal of this investigation was to conduct a systematic study on the effects of WFS on soil stabilization.

5.1. Evaluation of the Engineering Properties of the Stabilized Soil Results

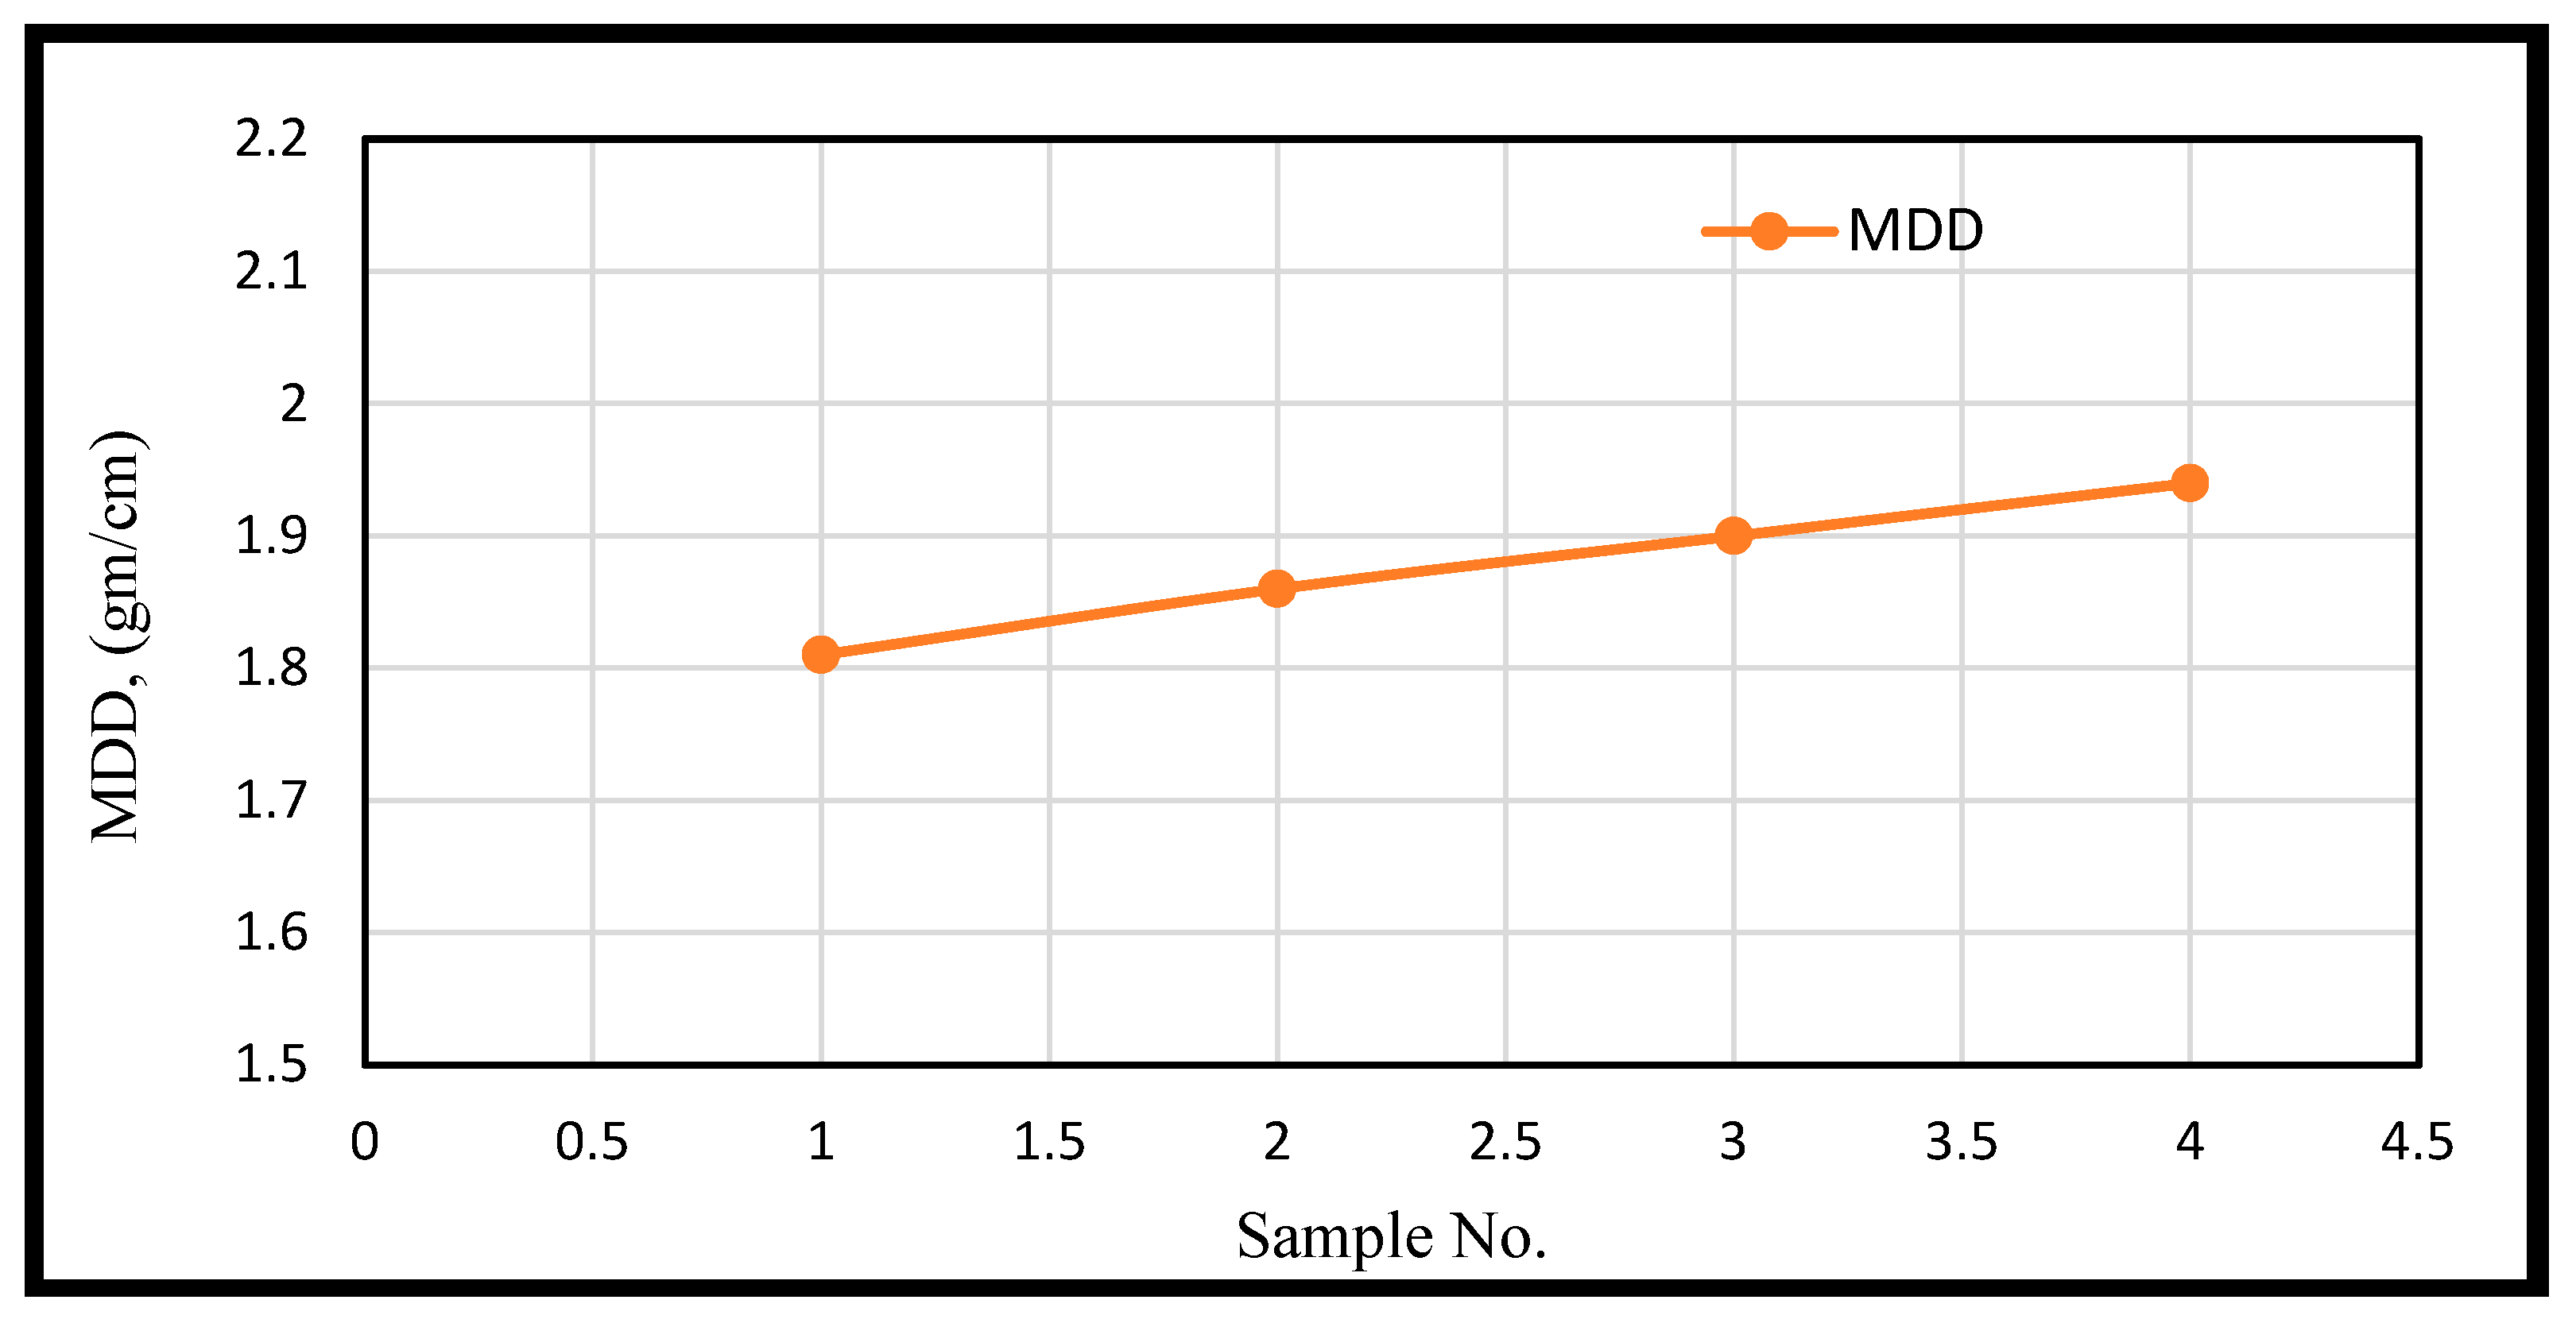
5.1.1. Peak Dry Density and Optimal Moisture Content

Clay subgrade soil samples were examined to determine the MDD and OMC using the Modified Proctor Test, with varying percentages of WFS (0%, 5%, 10%, and 15%). The results are illustrated in Figure 6 and Figure 7.

5.1.2. Results of the California Bearing Ratio Test

Clay soil samples enhanced with WFS were evaluated to determine the optimum moisture content and maximum dry density using the CBR test. Laboratory calculations were achieved on clay soil with different mixtures to study the bearing ratios. The findings are presented in Figure 8, with a summary of the results provided in Table 5.
The results indicate that the properties of clay subgrade soil change with the addition of foundry sand. The OMC decreases by 13% when the clay is mixed with 15% WFS, compared to plain clay soil. Regarding the MDD and CBR, increasing the percentage of WFS from 0% to 15% leads to a gradual increase in the MDD and CBR, where the MDD and CBR increase by 7% and 63%, respectively, when the soil sample contains 15% WFS in comparison with the soil sample containing 0% WFS.
The CBR test results, as shown in Figure 8, indicate a clear increase in bearing capacity with the addition of WFS up to 10%, after which the rate of improvement becomes marginal. This plateau suggests a threshold in the effectiveness of WFS as a stabilizer, potentially due to oversaturation of the soil matrix or reduced interaction between WFS particles and clay minerals at higher contents. Such behavior underscores the importance of identifying optimal dosages for soil amendments. Similar to the approach proposed by Xu et al. [21], although in a different context, parameter optimization plays a critical role in achieving efficient and economical soil improvement. Their methodology, focused on testing a range of variables under controlled conditions, supports the notion that beyond a certain point, additional stabilizer may not yield proportionally greater benefits.

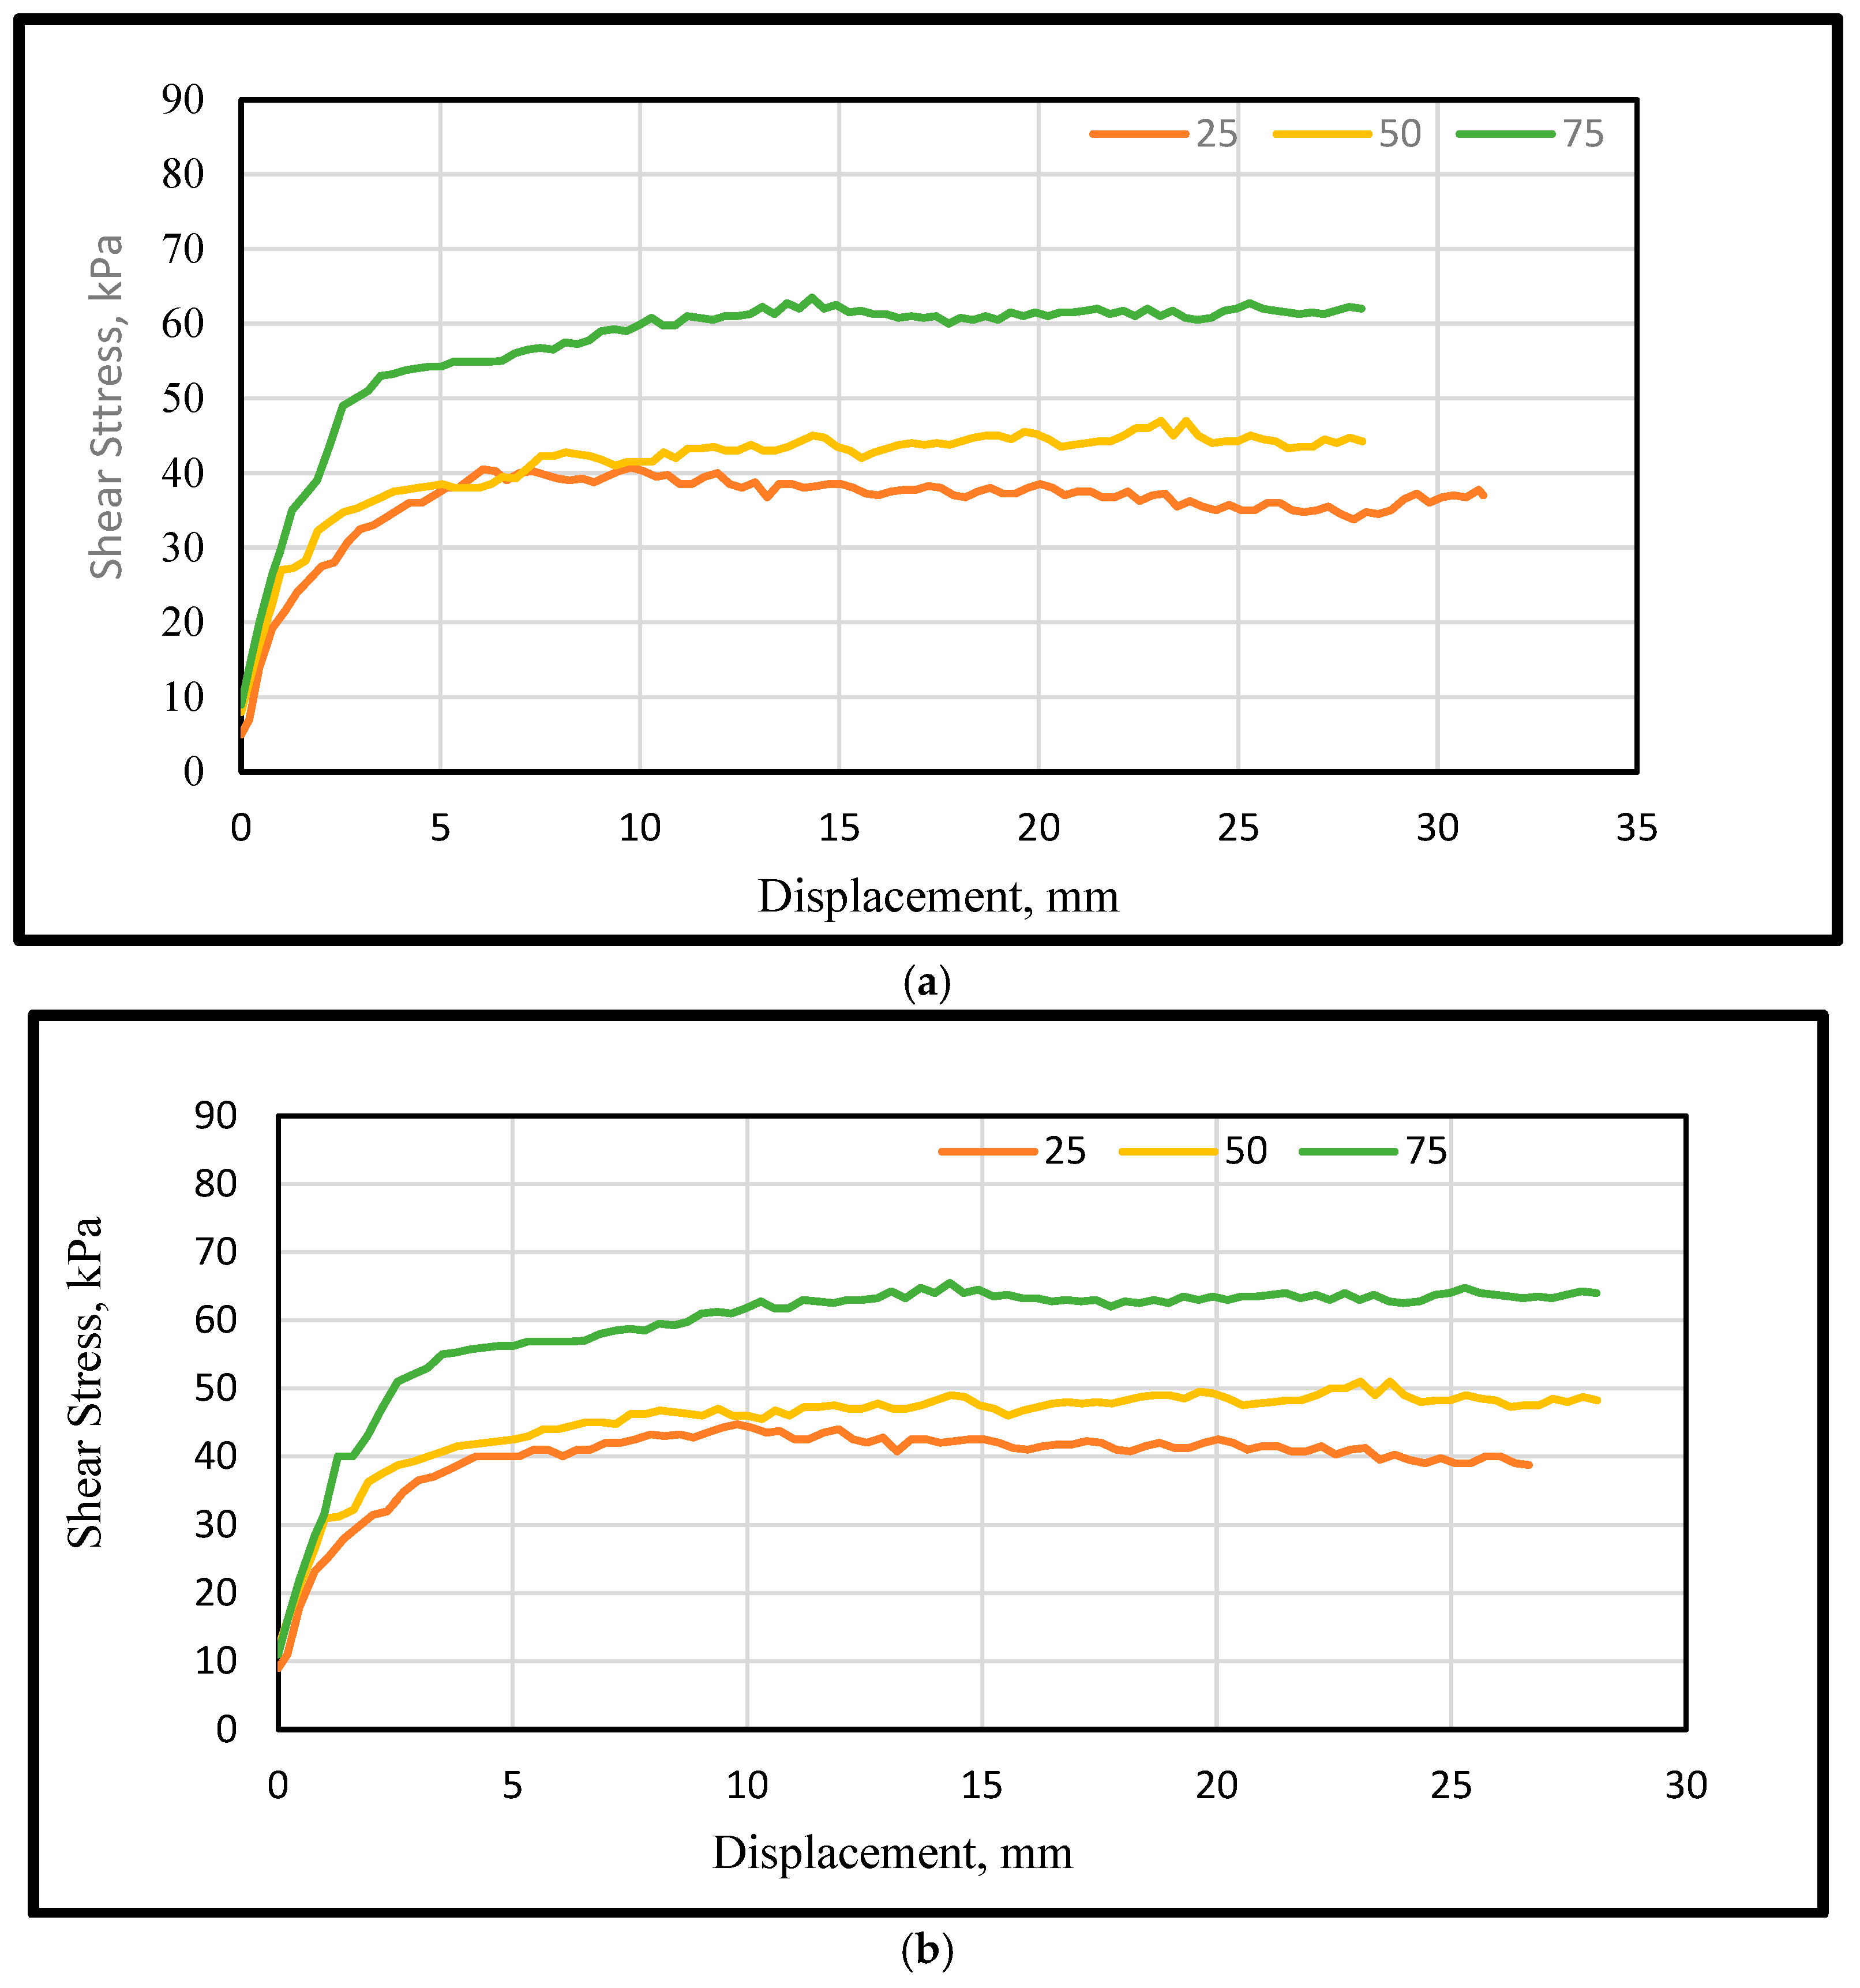
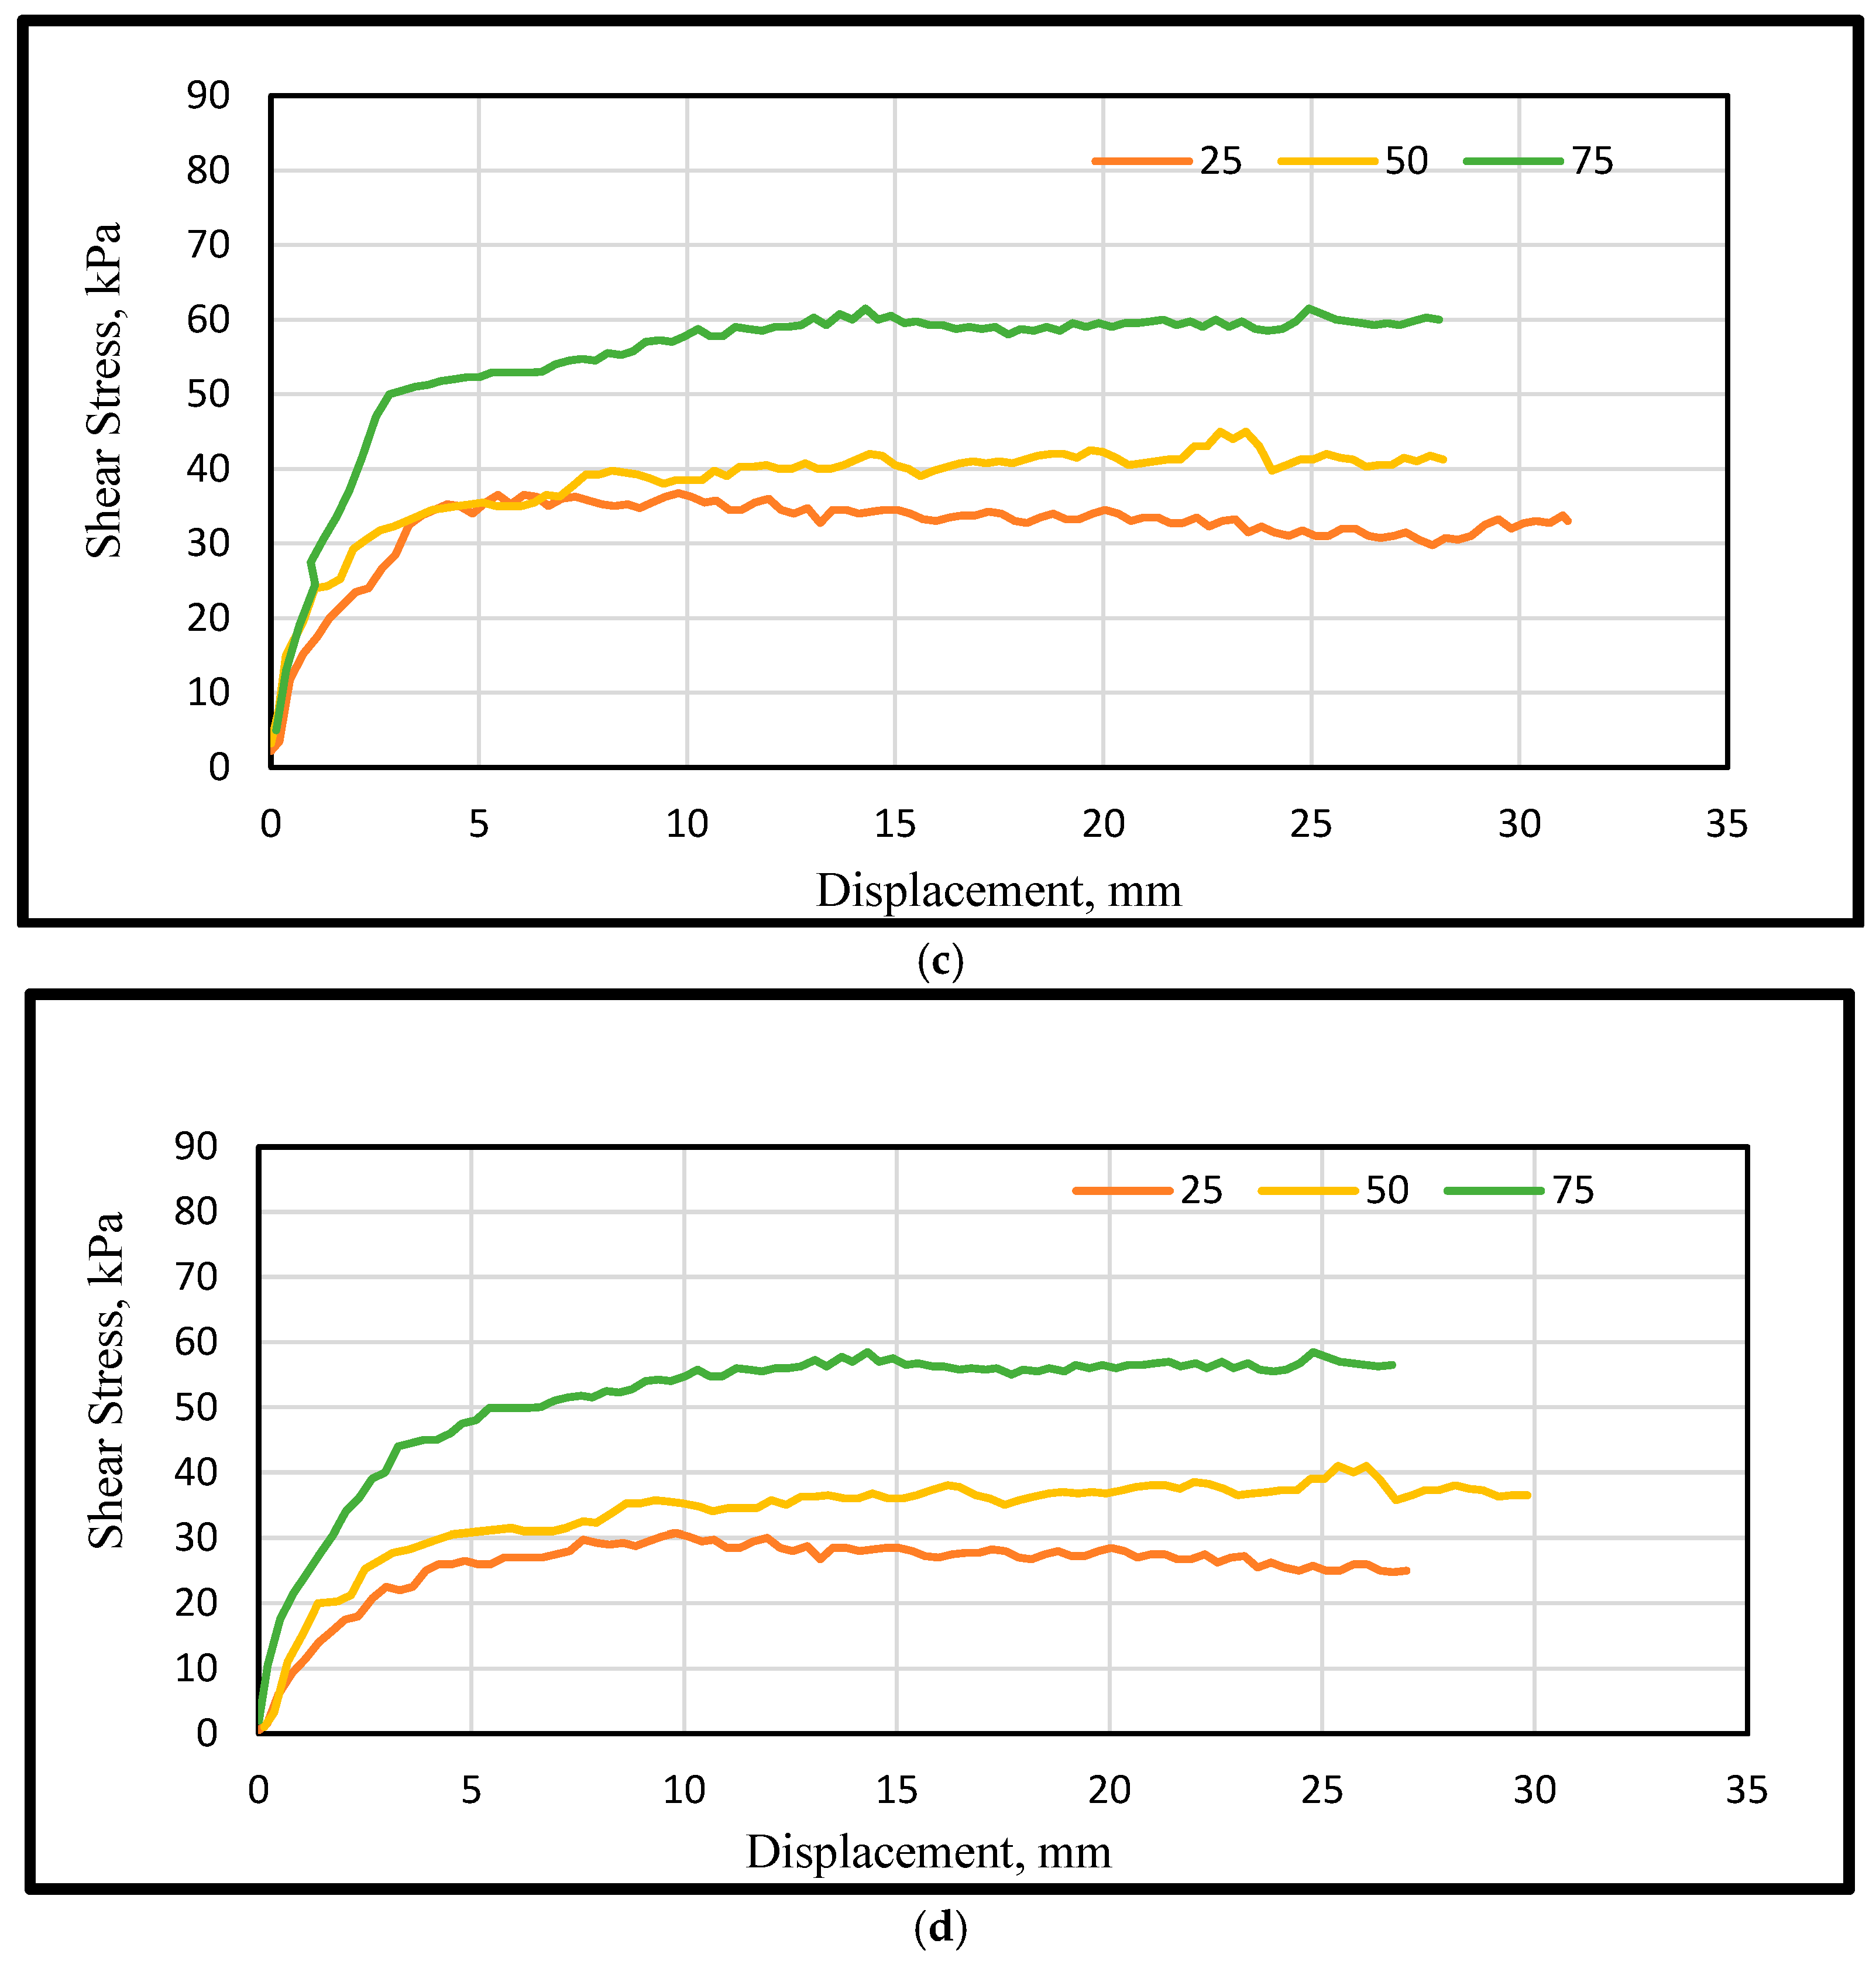
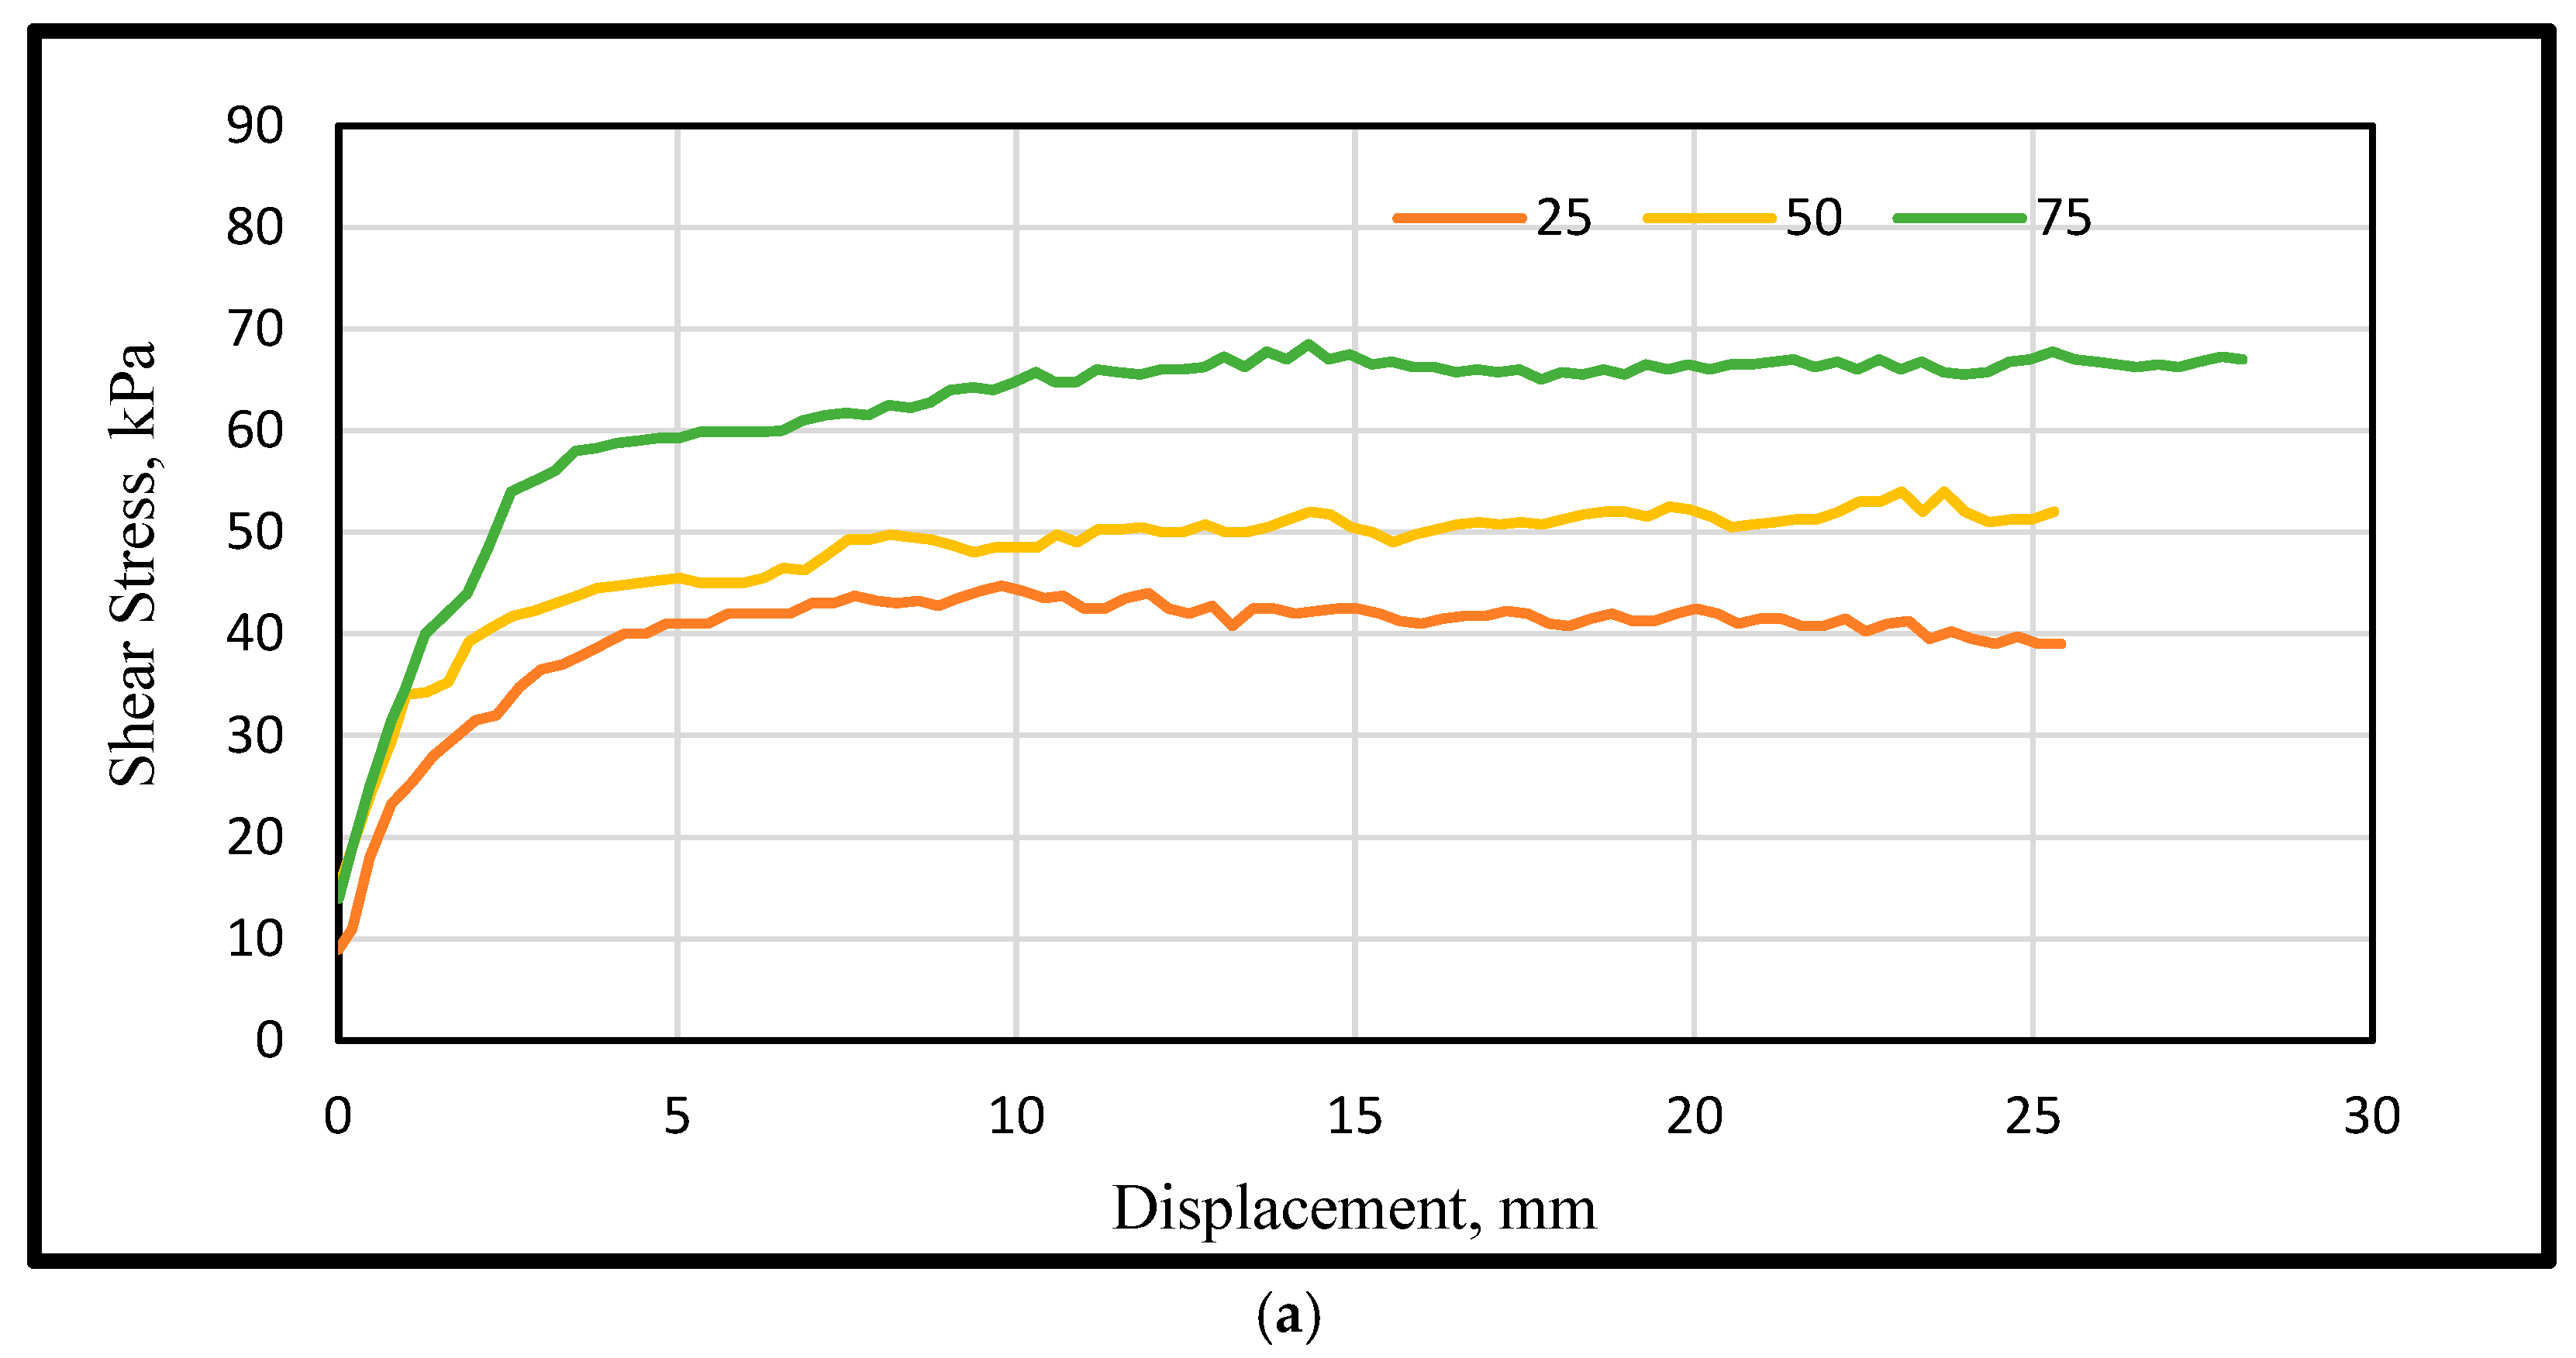
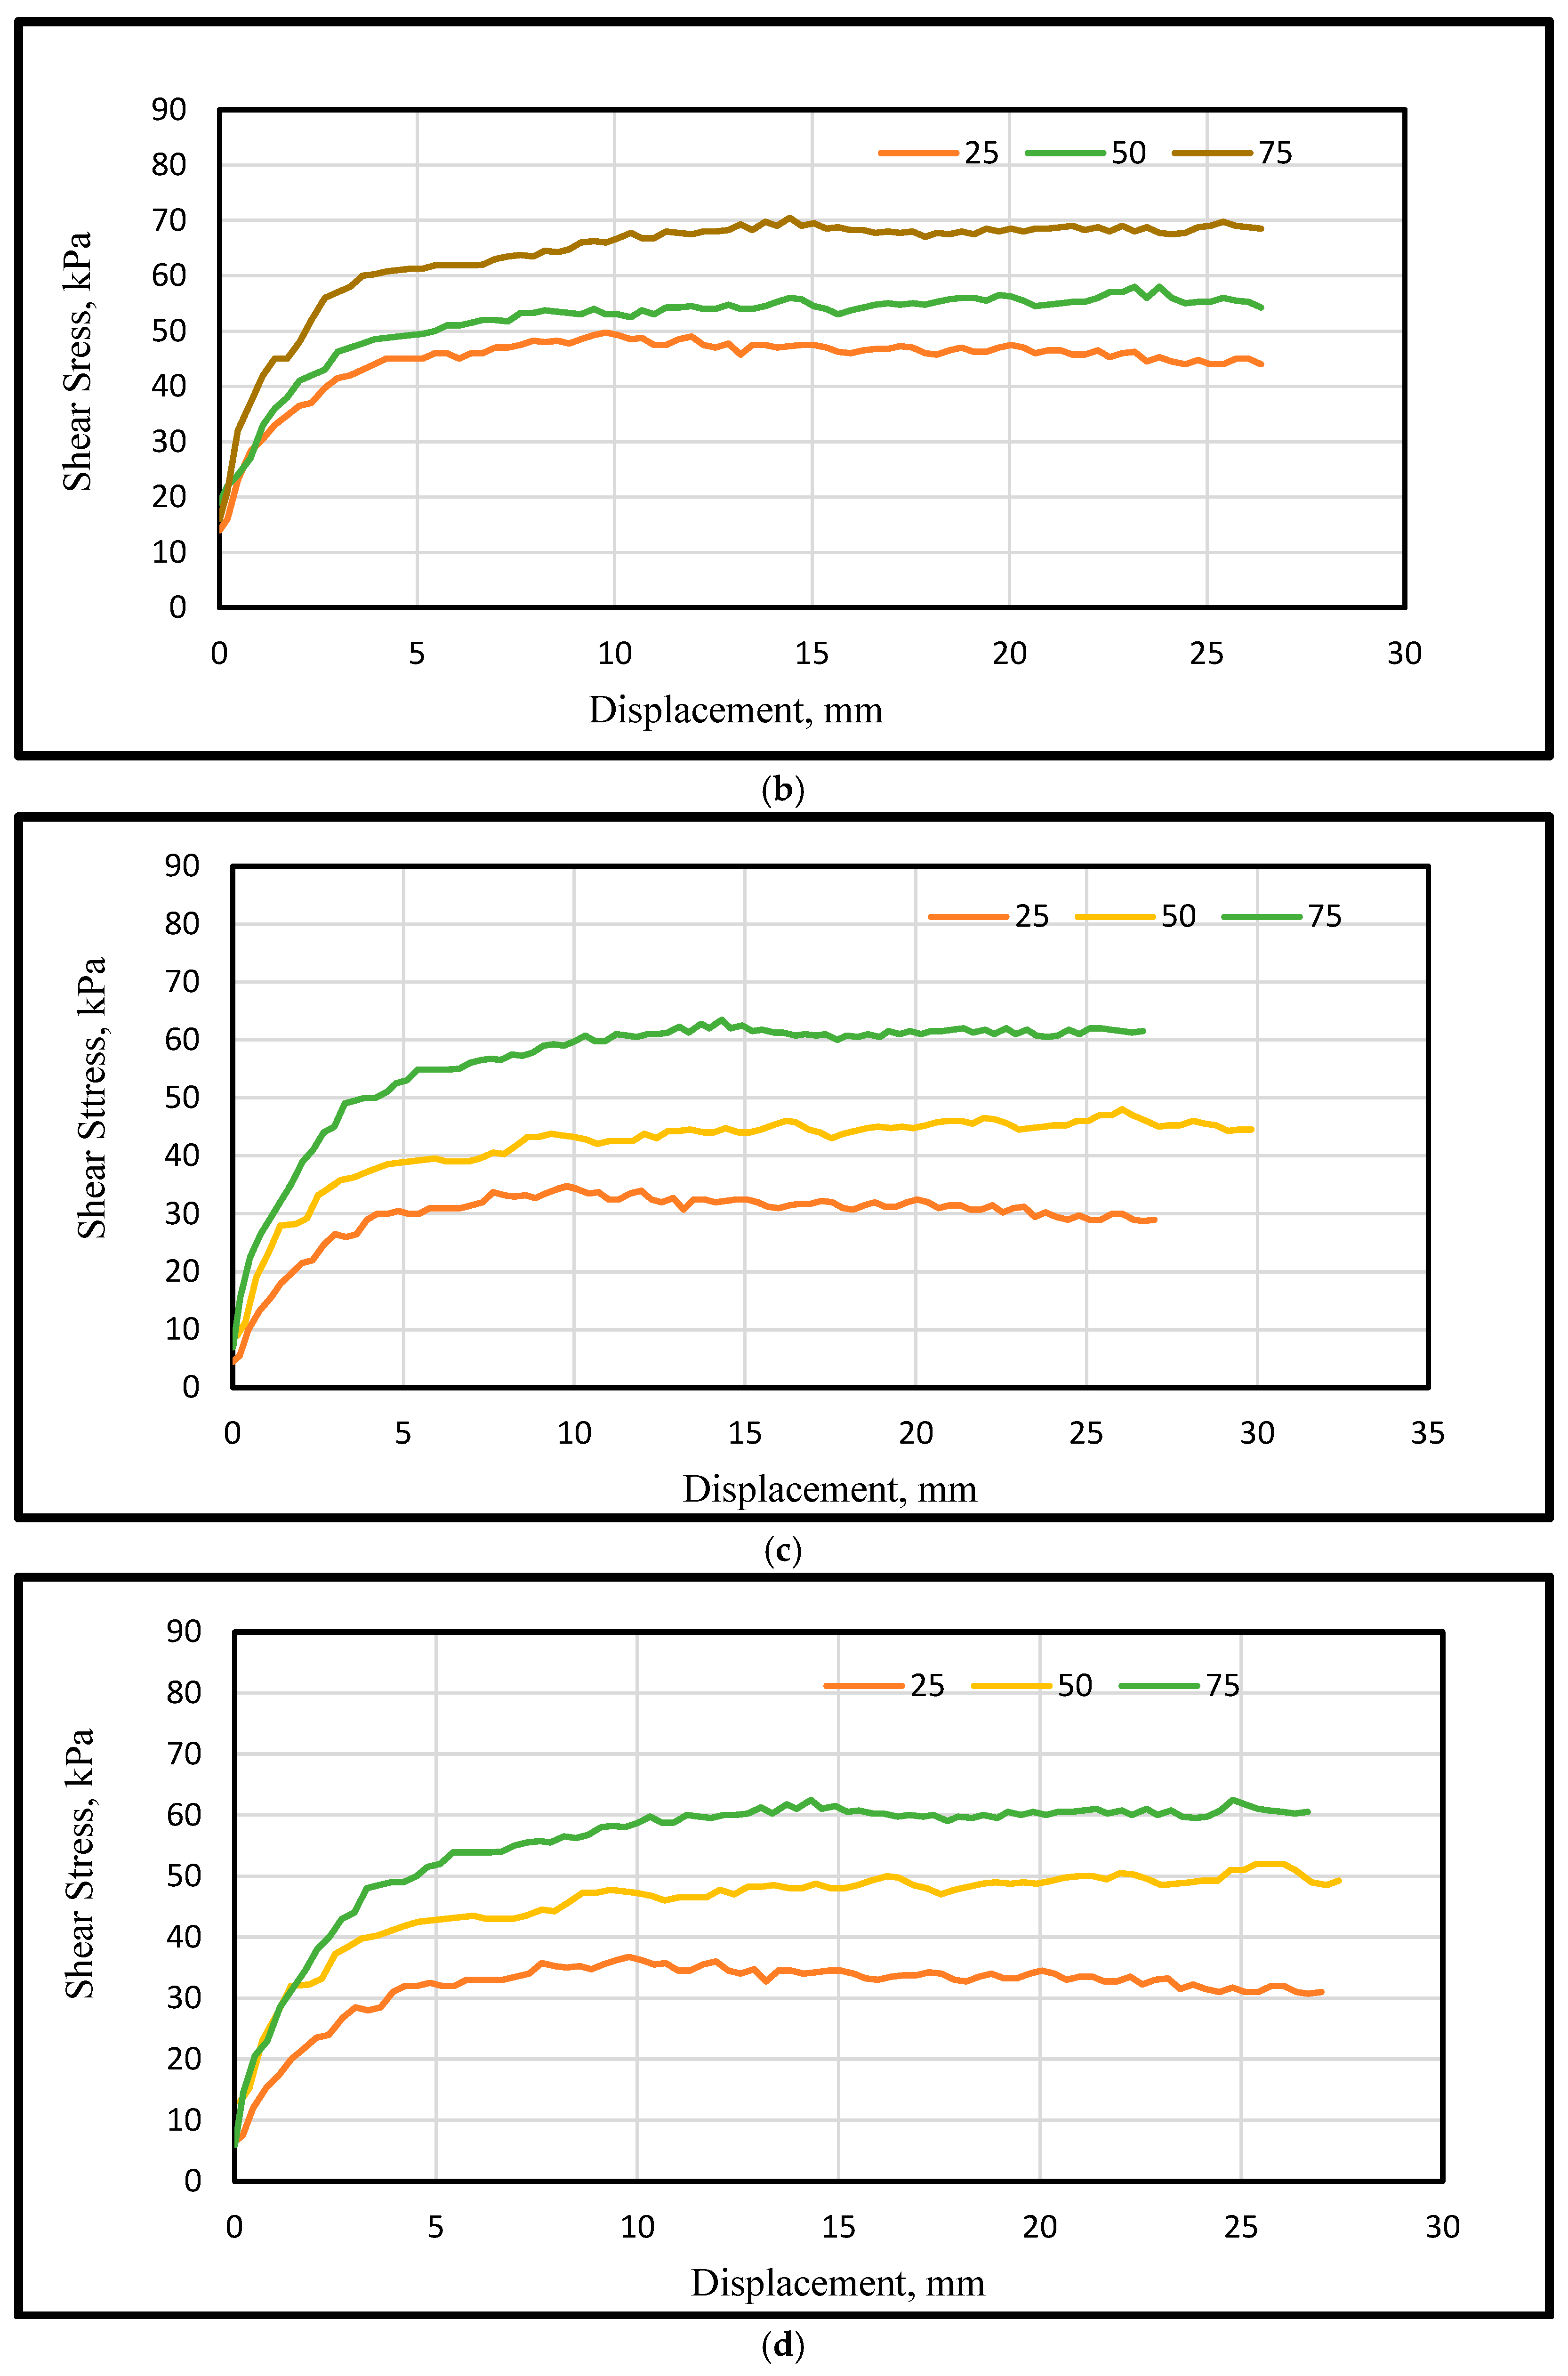
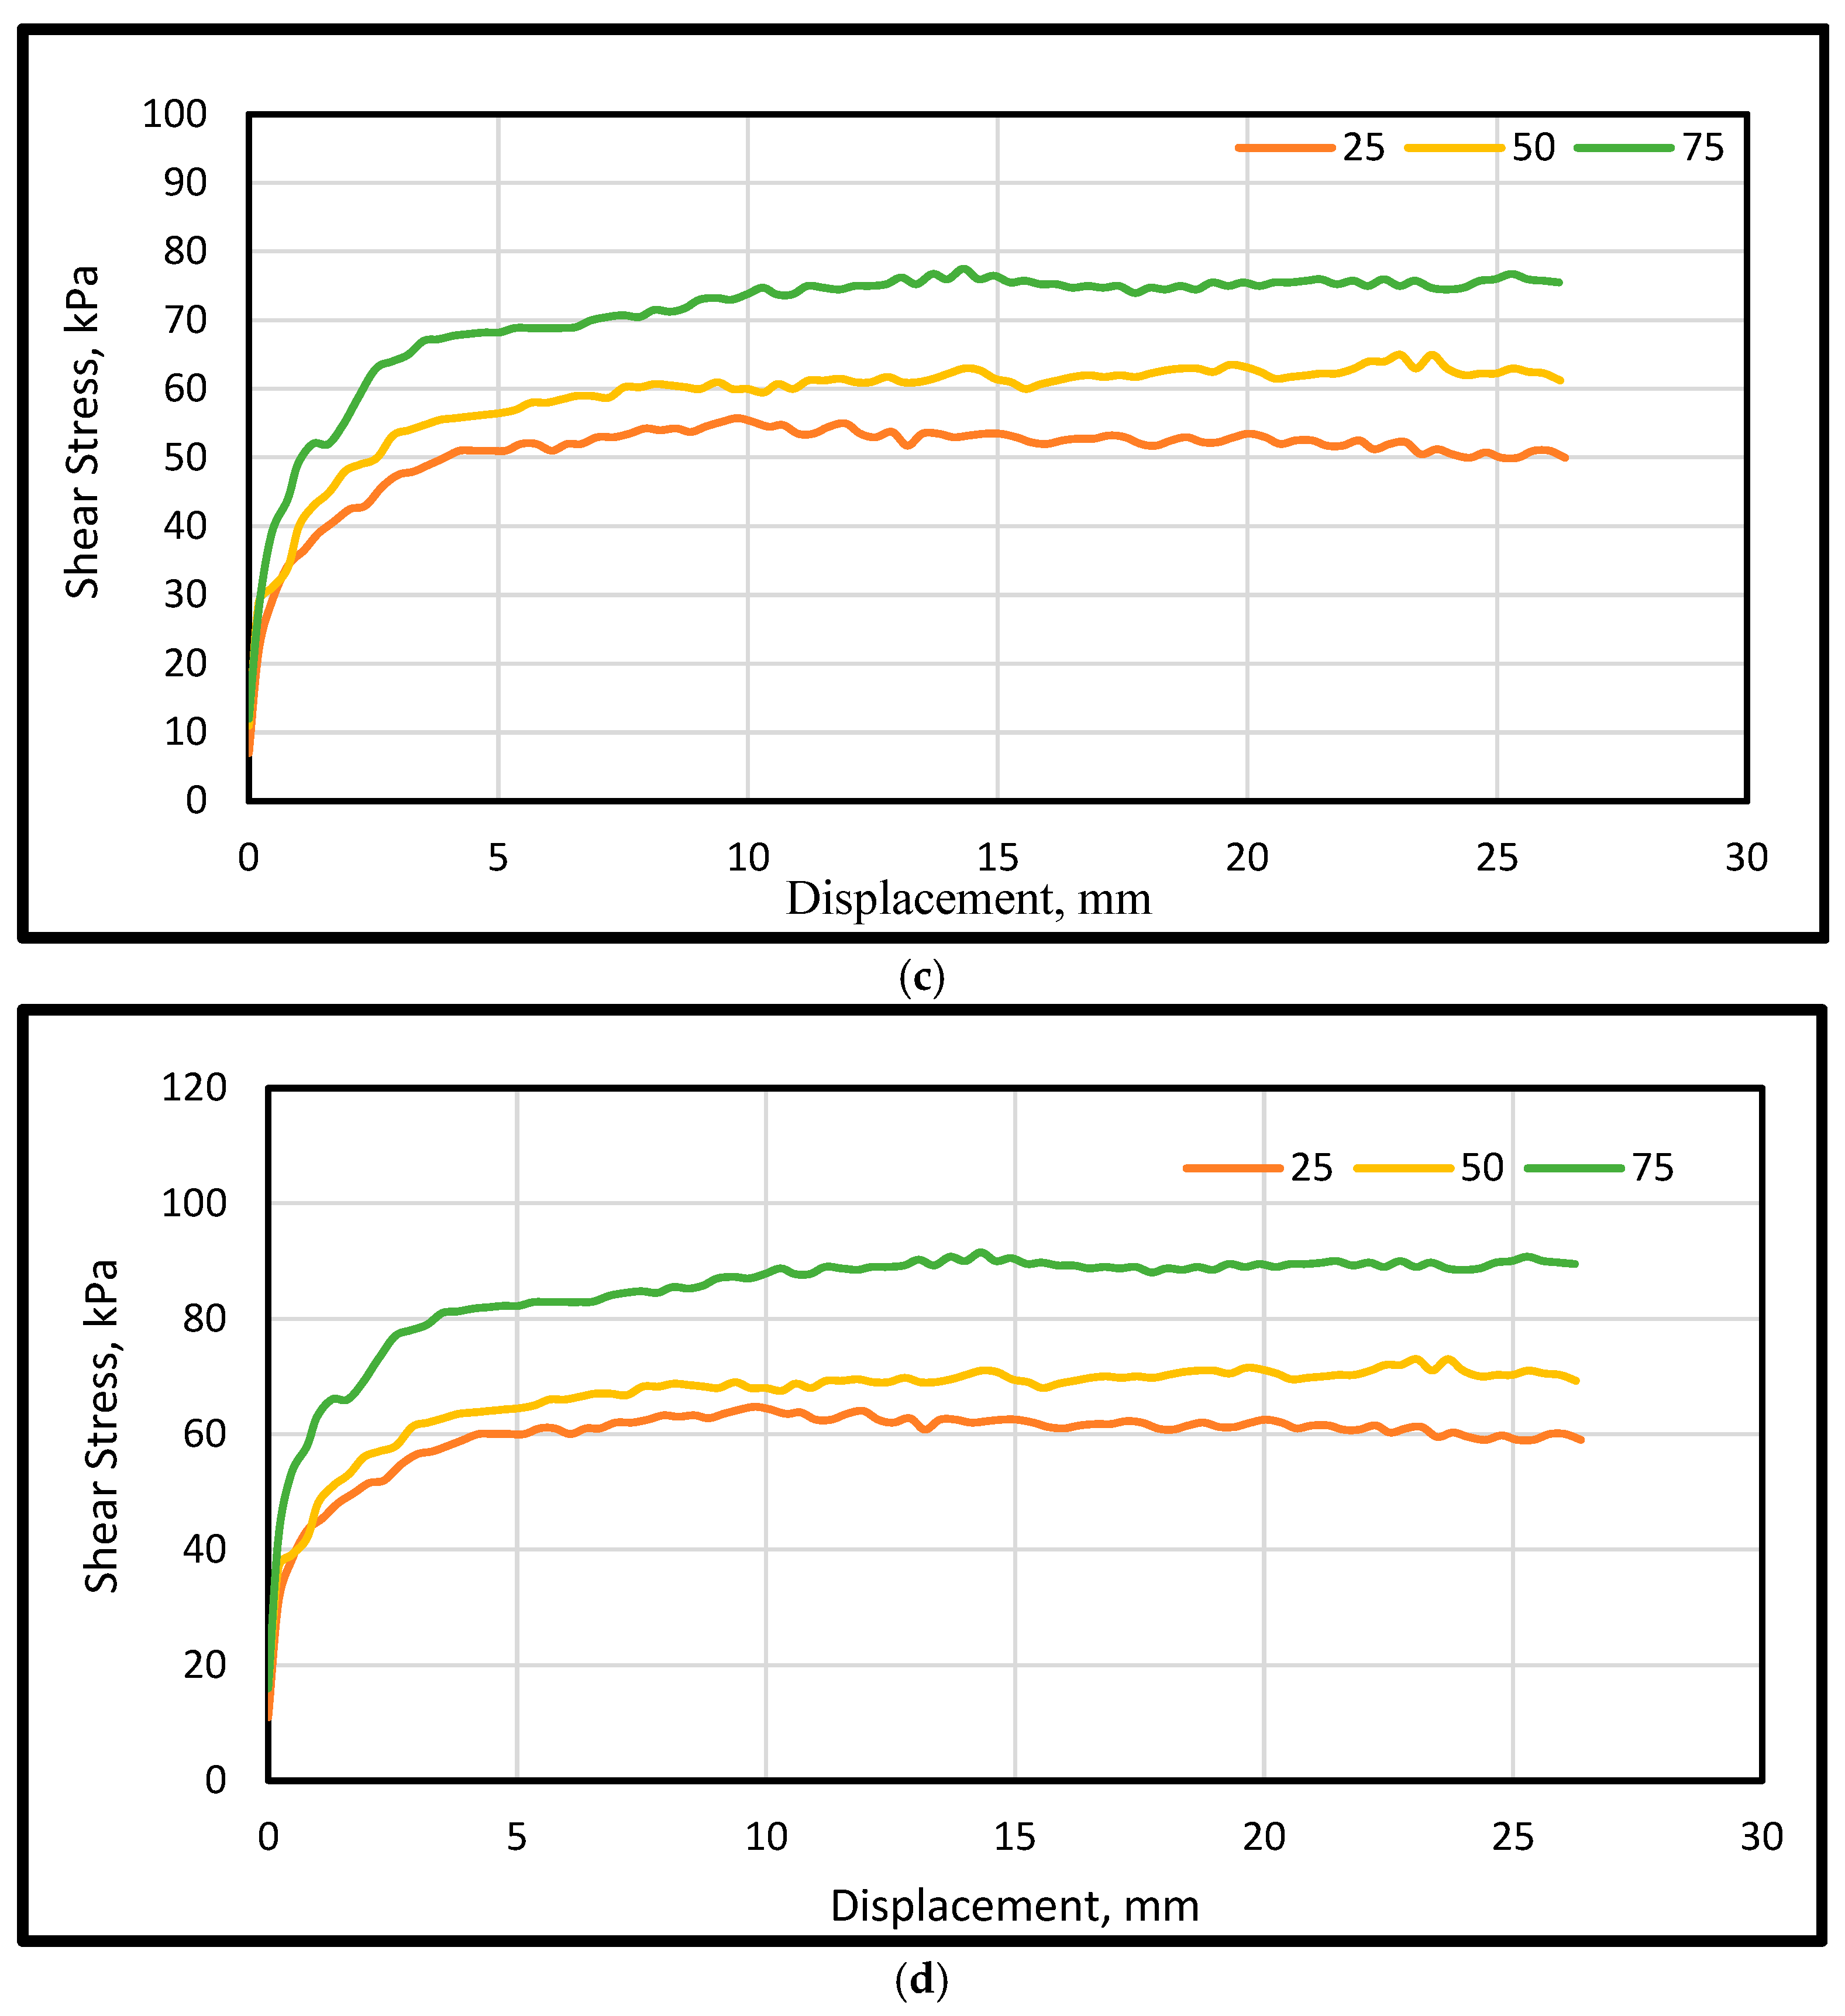
5.2. Evaluation of the Results of Interface Shear Strength of Stabilized Soil

Figure 9 and Figure 10 show the relationship between the shear stress with displacement for clay soil with different water contents (8%, 10%, 12%, and 14%, respectively) and MDD at WFS equal to 5% and 10% from clay soil with the geogrid. For each test, the normal stresses are 25, 50 and 75 kPa.
From the above results, the values of shear strength increase by increasing normal stress and decrease with increasing water content for all tests. The maximum value of shear strength is observed in the dry-side optimum water content, specifically at a water content equal to 10%. Beyond this value, the shear strength tends to drop until reaching the minimum value for a water content equal to 14%. This is attributed to the development of excessive pore water pressure with decreasing the matric suction of clay soil [25,26].
Figure 11 displays the relationship between shear stress and displacement for clay soil with 10% water (W) content and 95% of MDD at different WFS % (0%, 5%, 10%, and 15%, respectively) with geogrid to explain the effect of the degree of compaction of clay subgrade soil on the interface shear strength. For each test, the normal stresses are 25, 50 and 75 kPa. The shear strength parameters (adhesion and angle of friction) are presented in Table 6.
It is important to note that the interface shear strength values reported in Table 6, particularly the cohesion component, may include the effects of matric suction due to the unsaturated state of the clay subgrade soil. Since the tests were conducted at 95% compaction and varying moisture contents below saturation, the apparent cohesion could be partly attributed to suction-induced strength. This aligns with the findings in Khalili (2018) [27], who emphasized the influence of suction on shear strength in unsaturated soils. Similarly, Garakani et al. (2024) [28] demonstrated how suction affects the stress–deformation behavior of reinforced systems. While suction was not directly monitored in this study, its potential contribution is acknowledged and should be considered when interpreting strength parameters under similar conditions.
As a result, the value of interface shear strength for a 95% degree of compaction is higher than that when the soil is compacted with maximum dry density. The interface shear strength for 95% degree of compaction, 10% water content, and 5% and 10% of FWS is equal to 65 kPa and 69 kPa, respectively, while the values are equal to 67 kPa and 78 kPa for a 100% degree of compaction and for the same percentage of water content and FWS. The value of the interface shear strength decreases by increasing the water content. This decrease in shear strength is attributed to the reduction in soil suction in clay subgrade soil, which occurs as the water content increases, as well as to the possible development of pore water pressure in nearly saturated clays. These results illustrate that the soil–geogrid interface shear strength is considerably improved when the backfill material is compacted on the dry side of the OMC when compared with the case where the optimum value is adopted. This agreed with previous research [29,30]. Therefore, the specimens of clay soil in Figure 10 were tested with a 95% compaction grade and water content equal to 10% to explain the impact of FWS on the interface shear strength. Also, from the observation of the data of interface shear strength and the percentage of stabilization (comparison), it is noticed that adding the FWS to clay soil has a clear effect on the shear properties, where the interface shear strength increases as the percentage of FWS increases, and stabilization increases to 55% for the case where FWS content is equal to15%.
To analyze the impact of the geogrid on the shear characteristics of clay subgrade–subbase soil, the interaction coefficient of reinforcement is determined. This coefficient is the ratio of the shear strength of soil with reinforcement (πreinforced) at the contact point to the shear strength of unreinforced soil (πunreinforced) under identical normal stress. This ratio is called the interaction coefficient (η); see Equation (4).
η = πreinforced/πunreinforced
Interaction coefficient values exceeding unity (η > 1) reflect an effective connection between the soil and the geosynthetic material. This implies that the contact strength between the reinforcement and the soil surpasses the shear strength of the soil alone [31]. When η > 1, a significant bearing capacity resistance is achieved due to interlocking between the geosynthetic and the soil. Conversely, a η value below 0.5 suggests a weak attachment between the soil and the geosynthetic or a potential breakage of the geosynthetic sheet [31]. Table 7 displays the shear interaction coefficients for clay–subbase mixtures with varying percentages of WFS under normal stresses of 25, 50, and 75 kPa. For the studied clays, the calculated values for η were consistently greater than 1, indicating strong bonding between the clay subgrade and subbase soils when reinforced with geogrids at different percentages of WFS.
In addition, the values of the interaction coefficient (η) in Table 7 increase steadily with the addition of WFS, reaching a peak of 1.60 at 15% content. This trend suggests a progressively stronger bond between the geogrid and the surrounding soil, which can be leveraged in design to improve stability and load transfer efficiency. However, beyond a certain point, the marginal gains diminish, indicating an optimal range for WFS content between 10 and 15%. This aligns with the broader principle of parameter optimization, as discussed by Xu et al. [21], who emphasized evaluating performance-to-cost trade-offs when determining ideal reinforcement configurations. In practical terms, adopting WFS levels within this optimal range can enhance reinforcement effectiveness while minimizing material use and cost.

6. Conclusions

Previous studies have typically investigated the use of either waste foundry sand (WFS) or geogrid independently to stabilize clay subgrade soils. However, the combined effect of these two stabilizing agents has received limited attention. This study addresses this research gap by proposing an integrated approach that incorporates both WFS and geogrid reinforcement to enhance the engineering properties of clay subgrade soil. The experimental program involved standard Proctor compaction, California Bearing Ratio (CBR), and large-scale direct shear tests to evaluate the impact of WFS on the shear interaction between clay subgrade and subbase soils under varying moisture and compaction conditions.
The main conclusions drawn from the study are as follows:
  • The interface shear strength increases as the moisture content decreases, with the highest strength observed at 10% water content. Above this, shear strength declines, reaching a minimum at 14%.
  • Maximum shear strength was achieved at 95% compaction, indicating that a dry-side compaction strategy is more effective than full compaction.
  • The optimal condition for stabilization using G1 geogrid occurs at 95% compaction with a moisture content approximately 2% below the optimum.
  • The interaction coefficient (η) exceeded 1 for all WFS contents, indicating strong bonding between the reinforced layers.
  • At 15% WFS, the optimum moisture content decreased by 13% compared to untreated clay soil.
  • Peak dry density and CBR increased progressively with WFS content, reaching 7% and 63% improvements, respectively, at 15% WFS.
  • Interface shear strength improved by 14%, 36%, and 55% for 5%, 10%, and 15% WFS, respectively.
This study is limited to laboratory-scale testing under controlled conditions and may not fully capture field complexities such as long-term durability or environmental factors. However, the findings provide valuable insights for optimizing WFS content and compaction strategies to maximize stabilization efficiency. The integration of WFS and geogrid offers a cost-effective and sustainable solution for improving subgrade performance, with potential applications in road construction and other geotechnical engineering fields. Based on the results, it is recommended to use 10–15% WFS content in combination with a 95% compaction degree on the dry side of the optimum moisture content for enhanced stabilization. This configuration was found to yield the highest values of shear strength and bearing capacity. For practical implementation, adopting this combination can improve pavement subgrade performance, reduce material costs, and promote the reuse of industrial waste. Future work may focus on field validation and the long-term behavior of WFS-geogrid reinforced subgrades under varying environmental conditions.

Author Contributions

Q.S.B.: Writing—review and editing, Formal analysis, Visualization, Validation, Data curation. J.A.: Writing—review and editing, Visualization, Validation, Formal analysis. A.A.H. Writing—review and editing, Resources, Investigation, Visualization, Formal analysis. A.D.: Supervision, Resources, Investigation, Funding acquisition, Writing—review and editing. J.M.d.A.A.: Visualization, Writing—review and editing. L.F.A.B.: Resources, Investigation, Funding acquisition, Writing—review and editing. All authors have read and agreed to the published version of the manuscript.

Funding

This research received no external funding.

Institutional Review Board Statement

Not applicable.

Informed Consent Statement

Not applicable.

Data Availability Statement

The original contributions presented in this study are included in the article. Further inquiries can be directed to the corresponding author(s).

Conflicts of Interest

The authors declare no conflicts of interest.

Glossary/Nomenclature

G1 = biaxial geogrid BX1100; c = cohesion of clay subgrade soil; ca = adhesion between soil-geogrid; η = shear interaction coefficient; φ = soil–soil interface friction angle; δ = soil–geogrid interface friction angle; σ = normal applied stress; π = shear strength.

References

  1. Al-Neami, M.A.; Alsoudany, K.Y.H.; Dawod, A.A.; Ehsan, E.A. Remediation of Cohesive Soils Using Waste Glass. In Proceedings of the International Journal of Arts and Sciences, Freiburg, Germany, 29 November–2 December 2016; Volume 9, pp. 125–138. [Google Scholar]
  2. Jing, X.; Wu, S.; Qin, J.; Li, X.; Liu, X.; Zhang, Y.; Mao, J.; Nie, W. Multiscale mechanical characterisations of ultrafine tailings mixed with incineration slag. Front. Earth Sci. 2023, 11, 1123529. [Google Scholar] [CrossRef]
  3. Abichou, T.; Benson, C.; Edil, T. Foundry Green Sand as Hydraulic Barriers: Field Study. J. Geotech. Geoenviron. Eng. 2002, 128, 206–215. [Google Scholar] [CrossRef]
  4. Shiva Kumar, K.; Vidyaranya, V.; Bharadwaj, S.; Prathibha, K.N.; Yuvaraj, C. Soil Stabilization Using Waste Plastic Strips. Int. J. Recent Sci. Res. 2016, 7, 11356–11358. [Google Scholar]
  5. Abu-Farsakh, M.; Coronel, J.; Tao, M. Effect of Soil Moisture Content and Dry Density on Cohesive Soil–Geosynthetic Interactions Using Large Direct Shear Tests. J. Mater. Civ. Eng. 2007, 19, 540–549. [Google Scholar] [CrossRef]
  6. Xu, Y.; Yan, G.; Williams, D.J.; Serati, M.; Scheuermann, A.; Vangsness, T. Experimental and numerical studies of a strip footing on geosynthetic-reinforced sand. Int. J. Phys. Model. Geotech. 2020, 20, 267–280. [Google Scholar] [CrossRef]
  7. Mendes, M.J.A.; Palmeira, E.M.; Matheus, E. Some Factors Affecting the In-Soil Load–Strain Behaviour of Virgin and Damaged Nonwoven Geotextiles. Geosynth. Int. 2007, 14, 39–50. [Google Scholar] [CrossRef]
  8. Mohammad, L.N.; Herath, A.; Rasoulian, M.; Zhang, Z. Laboratory Evaluation of Untreated and Treated Pavement Base Materials: Repeated Load Permanent Deformation Test. Transp. Res. Rec. 2006, 1967, 78–88. [Google Scholar] [CrossRef]
  9. Nazzal, M.; Abu-Farsakh, M.; Mohammad, L. Laboratory Characterization of Reinforced Crushed Limestone under Monotonic and Cyclic Loading. J. Mater. Civ. Eng. 2007, 19, 772–783. [Google Scholar] [CrossRef]
  10. Nareeman, B.J.; Fattah, M.Y. Effect of Soil Reinforcement on Shear Strength and Settlement of Cohesive Frictional Soil. GEOMATE J. 2012, 3, 308–313. [Google Scholar] [CrossRef]
  11. Ferreira, F.B.; Vieira, C.S.; Lopes, M.L. Experimental Investigations on Shear Strength of Soil-Geogrid Interfaces. In Proceedings of the 5th European Geosynthetics Congress, EUROGEO, Valencia, Spain, 16–20 September 2012; Volume 5, pp. 211–217. [Google Scholar]
  12. Vieira, C.S.; Lopes, M.D.L.; Caldeira, L.M. Sand-Geotextile Interface Characterization through Monotonic and Cyclic Direct Shear Tests. Geosynth. Int. 2013, 20, 26–38. [Google Scholar] [CrossRef]
  13. Banyhussan, Q.S.; Mosa, A.M.; Hussein, A.N.; Sigar, E.J. Evaluating the Shear Strength of Subbase-Subgrade Interface Using Large Scale Direct Shear Test. Int. J. Innov. Eng. 2023, 3, 35–47. [Google Scholar] [CrossRef]
  14. Sharaky, A.M.; Mohamed, N.S.; Elmashad, M.E.; Shredah, N.M. Application of microbial biocementation to improve the physico-mechanical properties of sandy soil. Constr. Build. Mater. 2018, 190, 861–869. [Google Scholar] [CrossRef]
  15. Bak, H.M.; Kariminia, T.; Shahbodagh, B.; Rowshanzamir, M.A.; Khoshghalb, A. Application of bio-cementation to enhance shear strength parameters of soil-steel interface. Constr. Build. Mater. 2021, 294, 123470. [Google Scholar]
  16. Xiao, Y.; He, X.; Zaman, M.; Ma, G.; Zhao, C. Review of strength improvements of biocemented soils. Int. J. Geomech. 2022, 22, 03122001. [Google Scholar] [CrossRef]
  17. Abichou, T.; Benson, C.H.; Edil, T.B. Foundry Green Sands as Hydraulic Barriers: Laboratory Study. J. Geotech. Geoenviron. Eng. 2000, 126, 1174–1184. [Google Scholar] [CrossRef]
  18. Sharma, R.K.; Kumar, A. Compaction and Sub-grade Characteristics of Clayey Soil Mixed with Foundry Sand and Fly Ash. Int. J. Eng. Res. Technol. 2013, 2, 1504–1509. [Google Scholar]
  19. Kumar, P.; Paliwal, M.C.; Jain, A.K. Stabilization of Sub Grade Soil by Using Foundry Sand Waste. Int. J. Eng. Sci. Res. Technol. 2016, 5, 300–308. [Google Scholar]
  20. Banyhussan, Q.S.; hassan, H.A.; Hamad, B.A. Investigation of Shear Strength of Subbase-Subgrade Interface with Geosynthetics Reinforcement Utilizing A Large-Scale Direct Shear Test. In E3S Web of Conferences; EDP Sciences: Les Ulis, France, 2023; Volume 427, p. 03007. [Google Scholar] [CrossRef]
  21. Youwei, X.; Williams, D.J.; Serati, M. Investigation of shear strength of interface between road base and geosynthetics using large-scale single-stage and multi-stage direct shear test. Road Mater. Pavement Des. 2020, 21, 1588–1611. [Google Scholar] [CrossRef]
  22. ASTM D3080/D3080M-11; Standard Test Method for Direct Shear Test of Soils Under Consolidated Drained Conditions. American Society for Testing and Materials: West Conshohocken, PA, USA, 2011. Available online: https://www.astm.org/d3080_d3080m-11.html (accessed on 15 January 2025).
  23. Youwai, S.; Bergado, D.T.; Supawiwat, N. Interaction between Hexagonal Wire Reinforcement and Rubber Tire Chips with and without Sand Mixture. Geotech. Test. J. 2004, 27, 260–268. [Google Scholar] [CrossRef]
  24. ASTM D5321/D5321M-13; Standard Test Method for Determining the Shear Strength of Soil-Geosynthetic and Geosynthetic-Geosynthetic Interfaces by Direct Shear. American Society for Testing and Materials: West Conshohocken, PA, USA, 2014. Available online: https://www.astm.org/d5321_d5321m-13.html (accessed on 15 January 2025).
  25. Danial, E.; Kianoosh, H.; Gerald, A.M. Influence of Matric Suction on Geotextile Reinforcement-Marginal Soil Interface Strength. Geotext. Geomembr. 2014, 42, 139–153. [Google Scholar] [CrossRef]
  26. Kianoosh, H.; Jaime, E.G.; Danial, E.; Gerald, A.M. Reinforcement Pullout Capacity in Mechanically Stabilized Earth Walls with Marginal-Quality Soils. Transp. Res. Rec. 2013, 2363, 66–74. [Google Scholar] [CrossRef]
  27. Nasser, K. Guidelines for the application of effective stress principle to shear strength and volume change determination in unsaturated soils. Aust. Geomech. J. 2018, 53, 37–47. [Google Scholar]
  28. Garakani, A.A.; Pirjalili, A.; Yoosefi, S.; Khoshghalb, A. Assessing the stress–deformation and safety factor against sliding in reinforced deep urban excavations in unsaturated soils. Int. J. Geomech. 2024, 24, 04024130. [Google Scholar] [CrossRef]
  29. Koutsourais, M.; Sandri, D.; Swan, R. Soil Interaction Characteristics of Geotextiles and Geogrids. In Proceedings of the 6th International Conference on Geosynthetics, Atlanta, Georgia, 25–29 March 1998; pp. 739–744. [Google Scholar]
  30. Sahib, B.Q.; Jaafar, A.; Anmar, D. Effect of Water Content and Degree of Compaction of Clay Subgrade Soil on the Interface Shear Strength Using Geogrid. J. Adv. Res. Appl. Sci. Eng. Technol. 2025, 52, 262–280. [Google Scholar]
  31. Nilay, T.; Edil, T.B.; Benson, C.H. Interaction between reinforcing geosynthetics and soil-tire chip mixtures. J. Geotech. Geoenviron. Eng. 1998, 124, 1109–1119. [Google Scholar] [CrossRef]
Figure 1. Compaction curve of the clay subgrade soil.
Civileng 06 00026 g001
Figure 2. Specifications of geogrid reinforcement (Tensar international company).
Civileng 06 00026 g002
Figure 3. Geogrid reinforcement BX1100 (G1).
Civileng 06 00026 g003
Figure 4. Schematic and photograph of the custom-built large-scale direct shear apparatus used in this study.
Civileng 06 00026 g004
Figure 5. Experimental procedure stages: (a) compaction of clay-WFS mixture in the mold; (b) prepared sample in shear box before geogrid placement; (c) large-scale direct shear test setup with instrumentation; (d) CBR test under vertical loading; (e) soaked CBR test with dial gauge for deformation measurement.
Civileng 06 00026 g005
Figure 6. The OMC values of clay soil with different WFS %.
Civileng 06 00026 g006
Figure 7. The MDD values of clay soil with different WFS %.
Civileng 06 00026 g007
Figure 8. Values of CBR ratio for clay soil with different WFS %.
Civileng 06 00026 g008
Figure 9. Shear stress versus displacement for 100% degree of compaction at 5% WFS with the geogrid and different water content: (a) 8%, (b) 10%, (c) 12% and (d) 14%.
Civileng 06 00026 g009aCivileng 06 00026 g009b
Figure 10. Shear stress versus displacement for 100% degrees of compaction at 10% WFS with the geogrid and different water content: (a) 8%, (b) 10%, (c) 12% and (d) 14%.
Civileng 06 00026 g010aCivileng 06 00026 g010b
Figure 11. Shear stress versus displacement for 95% degree of compaction and 10% water content with different WFS %: (a) 0%, (b) 5%, (c) 10% and (d) 15%.
Civileng 06 00026 g011aCivileng 06 00026 g011b
Table 1. Grading of SGM [20].
Weight Percentage Passing
Sieve Size
(mm)
Passing
(%)
Limits of
SCRB/R6, 2003
50100100
2588.575–95
9.574.540–75
4.7551.230–60
2.3641.421–47
0.32714–28
0.07514.35–15
Table 2. Physical characteristics and chemical analysis of SGM [20].
PropertiesValuesLimits to SCRB/R6, 2003
MDD (gm/cm3)2.24Not limited
Optimum moisture content (OMC) (%)7.00Not limited
Organic matter (%)0.84Maximum = 2
T.S.S. (%) 7.58Maximum =10
SO3 content (%)2.60Maximum = 5
Gypsum content (%)5.59Maximum = 10.75
Table 3. Clay properties of subgrade soil type.
PropertiesResultsRequirement for
Specifications
MDD (gm/cm3)1.81AASHTO T99-95
OMC (%)11.2AASHTO T99-95
Liquid limit (%)32AASHTO T89-96
Plastic limit (%)21AASHTO T90-96
Table 4. Dimensional and physical characteristics of the biaxial geogrid BX1100 (G1).
Physical PropertiesInformation
TypeBiaxial geogrid
ColorBlack
PolymerPP
Rib shapeRectangular
Guide propertiesUnitsMDXMD
Rib thicknessmm0.760.76
Opening dimensionsmm2533
Tensile strength *kN/m12.419
Tensile strength **kN/m8.513.4
Tensile strength ***kN/m4.16.6
* at break; ** at 5% strain; *** at 2% strain.
Table 5. Comparison of the properties of basic clay soil with stabilized clay soil.
Sample No.WFS
(%)
OMC
(%)
Comparison
(%)
MDD
(%)
Comparison
(%)
CBR
(%)
Comparison
(%)
1011.2 1.81 5.1
2510.5−6.251.86+2.75.8+17.6
31010.1−9.81.90+4.97.7+50.9
4159.7−13.391.94+7.18.3+62.7
Table 6. Shear properties with different percentages of WFS.
StateDensityW
(%)
WFS (%)σ
(kPa)
π
(kPa)
c
(kPa)
δ
(°)
Comparison
(%)
clay-subbase1.7110025352522
5045
7555
clay-G1-subbase1.711002539.53020.8
5049
7558.5
525453523+14
5056
7566.8
1025544225.6+36
5066
7578
1525635027.5+55
5076
7589
Table 7. Shear interaction coefficients for 75 kPa normal stress.
WFS
(%)
η
01.06
51.21
101.41
151.6
Disclaimer/Publisher’s Note: The statements, opinions and data contained in all publications are solely those of the individual author(s) and contributor(s) and not of MDPI and/or the editor(s). MDPI and/or the editor(s) disclaim responsibility for any injury to people or property resulting from any ideas, methods, instructions or products referred to in the content.

