Abstract
The finite element method was used to study the feasibility of concrete-filled, fiber-reinforced polymer tubes (CFFTs) for small-scale wind turbine towers in remote areas. Although CFFTs have been successfully employed for a variety of structural applications, their use for wind turbine towers is novel and has yet to be investigated in detail. The objective of the study was to identify, for the first time, the most important parameters for design and compare the behavior of CFFT towers versus conventional steel and concrete towers. The model was first validated using experimental results reported in the literature followed by a series of parametric studies to evaluate the importance of several key parameters. In the first phase, the effect of different geometric properties (taper and concrete filling ratio) and reinforcement configurations (FRP laminate configuration, steel reinforcement ratio, and prestressing level) were investigated for cantilever tower models with concentrated lateral loads. A 10 m high CFFT wind turbine tower model was subsequently modeled and studied under different loading configurations. The influence of the height-to-diameter (h/D) ratio on cantilever CFFT models was also studied and a conservative preliminary design that can be refined for specific turbine systems and wind conditions was adopted using the h/D ratio. The CFFT tower model was compared to concrete and steel tubular models with similar geometry to study the advantages of CFFT towers and showed that CFFTs can be an efficient alternative.
1. Introduction
In Canada, over 200,000 individuals are living in one of nearly 300 remote communities that are not connected to the main North American electricity grid. As a result, they lack access to reliable and affordable electricity and need to produce electricity locally. These decentralized electricity costs are generally much higher than in urban areas because they rely on expensive diesel generators while the associated air pollution harms the environment and may affect the health of local residents. These high electricity rates can be attributed to poor economies of scale, high operational costs, high transportation costs for diesel fuel, high diesel storage costs, and fluctuating diesel fuel prices [1]. In those areas, wind power is considered to be a good alternative to diesel energy.
Small-scale wind turbines can be used in remote areas to reduce the use of diesel generators and fuel costs since they can be installed off-grid [2]. Small-scale wind turbines are easier to install and maintain, so they are more cost-effective in remote areas than medium- or large-scale wind turbines [3].
Wind turbine towers are often made of steel tubes, lattices, or concrete. Although each design presents certain benefits, conventional wind turbine towers also have disadvantages. Lattice towers are expensive to construct and prone to maintenance and fatigue issues. Steel tubular towers are also very expensive, and the transportation of large steel segments can be a significant challenge; steel towers may only have a 20-year life span, and the corrosion resistance and operation and maintenance costs are predicted to be extremely high during the service life. Concrete towers, on the other hand, are much heavier, requiring a larger foundation as well as formwork and reinforcement [4,5].
Concrete-filled, fiber-reinforced polymer tubes (CFFTs) are a potential alternative to conventional steel and concrete towers. They are versatile and relatively easy to construct (either prefabricated or cast-in-place) and the FRP tubes are lightweight to facilitate transport requirements. In addition to acting as a permanent formwork for the concrete, the outer FRP tube ensures that CFFTs have good structural performance, as shown in several studies [6,7]. The tubes can also be used to facilitate segmental construction to simplify the transportation and erection of the towers [8]. FRP material is corrosion-resistant, so CFFTs can perform well in harsh weather conditions. Consequently, the maintenance costs are lower and the life span can be longer [9,10]. Although CFFTs have been successfully used for a variety of structural applications under axial and flexural loadings including for bridge members, pile foundations, piers, and other purposes [11,12], in-depth evaluations of their potential for wind turbine towers are currently lacking in the available literature [13].
The effect of wind action on turbine towers can be estimated using computational fluid dynamics simulations (e.g., [14]). Alternatively, loads for small wind turbines can be calculated using a simple method provided by IEC 61400-2 [15]. For a wind turbine that is parked (i.e., at a standstill), the horizontal drag force, , is calculated according to Equation (1):
in which is the drag coefficient that is assumed to be 1.5, is the extreme wind speed with a 50-year recurrence time interval, is the projected area of the blade, and is the number of blades.
The aerodynamic forces on the tower and nacelle are calculated as follows:
in which is the force coefficient of the tower and is assumed to be 1.3, is the force coefficient of nacelle and is assumed to be 1.5, and and are the projected area of the tower and nacelle, respectively.
The ultimate flap bending moment, , is calculated as follows:
in which is the radius of the wind turbine.
For furling or constantly spinning turbines, and change, and can be calculated using the following equations:
in which is the 50-year extreme tip steep ratio and is the maximum lift coefficient at the tip, which is assumed to be 2.0.
The finite element (FE) method has been frequently employed to study the influence of different parameters on the performance of CFFTs. To the best of the authors’ knowledge, this is the first study to model the performance of CFFTs for use as small-scale wind turbine towers. Nevertheless, the suitability of FE models to evaluate the performance of both hollow FRP tubes and CFFTs in flexure and under axial loads has been demonstrated in previous studies, which lends credibility to this approach. While experimental testing is both costly and time-consuming, FE models can be used to investigate the effects of a wide range of parameters in a shorter period of time and without the associated material and equipment costs. For example, a previous study by Son and Fam [16] employed ANSYS to model hollow FRP tubes and CFFTs under uniform loading and four-point bending. Load–deflection and stress–strain responses were obtained using the finite element method and verified with experimental results. The model was then used to conduct a parametric study, thus expanding the scope of work and providing key insights into fundamental behavior. The results showed that a decrease in the fiber angle led to an increase in flexural strength and the effectiveness of the concrete fill. Partially filled FRP tubular poles in flexure were also studied according to the finite element model. A simple design method that can predict the optimum concrete filling length was also developed in this research [16,17].
Other applications of CFFTs have also been investigated successfully using FE models. The use of CFFTs as deep foundations in sandy soil was studied using the finite element method by El-Nemr et al. [18]. In this study, researchers used ABAQUS to see the influence of 28 different types of FRP materials and the slenderness ratio on CFFT pile foundations. The results indicated that CFRP tubes had a lower settlement than GFRP tubes due to the higher elastic modulus, and increasing CFRP pile lengths improved overall settlement more effectively than similar increases in the length of GFRP piles.
In a separate study, Raza et al. [19] used ABAQUS to investigate the performance of CFFT columns. The columns were first tested under axial concentric and eccentric loads and the FE results were then compared to experimental results, presenting a close agreement. After the model validation, the finite element models were used to examine the influence of important parameters including the number of reinforcing bars, the thickness of the FRP tube, the concrete strength, and the diameter of columns to identify their relative importance for design. The results were also compared with analytical results.
Although CFFT towers for wind turbine applications have not yet been investigated, similar FE models have been developed for conventional tower systems. For example, a prestressed concrete tower for wind turbines was studied using the finite element method software programs OpenSees, https://opensees.berkeley.edu/index.php (accessed on 23 January 2024) and ABAQUS, version 6.6, by Cao et al. [20]. A beam–column model was first built in OpenSees to investigate the global structure response. Subsequently, a single cylinder segment of the tower was simulated with ABAQUS to obtain the rotation–moment relationship and explore local behavior in greater detail. The FE results presented good agreement with field test results.
It is difficult to test large beams and columns experimentally due to costs and field restrictions. In light of this challenge, multiple studies, such as those presented above, have shown that the finite element method can be a reliable tool for understanding the behavior of CFFTs and wind turbine towers. Hence, this study aims to use the finite element software ABAQUS to investigate the influence of key parameters on CFFT performance to improve the feasibility of wind energy solutions for remote areas.
2. Model Validation
2.1. Experimental Studies
To validate the FE model presented in subsequent sections, experimental results from CFFT tests reported in the literature were collected. Fam [21] tested the structural behavior of hollow FRP tubes (referred to herein as Beam 1), CFFT beams (Beams 2 and 3), and short columns (Stubs 1 and 2), the results of which are used here to validate the FE model. The flexural members (Beams 1, 2, and 3) were tested under four-point bending with roller supports at each end, while stub specimens (Stubs 1 and 2) were tested under uniaxial compression. Multiple types of FRP tubes were evaluated in Fam’s study, having different diameters, thicknesses, and ply configurations (for details refer to [21]). Specimen geometries are presented in Table 1 and Table 2 as reported by [21]. Strain gauges and displacement transducers were used to instrument the midspan location of each tested specimen.

Table 1.
Geometry of hollow tubes and CFFTs [21].

Table 2.
Geometry of stubs [21].
Due to the different geometry of each specimen, the mesh size varied for each model. The mesh size of Beam 1 was about 7 mm. Beam 2 and Beam 3 were meshed with a varying mesh size (i.e., finer mesh near concentrated loads) in order to save computational time and capture a more accurate material behavior in critical regions at the same time (Figure 1). At the midspan of Beam 2 and at the loading points and midspan of Beam 3, the mesh sizes were 7 mm and 50 mm, respectively. The coarser meshed regions of Beam 2 and Beam 3 were 15 mm and 90 mm, respectively. The mesh sizes of Stub 1 and Stub 2 were 12 mm and 7 mm. All the mesh sizes were selected based on a convergence study of load-deflection and load–strain results.

Figure 1.
Example mesh for Beam 2.
Beam 2 was considered symmetric, as the slight asymmetry in the laminate structure with angle-plies oriented at [3°/88°] with respect to the longitudinal axis was ignored. One-quarter of the beam was modeled with planes of symmetry both along the length and through the cross-section at the midspan. Beam 1 and Beam 3 were modeled as full beams. The two full beams were restricted in the y- (vertical) direction at both ends and in the x- (longitudinal) and z- (transverse) directions at the midspan, as shown in Figure 1. The two stubs were fixed at the bottom surface.
2.2. Constitutive Models
2.2.1. Concrete
The stress–strain relationship for the concrete in compression was obtained using the Hognestad concrete model (Figure 2) [22]. Figure 3 shows the tensile stress–strain relationship. Poisson’s ratio (υ) was assumed to be equal to 0.3. Plastic properties were defined using the concrete damaged plasticity (CDP) model in ABAQUS 2019. It is a widely used model, and its effectiveness has been proven in several research studies [19,23,24]. After several trials found a low overall model sensitivity to changes in CDP parameters, results for this study were obtained using default values (i.e., 30°, 0.1, 1.16, 0.667, and 0.00001 for dilation angle, flow potential eccentricity, ratio of initial equibiaxial compressive yield stress to initial uniaxial compressive yield stress, ratio of the second stress invariant on the tensile meridian, and viscosity parameter, respectively).
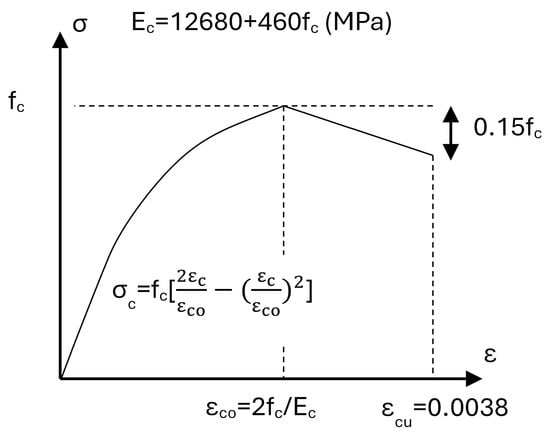
Figure 2.
Hognestad concrete model (adapted from [22]).
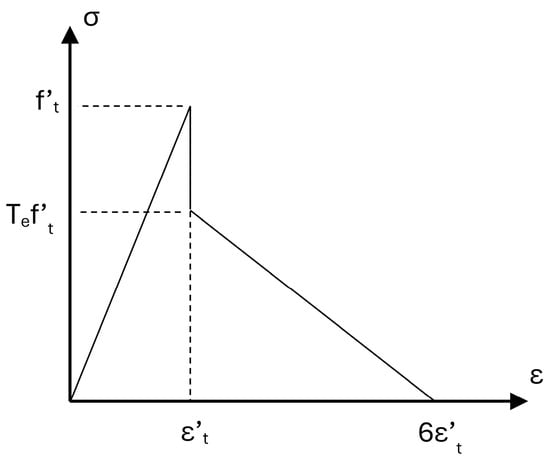
Figure 3.
Tensile behavior of concrete (adapted from [16]).
2.2.2. FRP
The FRP material was defined as a lamina structure. Tsai–Wu failure criteria were used to define the failure. The Tsai–Wu criterion for orthotropic FRP materials is shown in Equation (7):
in which represents the strength tensors that are calculated using tensile and compressive strengths parallel to the fibers or in the transverse direction and is stress in a given direction.
Each lamina of the FRP tubes had the same mechanical properties that are reported by Son and Fam [16] and reproduced in Table 3. The different mechanical properties presented in Table 1 and Table 2 result from the different ply configurations of the various tubes that were used.

Table 3.
Material properties for a single lamina [16].
2.3. Element Type and Interaction
Two different elements were used during the analysis. A 3D eight-node element with hourglass control with reduced integration (C3D8R) was used to model the concrete and a four-node quadrilateral shell element with reduced integration (S4R) was selected to model the FRP tube.
The two parts of the model were connected using surface-to-surface contact, which describes contact between two deformable surfaces. The concrete core was selected as the master surface while the FRP tube was the slave surface since the concrete core had higher stiffness. The relative sliding of the two surfaces was assumed to be small. The contact cohesive behavior option was selected as the surface interaction property since the interface thickness was negligible.
2.4. Results
The mid-span deflection and longitudinal strain at the top and bottom of the tubes in the maximum moment region were compared to the experimental results (Table 4). Failure modes of the CFFT beams are presented in Figure 4, which are in agreement with those reported by [16]. The estimated load and deflection results at failure of the three beams agreed with the experimental results well, as shown in Figure 5 and Figure 6, but some discrepancies were observed with respect to ultimate strains for Beam 1 and Beam 3. Possible reasons for the error might be the slip between the tube and the concrete core that occurred during the experiments that was neglected during the finite element analysis. Other possible reasons for the observed error include inaccuracies associated with the selected constitutive models for the constituent materials and/or contact interactions as well as possible local damage in the FRP tube that was not captured by the model.

Table 4.
Actual and estimated results.
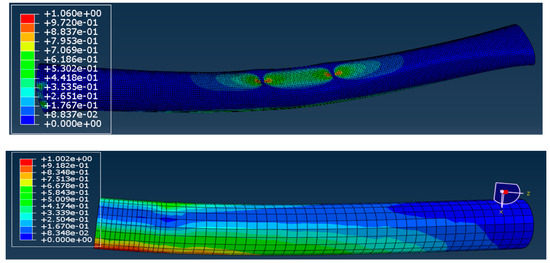
Figure 4.
Tsai–Wu failure criterion of Beam 1 and Beam 3.
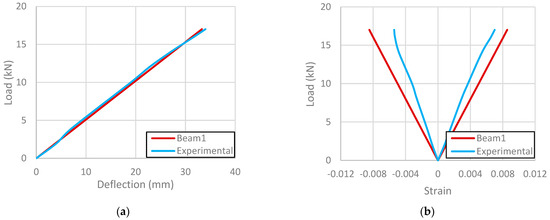
Figure 5.
Beam 1 (a) load–deflection relationship and (b) load–axial strain relationship.
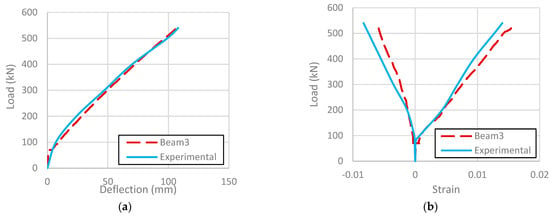
Figure 6.
Beam 3 (a) load–deflection relationship and (b) load–axial strain relationship.
Among the axially loaded columns, Stub 2, which was fully filled, had better agreement than Stub 1, which was partially filled. This could possibly be attributed to the lower confinement in the hollow core of Stub 1 or to inaccuracies associated with the selection of constitutive models and contact properties. Figure 7 shows the load–deflection and load–strain relationships of the two stubs.
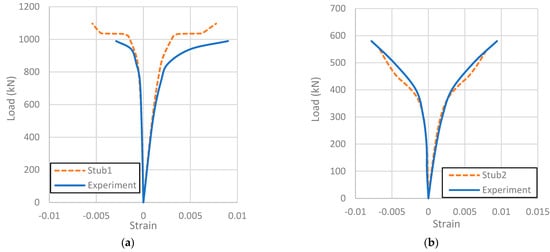
Figure 7.
Load–strain relationship of (a) Stub 1 and (b) Stub 2.
The behavior of the models was considered to be acceptable for the purpose of this study since the performance of wind turbine towers is mostly controlled by bending. Overall, the modeling results were promising as the estimated results obtained were in good agreement with the experimental results.
3. Parametric Study
3.1. Constitutive Models and Element Type
The Hognestad concrete model was adopted for the stress–strain response, as discussed in Section 2.2.1. The concrete compressive strength used for the model simulations was 47 MPa. The FRP material was modeled in the same way as the validation study.
Steel reinforcing bars were used while modeling concrete wind turbine towers and CFFT wind turbine towers. They were modeled as a perfectly elasto-plastic material with the properties presented in Table 5.

Table 5.
Steel rebar sizes and material properties.
Prestressed tendons were used in the concrete wind turbine tower models and CFFT wind turbine tower models. Prestressing tendons do not have a typical yield point and were modeled with a non-linear stress–strain relationship according to [25]. Table 6 shows the sizes and material properties of the prestressing tendons.

Table 6.
Tendon sizes and material properties.
To introduce prestressing in ABAQUS, the initial temperature load method was used. In this method, the prestressing force was applied by specifying an equivalent temperature change to the tendons according to Equation (8) [24]:
in which C is the applied temperature (°C); c is the coefficient of linear expansion, which is 1.0 × 10⁻⁵ (MPa/°C) for steel tendons; E is the prestressing tendon elastic modulus; A is the tendon cross-sectional area in mm2; and P is the applied force in N.
The steel elastic modulus and Poisson’s ratio used for modeling steel tubular towers were different from those of steel reinforcing bars. The yield stress fy and the corresponding strain εy were considered to be 350 MPa and 0.00175, respectively. A bilinear elastic–plastic steel material property was adopted with a strain-hardening tangential modulus of E/65 [26].
Three different element types were used in this study. The concrete and FRP tubes were modeled in the same way as the model validations presented in Section 2.3, which were C3D8R and S4R elements, respectively. The steel towers were also modeled using C3D8R elements. The steel reinforcing bars and prestressing tendons were modeled using 3D two-node linear truss (T3D2) elements that could simulate two-node linear displacement.
The FRP tube and concrete core were connected using surface-to-surface contact, which was the same as the validation models in Section 2.4.
The steel reinforcing bars and prestressing tendons were embedded into the concrete core. In this case, the steel reinforcing bars and steel tendons were selected as the embedded regions, while the concrete core was selected to be the host region. The host elements and the embedded elements were considered to be perfectly bonded.
3.2. Part A: Effect of Geometry and Reinforcement
Twelve CFFT wind turbine tower models, including one control specimen (D1), were created to test the influence of different parameters including taper ratio, fiber orientation, concrete filling ratio, steel reinforcement ratio, and prestressing level. Models were all subjected to a horizontal concentrated load applied at the top of the tower.
Table 7 shows the geometric properties of Model D1 and the changes in each model. Table 8 shows the stacking sequence of Models D1, D7, and D8.

Table 7.
Dimensions of CFFT models.

Table 8.
FRP stacking sequence of CFFT models.
In order to improve computational efficiency, towers that were loaded concentrically were modeled with a symmetry condition as shown in Figure 8a. Symmetry was enforced along the x-z plane by restricting translation in the y-direction as well as rotation in the x- and z-directions. The bottom surface of the tower model was fixed using reference point RP1, which means all six degrees of freedom were restricted.
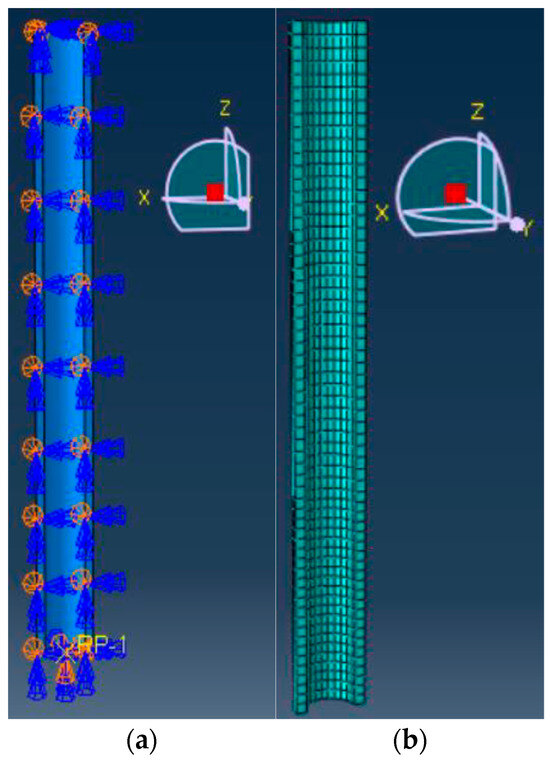
Figure 8.
Model D1: (a) geometric shape; (b) mesh.
A mesh sensitivity test was performed in which the failure load, strain at the base, and deflection at the top of the models were compared to ensure convergence. The selected mesh sizes were 150 mm for the lower third of the models and 175 mm for the upper two-thirds of the models, as shown in Figure 8b. Figure 9 shows cross-sections of Models D9 and D10, not including the 10 mm outer FRP layer.
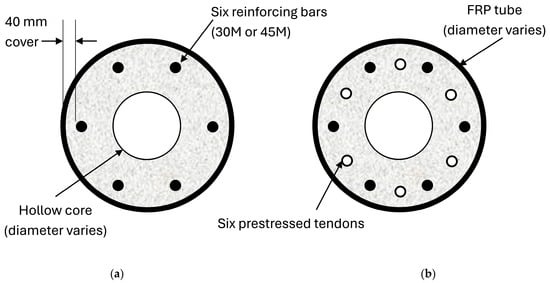
Figure 9.
(a) Steel reinforced model and (b) prestressed model.
3.3. Part B: Loading Configuration
Twelve models were tested in this section of the experiment. Table 9 shows the geometry of the various models. The geometric shape of Models L1 to L12 was the same and was selected according to the results of Models D1 to D19. Parameters providing the highest load capacities in the previous study were used in this section.

Table 9.
Geometric details of CFFT models.
The taper ratio, concrete filling ratio, concrete strength, steel reinforcement ratio, number of prestressing tendons, and prestressing level were 2%, 50%, 47 Mpa, 2.3%, 6, and 50%, respectively, and were the same for all 12 models. Six 45 M steel rebars and six seven-wire strands were modeled for each specimen. Table 10 and Table 11 show the different load scenarios and geometric details, respectively. Three different loading conditions are shown in Figure 10.

Table 10.
Different loading conditions of CFFT models.

Table 11.
Models L13, L14, and L15.
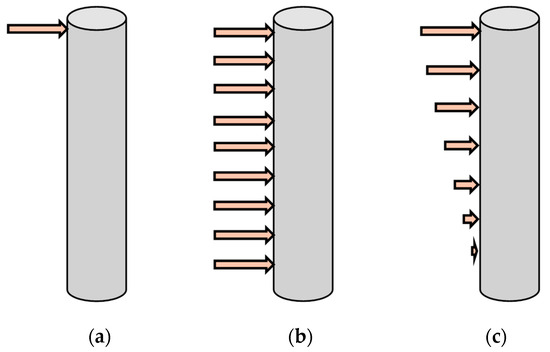
Figure 10.
Loading conditions: (a) concentrated; (b) uniform; (c) triangular.
The twelve models were tested under different loading conditions and, in some cases, the applied loads were not symmetric; therefore, entire 3D towers were developed for Models L2 to L12 rather than symmetric half towers. The base of the model was fixed, so all six degrees of freedom were restricted at the bottom surface.
The mesh sizes of Models L1 to L12 were also the same as that of Model D1.
3.4. Part C: Tower Height
Models L13, L14, and L15 were simulated to extend the range of tower heights in this study and were tested under the same loading condition as Model L1 to study the influence of the h/D ratio. Models L13, L14, and L15 were larger than the other models, so the mesh sizes were larger as well. At the lower one-fifth, the mesh size was 150 mm, and at the upper four-fifths, the mesh size was 250 mm. Table 11 shows the sizes of Models L13 to L15. Figure 11 represents the shape and mesh of Model L13.
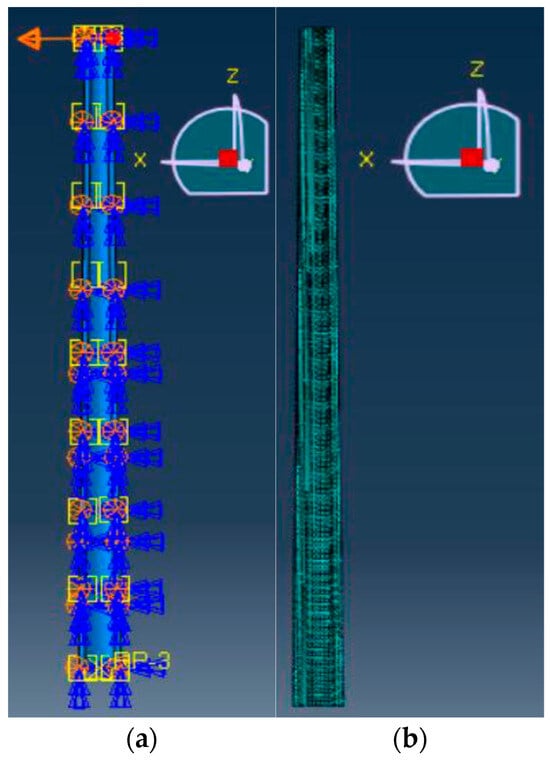
Figure 11.
Model L13: (a) geometric shape; (b) mesh.
3.5. Part D: Tower Type
One concrete wind turbine tower model (C1) and one steel tubular tower model (S1) were developed, analyzed, and compared to the CFFT wind turbine tower model (L1). The concrete and steel wind turbine tower models were tested under concentrated horizontal loads at the top of the tower, which was the same as Model L1. Table 12 shows the concrete and steel tubular wind turbine tower model sizes.

Table 12.
Dimensions of concrete and steel wind turbine tower models.
The steel reinforcing, prestressing, geometric shape, concrete strength, boundary conditions, mesh, and loading of Model C1 were the same as for Model L1, which was used as a reference. The restrictions, loading conditions, and mesh size of Model S1 were also the same as for Model L1, except that local buckling tests were also conducted due to the thin-walled structure. A full tower model was developed, and the mesh size was 30 mm. The boundary conditions were the same as those for the full CFFT models.
4. Results
4.1. Part A: Geometry and Reinforcement
The load–deflection curve of each model was obtained and compared to the control specimen Model D1 to find out the influence of different parameters on the tower behavior, as shown in Figure 12. Overall, a bilinear load–deflection response was obtained for CFFT tower models without inner reinforcement, while the change in geometric parameters primarily influenced the slope of the load–deflection curves.
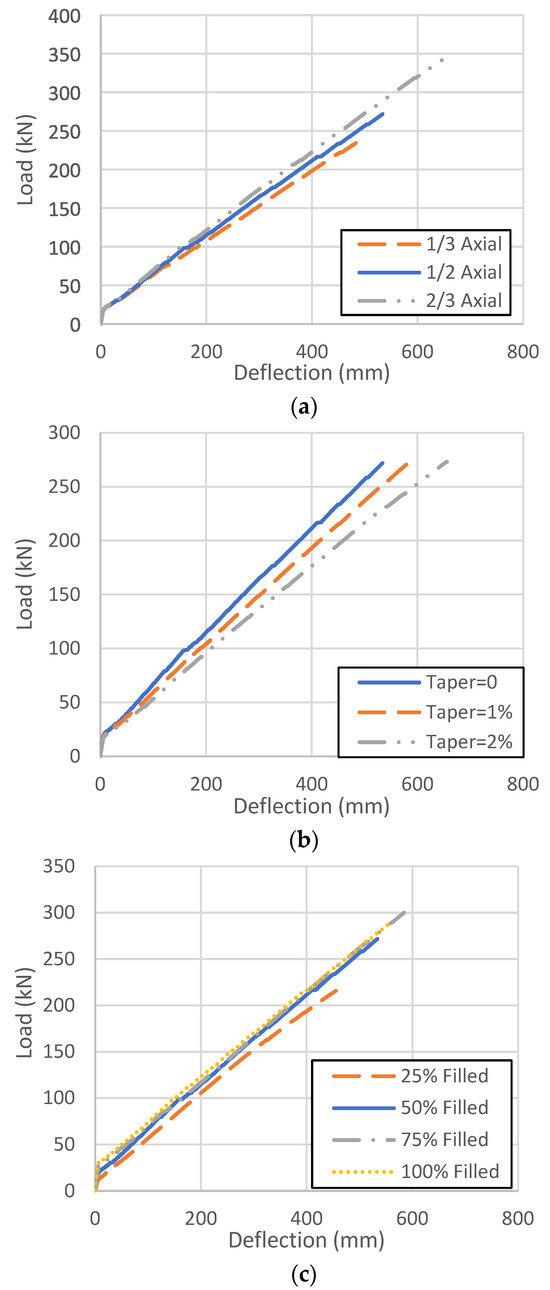
Figure 12.
Load–deflection relationship of models with different (a) fiber orientations, (b) taper ratios, and (c) concrete filling ratios.
The figures indicate that the decrease in the proportion of fibers in the hoop direction (Figure 12a) improved the performance of CFFT wind turbine towers; the taper ratio (Figure 12b) did not affect the load capacity but did influence the deflection of the CFFT wind turbine towers. The influence of the concrete filling ratio (Figure 12c) varied and seemed to be significant below a certain threshold (50%).
The flexural stiffness of the CFFT models improved significantly with the increase in steel reinforcement and prestressing; however, the ultimate capacity only improved moderately (Figure 13).
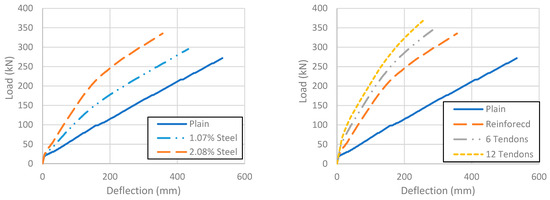
Figure 13.
Load–deflection relationship of models with different steel reinforcement and prestressing.
4.2. Part B: Loading Configuration
Figure 14a,b show the load–deflection and moment–deflection curves of models tested under different loading conditions. The purpose of this exercise was to distinguish the relative importance of loads transferred from the wind turbine nacelle (which were concentrated at the top of the tower) relative to distributed wind loads along the tower height. Deflections were obtained at the top of the tower models, while reaction moments were obtained at the bottom of the tower models. Internal steel reinforcement (2% reinforcement ratio) was included, resulting in non-linear load–deflection responses. As expected, the highest total load was resisted under uniformly distributed conditions and the lowest total load was resisted when concentrated at the top of the tower model, which also corresponded to larger ultimate deflections. Axial loads corresponding to the weight of the nacelle produced very small axial displacements and compression stresses in the tower (Table 13).
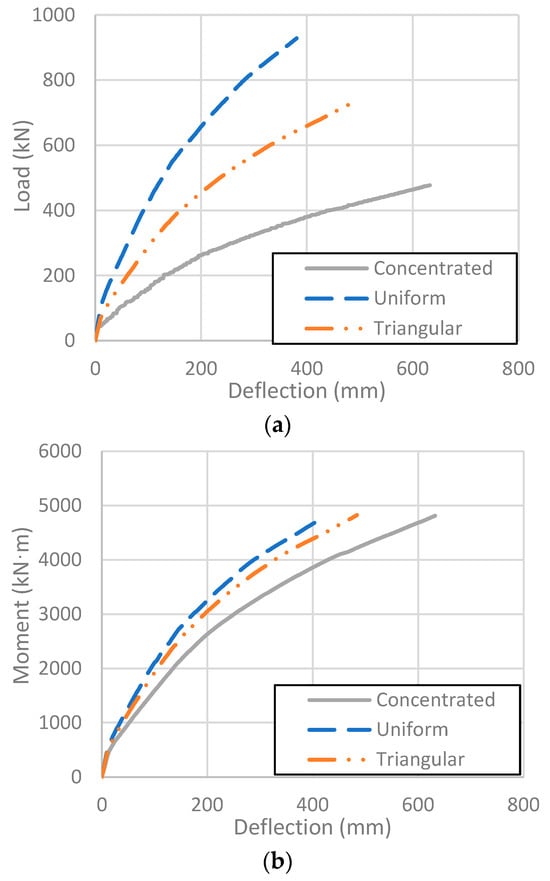
Figure 14.
Models L1, L2, and L3: (a) load–deflection curve; (b) moment–deflection curve.

Table 13.
Axial deflection of Models L6, L7, and L8.
Overall, the load capacity, stiffness, and moment were similar for the three models with different load eccentricities (Table 14). The moment about the tower longitudinal axis (i.e., torsion) increased with the increase in load eccentricity, but the value was relatively small and had a negligible effect on the failure load.

Table 14.
Failure mode and details of Models L4 and L5.
Gravity loads associated with the weight of the turbine and the tower itself were also considered by applying an axial load up to 300 kN, which was larger than the weight of small wind turbines. In all cases, the axial deflection was negligible, as shown in Table 13. Models L9 to L12 were tested under combined loads and compared to Model L9, as shown in Table 15. Increasing the load eccentricity increased the effect of the axial load on the moment at the deflection limit, taken as 1.25% of the tower height [27]. However, the influences of load eccentricity and axial load were not significant. At the service load (calculated using wind speed and wind turbine parameters with Equation (1) through (6), as shown in Table 16), increasing the load eccentricity increased the deflection significantly, as Models L10 and L12 had 64.3% and 66.1% higher deflection than Model L9, respectively, although these deflections were still less than 10% of the deflection limit. On the other hand, Model L11 had the same deflection as Model L10, which indicates that the axial load did not influence the deflection at the service load.

Table 15.
Results for models under combined load.

Table 16.
Service load.
4.3. Part C: Tower Height
Models L13 to L15 extended the range of tower heights and diameters considered in this study. The deflection limit of the wind turbine tower was considered to be 1.25% of the height (Nicholson, 2011, [27]). Wind speed and wind turbine tower parameters were used to calculate the service load. The average wind speed () and the extreme wind speed with a 50-year recurrence time interval () were obtained using wind class 2 (medium wind), which is similar to the wind condition in remote areas (8.5 m/s and 59.5 m/s, respectively). A 5 kW small wind turbine was considered in the calculation.
Figure 15 shows the load–deflection relationships of these three models as well as of Model L1. The circular marks represent the service load and the triangular marks represent the deflection limit. It is clear that for Models L1 (h/D = 10) and L14 (h/D = 13.3), the service load was lower than the load at the deflection limit (i.e., over-designed); however, for Models L13 (h/D = 16.7) and L15 (h/D = 20), the service load was larger than the load at the deflection limit (i.e., under-designed). The main reason for the difference is the different height-to-diameter ratios (h/D). Models L13 and L15 had a higher h/D ratio; in consequence, they had lower stiffness and resisted lower loads at the deflection limit. Table 17 presents the results for Models L13, L14, and L15 compared to Model L1.
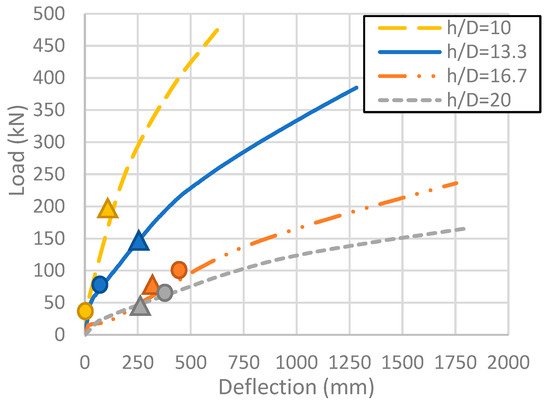
Figure 15.
Load–deflection relationships of Models L1 and L13 to L15 (circle = service load, triangle = deflection limit).

Table 17.
Results for models with different h/D ratios.
4.4. Part D: Tower Type
The reinforced concrete models experienced flexural failure near the base of the model due to steel reinforcement yielding followed by concrete crushing. The concrete first cracked at the tension side; then, the tensile steel reinforcing bars yielded; finally, the concrete at the compression side crushed and the concrete failed.
The global failure of the steel tower was associated with the Von Mises stress reaching the ultimate tensile strength of steel. However, the buckling test results of steel tower Model S1 indicated that the local buckling load was 46.5% lower than the global failure load, suggesting that the design was governed by local stability.
Table 18 and Figure 16 compare the results and the load–deflection responses for Models L1, C1, and S1, which all had fairly similar overall geometries and performance at service. It is noted that the CFFT model had the highest load capacity and ultimate deflection of these selected models. Model C1 had 7.4% lower weight than Model L1 but had 52.6% and 60.9% lower maximum load and deflection, respectively. It is also important to note that the concrete cover used in the models was only 40 mm since the FRP tube provides excellent protection against corrosion. In the absence of the FRP tube, this cover may need to be increased, which reduces the structural efficiency of the tower and increases the weight. Further optimization of the CFFT design for specific loading conditions is also possible. Model S1 failed before reaching the deflection limit due to local buckling and had a 51.2% lower maximum load than Model L1. Steel towers are lighter than concrete and CFFT towers, but they are less durable and can be difficult to transport. On the contrary, lightweight FRP tubes can be transported more easily to site and work as stay-in-place formwork, so CFFTs can be filled on site and reduce the need for temporary formwork.

Table 18.
Results of Models L1, C1, and S1.
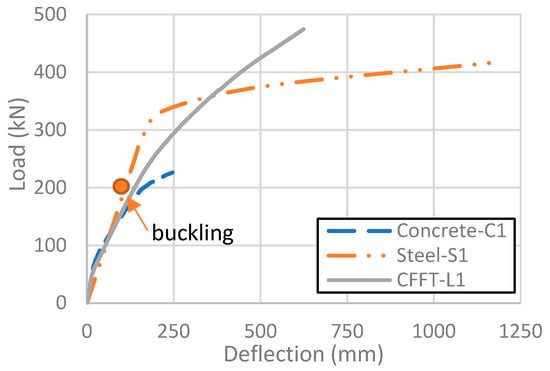
Figure 16.
Load–deflection relationships of models.
5. Conclusions
This study used the FE method to investigate the influence of different parameters on wind turbine towers made of CFFTs as an alternative to conventional towers made of steel or concrete. CFFTs present advantages with respect to transportation, constructability, structural performance, and durability, and combine the benefits of the constituent materials to produce a robust and efficient structural system. The following conclusions can be drawn based on the results of this study:
- Increasing the fiber ratio oriented in the longitudinal direction can increase the load capacity of wind turbine towers loaded primarily in flexure. Axial loads associated with the nacelle self-weight were negligible for the small-scale turbines considered in this study.
- The taper ratio only influences the stiffness of CFFT models and does not affect the load capacity. The use of tapered tubes is useful to facilitate segmental construction since tube segments can be “stacked” to achieve desired tower heights (the design of these segmental connections is outside the scope of the present study).
- Increasing the concrete filling ratio improves the behavior of CFFT models up to approximately 50%; however, further increases in the filling ratio had only a marginal effect on structural tower performance.
- Increasing the steel reinforcement ratio and prestressing ratio increased the load capacity and stiffness of the towers while also resulting in non-linear load–deflection behavior. The use of post-tensioned strands can potentially provide continuity for segmental tower construction (this is the subject of ongoing research).
- Wind turbine towers are subjected to combined loading that includes distributed tower loads, concentrated lateral loads, torsional moments, and axial loads due to self-weight. In this study, the simplified load case corresponding to a single concentrated load applied at the top of the tower resulted in the lowest load capacity and the highest deflection, suggesting that it can be used conservatively to develop a preliminary tower design. The effects of load eccentricity were not significant. Further research employing computational fluid dynamics simulations is recommended to confirm the dynamic response of these tower systems.
- With the same prestressing level and geometry, the CFFT model showed better behavior in load capacity, stiffness, and local stability compared with other tower types. In addition to its structural performance, the CFFT tower system is expected to be a durable and low-maintenance alternative for wind energy in remote areas.
- Increasing the h/D ratio decreases the load capacity and increases the displacement at failure. Though the deflection limit differs for different model heights, the load at the deflection limit decreases with the increase in the h/D ratio. Based on the tower configurations considered in this study, a preliminary design of a CFFT wind turbine tower is recommended to have an approximately 15 h/D ratio, 2% taper ratio, 50% concrete filling ratio, 10 mm GFRP tube thickness, and 2% steel reinforcement ratio. The prestressing level and other parameters can be refined based on the calculated wind loads and other salient factors such as location and turbine size.
Author Contributions
Conceptualization, Y.G. and M.N.; methodology, Y.G. and M.N.; software, Y.G.; validation, Y.G.; formal analysis, Y.G.; investigation, Y.G.; resources, M.N.; writing—original draft preparation, Y.G.; writing—review and editing, M.N.; visualization, Y.G.; supervision, M.N.; project administration, M.N. All authors have read and agreed to the published version of the manuscript.
Funding
This research received no external funding.
Data Availability Statement
Data is available upon reasonable request to the authors.
Conflicts of Interest
The authors declare no conflict of interest.
List of Symbols
| cross-sectional area of prestressing tendons | |
| projected area of wind turbine blades | |
| projected area of wind turbine nacelle | |
| projected area of wind turbine tower | |
| number of blades in the wind turbine | |
| coefficient of thermal expansion | |
| equivalent temperature to simulate prestressing in numerical model | |
| drag coefficient, assumed to be 1.5 | |
| force coefficient of nacelle, assumed to be 1.5 | |
| force coefficient of the tower, assumed to be 1.3 | |
| maximum lift coefficient at the tip, assumed to be 2.0 | |
| diameter of wind turbine tower | |
| maximum deflection of the turbine tower | |
| deflection of the turbine tower at service | |
| Young’s modulus | |
| Young’s modulus of FRP lamina parallel to the fibers | |
| Young’s modulus of FRP lamina perpendicular to the fibers | |
| Ec | Young’s modulus of concrete |
| compressive strength of concrete | |
| strength tensor of FRP in direction i | |
| applied load corresponding to deflection limit | |
| ultimate load capacity of wind turbine tower | |
| horizontal force on turbine nacelle | |
| ultimate tensile strength of steel prestressing tendons | |
| tensile strength of concrete | |
| horizontal force on wind turbine tower | |
| horizontal drag force on wind turbine | |
| yield strength of steel reinforcement | |
| shear modulus of FRP lamina | |
| wind turbine tower height | |
| Tsai–Wu failure criterion | |
| ultimate flap bending moment of the wind turbine tower | |
| applied prestressing force | |
| radius of the wind turbine | |
| extreme wind speed with a 50-year recurrence time interval | |
| concrete strain | |
| concrete strain at peak compressive stress | |
| cracking strain of concrete | |
| yield strain of steel reinforcement | |
| 50-year extreme tip steep ratio | |
| υ | Poisson’s ratio for concrete |
| Poisson’s ratio of FRP lamina | |
| air density, assumed to be equal to 1.225 kg/m3 | |
| stress in FRP in direction i, j used to calculate Tsai–Wu criterion | |
| shear strength of FRP lamina | |
| compressive strength of FRP lamina parallel to fibers | |
| compressive strength of FRP lamina perpendicular to fibers | |
| tensile strength of FRP lamina parallel to fibers | |
| tensile strength of FRP lamina perpendicular to fibers |
References
- Knowles, J. Power Shift: Electricity for Canada’s Remote Communities; The Conference Board of Canada: Ottawa, ON, Canada, 2016; p. 76. [Google Scholar]
- Shafiei, A.; Dehkordi, B.M.; Farhangi, S.; Kiyoumarsi, A. Overall power control strategy for small-scale WECS incorporating flux weakening operation. IET Renew. Power Gener. 2016, 10, 1264–1277. [Google Scholar] [CrossRef]
- Chen, H.; Xu, D.; Deng, X. Control for Power Converter of Small-Scale Switched Reluctance Wind Power Generator. IEEE Trans. Ind. Electron. 2021, 68, 3148–3158. [Google Scholar] [CrossRef]
- de Lana, J.A.; Júnior, P.A.A.M.; Magalhães, C.A.; Magalhães, A.L.M.A.; de Andrade Junior, A.C.; de Barros Ribeiro, M.S. Behavior study of prestressed concrete wind-turbine tower in circular cross-section. Eng. Struct. 2021, 227, 111403. [Google Scholar] [CrossRef]
- Veljkovic, M.; Feldmann, M.; Naumes, J.; Pak, D.; Simões, L.; da Silva; Rebelo, C. 9—Wind turbine tower design, erection and maintenance. In Wind Energy Systems; Sørensen, J.D., Sørensen, J.N., Eds.; Woodhead Publishing: Sawsto, UK, 2011; pp. 274–300. [Google Scholar] [CrossRef]
- Fam, A.; Cole, B.; Mandal, S. Composite tubes as an alternative to steel spirals for concrete members in bending and shear. Constr. Build. Mater. 2007, 21, 347–355. [Google Scholar] [CrossRef]
- Shan, B.; Gui, F.C.; Monti, G.; Xiao, Y. Effectiveness of CFRP Confinement and Compressive Strength of Square Concrete Columns. J. Compos. Constr. 2019, 23, 04019043. [Google Scholar] [CrossRef]
- Watfa, A.; Green, M.; Fam, A.; Noël, M. Segmental hollow concrete filled FRP tubes (CFFT) for wind turbine towers. In Proceedings of the 10th International Conference on FRP composites in Civil Engineering, İstanbul, Turkey, 8–10 December 2021. [Google Scholar]
- Burgoyne, C. Fiber Reinforced Polymers–Strengths, Weaknesses, Opportunities And Threats. In Proceedings of the 9th International symposium on Fiber Reinforced Polymer Reinforcement for Concrete Structures (FRPRCS-9), Sydney, Australia, 13–15 July 2009. [Google Scholar]
- Van Den Einde, L.; Zhao, L.; Seible, F. Use of FRP composites in civil structural applications. Constr. Build. Mater. 2003, 17, 389–403. [Google Scholar] [CrossRef]
- Dagher, H.J.; Bannon, D.J.; Davids, W.G.; Lopez-Anido, R.A.; Nagy, E.; Goslin, K. Bending behavior of concrete-filled tubular FRP arches for bridge structures. Constr. Build. Mater. 2012, 37, 432–439. [Google Scholar] [CrossRef]
- Fam, A.; Pando, M.; Filz, G.; Rizkalla, S. Precast Piles for Route 40 Bridge in Virginia Using Concrete Filled FRP Tubes. PCI J. 2003, 48, 32–45. [Google Scholar] [CrossRef]
- Hasak, A.; Noel, M.; Green, M.; Fam, A. Flexural behavior of post-tensioned concrete filled FRP tube for wind turbine tower applications. In Proceedings of the 11th International Conference on FRP Composites in Civil Engineering, Rio de Janeiro, Brazil, 23–26 July 2023. [Google Scholar]
- Rizzo, F.; D’Alessandro, V.; Montelpare, S.; Giammichele, L. Computational study of a bluff body aerodynamics: Impact of the laminar-to-turbulent transition modelling. Int. J. Mech. Sci. 2020, 178, 105620. [Google Scholar] [CrossRef]
- IEC 61400-2; Wind Turbines—Part 2: Design Requirements for Small Wind Turbines. International Electrotechnical Commission: Geneva, Switzerland, 2006.
- Son, J.-K.; Fam, A. Finite element modeling of hollow and concrete-filled fiber composite tubes in flexure: Model development, verification and investigation of tube parameters. Eng. Struct. 2008, 30, 2656–2666. [Google Scholar] [CrossRef]
- Fam, A.; Son, J.-K. Finite element modeling of hollow and concrete-filled fiber composite tubes in flexure: Optimization of partial filling and a design method for poles. Eng. Struct. 2008, 30, 2667–2676. [Google Scholar] [CrossRef]
- El-Nemr, A.M.; Ashour, O.; Hekal, G.M. Finite element modeling of confined concrete piles with FRP tubes in sandy soil under static loading. In Insights and Innovations in Structural Engineering, Mechanics and Computation; CRC Press: Boca Raton, FL, USA, 2016; pp. 2122–2127. [Google Scholar]
- Raza, A.; ur Rehman, A.; Masood, B.; Hussain, I. Finite element modelling and theoretical predictions of FRP-reinforced concrete columns confined with various FRP-tubes. Structures 2020, 26, 626–638. [Google Scholar] [CrossRef]
- Cao, Y.; He, M.; Ma, R.; Yang, R.; Liang, F. Beam-column modeling and seismic fragility analysis of a prestressed segmental concrete tower for wind turbines. Adv. Struct. Eng. 2020, 23, 1715–1727. [Google Scholar] [CrossRef]
- Fam, A.Z. Concrete-Filled Fiber Reinforced Polymer Tubes for Axial and Flexural Structural Members. Ph.D. Thesis, The University of Manitoba, Winnipeg, MB, USA, 2000. [Google Scholar]
- Hognestad, E. A Study of Combined Bending and Axial Load in Reinforced Concrete Members; University of Illinois: Urbana, IL, USA, 1951. [Google Scholar]
- Al-Ilani, M.; Temsah, Y. Comparative study of modeling methods used to simulate initial stresses in prestressed beams towards manual analysis. MATEC Web Conf. 2019, 281, 01014. [Google Scholar] [CrossRef]
- Ren, W.; Sneed, L.H.; Yang, Y.; He, R. Numerical Simulation of Prestressed Precast Concrete Bridge Deck Panels Using Damage Plasticity Model. Int. J. Concr. Struct. Mater. 2015, 9, 45–54. [Google Scholar] [CrossRef]
- JCSS. Probabilistic Model Code Part III—Resistance Models; Joint Committee on Structural Safety: Zürich, Switzerland, 2005. [Google Scholar]
- Khedmati, M.; Nouri, Z.; Roshanali, M. A comparative computational investigation on the effects of randomly distributed general corrosion on the post-buckling behaviour of uniaxially loaded plates. J. Mech. Sci. Technol. 2013, 26, 767–783. [Google Scholar] [CrossRef]
- Nicholson, J.C. Design of Wind Turbine Tower and Foundation Systems: Optimization Approach. Master’s Thesis, University of Iowa, Iowa City, IA, USA, 2011. [Google Scholar]
Disclaimer/Publisher’s Note: The statements, opinions and data contained in all publications are solely those of the individual author(s) and contributor(s) and not of MDPI and/or the editor(s). MDPI and/or the editor(s) disclaim responsibility for any injury to people or property resulting from any ideas, methods, instructions or products referred to in the content. |
© 2024 by the authors. Licensee MDPI, Basel, Switzerland. This article is an open access article distributed under the terms and conditions of the Creative Commons Attribution (CC BY) license (https://creativecommons.org/licenses/by/4.0/).