Abstract
In the case of solid slabs made of reinforced concrete that are usually subjected to bending, large areas of the structure are stressed well below their load-bearing capacity. Contrary to this are shell structures, which can bridge large spans with little material if designed according to the force flow. To improve the efficiency of ceiling slabs, we want to utilize the shell load-bearing behavior on a smaller scale by resolving the solid interior accordingly. In order to study a wide range of such constructions virtually, a parametric multi-objective simulation environment is being developed in an ongoing research project. The basic analysis approaches that were implemented are presented in this paper. The basic workflow, the used programs and material models, and their calibration on the tests on textile-reinforced concrete (TRC) samples are described.
1. Introduction
In conventional construction with steel-reinforced concrete, solid, barely structured components with constant external and internal geometry are the rule. It is not uncommon to find structural element areas in which the concrete and reinforcement components are insufficiently utilized, as the building and construction methods are not adapted to the material characteristics and potential of the composite. The little or even unstressed regions in bending components are well known. This shortcoming, which also exists when building with carbon-reinforced concrete (CRC), was an impulse for the initiation of the joint research project CRC/TRR 280 “Design Strategies for Material-Minimized Carbon-Reinforced Concrete Structures—Principles of a New Approach to Construction” [1,2], funded by the Deutsche Forschungsgemeinschaft (German Research Foundation, DFG). The overall objective is to develop a universal design strategy for carbon-reinforced concrete structures that addresses the advantages of this composite while strictly considering the need for material suitability.
Carbon-reinforced concrete consists of a high-strength cementitious matrix, in which endless-fiber-based reinforcements are embedded. Textile fabrics made of crosswise connected yarns are most frequently used for applications in concrete. Therefore, the designation “textile-reinforced concrete” (TRC) is common. The material is characterized by a high normal strength. The textile grids do not corrode and are more flexible than steel reinforcements. So, it is possible to design and build lightweight, filigree, material-minimized structural members with flat, curved, or folded shapes. This potential was demonstrated in several research projects and also in practical applications. A few examples should be mentioned here. Impressive slender shells, beams, and columns made of TRC and assembled into a pavilion are presented in [3]. A demonstration pavilion was erected at RWTH Aachen University based on the analysis of the structural performance of TRC hypershells [4]. In [5], a ceiling system made of groin vaulted TRC shells, combined with a foamed concrete layer on the top and external horizontal ties on the bottom, is presented. With such a system, the ecological footprint can be decreased to a noteworthy extent [6]. In [7], a design method for TRC shell modules was proposed, which can be assembled into different structures in order to reduce formwork costs while still maintaining architectural freeform. At TU Dresden, in September 2022, the worldwide first concrete building completely reinforced with non-metallic continuous fiber-based reinforcement—the so-called “CUBE” [8,9]—was finished. All these examples impressively show the potential of the innovative TRC material.
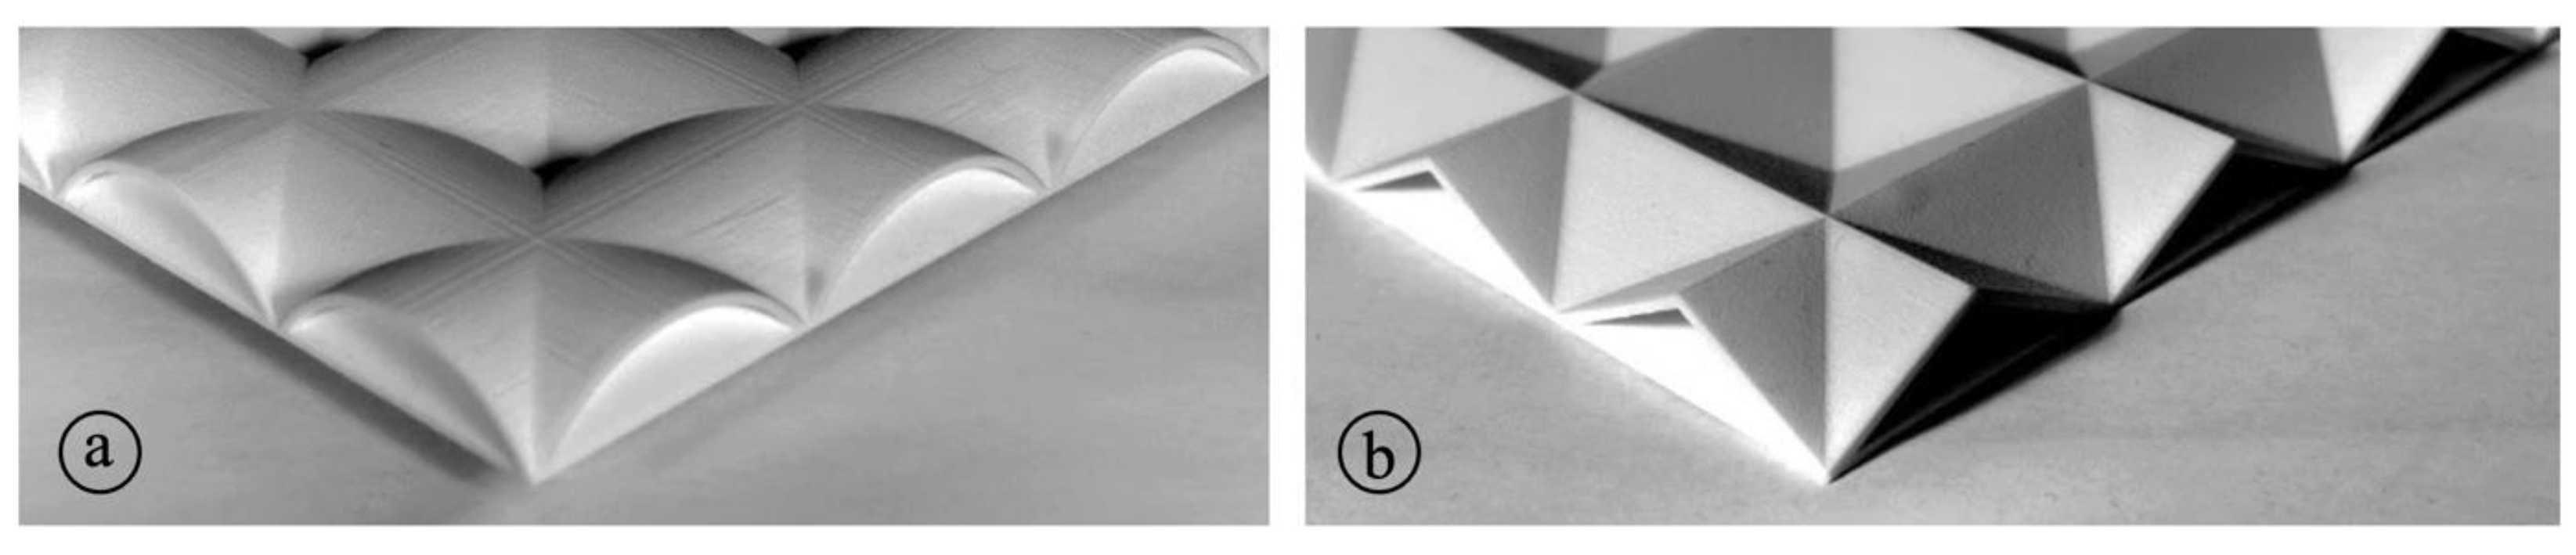
In project C01, within the frame of TRR 280, we are pursuing a new approach. We want to segment the usually solid interior of a concrete component by means of shell-like structures. Even if the load-bearing structure globally acts as a slab, these internal structures should be primarily exposed to normal stresses, which results in high material utilization. In Figure 1, two principal solutions of such an inner segmentation by membrane-like substructures with Gaussian curvature K = 0 are shown by means of 3D printed models on the left-hand side by crossing and intersecting arches and by straight folds on the right-hand side.

Figure 1.
Idea of inner resolution using intersecting (a) barrel shells and folds (b); photos: Sylke Scholz.
A parametric multi-objective evolutionary tool (MOET) was developed for a comprehensive analysis of that kind of structure. With its help, an enormous variety of possible designs can be created and analyzed in a reasonably short time. In this article, we present the principles that are used in the estimation of the failure limits, the utilization ratio (UR), and the failure types of the thin-walled TRC structures. Furthermore, we show the results of an initial parameter. At the end of the paper, we give a short outlook on the next research steps.
2. Numerical Analysis of TRC Structures
2.1. FEM Model Formulation
To analyze the TRC structures within the framework of the developed multi-objective evolutionary tool MOET, a combination of Grasshopper 3D (Ver. 7.0) [10] and Rhino 3D (Ver. 7.0) (RH + GH) [11] was used as a parametric environment for geometrical data generation. Furthermore, the data were transferred to a FEM calculator. For this purpose, the commercial software RFEM (Version 5.19) [12] from Dlubal Software, Inc. (Tiefenbach, Germany) was attached to the RH + GH environment using a specially prepared C#-based script with the help of a COM interface [13]. The actual workflow was designed as an iterative procedure with incremental load increase. Thus, the new geometrical solution generated in each step is transferred from RH + GH to RFEM for analysis. Afterward, the calculation results are exported to stand-alone python-based scripts that perform the post-processing to estimate the failure criteria and other representative key values that will be presented in the following sections. Finally, in the last step of the iteration, the post-processed data are transferred back to RH + GH for further analysis. Afterward, if necessary, the geometry is modified, or the applied load is increased for the next iteration.
The following RFEM software settings were commonly used for all calculations. The Poisson’s ratio was set to 0.2, which is usual for concrete. The TRC shells were modeled within RFEM using 2D quadrangle elements with 4 nodes at the corners. Degrees of freedom in the nodes are displacements and rotations . The maximum FEM mesh size was selected to 25 mm. Plain-stress conditions were assumed because it was assumed that the TRC structures, which shall be calculated, are thin-walled with a considerably smaller thickness than the dimensions in the other directions. Within RFEM, the shell elements were modeled with a constant thickness over the whole element. Thus, the stiffness of the elements was represented as the stiffness of a rectangular cross-section.
2.2. Material Models
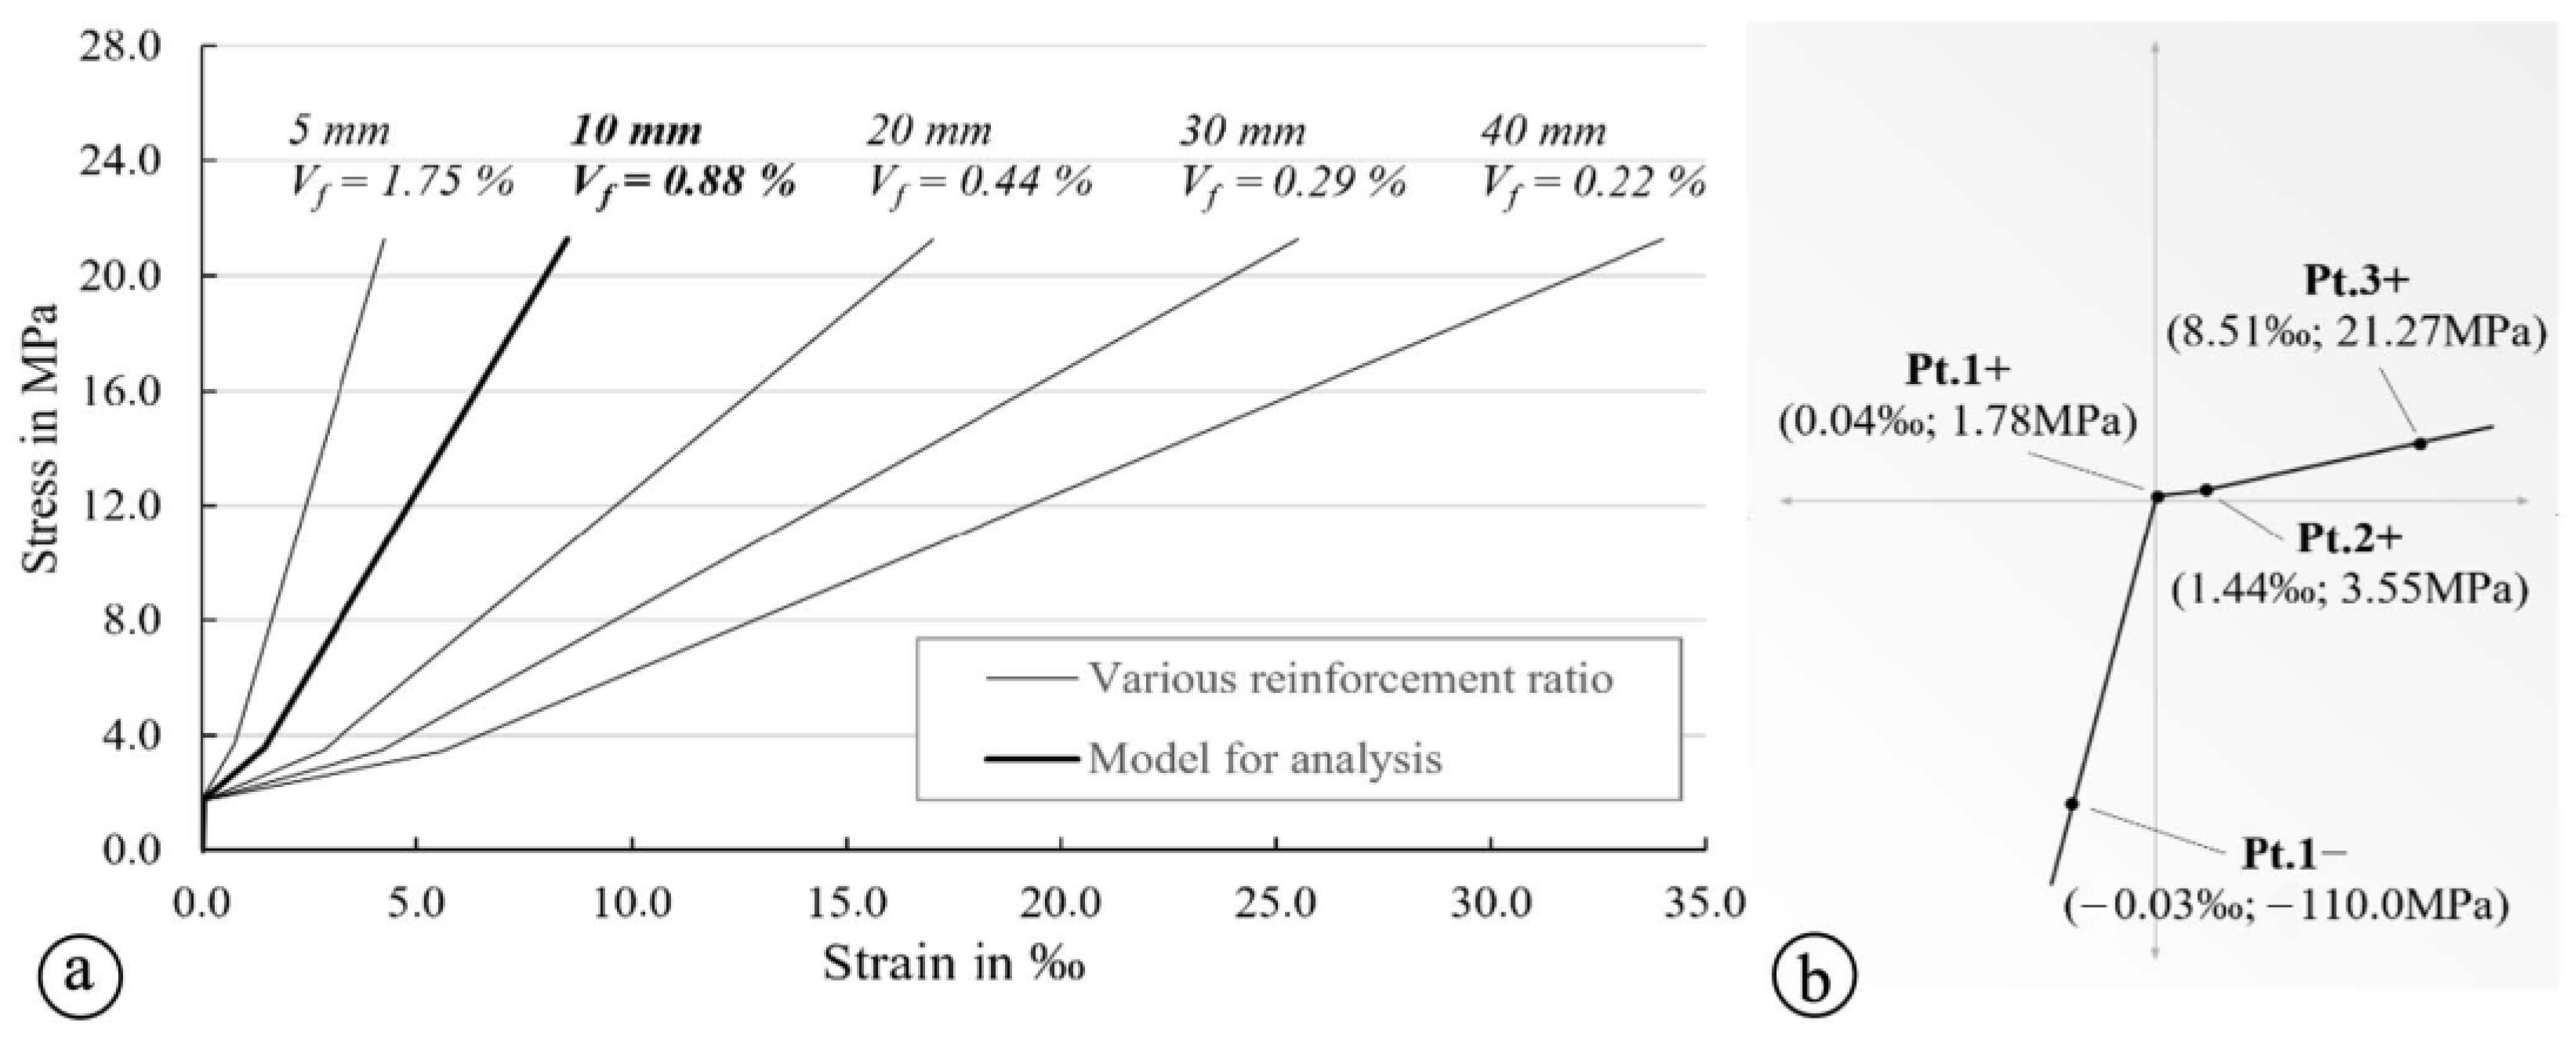
The shell elements were modeled using a single composite material model with a uniform distribution of the properties over the cross section. The FEM model formulation for the textile reinforcement is based on a smeared material model approach. Its application for the purpose of analysis of TRC structures was discussed, e.g., in [14]. When using a smeared material model approach, the next features are to be considered before performing the analysis. First of all, with a smeared model, it is not possible to capture the effect of textile reinforcement placement. The reinforcement is placed quasi-automatically in the center of the cross section. So, the smeared approach necessarily leads to an overestimation of the lever arm [14]. The approach is recommended to be applied to components with predominant membrane forces, which is the case in our project. Secondly, the smeared model ensures a relatively simple analysis routine, but it requires an elaborate preparation of the correct simulation of the uniaxial material behavior of TRC. The uniaxial material model needs to correctly reflect the reinforcement ratio. The TRC material was modeled for a reinforcement ratio range between 0.22% and 1.75% for the purpose of the parametric study in the frame of the project. The results of the simulation are provided in Figure 2a. Figure 2b shows the interface of the used RFEM software package with the integrated key values to represent the stress–strain curve in the uniaxial tensile range in the well-known form of a polyline for a shell thickness of 10 mm, see, e.g., [15,16,17].
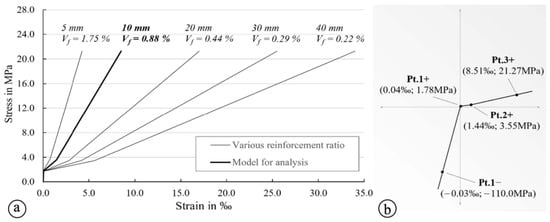
Figure 2.
Range of material data used for the FEM analysis; (a) simulated nonlinear behavior of TRC for different reinforcement ratios; (b) RFEM interface presentation of the material data for TRC (tension) and high-strength concrete (compression), Graphic: Iurii Vakaliuk.
The data presented in Figure 2a were simulated by using a trilinear model, which was calibrated on laboratory tests in a previous stage of the research project. Such a trilinear model was first introduced by Nathan et al. [18] in 1977. It is characterized by three linear ranges represented by ascending lines. They were calculated according to the rule of mixtures.
Table 1 contains the properties of the specification of the textile reinforcement, which was used in the laboratory experiments and, therefore in the simulations derived from the technical data sheet [19]. The product “solidian GRID Q85-CCE-21” of the company solidian GmbH (Albstadt, Germany) is a symmetrical, bidirectional reinforcement mat made of yarns with equal spacing and carbon fiber amount in both bearing directions. Epoxy resin serves as impregnation to increase the bond within the yarn and to the surrounding concrete, as well as the mat’s resistance against mechanical damage during transport and application. The textile properties were also verified in the laboratory test; the results and the testing methodology are provided in [20].

Table 1.
Properties of the carbon fiber mat solidian GRID Q85-CCE-21 [19].
In the compression range, the fine-grained high-performance concrete used within the project (see [20] and Table 2) was modeled in a simplified manner by a linear stress–strain relationship with a gradient that equals the elastic modulus of the concrete. Considering the nearly linear stress–strain relation for the high-strength concrete determined in the experiments, the linear approach can be assumed as a good approximation. A possible decrease in the compressive strength due to the textile grid inside is currently not considered. The first experimental results indicate a potential influence [22,23], but to date, there is no definite statement or recommendation.
Table 2.
Concrete properties according to [20].
Another key aspect in the preparation of the FEM analysis was the extension of the implemented FEM material models beyond the limit to achieve a stable iterative analysis (some more explanations are given in Section 2.5). Also, it was required to ensure the evaluation of the failure criteria for cases when the geometry of a TRC element promotes a stress state that is far beyond the load-bearing behavior. A similar approach was validated in [24].
2.3. Orientation of Internal Forces
The described above numerical approach using a smeared material model assumes an isotropic behavior of the TRC material, although the textile reinforcement, as it may be seen from Table 1, possesses rather orthotropic behavior in the warp (0°) and the weft (90°) direction. The question was whether the assumption of uniaxial material characteristics is correct when the orientation of the tensile load does not match the yarn orientation, defined by 0° < α < 90° in Figure 3. Previous research on biaxially loaded TRC samples with alkali-resistant glass mats in [25,26,27] showed some decrease in the failure loads in cases of biaxial loading depending on the angle α. Thus, one of the key aspects in the numerical analysis was the consideration of the textile reinforcement orientation within the thin TRC shell elements, which should be analyzed within the scope of the project.
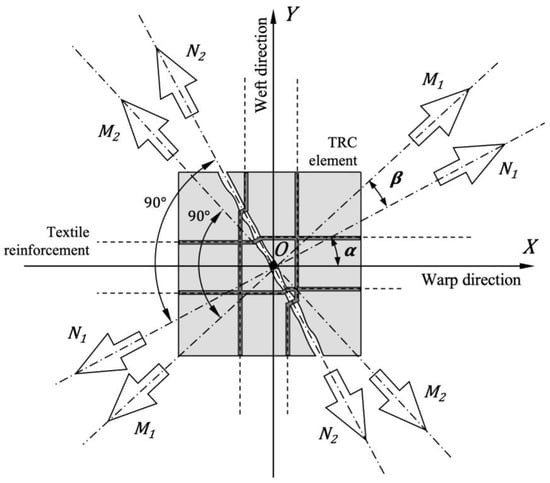
Figure 3.
Orientation of principal membrane forces and moments. Graphic: Iurii Vakaliuk.
For the experimental research and the numerical parametric study, the goal was to orient the warp yarns of the reinforcement in the principal direction of the main tensile forces in the area with the maximum load-induced tensile stresses. There, the simulation can be performed with the uniaxial material characteristics; a special consideration of the textile orientation is not necessary. But in areas with principal stresses that deviate from the warp direction of the reinforcement, it may be crucial to consider the orientation for a proper estimation of the failure load.
Figure 3 shows the general case of the force distribution at a FEM node. The warp direction of the textile matches the local X coordinate of the FEM model and the weft direction, consequently the local Y direction. The general case of the load state indicates a mismatch between the local FEM X-axis and the principal axes N1 and N2 of the membrane axial forces. Also, it is important to indicate that, in general, principal axial forces do not match with the principal axes of the resulting moment forces M1 and M2. However, within the scope of the current research, such deviation is neglected, meaning the angle β = 0. Nevertheless, the deviation angle needs to be considered. According to [28], the strength values can be calculated according to Equation (1):
where the values are the tensile strength characteristics of the textile depending on the deviation angle . The strength in the warp and weft directions are and , respectively. As indicated in [28], the stress concentration in the textile filament at a crack edge can be considered by a reduction factor , which can be calculated according to Equation (2):
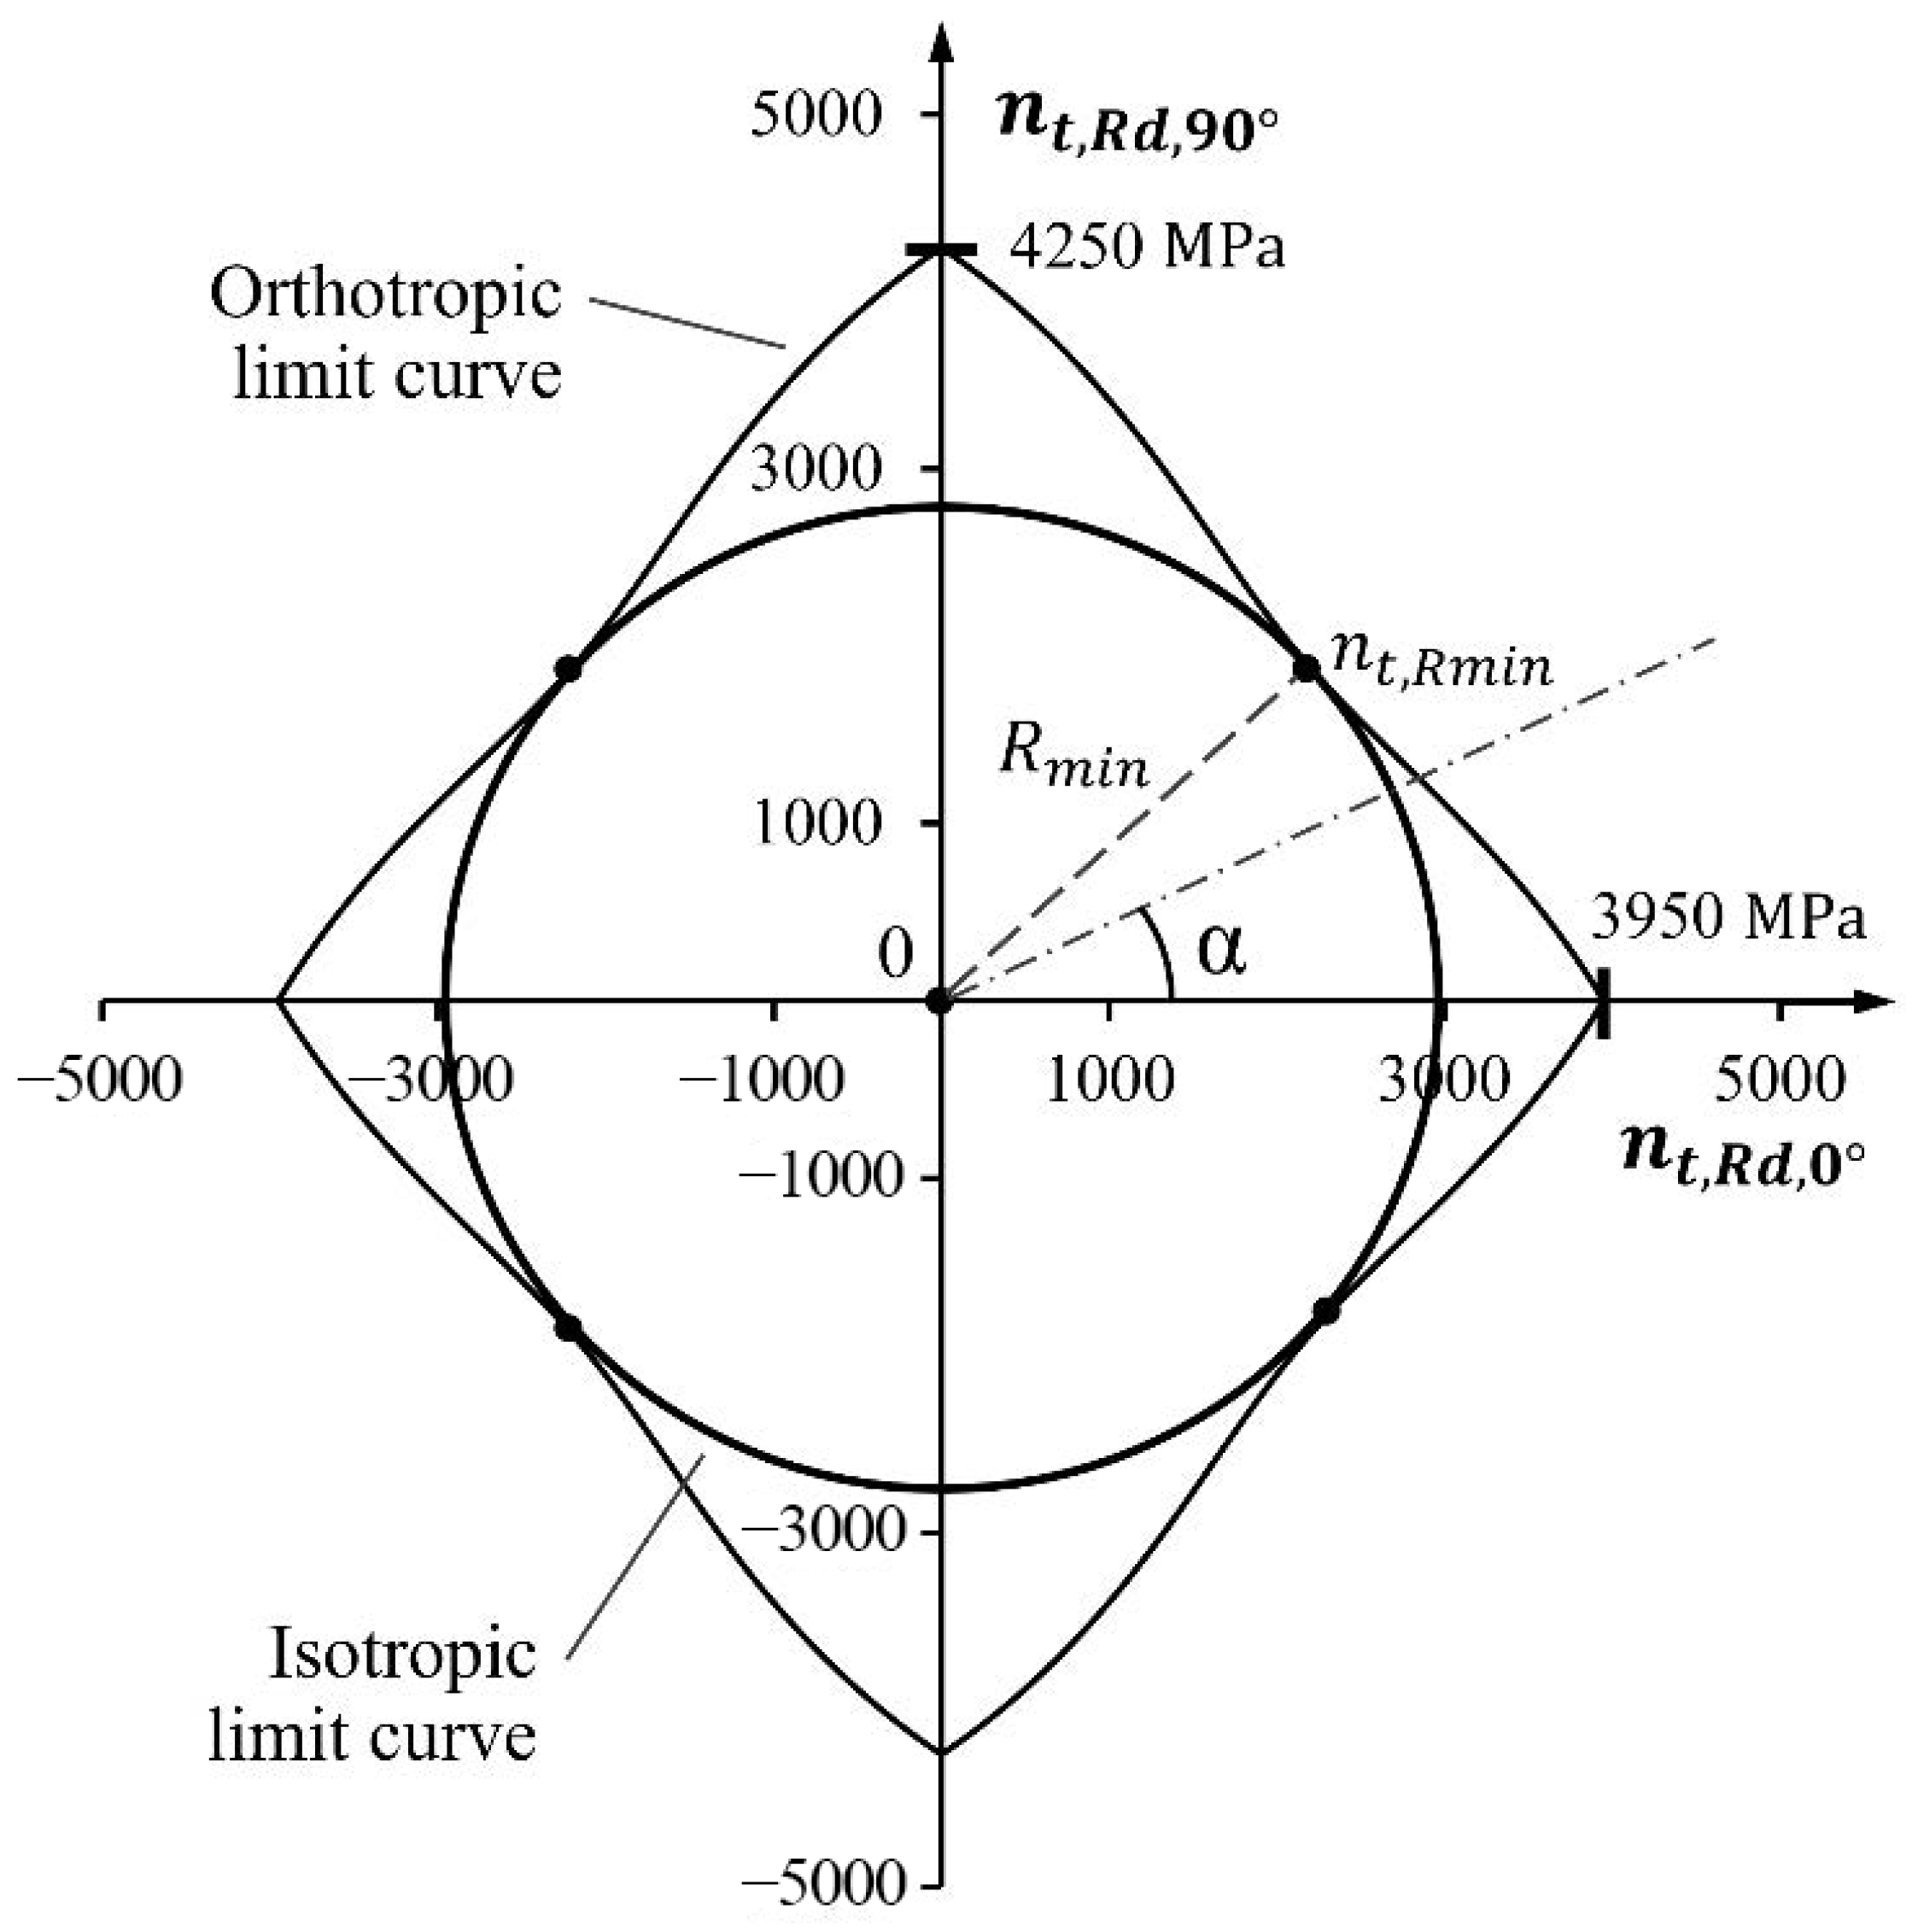
Summarizing Equations (1) and (2), Figure 4 gives an overview of the reinforcement’s tensile strength at changing deviation angles . The values of and were set according to Table 1 to 3950 MPa for the warp direction () and 4250 MPa in the weft or 90° direction.

Figure 4.
Strength values of the textile reinforcement, depending on the deviation angle α. Graphic: Iurii Vakaliuk.
For the purpose of proving the concept and simplification of the calculation routines at the current stage of the project, the orthotropic behavior of the textile was converted to be considered isotropic, according to Figure 4. From the figure, it follows that the isotropic strength limit forms a circle with a radius of 2893 MPa and intersects the calculated orthotropic limit curves in the points . Thus, Equation (1) can be simplified into Equation (3) by introduction of a textile orientation safety factor considering different deviation angles:
2.4. m-n Diagram for TRC Structures
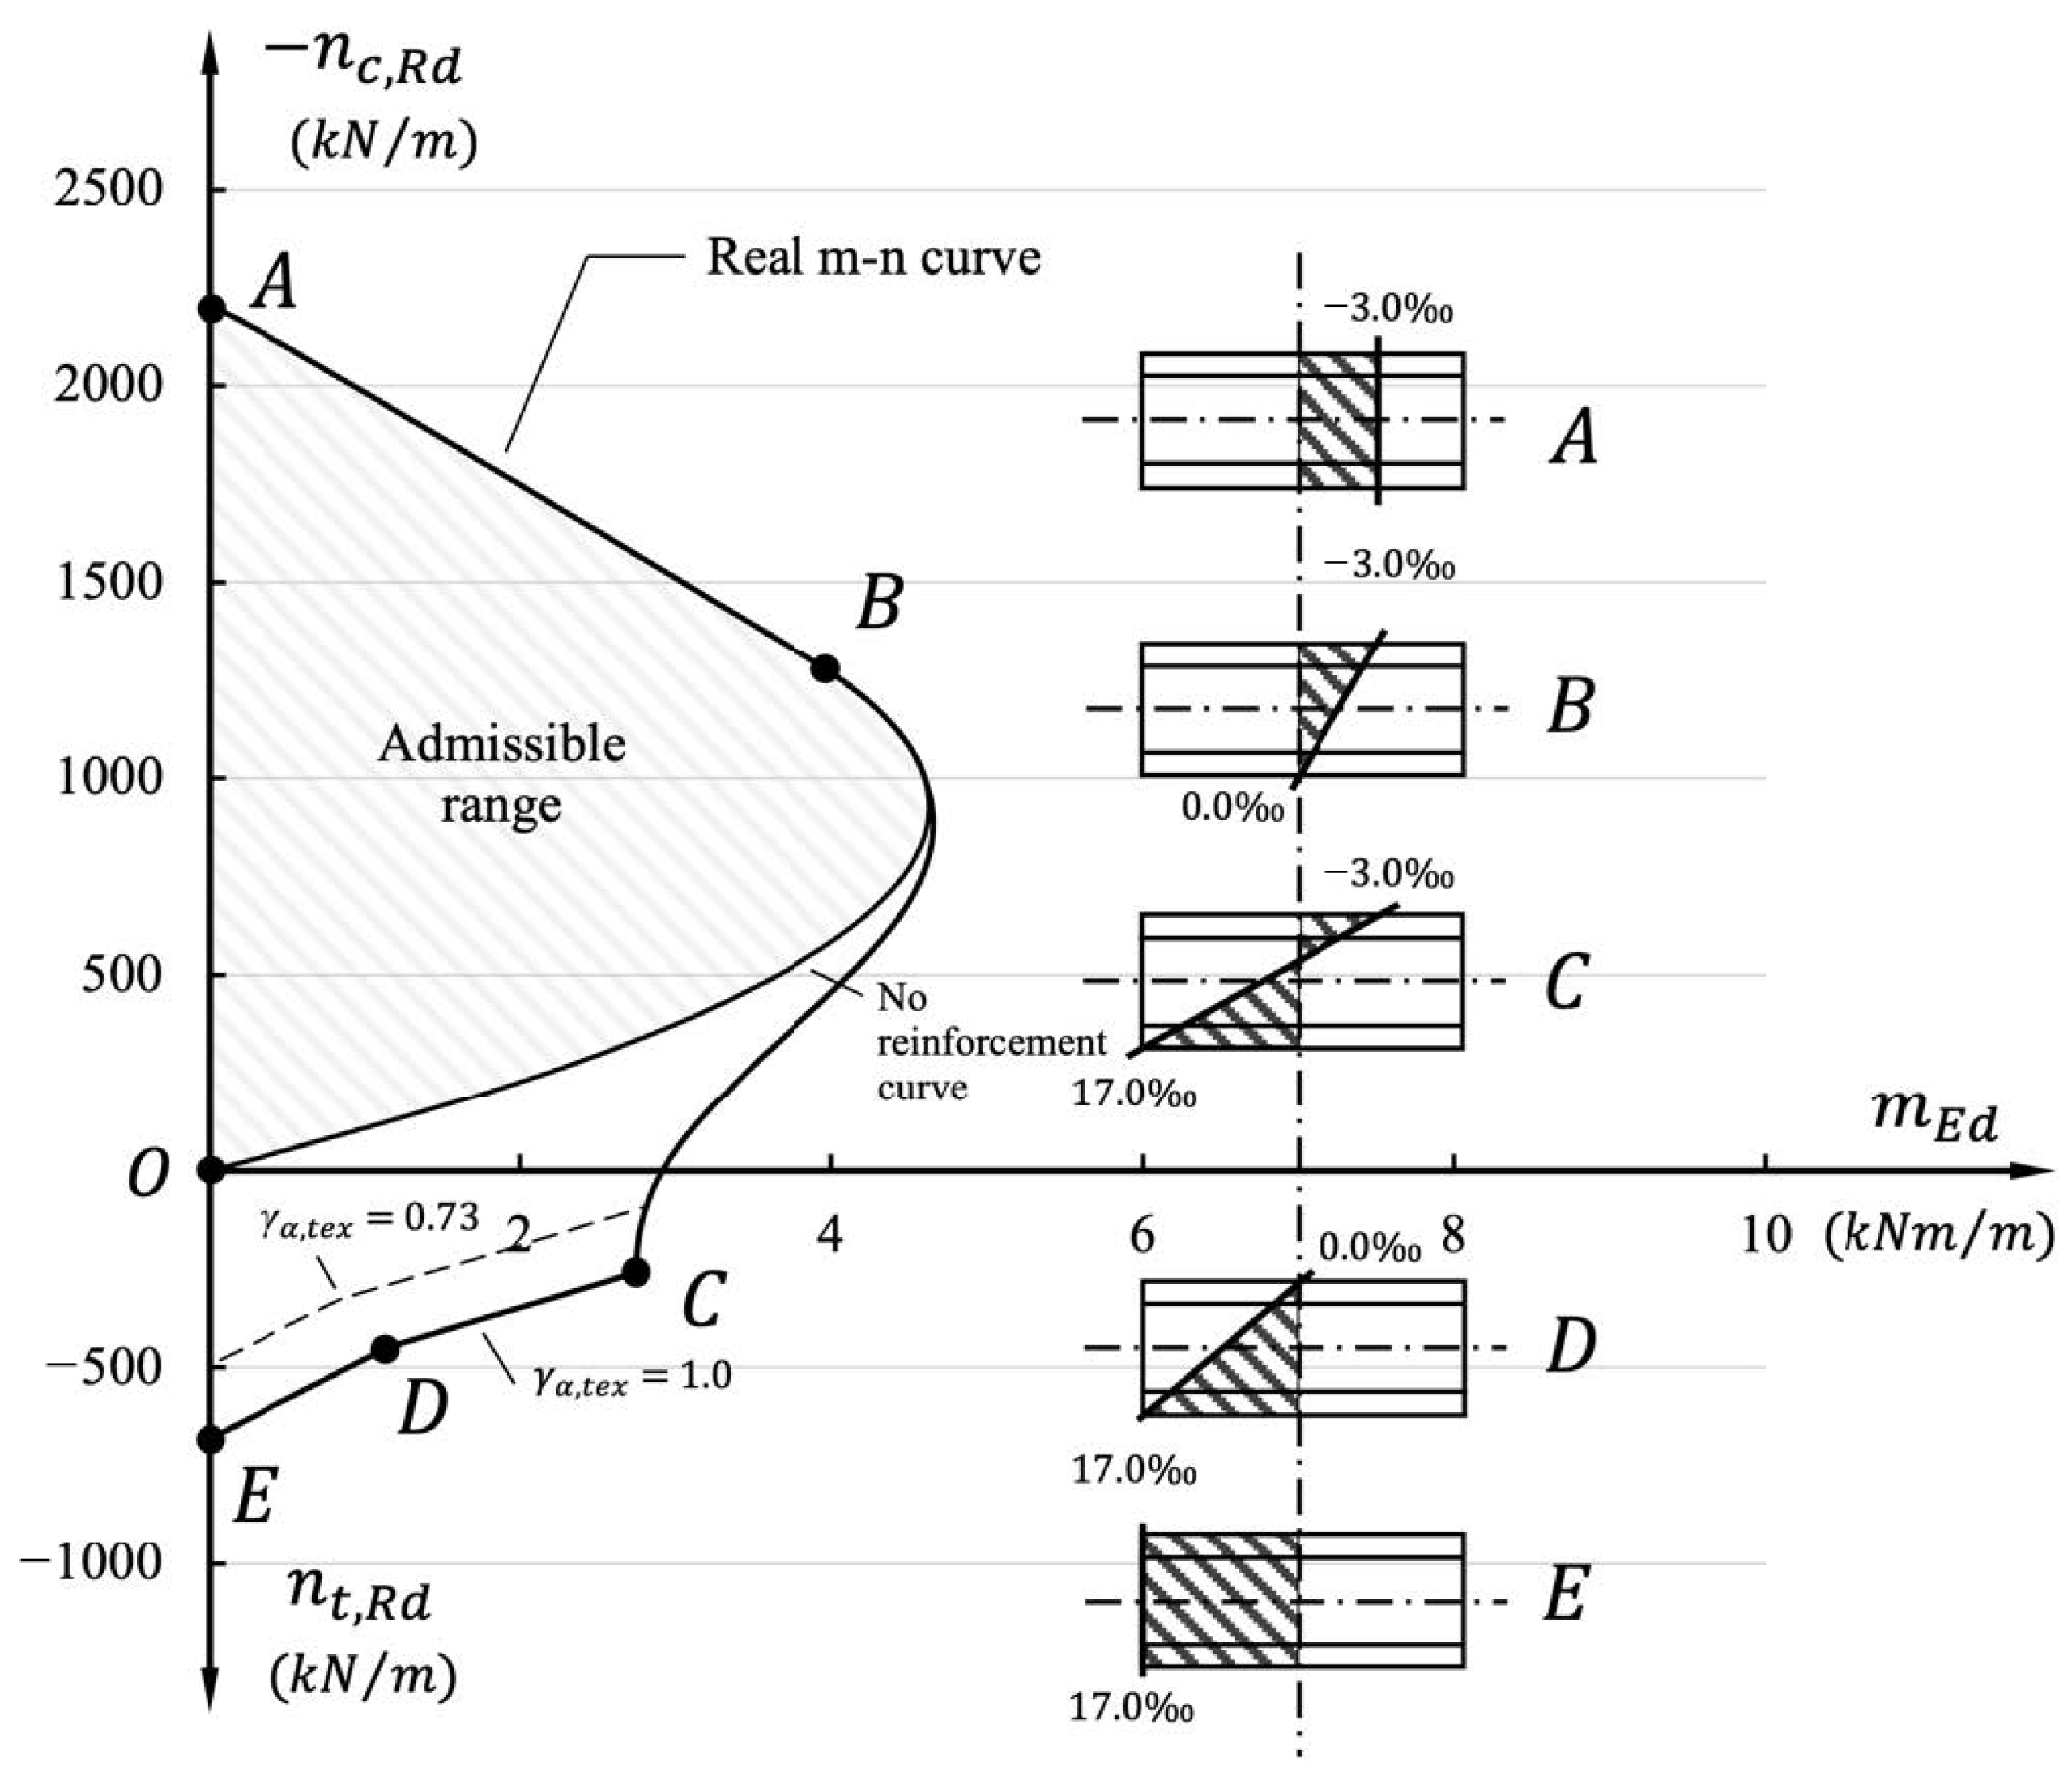
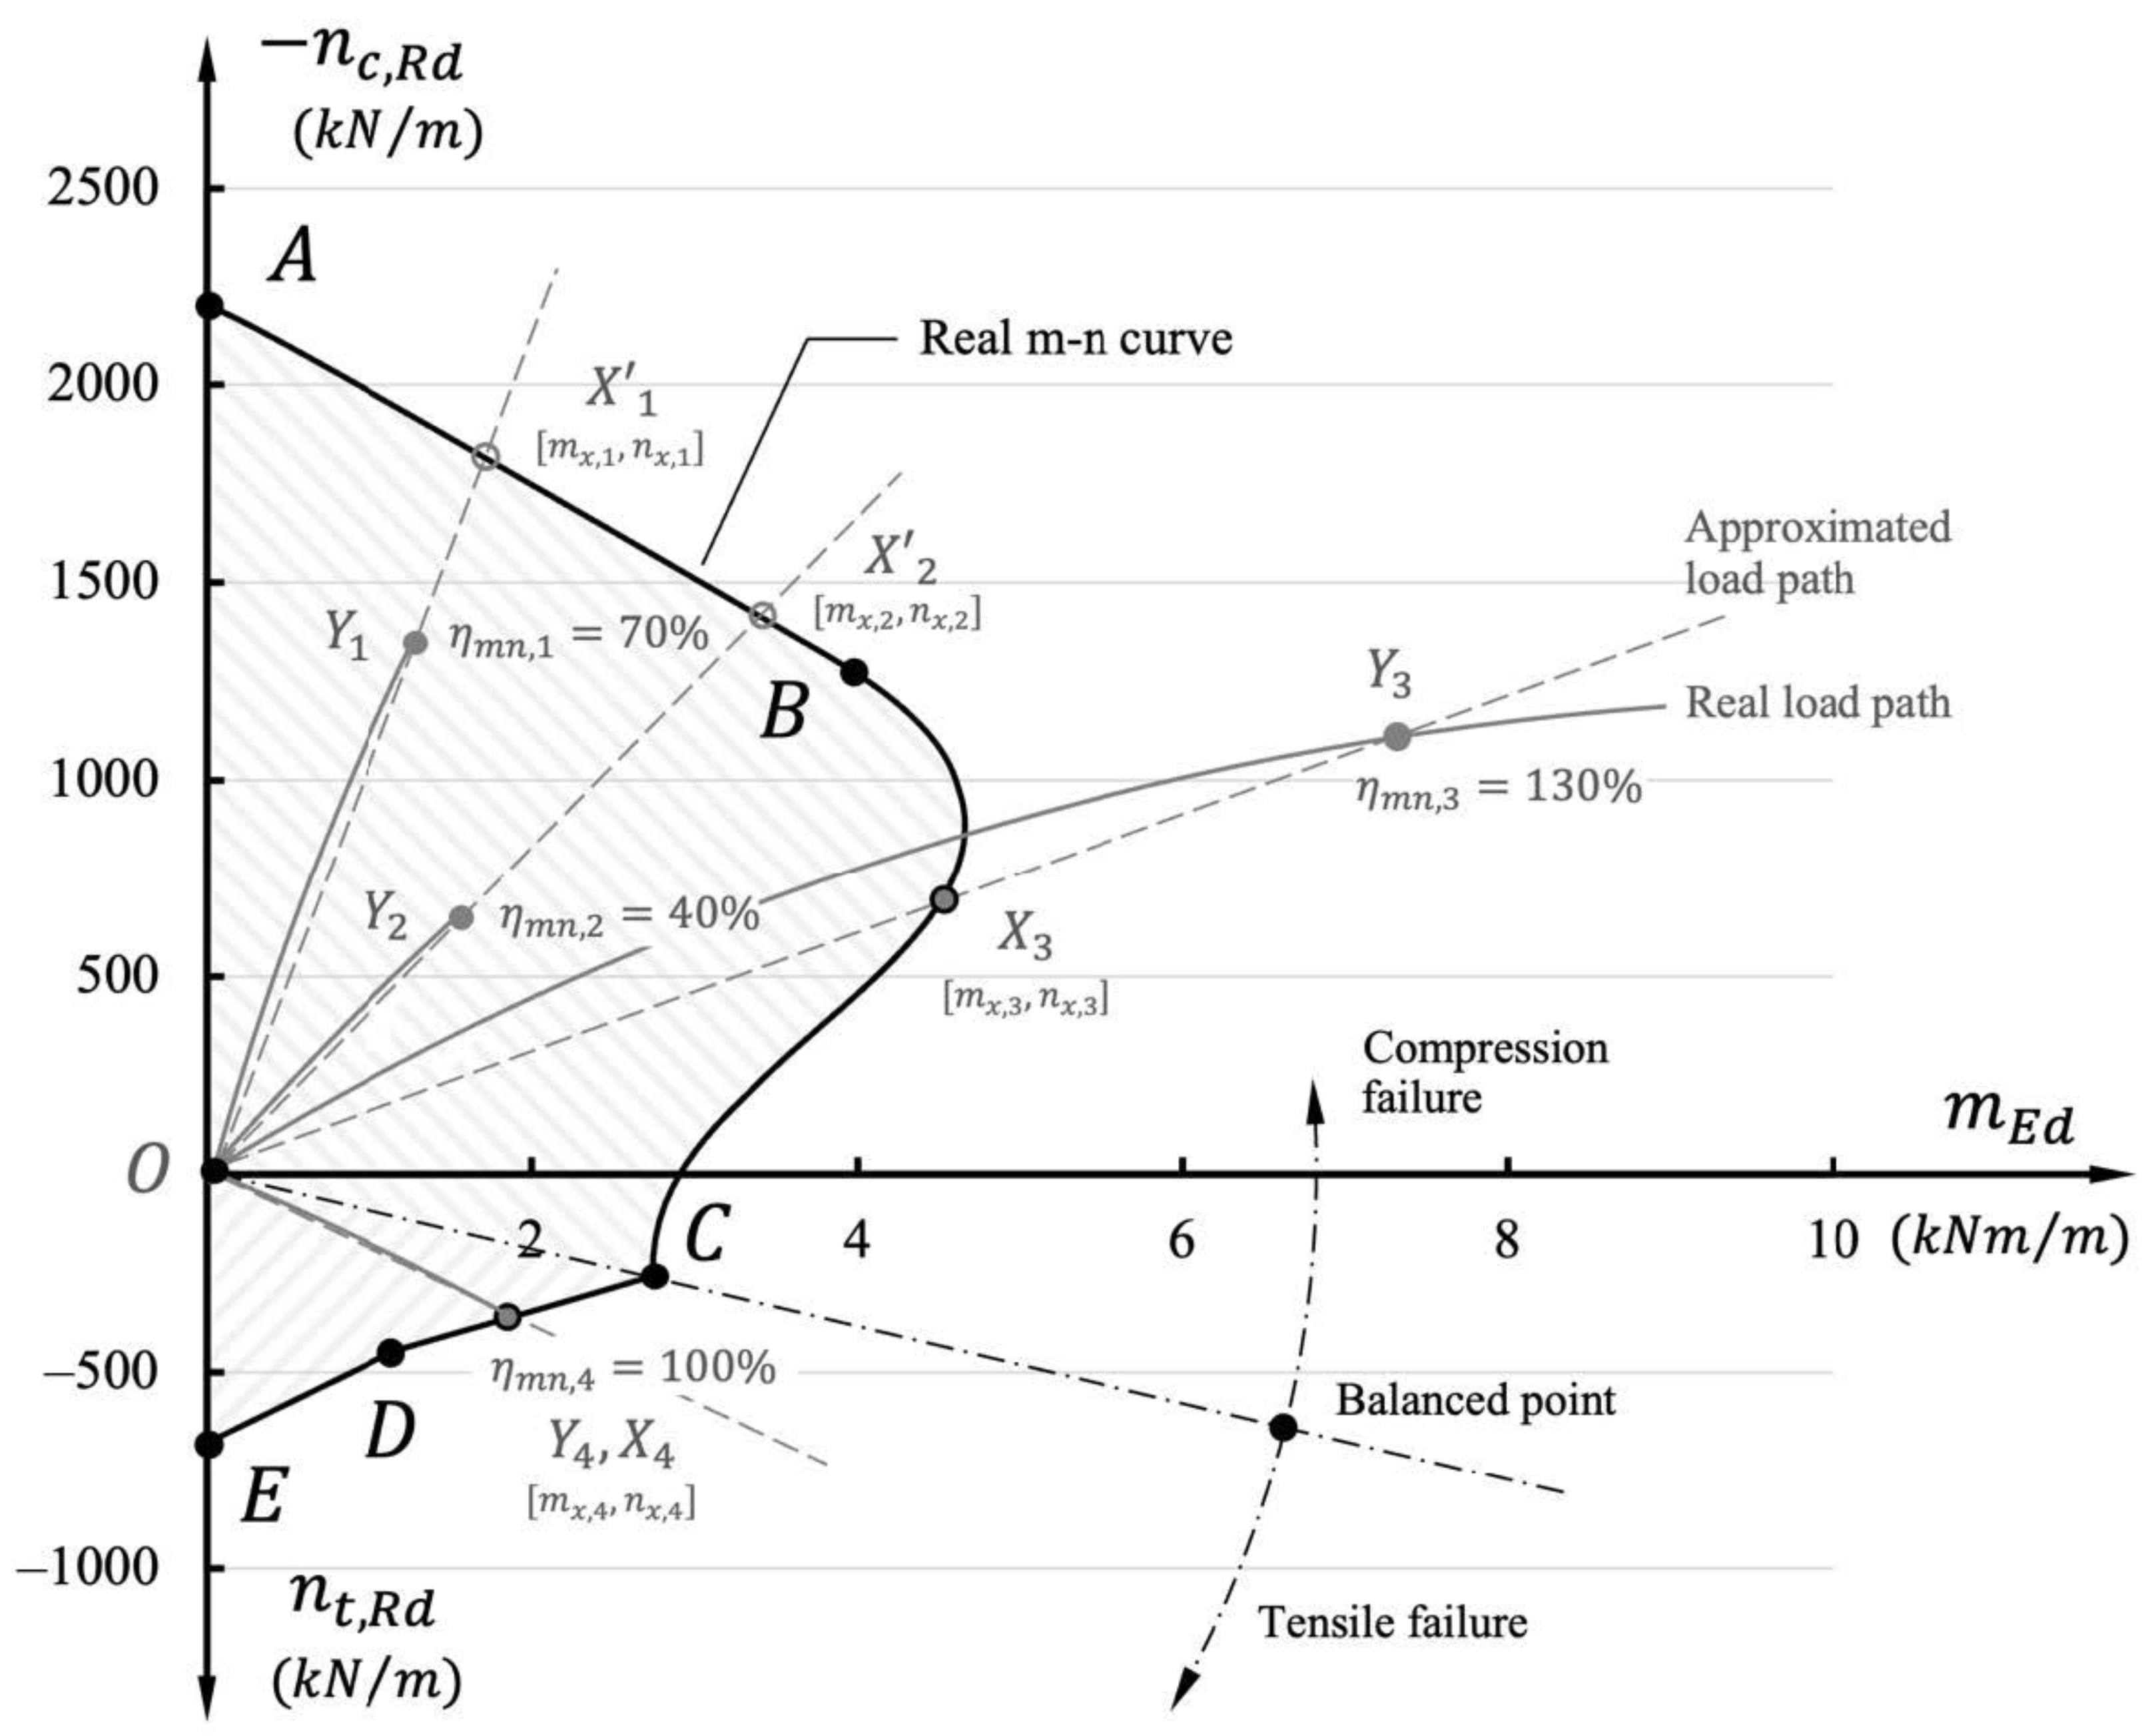
In the first step, the failure criteria were considered in the form of a simplified m-n diagram according to [24]. Such an approach is relatively conservative and may result in an underestimation of the ultimate cross-sectional strength but remains on the so-called “safe side” [28]. For the purpose of research and to consider the full potential of the investigated TRC structures, the m-n diagram should be expanded to match the experimental results. Thus, a more realistic representation of the m-n relation was required. In [29], a good insight is provided into the formulation of a more realistic m-n diagram for thin-walled concrete shells that are reinforced with textile reinforcement and how to set up a suitable analytical model. The way in which the m-n diagram is structured is similar to the well-known method used for the estimation of the critical load-bearing capacity of steel-reinforced concrete structures, see, e.g., [30,31]. In Figure 5, the key aspects and the assembly points used for the m-n diagram for TRC structures are represented.

Figure 5.
Principle of a m-n diagram for TRC structures. Graphic: Iurii Vakaliuk.
The key points from A to E determine the curvatures of the m-n diagram. For each point, an equilibrium was solved to match the strain state and the respective set of internal forces. According to [29], the curvature correlates with the realistic representation of the failure criteria for TRC shells. In state A, the whole cross section is under compression. At B, the strain at one edge of the cross section is decreased to zero. With increasing bending (and decreasing compression force), the cross section shows parts under tension and compression. Point C is a balance point that indicates the simultaneous failure of concrete in the compression and of the textile reinforcement in the tension zone. For the quantitative description of the m-n diagram, we defined a strain limit of –3.0‰ for the concrete matrix determined in experiments and of +16.3‰ for the carbon fiber textile according to the data derived in the set of uniaxial tensile experiments provided in [32], and that is in a good agreement with datasheet [19]. An increase in tension while a decrease in bending leads to strain relations according to D and E, where E stands for a cross-section under uniform tensile stress.
From the figure, it can be seen that there are few “admissible” ranges. The first inner area (crosshatched) determines the range for unreinforced concrete elements. The outer range in the example (white area) in Figure 3 sets the limit for the case of a 20 mm thick TRC shell, which is reinforced by two symmetrical layers of solidian GRID Q85-CCE-21 with a concrete cover of 5 mm. The range, which is marked with a dashed line, indicates how the outer range is to be modified due to the consideration of the textile orientation safety factor of = 0.73 described in the previous Section 2.3.
One overarching key task of the project is to perform a wide parametric study to find efficient possible solutions for shell-like TRC structures for varying boundary conditions. The described above approach for constructing the admissible bearing range for TRC structures ensures fast and convenient processing of the data derived from the FEM solver. The numerical tool MOET introduced in its basic outlines in Section 2.1 and inserted respective modules are able to recreate such m-n diagrams for different thicknesses and reinforcement layers by generating an appropriate number of points that detect the limits of the admissible range. Such a generation is performed after each iteration step of the FEM solver for different parts of the structure where a deviation in parameters such as the total thickness of the shell, the amount of reinforcement , the thickness of the concrete cover , or the number of the textile reinforcement layers occurs. To better illustrate the dependency of the m-n diagram on different parameters, Figure 6 gives an insight into how realistic the m-n envelope deviates due to changing the reinforcement ratio from 0.5 to 2.0% (Figure 6a) and due to altering the concrete cover from 2 to 10 mm (Figure 6b).
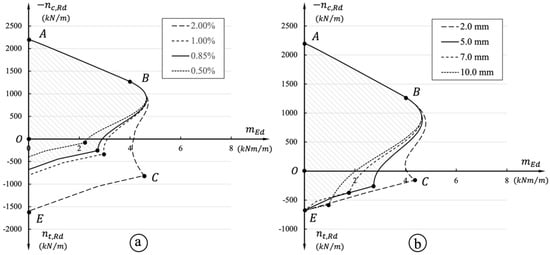
Figure 6.
Comparison of different m-n diagram solutions as a prerequisite of the parametric study. (a) due to changing the reinforcement ratio and (b) due to altering the concrete cover. Graphic: Iurii Vakaliuk.
It can be seen from the figure that a variation in the concrete cover, which has a direct influence on the internal lever arm, has a much stronger influence on the bearing capacity against significant bending action compared to a modification of the reinforcement’s cross-sectional area. This behavior can be explained by the fact that, from a geometric point of view, the bending stiffness shows an exponential growth with increasing lever arm in contrast to a linear growth due to an increase in the reinforcement area.
2.5. Failure Types and Assessment of the Utilization Ratio
With a stress- or strain-based view, in very general terms, it can be said that TRC structures either fail by exceeding the compressive or the tensile strength of the composite material. Based on the m-n diagram procedure presented above, we proposed to solve the declared problem with the following steps.
Figure 7 shows the key principle. Thus, we differentiate three possible cases of so-called load state points: an admissible range for points like Y1 and Y2 that do not reach the failure state, points Y4 that is lying directly on the m-n curve and therefore just reached the limit, and finally points like Y3 outside the admissible range which are considered as failed points but located away from the m-n curve due to the ability of the FEM solver to reach a stress state that is beyond the critical values as indicated in Section 2.2. Each of the points Yi can be connected with the point of origin of the m-n diagram by a line . The line itself represents a so-called load path that indicates the way each load state point performs until reaching the failure load. The assumption of a linear load path corresponds to the case when a concrete member is considered to be short without imperfections [33,34]. The intersection of the load path and the m-n curve could be real in the case where the load state point reached the failure state or prognosed . Then, the position of the intersection points can be compared with the point that corresponds to the balanced failure state. Finally, if the intersection point belongs to the range above the point , we can indicate a compression failure. A tensile failure occurs if the intersection point lies in the range below point . In that way, all the load state points can be subdivided into four groups: points that reached the failure either in the compression or the tensile range and points that are exposed to subcritical compressive or tensile stress.
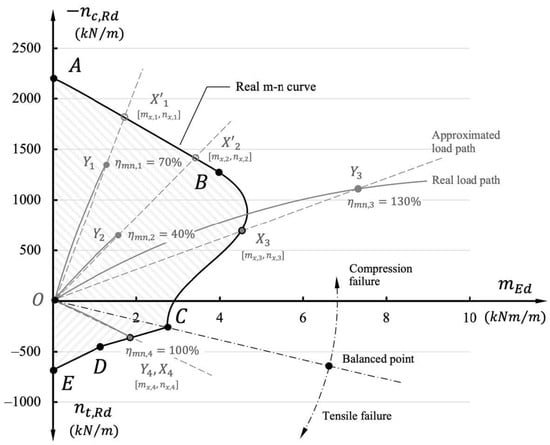
Figure 7.
Load path of the FEM nodes and estimation of the utilization ratio. Graphic: Iurii Vakaliuk.
The other important aspect resulting from the analysis routine described above is the evaluation of the degree of utilization (UR) of the structural members. The utilization ratio UR can be calculated for each FEM node point after each iteration of the workflow. It is assessed as the ratio between the length of a vector that determines the current load state for the FEM node point and the length of a vector or that determines the real or prognosed load state for the same node point when it may reach the failure condition by crossing the m-n curve. In general, the UR can be calculated based on Equation (4):
where , and , are the states of the normal force and the bending moment for the actual and the prognosed load states, respectively. Finally, the UR for the whole TRC structure is assumed to be the maximum value of the whole set of FEM node points, Equation (5):
The last failure type to be mentioned is the failure due to the buckling of thin-walled TRC members under compression. Within the scope of the current research project, in which we take dimensions within the range of standard ceilings into account, the buckling failure was not yet considered in the calculations and, consequently, in the results presented later in the paper. A possible stability failure may become more important for very slender TRC membranes under compression and large buckling field dimensions. So far, however, only a few experimental studies are available, e.g., [32]. In a later phase of the project, the stability case will be implemented in the parametric multi-objective simulation environment.
2.6. Extreme Values of the Internal Forces Field
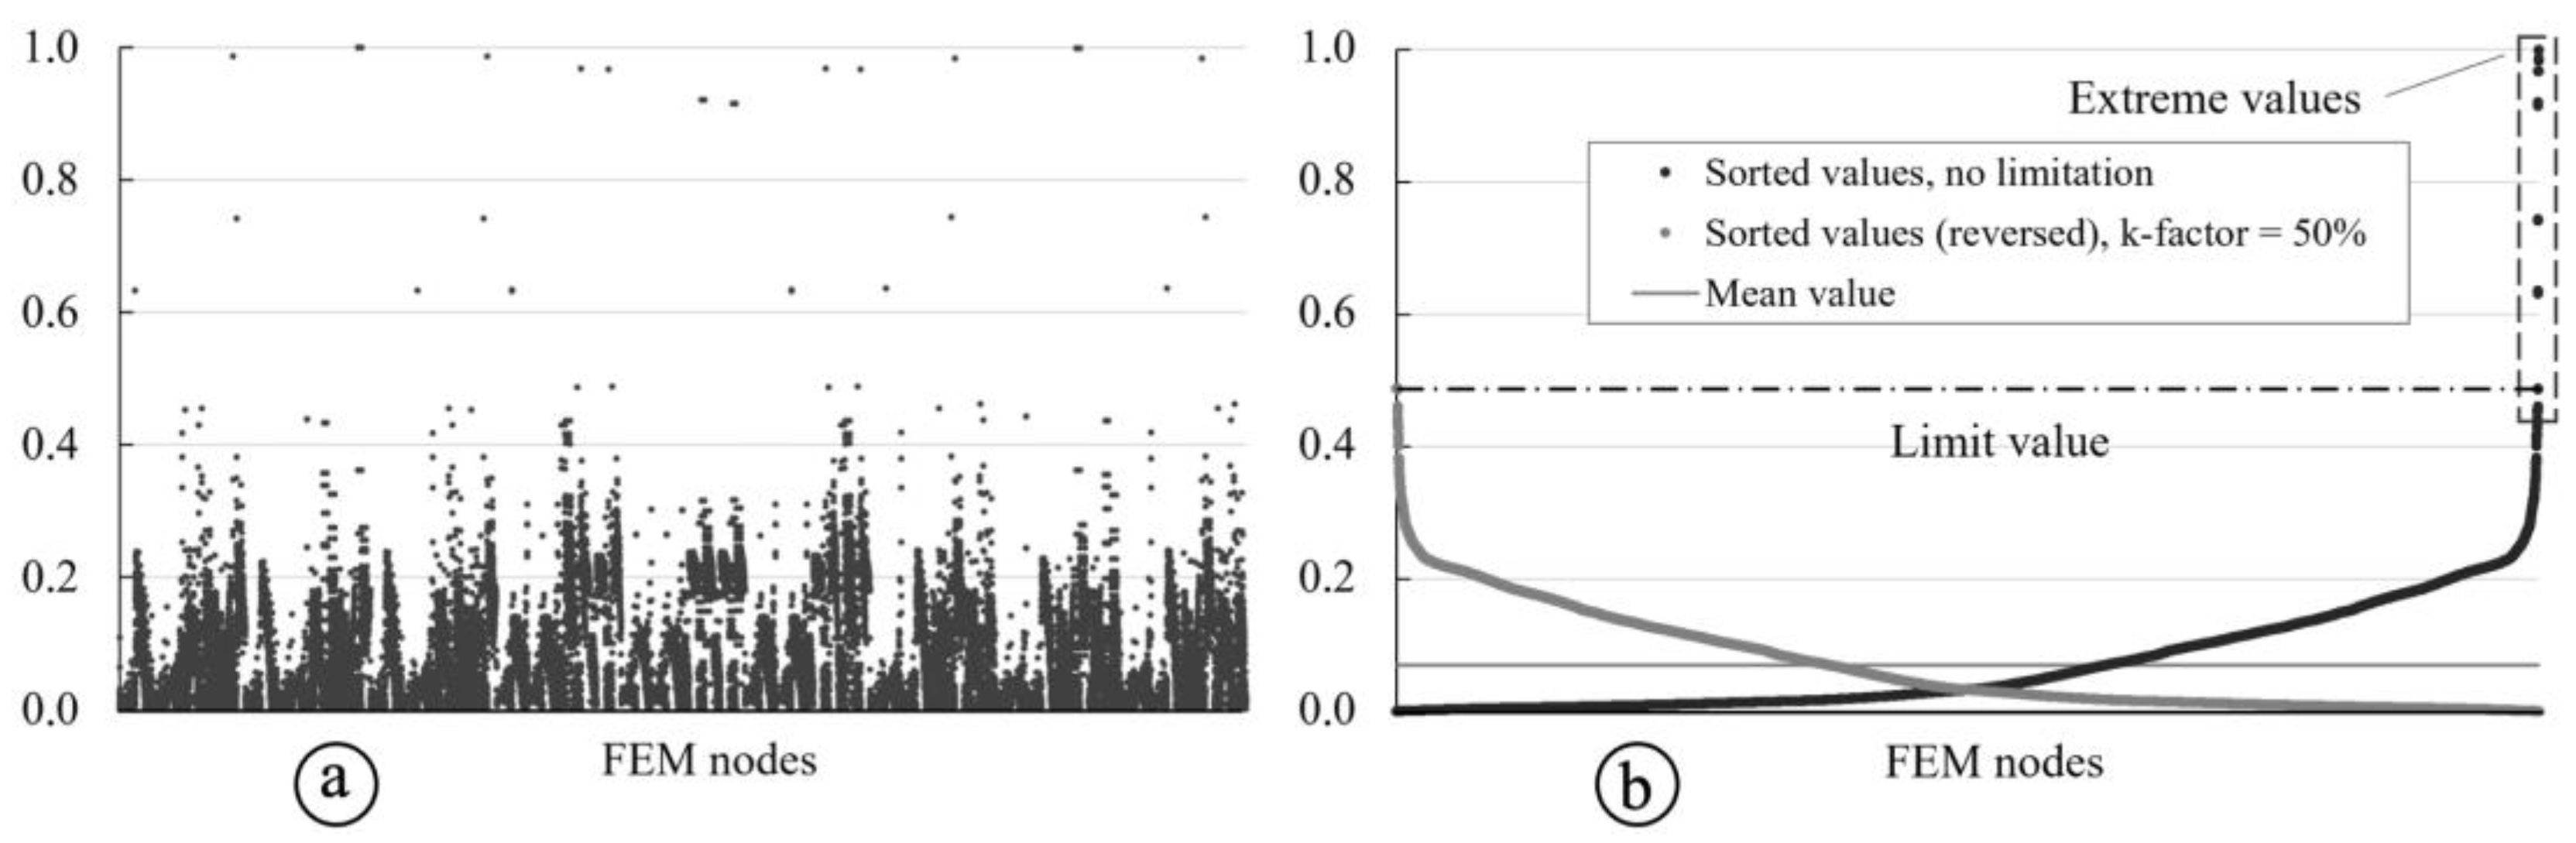
A last important aspect is the handling of extreme values within the quantity of resulting internal forces in the FEM results. There are many reasons for such values or singularities, like point supports, point loads, etc. In real concrete structures, such problems are generally less relevant, as on the one hand also, a point load acts on a certain area (not on an ideal point), and on the other hand, a concentrated load leads to a load redistribution after a certain local material degradation. However, in the numerical simulation of concrete structures, an inadmissible automatic estimation of the critical load-bearing capacity may occur. As a result, the entire procedure of the synthetic data generation process can become invalid. One possible way to solve that problem is the proper creation of a static FEM model, avoiding a geometry that favors the occurrence of such stress concentrations. From the point of view of the parametric study, the task is even more complicated because it should be provided for all possible solutions. In order to obtain more reliable results, we suggest additionally using a statistical method for processing the FEM data. Figure 8 gives an insight into how this method works.

Figure 8.
Post-processing of the FEM extreme values; (a) range of the normalized internal forces in an unsorted manner; (b) sorted and normalized internal force values with no limitation and with limitation by a k-factor of 50%. Graphic: Iurii Vakaliuk.
In Figure 8a, a general typical distribution of the FEM values for the internal forces in all nodes can be seen. The figure shows the normalized minimum and maxim values and the repetitive nature of the internal forces in FEM nodes within a TRC shell structure according to the basic idea shown in Figure 1 in a possible loaded state. Of course, each applied load results in a unique pattern of the internal force field. The figure shows a principal scheme of a possible distribution of internal force values. Now, the values of the internal forces were sorted according to their magnitude, which results in the diagram shown in Figure 8b (black dots). As can be seen, the extreme values are gathered on the right side of the diagram. Therefore, it is proposed to determine the mean value of all force’s values and then to indicate the values that are to be considered extreme values. The estimation is performed according to Equation (6):
where is the force value in the neighboring FEM node. The -factor determines a fraction of the mean value to be used during further analysis. As can be seen from Figure 8b, once the values were categorized as extreme values, they were adjusted to the last maximum value determined during the evaluation process in Equation (6). Thus, the adjusted values provided in Figure 8b (grey dots) in reversed way for a clearer presentation.
3. Trial Models
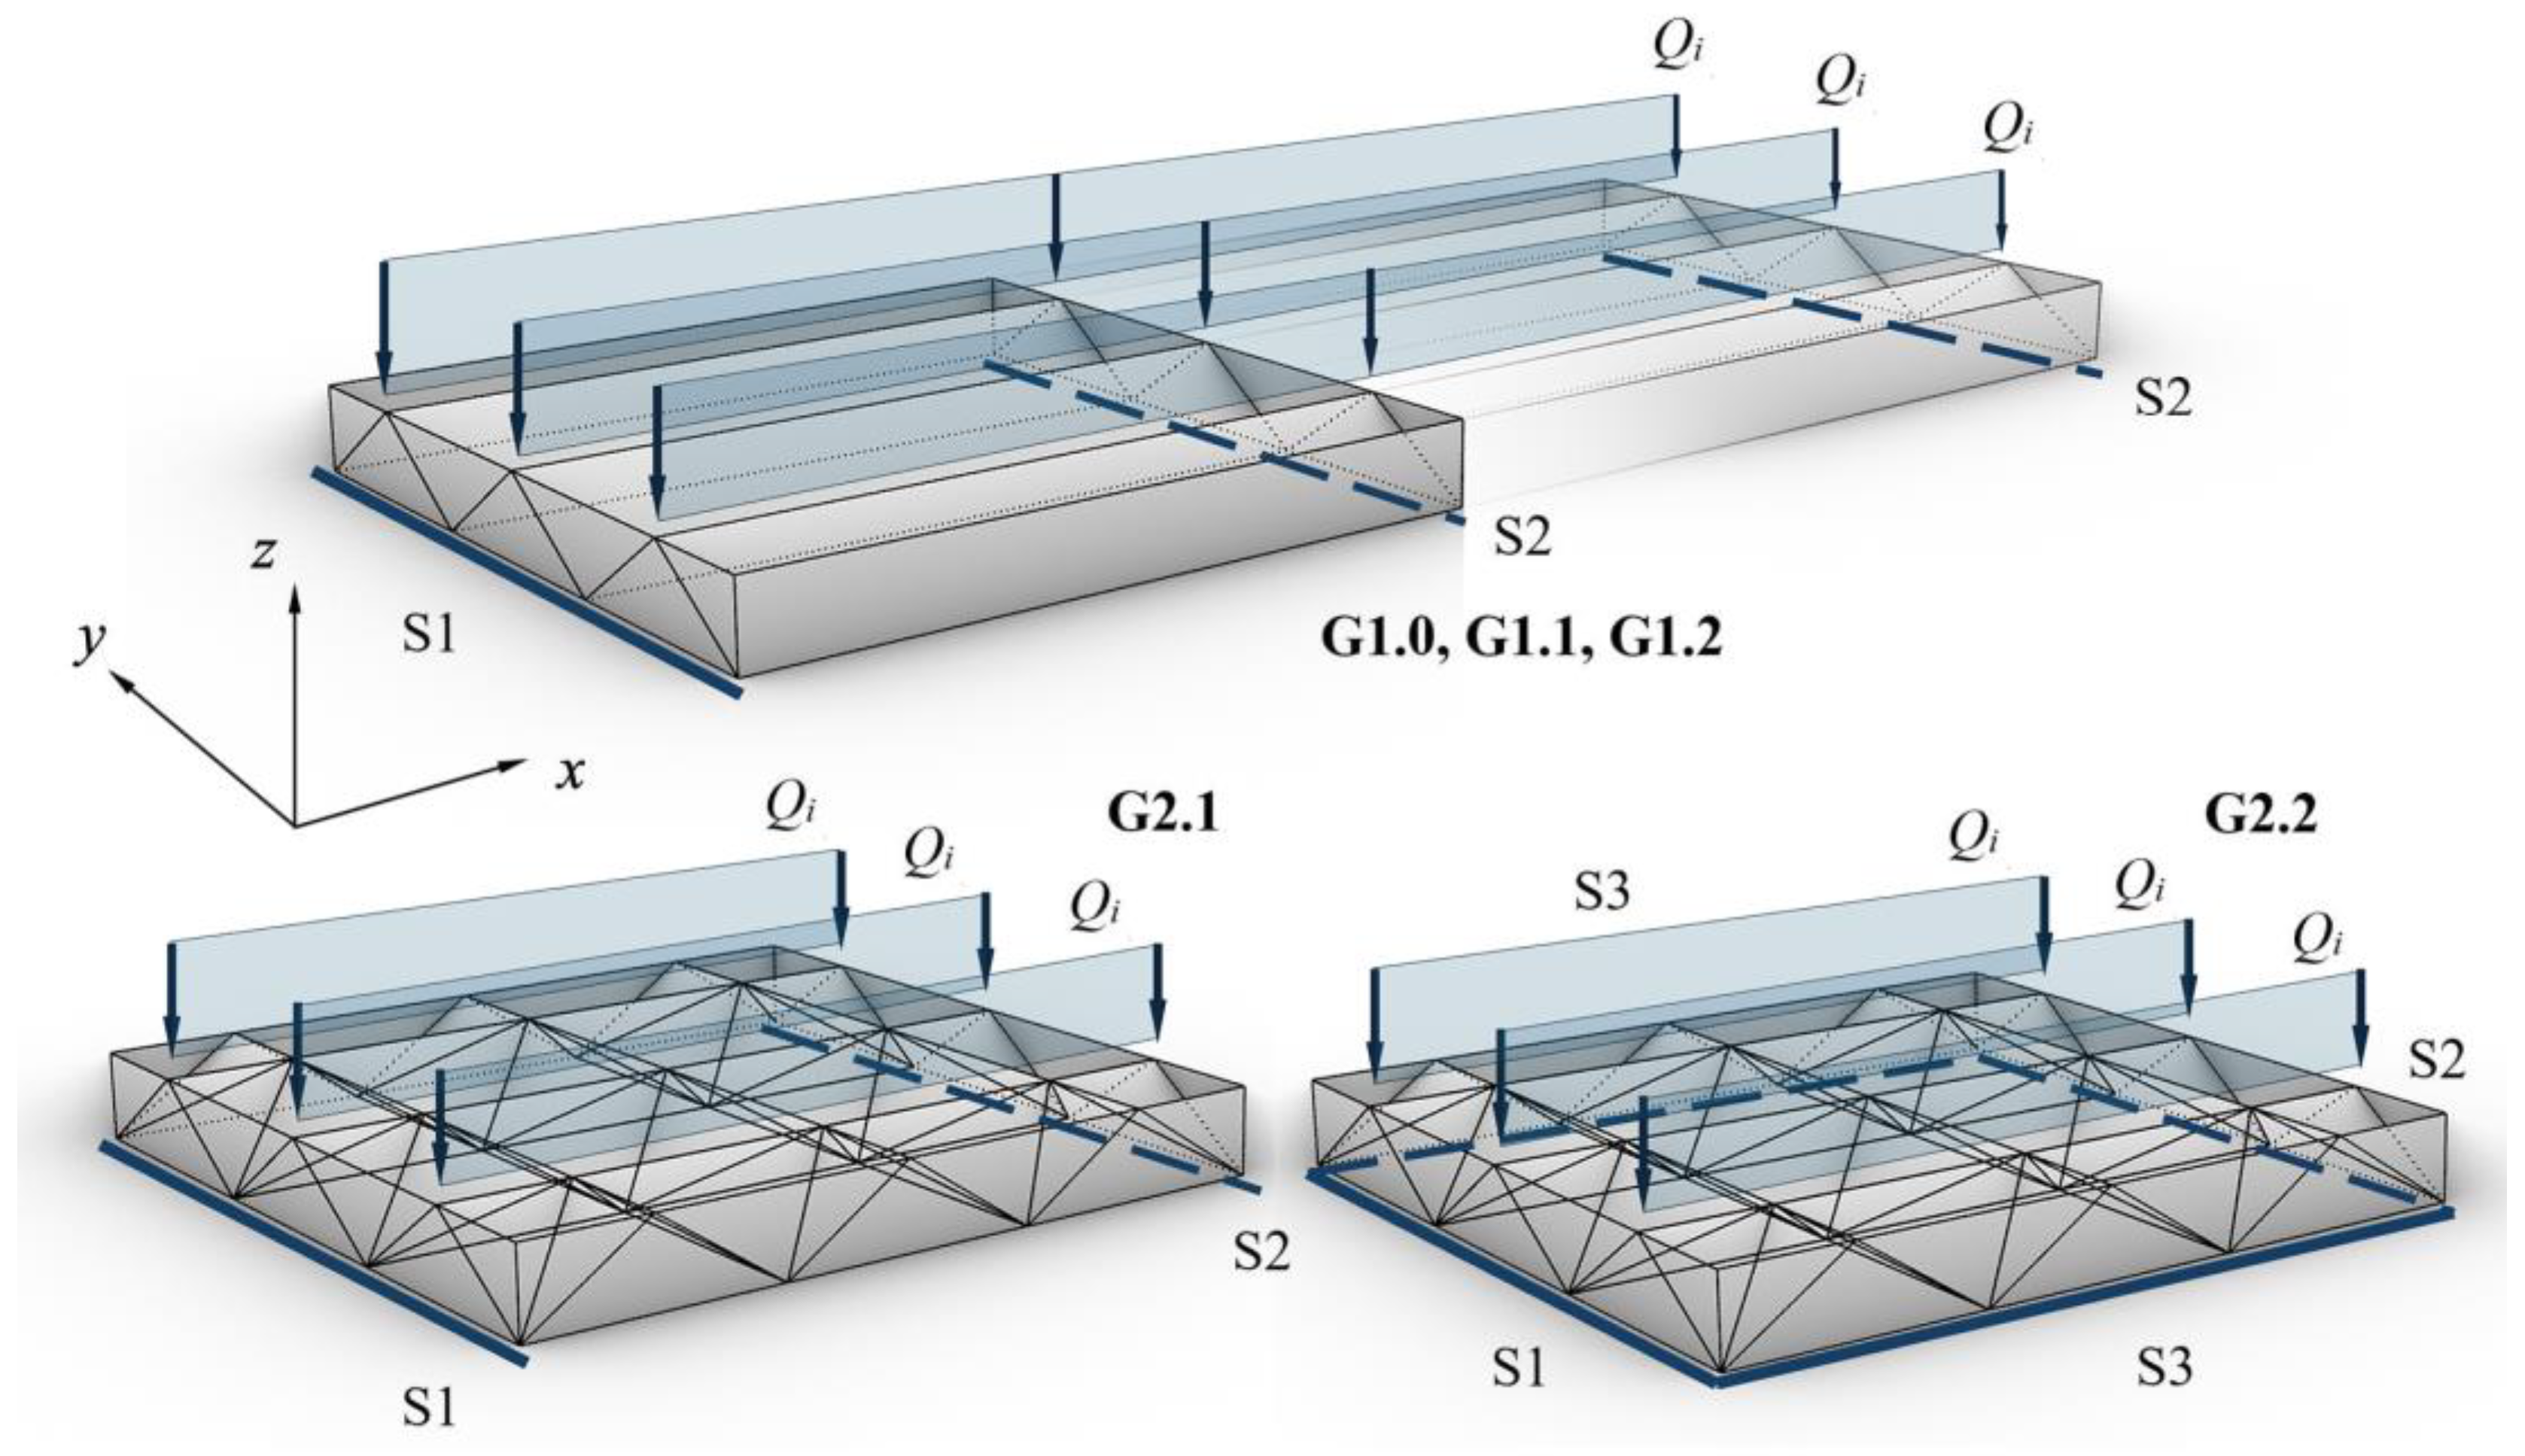
In order to prove the concept of the provided above numerical analysis procedures and to validate the structural performance of lightweight TRC elements investigated in the project according to the idea in Figure 1, it was decided to perform a set of trial-based simulations. A ceiling plate with a rectangular outline served as a starting point. The commonly solid interior of such a component was to be resolved by shell-like inner membrane structures of arbitrary curvature with the help of MOET. One boundary condition was that the top of the structural element was to be completed with a horizontal plate. Consequently, a distributed load on this upper plate represents a linear load Qi for the internal structures, which resulted in folds as the optimal solution for the internal geometry. A lower horizontal panel is not added. A visualization is provided in Figure 9. The next Table 3 summarizes the types of geometry with respective dimensional features and boundary conditions, which were analyzed regarding their structural behavior to validate the proposed numerical solution.

Figure 9.
Geometry types with applied load and boundary conditions. Graphic: Iurii Vakaliuk.
Table 3.
Geometric parameters used for the validation of numerical procedures.
There are two basic groups of elements: group G1.x with single directional orientation of the inner membranes and group G2.x with double directional orientation of the membranes. All the solutions from the group G1.x possess two line supports. The spans differ from 1.8 m to 6.0 m. The support S1 brings freedom in direction . The support S2 gives freedom in directions and . The group G2.x with a constant span of 1.8 m contains two boundary condition solutions. In the case of G2.1, two edges are supported by S1 and S2. For the second variant G2.2, a four-sided support was assumed by S1, S2, and S3. Support S3 introduces free movement in and .
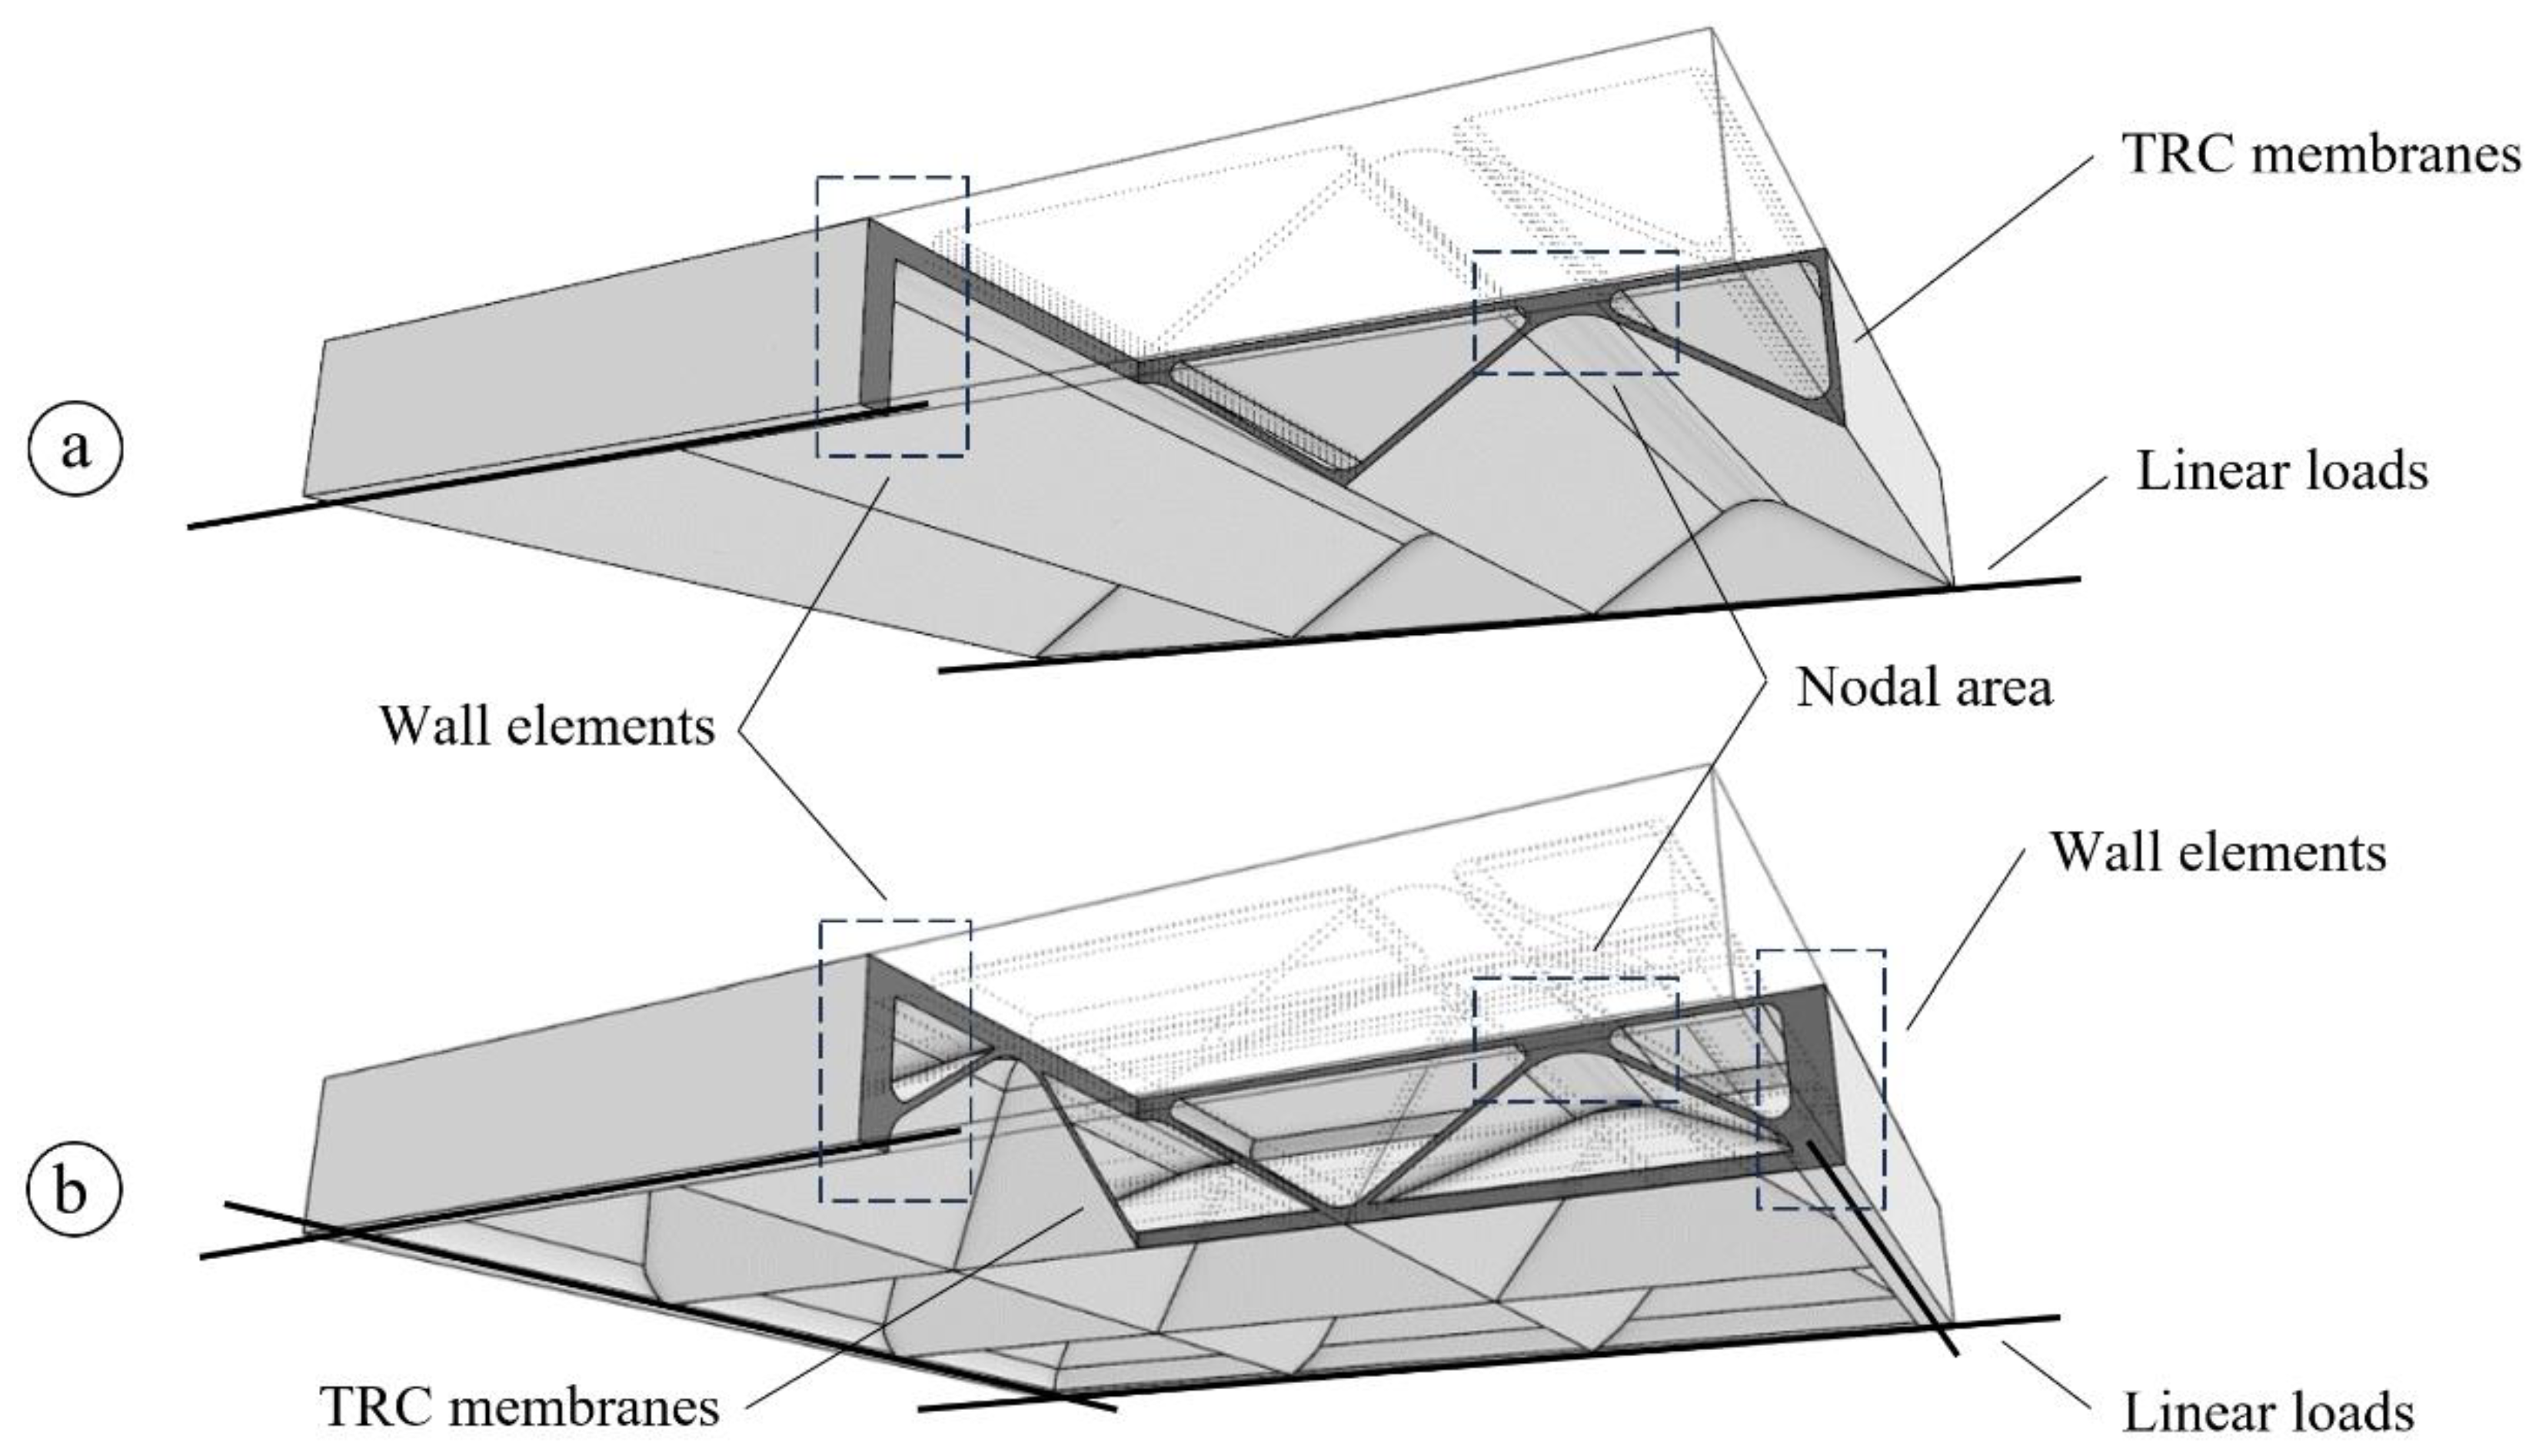
In further detail, the principal difference between the inner structure of the geometry type groups G1 and G2 are visualized in Figure 10. Figure 10a shows the simpler G1 solution with single directional orientation of the structure, and the other Figure 10b shows the more complex variant G2 with an inner structure oriented in two directions. Obviously, the G2 solution creates a wide range of internally intersecting membranes. As can be seen from the figure, the nodal areas possess an increased thickness to avoid local punching shear failure.
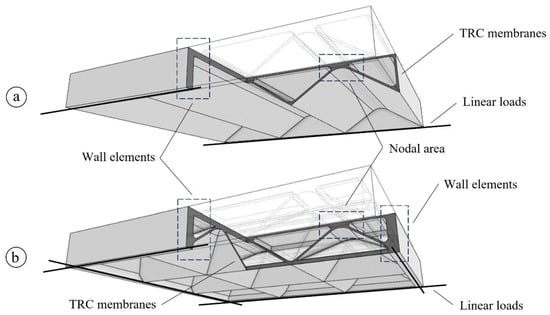
Figure 10.
Detailed views of both structure types to be analyzed; (a) G1 solution with single directional orientation of the structure; (b) G2 solution with two directional orientations of the structure. Graphic: Iurii Vakaliuk.
The thickness of all the internal and external membranes was set to 10 mm. The areas where it was planned to have the linear supports have thicker 50 mm walls. These dimensions are reflected, of course, in the FEM model. The other important point to be mentioned is the formation of the internal voids within the TRC elements. According to the scope of our research project, it is planned to manufacture und test such elements described here in our laboratory. The manufacturing process is carried out by casting under negative pressure. With this method, we cannot realize real voids in the desired geometry. To approximate the theoretical found shape, the voids are formed with specially cut blocks made of extruded polystyrene (XPS). In more detail, the whole procedure is described in [20]. The consideration of the XPS blocks within the FEM model was skipped for simplification reasons. It can be assumed that the load-bearing behavior of the elements is not fundamentally influenced. In a preliminary study as part of a master’s thesis [35], the influence of XPS and wax (see, e.g., [36,37]) instead of real voids was analyzed on a beam with hollows. The use of XPS in the voids only marginally influenced the load-deflection behavior of the member. As expected, the use of wax resulted in significantly stiffer behavior.
It may be seen from Figure 9 that the load to all the geometry types is applied in a similar manner as a sequence of linear loads to the “peaks” of the triangular folds within the geometry. Thus, the loads are applied in the node zones of the TRC structure. The magnitude of the load is considered as a point of exploration. Therefore, we have a range of loads from 0 kN to the limit load that is determined during a steady increase in the load. The self-load of the structures is, in turn, applied within the framework of the RFEM software as an area load to each of the FEM shell elements separately. Considering the density of concrete of 2350 kg/m³, the area load results in . No partial safety factors are considered in the study, neither on the side of the loads nor on the side of the materials’ resistance; thus, .
4. Results of the FEM Calculations
4.1. Geometry Type G1.0
Considering the provided description of the FEM model, a sequence of calculations with the introduced geometry cases was performed. The handling with numerical discontinuities and extreme points is described in Section 4.4. The specific level of the k-factor in the post-processing has no major influence on the basic structural behavior, which shall be discussed first.
Initially, we provide the results for the reference geometry solution G1.0. The next Figure 11 gives an insight into the distribution of the utilization ratio UR over the structure, calculated according to the principles given in Section 2.5. The figure presents only the 10 mm thin horizontal and folded parts of the structure, which are in the focus of the research. The UR is presented in the form of fractions that give an exact value of 1.0 for the point that achieved the failure limit first. No distinction is made between compressive stress and tensile stress. This state results from an iterative procedure with a steadily increasing applied load . In the case of structure type G1.0, the line load at failure corresponds to 32.0 kN/m or to 172.8 kN total load applied to the structure.
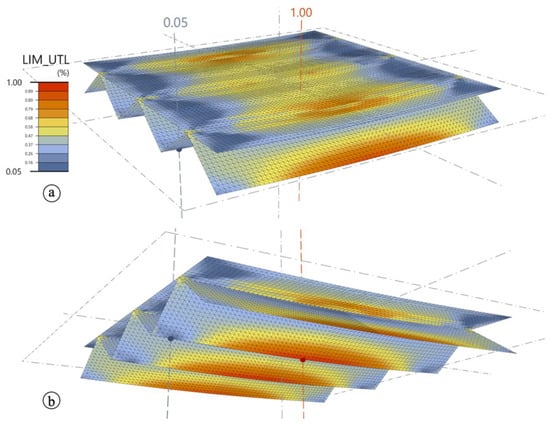
Figure 11.
Results from FEM analysis with post-processing of UR of the structure for geometry case G1.0; (a) top view and (b) bottom view. Graphic: Iurii Vakaliuk.
The general pattern of the UR indicates two critical areas. The first one can be seen in the tensile zone and the second one in the compression zone, both in the middle of the span. Although the most critical point is indicated in the tensile area, the compression area reaches a UR level of about 90%. The area with the lowest UR of 5% is located close to the supports on the folding edge on the bottom side of the TRC element. Furthermore, it may be seen from the figure that the TRC areas in the folds located away from the midspan of the structure faced a level of utilization that is higher than 50% in the shear zones. Such behavior can be explained by a significant load applied to the relatively short span of the structure. Accordingly, the span of 1.8 m approaches the limit when the compression action, such as in a thin-walled structure, may be decisive.
The hypothetical failure modes in the different areas of the TRC elements are represented in Figure 12a for the top view and in Figure 12b for the bottom view according to the failure type description given in Section 2.5. The used algorithm analyzes all FEM points, and therefore the results are provided for the whole structure. Thus, for the areas that are not subjected to their specific failure loads according to the results from Figure 11, the pictures indicate the potential failure mode if the load is increased over the level of the global failure load of the whole structure.
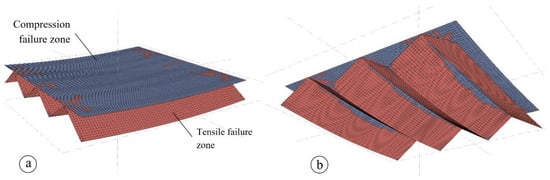
Figure 12.
Predicted failure modes for all FEM nodes of the whole structure; (a) top view and (b) bottom view. Graphic: Iurii Vakaliuk.
From the figures, it follows that a resolved element with the geometry type G1.0 shows clearly distinguished compression and tensile failure zones. Apart from a few exceptions, the top face layer of the structure experiences completely compressive actions. The folded membrane structure underneath is, in turn, subjected to tensile action. The border between the compression and the tensile zones can indirectly indicate the position of the neutral line.
4.2. Geometry Types G1.1 to G2.2
The next figures give a brief overview of the FEM calculation results for the structures with the other geometry cases G1.1, G1.2, G2.1 and G2.2. Figure 13 shows the deformed state for G1.1 with a span of 4.0 m and for G1.2 with a span of 6.0 m. The general pattern is similar to the previously shown calculation of G1.0 of the same cross-sectional geometry type and similar support conditions. The load-bearing capacity was achieved with a total applied load of 78.0 kN for the case with a 4.0 m span and 49.5 kN for a span of 6.0 m. This reduction in the failure load results from the significantly larger span while the overall height and cross-section geometry remained the same.
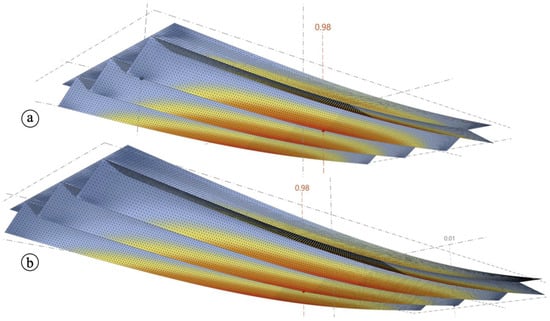
Figure 13.
FEM analysis results with post-processing of the utilization ratio of TRC structures according to the geometry cases G1.1 (a) and G1.2 (b). Graphic: Iurii Vakaliuk.
Comparing the results from Figure 11 and Figure 13, it may be seen that an enlarged span increases the UR in the middle section of the structure more than in the support areas. This can be explained by the fact that, from a global perspective, the increased bending moment became decisive, and less stress in the shear zone follows from the reduced maximum load. The utilization of the concrete in the compression zone also decreased so that the aspect of a possible stability failure in the horizontal surface layer becomes less relevant.
Figure 14a shows UR values for the uniaxial spanning structure G2.1 that possesses two directional orientations of the resolving membranes. The presented pattern shows a similar stress state in the main spanning direction but an almost low utilization of the bearing capacity of the material in regard to the transversal direction. Consequently, the transversal membrane brings a very minimal contribution to the general load-bearing capacity of the structure when supported on two opposite sides. The maximum possible load for this case reached the magnitude of 32.0 kN/m (line load) and of 172.8 kN (in total), respectively. Figure 14b shows the geometry G2.2 with two directional orientations and supports on all four sides (compare Table 3 and Figure 9). As can be seen from the figure, the bottom membranes of the structure experience a significant reduction in the stress magnitude. In addition, the UR diagram indicates the shift of the critical zone from the bottom side of the structure to the so-called nodal area according to Figure 10 in the connection areas to the vertical 5 cm thick TRC walls, which enclose the structure on the outside. Therefore, these nodal areas should be under special attention during the design process. A special design solution should be developed for these nodal areas according to the force flow in the next phases of the current research project to redistribute the peak values of the stress and, consequently, to achieve a more even redistribution of the stress state and the cross-sectional utilization within the whole structure. The maximum line load reached the magnitude of 60.0 kN/m, which resulted in a total load of 324.0 kN.
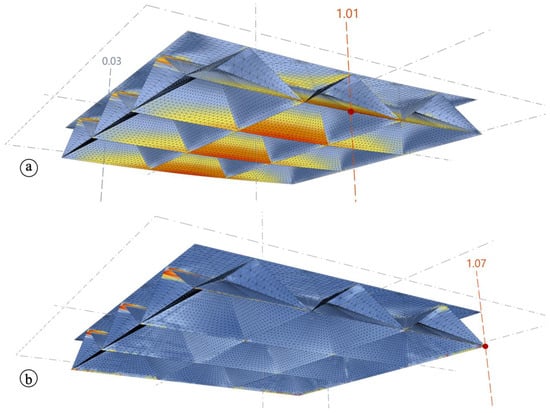
Figure 14.
FEM analysis results with post-processing of the utilization ratio of the structure of geometry case G2.1 (a) and G2.2 (b). Graphic: Iurii Vakaliuk.
To conclude, it should also be mentioned that the increased quantity of intersections in cases G2.1 and G2.2 compared to G1.i types of results in a much larger number of extreme values. It makes the calculation process of the geometrical solutions with a large number of intersecting webs more sophisticated. Thus, an even more comprehensive approach is required to establish an appropriate setting to manage extreme values derived during the FEM analysis.
4.3. Midspan Deflection Results
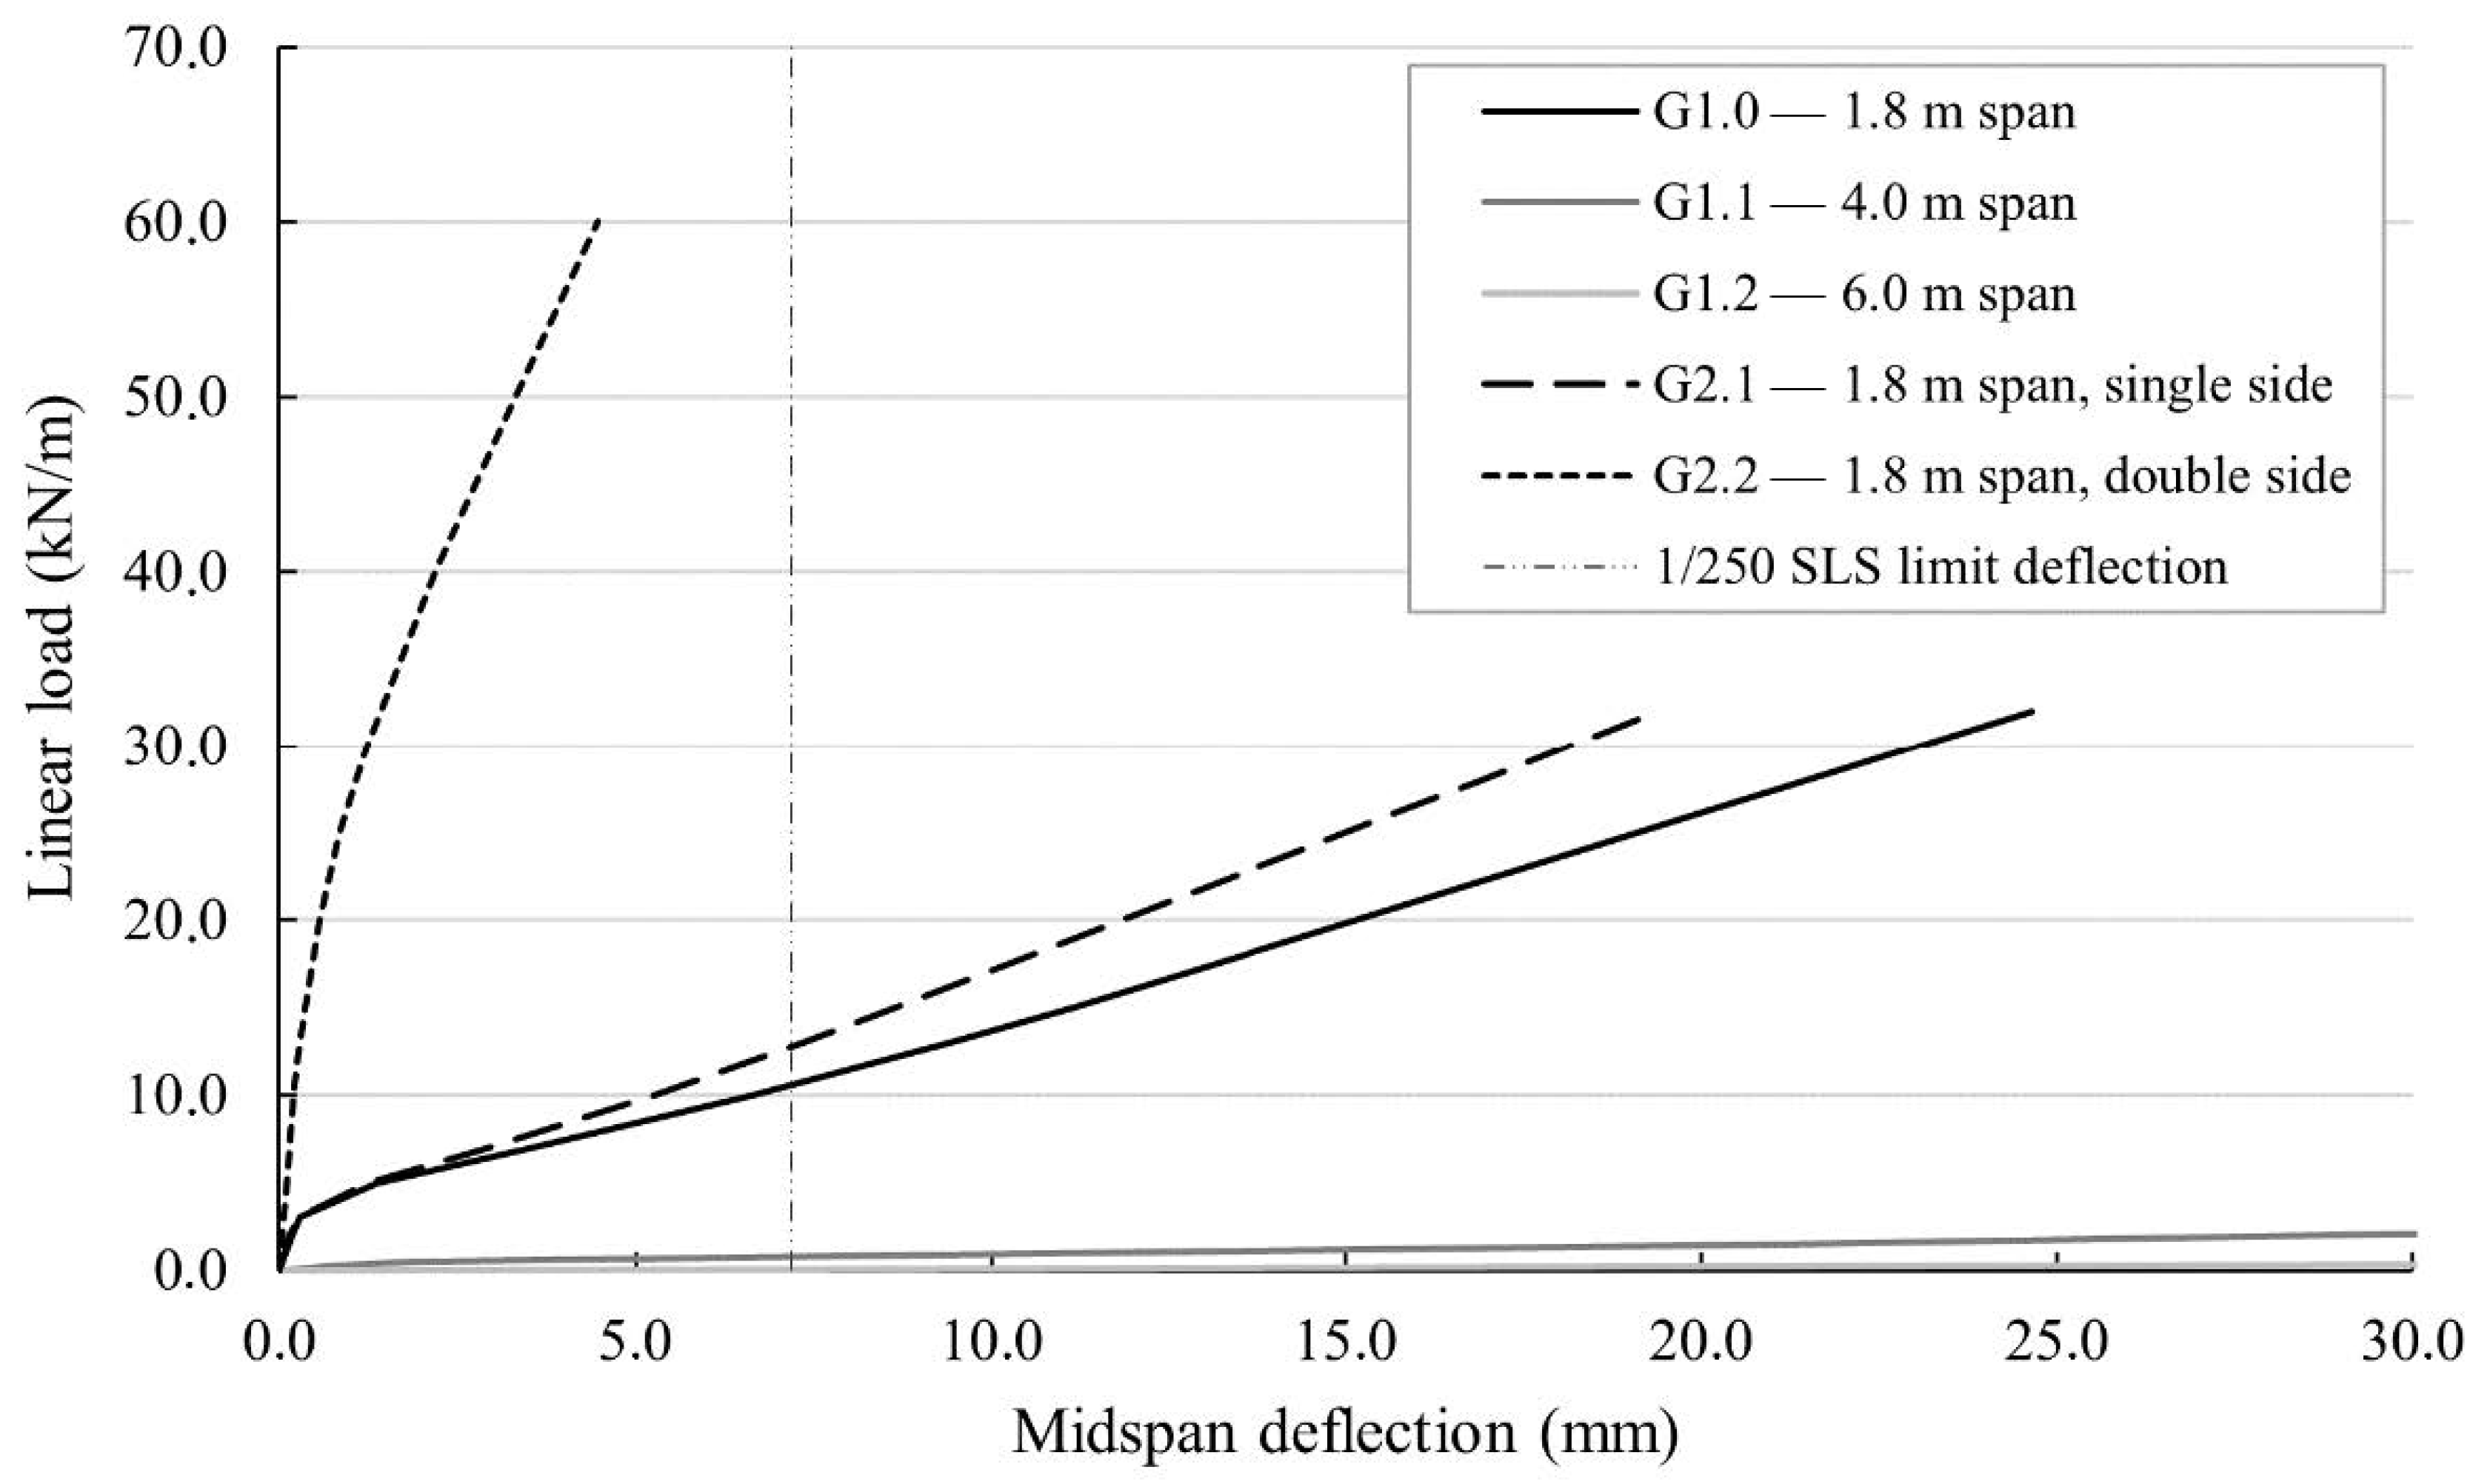
The other important results that can be derived from the numerical analysis of the structures are the midspan deflection curves. Figure 15 gives insight into the deflection behavior of the geometry cases with a span of 1.8 m. The applied line load is indicated on the y-axis. In the calculation of the deflection plotted on the x-axis, of course, the dead load of the element was also considered. The reference type G1.0 shows the highest deflection of 24.7 mm at failure. Also, all the cases behave with a relatively small linear range. The variant G2.1 with transversal membranes is able to carry a slightly higher line load. The element behaves slightly stiffer and reaches an ultimate deflection of 20.6 mm. Due to the support at all four edges, the last type, G2.2, shows a very minor deflection of 4.5 mm at a clearly increased failure load.
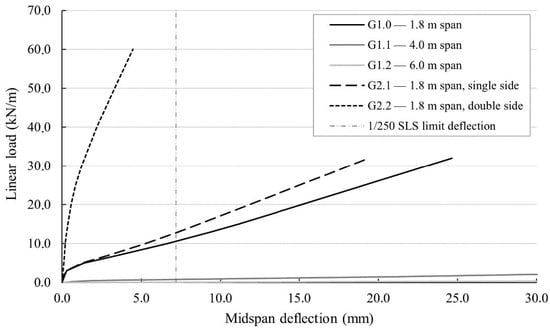
Figure 15.
Load–midspan deflection relations for the geometry cases with 1.8 m span; SLS limits acc. to [31] are added. Graphic: Iurii Vakaliuk.
In addition to the state of failure, serviceability is also of interest. For this reason, the limit of deflection of 1/250 of the span acc. to [31] as a limit for the serviceability limit state (SLS) is added in the diagrams. Both variants G1.0 and G2.1 exceed the line. At that point, the elements G1.0 and G2.1 can carry a line load of approximately ~10.0–13.0 kN/m, in addition to their self-weight. In the case of element G2.2, the deflection at fracture is smaller than that permitted for the SLS. Consequently, the material can still be saved here, as the element reacts more rigidly than is required.
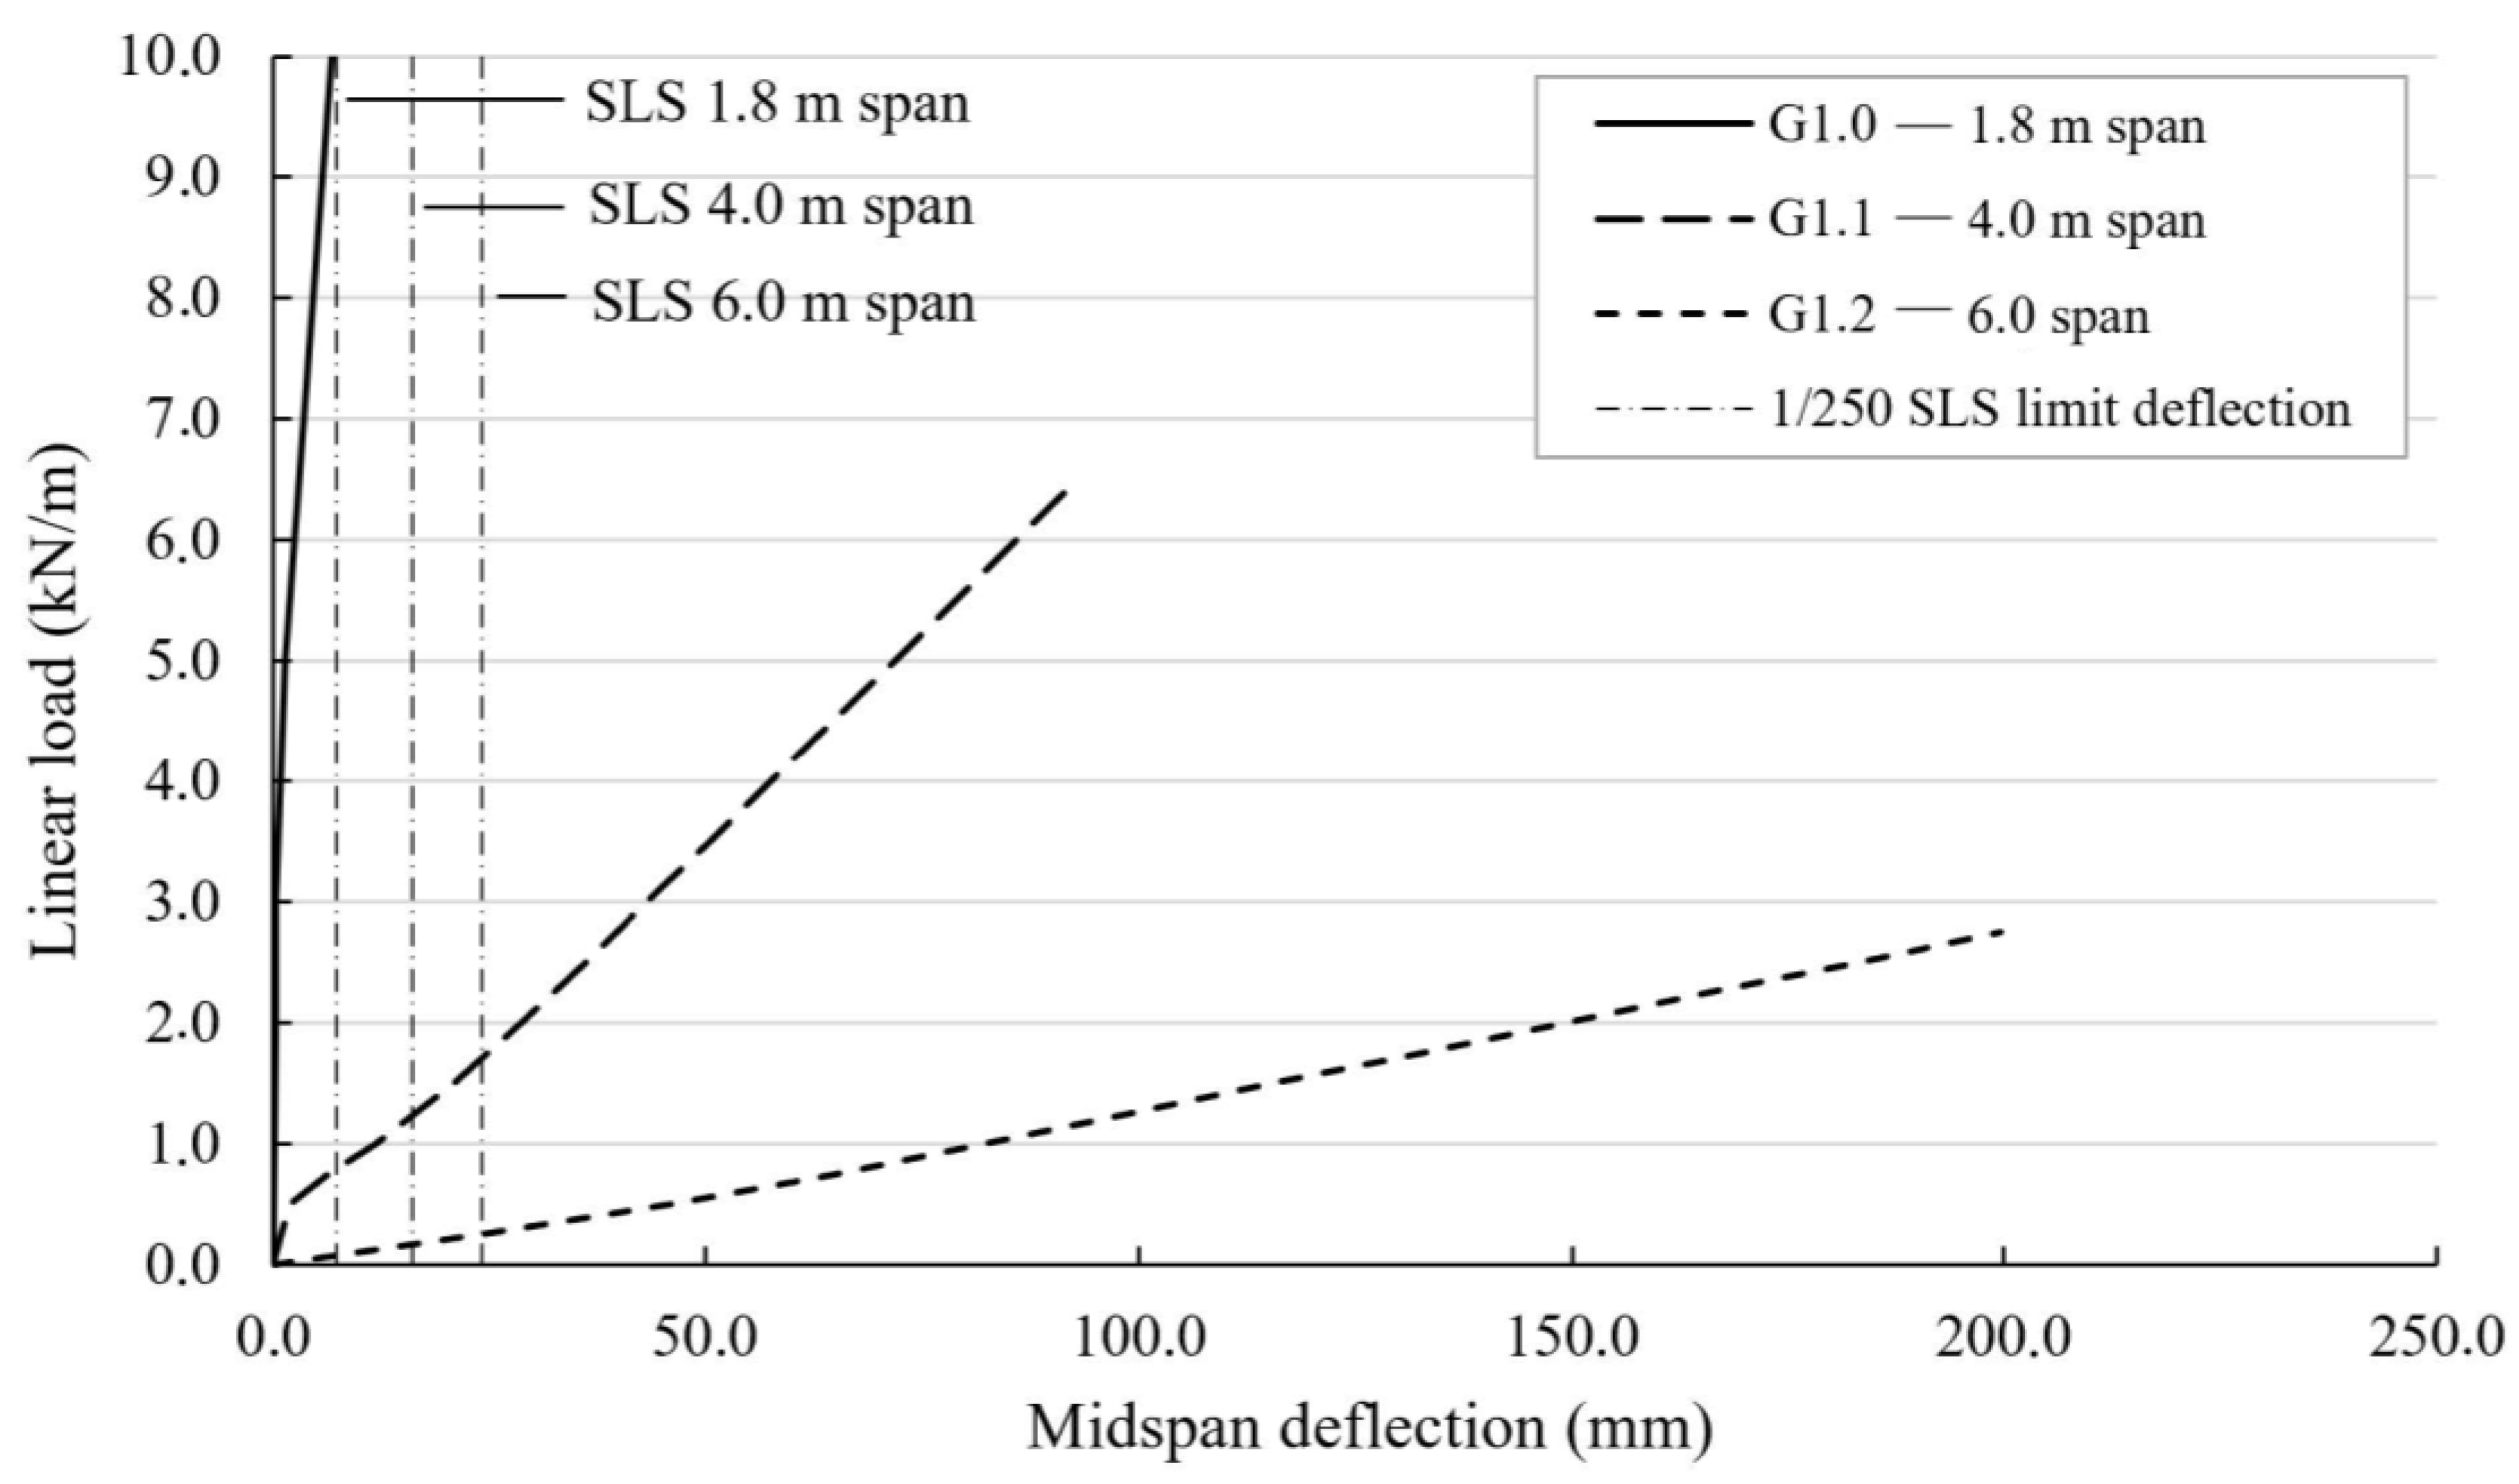
Figure 15 also shows the load–deflection curves for the elements G1.1 and G1.2. Due to their large span and significant cumulative load, they exhibit significantly higher deformations than the components with a span of 1.8 m. The scale is therefore changed in the following Figure 16. The y-axis shows the total applied load in kN, and the x-axis again shows the middle deflection. As described in Section 4.2, with increasing span, the applicable load decreases, and the deflection at a certain load level consequently increases. The maximum deflection reached for a span of 6.0 m (element G1.2) was 200.0 mm, eight times higher than for G1.0. A span of 4.0 m resulted in a maximum deflection of 93.0 mm.

Figure 16.
Load–midspan deflection relation of the elements with G1 geometry with differing spans from 1.8 m to 6.0 m; SLS limits according to [31] are added. Graphic: Iurii Vakaliuk.
4.4. Stress Concentrations in the Trial-Based Calculations
In all calculations presented before, one of the critical points was an appropriate selection of the k-factor that determines the level of post-processing in regard to the extreme stress values as described in Section 2.6. The problem shall be discussed in the example of the structure G1.0 loaded by different high line loads, see Figure 17. On the x-axis, the load level is given. On the y-axis, the highest values for the UR of at least one FEM node in the whole model are displayed, resulting from consideration of different k-values. The horizontal gray line represents an UR of 100% or 1.0, which corresponds to the failure limit of the structure. The black lines visualize the influence of different k-values during the post-processing on the UR of the structure. The upper black dashed line indicates UR levels when no limitation of extreme value was applied during the calculation routines. For every displayed load level, there are nodes with a utilization of more than 100%. An increase in the load expected leads to an increase in the extreme values but with some non-linear redistribution.
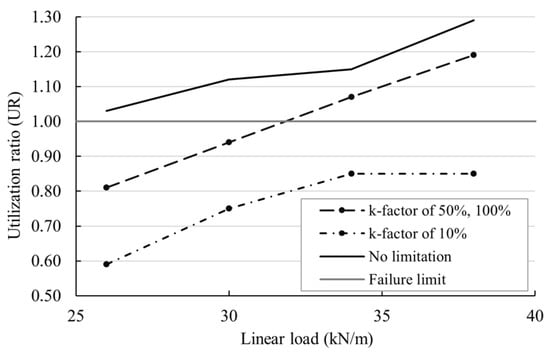
Figure 17.
Influence of the setting of the k-factor in the post-processing on the utilization ratio in regard to the areas with stress concentrations. Graphic: Iurii Vakaliuk.
Taking limitation levels of 100% and of 50% into account, which corresponds to k-factors of 1.0 and 0.5, respectively, the UR levels are similarly reduced in general but increase steadily with rising applied linear load. The black dashed/dotted line results when the k-value is set to 0.1. As expected, the limitation of 10% shows a significant reduction in the UR level. At none of the FEM nodes one of the failure criteria was reached. In addition, the rise of the utilization ratio stagnates after exceeding a line load of approximately 35 kN/m, which can be interpreted as some “instability” in the estimation of the UR. The level of 10% seems to be too low, and, as a result, the algorithm trims “natural” gaps in the stress level between neighboring FEM nodes, according to the description from Section 2.6. Consequently, with k = 0.1, it was impossible for the iterative calculation to reach 100% of UR and to correctly estimate the failure limit.
For all the presented calculations, the k-factor was set to a level of 50%. This decision is supported by the hypothesis that a sensible level of the k-factor stabilizes the behavior of the FEM analysis and makes the UR increase predictable. In that recommended range, the increase in the UR is stable and comprehensible. The decision will be validated on the basis of large-scale laboratory experiments.
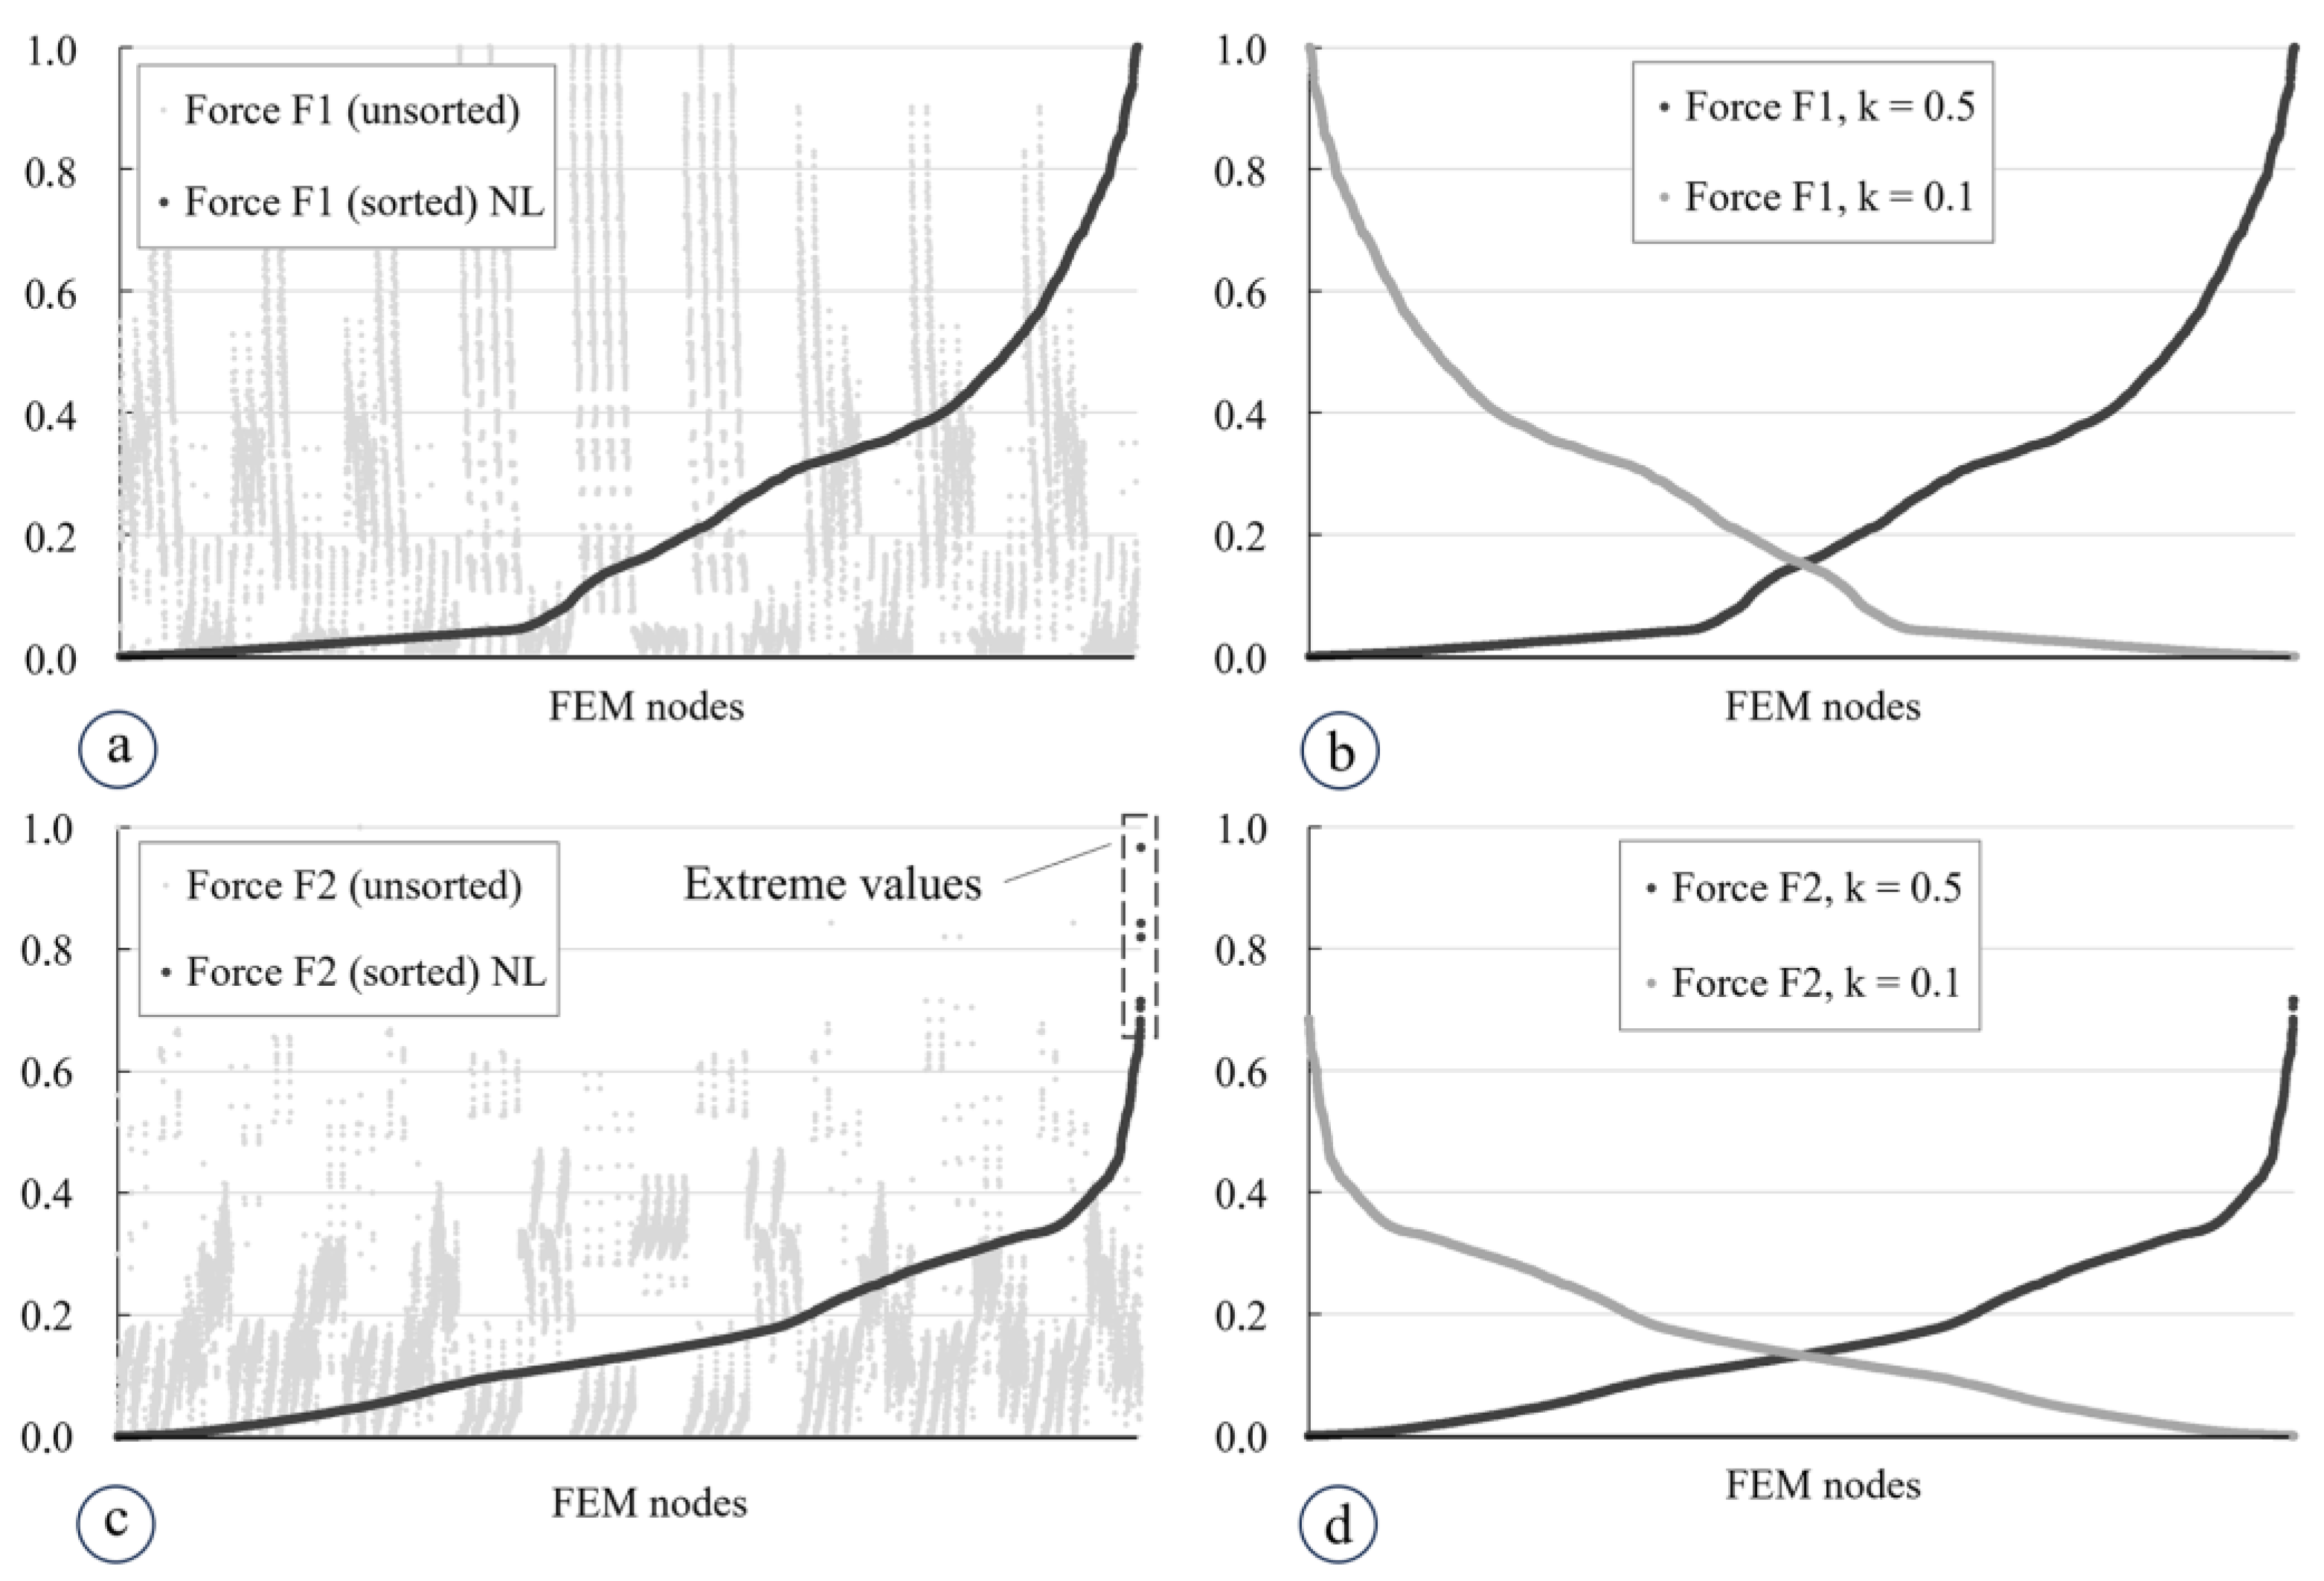
The results given in Figure 17 shall be underpinned by a further perspective, analog to the procedure described in Section 2.6. The gray dots in the diagrams in Figure 18a,c show, first of all, the unsorted distributions of the internal forces in the principal directions 1 and 2 over all the FEM nodes for the element G1.0. The magnitudes of the forces were normalized for convenience after all individual values had been sorted by size (see gray lines). For forces in the second principle direction, in Figure 18c, a clear region can be seen that includes values that can be considered extreme ones according to the description given in Section 2.6. In turn, Figure 18a shows a more even distribution of the force in the first principal direction, which is why the extreme values cannot be detected. After the post-processing with a k-factor of 50%, Figure 18b,d shows dark gray sorted lines after the elimination of the points that were “separated” from the main cluster of FEM points. As described above, the eliminated points were replaced with the maximum respective value that was calculated using k = 0.5. Obviously, all the noticeable points that could be considered as extreme values were eliminated. For comparison, setting k to 0.1 (light gray lines, printed reversed for better visibility) results in no significant differences in contrast to 0.5. Furthermore, the utilization of 10% k-factor reduces the values that may potentially be a “real” stress state of the structure. Therefore, the utilization of a 10% k-factor will not correctly reflect the behavior of the TRC structure.
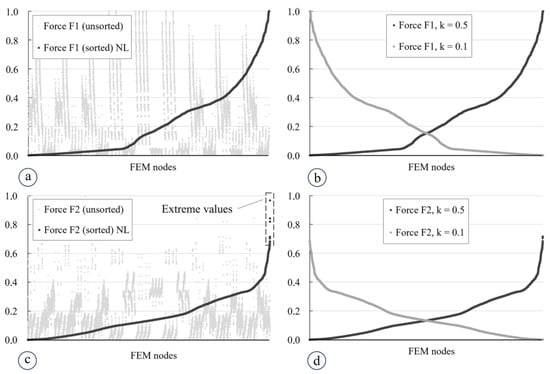
Figure 18.
Post-processing of the extreme values for the analysis of the structure G1.0 at an applied liner load of 32.0 kN/m: (a,c) diagrams with unsorted and sorted, nonlimited (NL) values for the internal forces F in the principal directions 1 and 2; (b,d) sorted diagrams for these internal forces derived after applying k-factors of 0.5 and 0.1. Graphic: Iurii Vakaliuk.
Finally, it should be pointed out that according to the proposed method of extreme value assessment, the two principal directions in the internal force field are analyzed separately, and values are adjusted independently of each other.
5. Discussion
In general, the estimation of an appropriate level of the k-factor and, as a result, the appropriate reduction in the extreme values plays a critical role in the evaluation of the limit state of the calculated TRC structures. Within the scope of our current research project, we use the described procedure as a possibility to estimate a correct failure event, but it needs to indicate that this concept is just an assumption at the current stage of the analysis of the thin-walled, folded, or shell-shaped TRC structures. In this paper, we presented the basic assumptions for the numerical analysis and highlighted different aspects that influence the results derived from the calculation process. A wide study needs to be performed in the following stages of the project to validate the procedure. We plan to examine various structural solutions based on the concept of resolving the usually massive cores of concrete elements by TRC membranes with different curvatures.
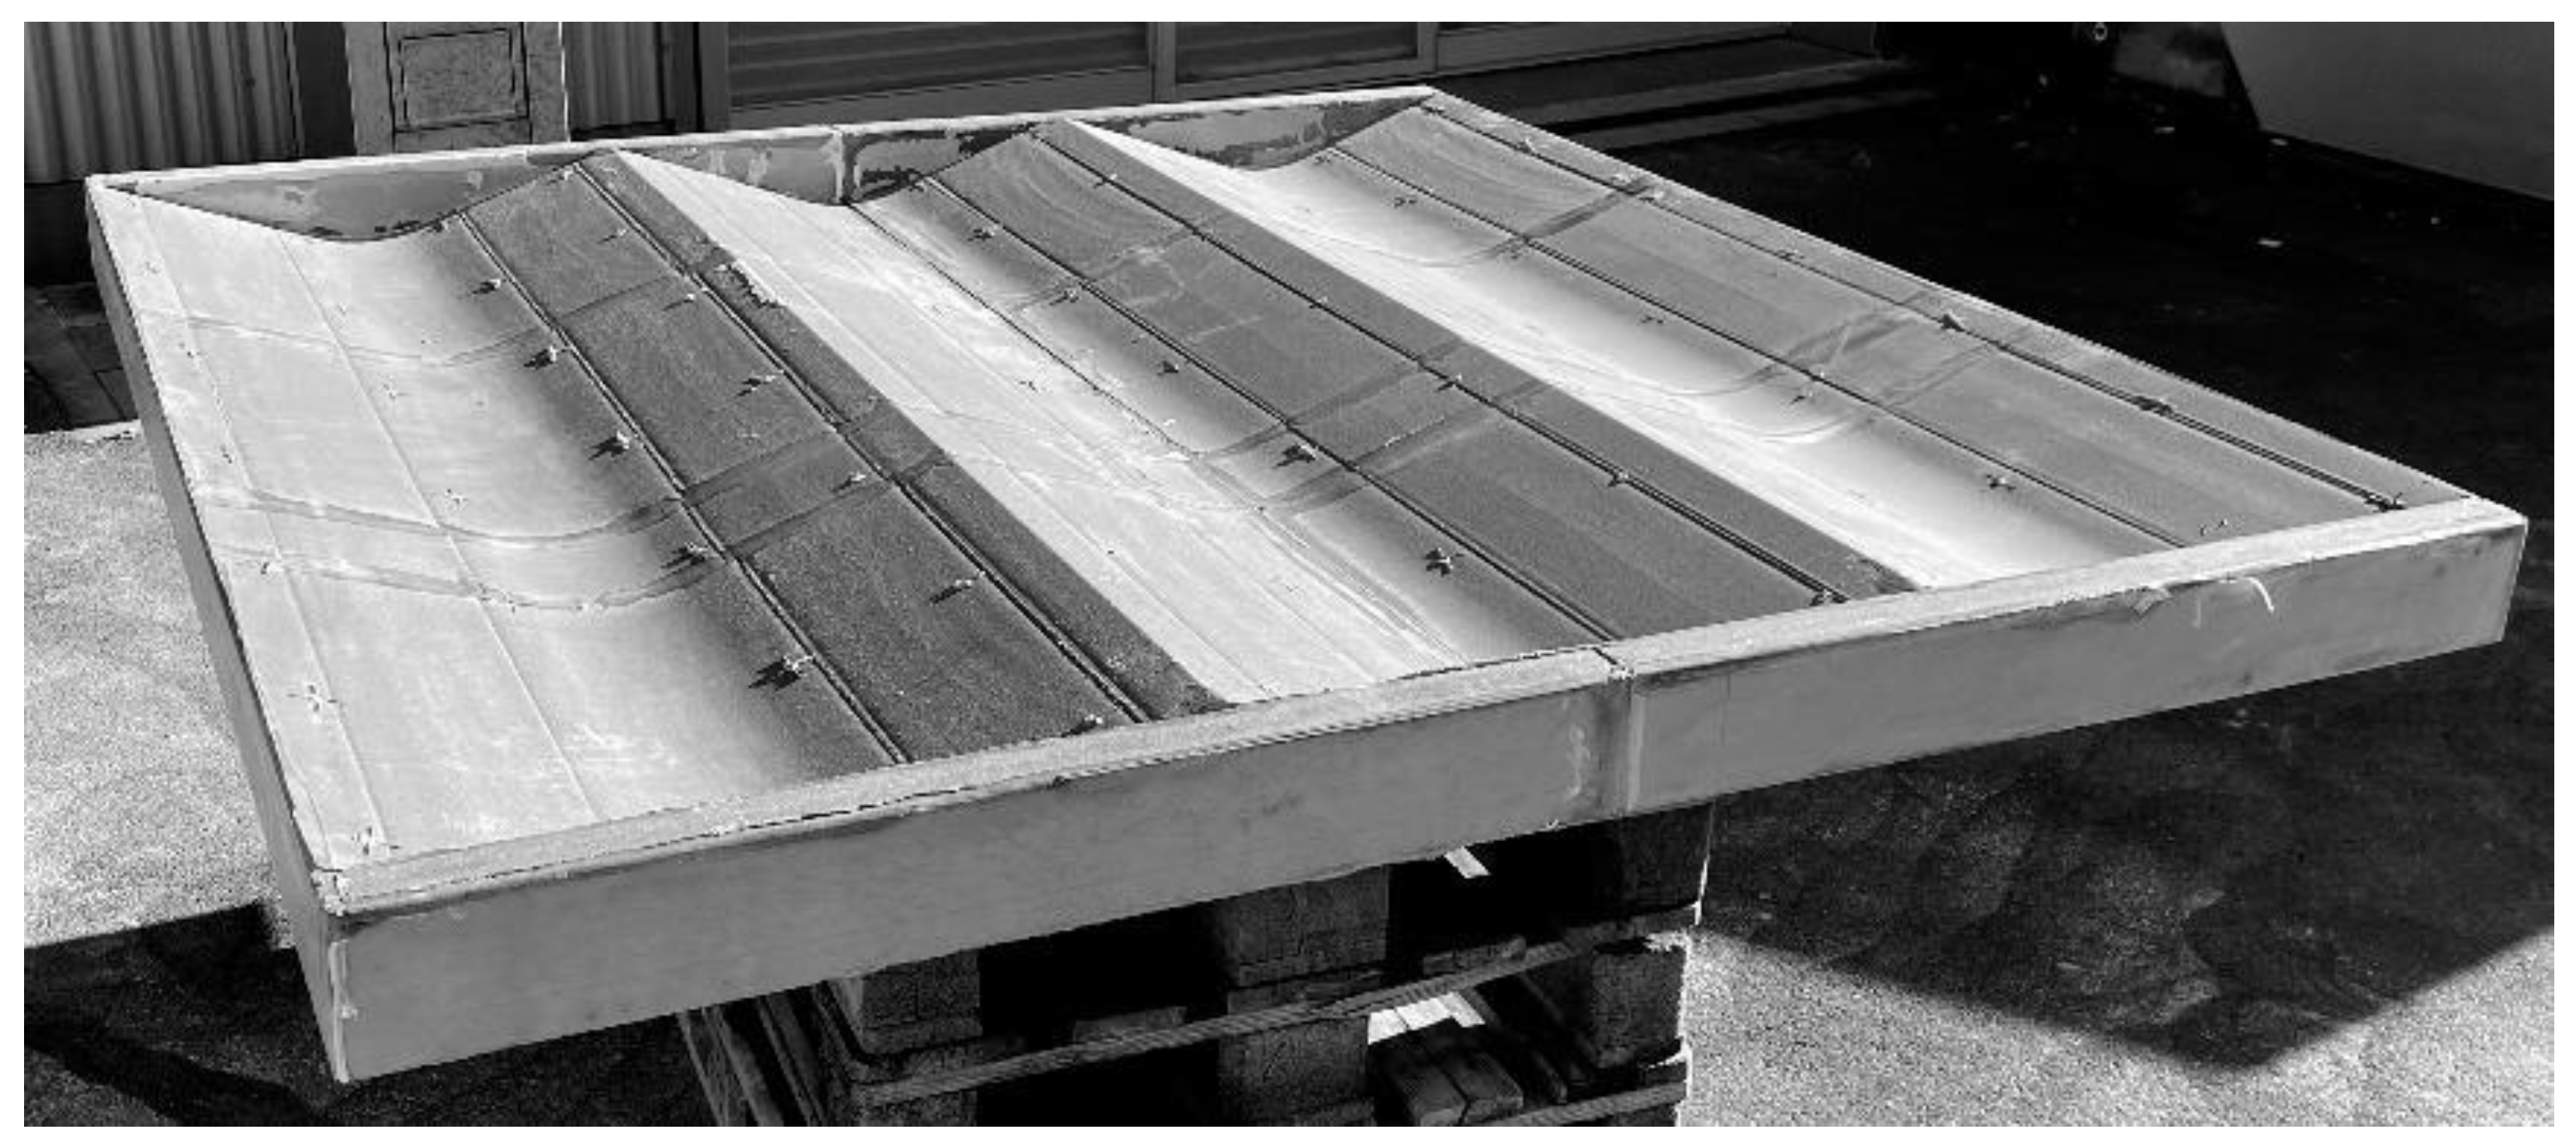
The results derived from the numerical study will be validated by a sequence of full-scale experiments. The first resolved TRC plate with the geometry G1.0 and a second with a lower overall height was already manufactured in the Otto Mohr Laboratory by die casting under vacuum conditions [20]. One of the elements is shown in (Figure 19). The structures shall be examined in 9-point bending tests.

Figure 19.
TRC element with geometry G1.0 but half overall height after demolding (lying upside down). Photo: Iurii Vakaliuk.
The other important point to be discussed is the possible influence of the XPS blocks we currently use for manufacturing the resolved elements on the numerical results. As indicated in Section 3, the presence of the XPS blocks is not yet considered in the analysis. It was found in [35] that the consideration of the XPS blocks or of formwork/fillers made of other materials, such as wax, may influence the structural behavior of resolved concrete structures. It was also shown that the level of influence hardly depends on the material used for the inclusions as well as on the specific configuration of the inner voids, their orientation, etc. It is planned to integrate a corresponding numerical module into the calculation routine presented, with which different filling materials can be considered. In order to compare the derived results by means of structural efficiency, a so-called efficiency factor can be used; Equation (6):
Herein, is the critical applied load, and indicates the total self-weight of the structure, both in kN. For the FEM calculations provided in the current paper, the results of the evaluation of the efficiency factor are summarized in Table 4.
Table 4.
Efficiency factors for the different geometry types.
The table shows various results for different spans, but most of them are difficult to compare. A comparison of the geometries G1.0 and G2.1 shows that the G2.1 type with the folds in two directions has twice the dead weight but no significant increase in the load bearing capacity. The sensible reason is that the additional transversal TRC membranes are not optimal for a single-span element. In turn, case G2.2 results in a much larger structural efficiency because the four supported sides and the double orientation of the folds correspond to each other. Such comparative analyses will be deepened and intensified in the future. Their results are heavily dependent on the reference variables, the geometric and static boundary conditions, and a desired objective function. Other useful aspects to consider are, for example, the carbon footprint (e.g., of the material and the manufacturing process), the generation of waste during the production, the structural efficiency in the SLS, or the optimum structural solution with regard to the best UR simultaneously in ULS and SLS, see, e.g., [38,39,40]. A comparison with conventional construction methods is also necessary. These levels of consideration have already been prepared in the parametric design environment that was developed as part of the project.
6. Conclusions
In the numerical study presented, a possibility was shown of using TRC membranes to dissolve the usually solid interior of concrete plates and thus save material. Based on the results, it can be concluded that the provided post-processing methods of the analysis of the TRC structures give reasonable results for the structural behavior of elements with different geometrical solutions. However, additional research is required to provide a better justification and to collect more patterns in the behavior of the post-processing algorithm for the extreme values.
The next major step planned is the validation of the derived results by laboratory tests. In parallel, a broad parametric investigation will be performed to estimate the structural performance of variations in the presented geometrical cases and of other possible geometrical solutions. Finally, the parametric multi-objective evolutionary tool MOET needs to be upgraded by adding features that allow the consideration of different stiff solid bodies within the cellular TRC structures.
Author Contributions
Conceptualization, M.C., S.S. and I.V.; methodology, I.V.; validation, I.V. and S.S.; formal analysis, I.V.; investigation, I.V.; writing—original draft preparation, I.V. and S.S.; writing—review and editing, S.S. and I.V.; visualization, I.V. and S.S.; supervision, M.C. and S.S.; project administration, I.V.; funding acquisition, M.C. and S.S. All authors have read and agreed to the published version of the manuscript.
Funding
The authors greatly acknowledge the funding by the Deutsche Forschungsgemeinschaft (DFG, German Research Foundation) in the framework of the Collaborative Research Centre/Transregio TRR 280 “Design Strategies for Material-Minimized Carbon-Reinforced Concrete Structures—Principles of a New Approach to Construction” (project ID 417002380). The Article Processing Charges (APC) were funded by the joint publication funds of TU Dresden, including Carl Gustav Carus Faculty of Medicine and the SLUB Dresden, as well as the Open Access Publication Funding of the DFG.
Data Availability Statement
The data presented in this study are available upon request from the corresponding author. The data are not publicly available due to ongoing study.
Acknowledgments
The authors greatly thankful for support by the Deutsche Forschungsgemeinschaft (DFG, German Research Foundation) in the framework of the Collaborative Research Centre CRC/TRR 280 “Design Strategies for Material-Minimized Carbon Reinforced Concrete Structures—Principles of a New Approach to Construction” (project ID 417002380).
Conflicts of Interest
The authors declare no conflicts of interest.
References
- Main Website of Collaborative Research Centre/Transregio 280, (CRC/TRR 280). Available online: https://www.sfbtrr280.de/en/ (accessed on 12 September 2023).
- Beckmann, B.; Bielak, J.; Bosbach, S.; Scheerer, S.; Schmidt, C.; Hegger, J.; Curbach, M. Collaborative Research on Carbon Reinforced Concrete Structures in the CRC/TRR 280 Project. Civ. Eng. Des. 2021, 3, 99–109. [Google Scholar] [CrossRef]
- Valeri, P.; Guaita, P.; Baur, R.; Fernández Ruiz, M.; Fernández-Ordóñez Hernández, D.; Muttoni, A. Textile Reinforced Concrete for Sustainable Structures: Futures Perspectives and Application to a Prototype Pavilion. Struct. Concr. 2020, 21, 2251–2267. [Google Scholar] [CrossRef]
- Scholzen, A.; Chudoba, R.; Hegger, J. Thin-Walled Shell Structures Made of Textile-Reinforced Concrete Part I: Structural Design and Construction. Struct. Concr. 2014, 16, 106–114. [Google Scholar] [CrossRef]
- Hawkins, W.; Shepherd, P.; Ibell, T. Design, Construction and Testing of a Low Carbon Thin-Shell Concrete Flooring System. Structures 2019, 18, 60–71. [Google Scholar] [CrossRef]
- Jayasinghe, A.; Orr, J.; Hawkins, W.; Ibell, T.; Boshoff, W.P. Comparing Different Strategies of Minimising Embodied Carbon in Concrete Floors. J. Clean. Prod. 2022, 345, 131177. [Google Scholar] [CrossRef]
- De Coster, A.; Hennemann, M.; De Laet, L.; Tysmans, T. Design Method for Modular Shells in TRC: A Combined Geometrical—Structural Study. In Proceedings of the IASS Annual Symposia, IASS 2020/21 Surrey Symposium: Optimisation Methods for Analysis and Design of Roof Structure, Beijing, China, 23–27 August 2021; Xue, S.-D., Wu, J.-Z., Sun, G.-J., Eds.; International Association for Shell and Spatial Structures (IASS): Beijing, China, 2022; pp. 3377–3387. [Google Scholar]
- Beton- und Stahlbetonbau 2023, 118, S2—CUBE Das Carbonbetongebäude. Available online: https://onlinelibrary.wiley.com/doi/10.1002/best.202390001 (accessed on 10 September 2023).
- Vakaliuk, I.; Frenzel, M.; Curbach, M. C3 Technology Demonstration House—CUBE—“From Digital Model to Realization”. In Inspiring the Next Generation—Proceedings of the IASS Annual Symposium 2020/21 and the 7th International Conference on Spatial Structures, Guildford, UK, 23–27 August 2022; Behnejad, S.A., Parke, G.A.R., Samavati, O.A., Eds.; Spatial Structures Research Centre of the University of Surrey: Guildford, UK, 2021; pp. 1827–1837. [Google Scholar]
- Robert McNeel & Associates, Grasshopper 3D, Version 7.0. Available online: https://www.grasshopper3d.com/ (accessed on 12 September 2023).
- McNeel Europe SL, Rhinoceros 3D, Version 7.0. Available online: https://www.rhino3d.com/ (accessed on 12 September 2023).
- Dlubal Software GmbH, RFEM, Version 5.19. Available online: www.dlubal.com (accessed on 12 September 2023).
- RF-COM/RS-COM Add-on Module for RFEM/RSTAB. Available online: https://www.dlubal.com/en/products/rfem-and-rstab-add-on-modules/others/rf-com (accessed on 12 September 2023).
- Chudoba, R.; Sharei, E.; Senckpiel-Peters, T.; Schladitz, F. Numerical Modelling of Non-Uniformly Reinforced Carbon Concrete Lightweight Ceiling Elements. Appl. Sci. 2019, 9, 2348. [Google Scholar] [CrossRef]
- Triantafillou, T. (Ed.) Textile Fibre Composites in Civil Engineering; Woodhead Publ.: Duxford, UK, 2016; ISBN 978-1-78242-469-7. [Google Scholar] [CrossRef]
- Peled, A.; Bentur, A.; Mobasher, B. Textile Reinforced Concrete; CRC Press: London, UK, 2017; ISBN 978-1-315-11915-1. [Google Scholar] [CrossRef]
- Jesse, F. Tragverhalten von Filamentgarnen in Zementgebundener Matrix. Ph.D. Thesis, Technische Universität Dresden, Dresden, Germany, 2005. Available online: https://nbn-resolving.org/urn:nbn:de:swb:14-1122970324369-39398 (accessed on 8 March 2024).
- Nathan, G.K.; Paramasivam, P.; Lee, S.L. Tensile Behaviour of Fiber Reinforced Cement Paste. J. Ferrocem. 1977, 7, 59–79. [Google Scholar]
- Technical Data Sheet Solidian GRID Q85-CCE-21-E5 2023. 2023. Available online: https://solidian.com/downloads/ (accessed on 6 December 2022).
- Vakaliuk, I.; Scheerer, S.; Curbach, M. Vacuum-Assisted Die Casting Method for the Production of Filigree Textile-Reinforced Concrete Structures. Buildings 2023, 13, 2641. [Google Scholar] [CrossRef]
- ISO 10406-1:2015-01; Fibre-Reinforced Polymer (FRP) Reinforcement of Concrete—Test Methods—Part 1: FRP Bars and Grids. ISO: Geneva, Switzerland, 2015.
- Bochmann, J. Carbonbeton Unter Einaxialer Druckbeanspruchung. Ph.D. Thesis, Technische Universität Dresden, Dresden, Germany, 2019. Available online: https://nbn-resolving.org/urn:nbn:de:bsz:14-qucosa2-350755 (accessed on 8 March 2024).
- Betz, P.F. Carbonbeton unter Druck: Einfluss von Querdruck und Querzug. In Proceedings of the Beiträge zum 61. Forschungskolloquium mit 9. Jahrestagung des DAfStb, Dresden, Germany, 26–27 September 2022; Curbach, M., Marx, S., Mechtcherine, V., Eds.; Technische Universität Dresden: Dresden, Germany, 2022; pp. 169–174. [Google Scholar] [CrossRef]
- Sharei, E.; Chudoba, R.; Scholzen, A. Cross-Sectional Failure Criterion Combined with Strain-Hardening Damage Model for Simulation of Thin-Walled Textile-Reinforced Concrete Shells. In Proceedings of the VII European Congress on Computational Methods in Applied Sciences and Engineering (ECCOMAS 2016), Crete Island, Greece, 5–10 June 2016; Papadrakakis, M., Papadopoulos, V., Stefanou, G., Plevris, V., Eds.; Institute of Structural Analysis and Antiseismic Research School of Civil Engineering National Technical University Athens: Crete Island, Greece, 2016; pp. 6823–6831. [Google Scholar]
- Jesse, D. Tragverhalten von Textilbewehrtem Beton unter Zweiaxialer Zugbeanspruchung. Ph.D. Thesis, Technische Universität Dresden, Dresden, Germany, 2011. Available online: https://nbn-resolving.org/urn:nbn:de:bsz:14-qucosa-69387 (accessed on 8 March 2024).
- Jesse, D.; Jesse, F. Tragverhalten von Textilbeton unter zweiaxialer Zugbeanspruchung. In Textilbeton—Theorie und Praxis, Proceedings of the 4. Kolloquium zu Textilbewehrten Tragwerken (CTRS4) und zur 1 Anwendertagung, Dresden, Germany, 3–5 June 2009; Curbach, M., Jesse, F., Eds.; Dresden University of Technology: Dresden, Germany, 2009; pp. 129–144. Available online: https://nbn-resolving.org/urn:nbn:de:bsz:14-ds-1244044565376-12043 (accessed on 8 March 2024).
- Hegger, J.; Voss, S. Textile Reinforced Concrete under Biaxial Loading. In Proceedings of the 6th International RILEM Symposium on Fibre Reinforced Concretes (BEFIB), Varenna, Italy, 20–22 September 2004; di Prisco, M., Felicetti, R., Plizzari, G.A., Eds.; RILEM Publications SARL: Paris, France, 2004; pp. 1463–1472. [Google Scholar]
- Scholzen, A.; Chudoba, R.; Hegger, J. Thin-Walled Shell Structures Made of Textile-Reinforced Concrete. Struct. Concr. 2015, 16, 115–124. [Google Scholar] [CrossRef]
- Hawkins, W.; Orr, J.; Ibell, T.; Shepherd, P. An Analytical Failure Envelope for the Design of Textile Reinforced Concrete Shells. Structures 2018, 15, 56–65. [Google Scholar] [CrossRef]
- Zilch, K.; Zehetmaier, G. Bemessung im Konstruktiven Betonbau: Nach DIN 1045-1 und EN 1992-1-1, 2nd ed.; Springer: Berlin/Heidelberg, Germany, 2010; ISBN 978-3-540-70637-3. [Google Scholar]
- EN 1992-1-1; Eurocode 2: Design of Concrete Structures—Part 1-1: General Rules and Rules for Buildings. European Union: Belgium, Brussels, 2004. Available online: https://www.phd.eng.br/wp-content/uploads/2015/12/en.1992.1.1.2004.pdf (accessed on 8 March 2024).
- Giese, J.; Spartali, H.; Beckmann, B.; Schladitz, F.; Chudoba, R. Experimental Investigation on the Buckling Behavior of Slender TRC Structures. In Building for the Future: Durable, Sustainable, Resilient, Proceedings of the Fib Symposium 2023, Istanbul, Turkey, 5–7 June 2023; Lecture Notes in Civil Engineering 350; Ilki, A., Çavunt, D., Çavunt, Y.S., Eds.; Springer: Berlin/Heidelberg, Germany, 2023; pp. 398–1407. [Google Scholar]
- Schmidt, A. Formoptimierung von Druckgliedern aus Beton und Stahlbeton. Ph.D. Thesis, Technische Universität Dresden, Dresden, Germany, 2022. Available online: https://nbn-resolving.org/urn:nbn:de:bsz:14-qucosa2-821861 (accessed on 8 March 2024).
- Sadeghian, P.; Fam, A. Strengthening Slender Reinforced Concrete Columns Using High-Modulus Bonded Longitudinal Reinforcement for Buckling Control. J. Struct. Eng. 2015, 141, 04014127. [Google Scholar] [CrossRef]
- Marcillo Delgado, E. Influence of the Permanent Formwork Elements on the Structural Performance of the Cellular TRC Structures. Master’s Thesis, Technische Universität Dresden, Dresden, Germany, 2023. [Google Scholar]
- Mainka, J. Non-Waste-Wachsschalungen. Ph.D. Thesis, Technische Universität Braunschweig, Braunschweig, Germany, 2019. Available online: https://nbn-resolving.org/urn:nbn:de:gbv:084-2019061111598 (accessed on 8 March 2024).
- Mainka, J.; Wirth, F.; Kloft, H. Industrializing the Non-Waste-Wax-Formwork Technology. In Proceedings of the 1st International Conference on Concrete and Digital Fabrication—Digital Concrete (ICCDF), Zürich, Switzerland, 10–12 September 2018; Wangler, T., Flatt, R.J., Eds.; Springer International Publishing: Berlin/Heidelberg, Germany, 2018; pp. 153–154. [Google Scholar]
- Hawkins, W.; Orr, J.; Ibell, T.; Shepherd, P. A Design Methodology to Reduce the Embodied Carbon of Concrete Buildings Using Thin-Shell Floors. Eng. Struct. 2020, 207, 110–195. [Google Scholar] [CrossRef]
- Gauch, H.L.; Hawkins, W.; Ibell, T.; Allwood, J.M.; Dunant, C.F. Carbon vs. Cost Option Mapping: A Tool for Improving Early-Stage Design Decisions. Autom. Constr. 2022, 136, 104–178. [Google Scholar] [CrossRef]
- Brown, N.C.; Mueller, C.T. Design for Structural and Energy Performance of Long Span Buildings Using Geometric Multi-Objective Optimization. Energy Build. 2016, 127, 748–761. [Google Scholar] [CrossRef]


Disclaimer/Publisher’s Note: The statements, opinions and data contained in all publications are solely those of the individual author(s) and contributor(s) and not of MDPI and/or the editor(s). MDPI and/or the editor(s) disclaim responsibility for any injury to people or property resulting from any ideas, methods, instructions or products referred to in the content. |
© 2024 by the authors. Licensee MDPI, Basel, Switzerland. This article is an open access article distributed under the terms and conditions of the Creative Commons Attribution (CC BY) license (https://creativecommons.org/licenses/by/4.0/).