
Towards a Unified Framework for Project Success Score Computation in Construction Projects


Abstract
:1. Introduction
2. Rapid Impact Assessment Matrix and Its Applications
3. Methodological Framework of the Project Success Score
3.1. Identification of the Basic Principles of the Proposed Model of Project Success
- (1)
- Primary Success Criteria (PSC). Criteria with primary significance and roles, which can individually affect and change the overall project success score, including
- (2)
- Secondary Success Criteria (SSC): Criteria with secondary significance and role that should not individually be capable of changing the overall project success score
3.2. Project Success Criteria and Assessment Classes
3.3. Calculation of the Project Success Score (PSS)
3.4. Conversion of PSS to Range Bands
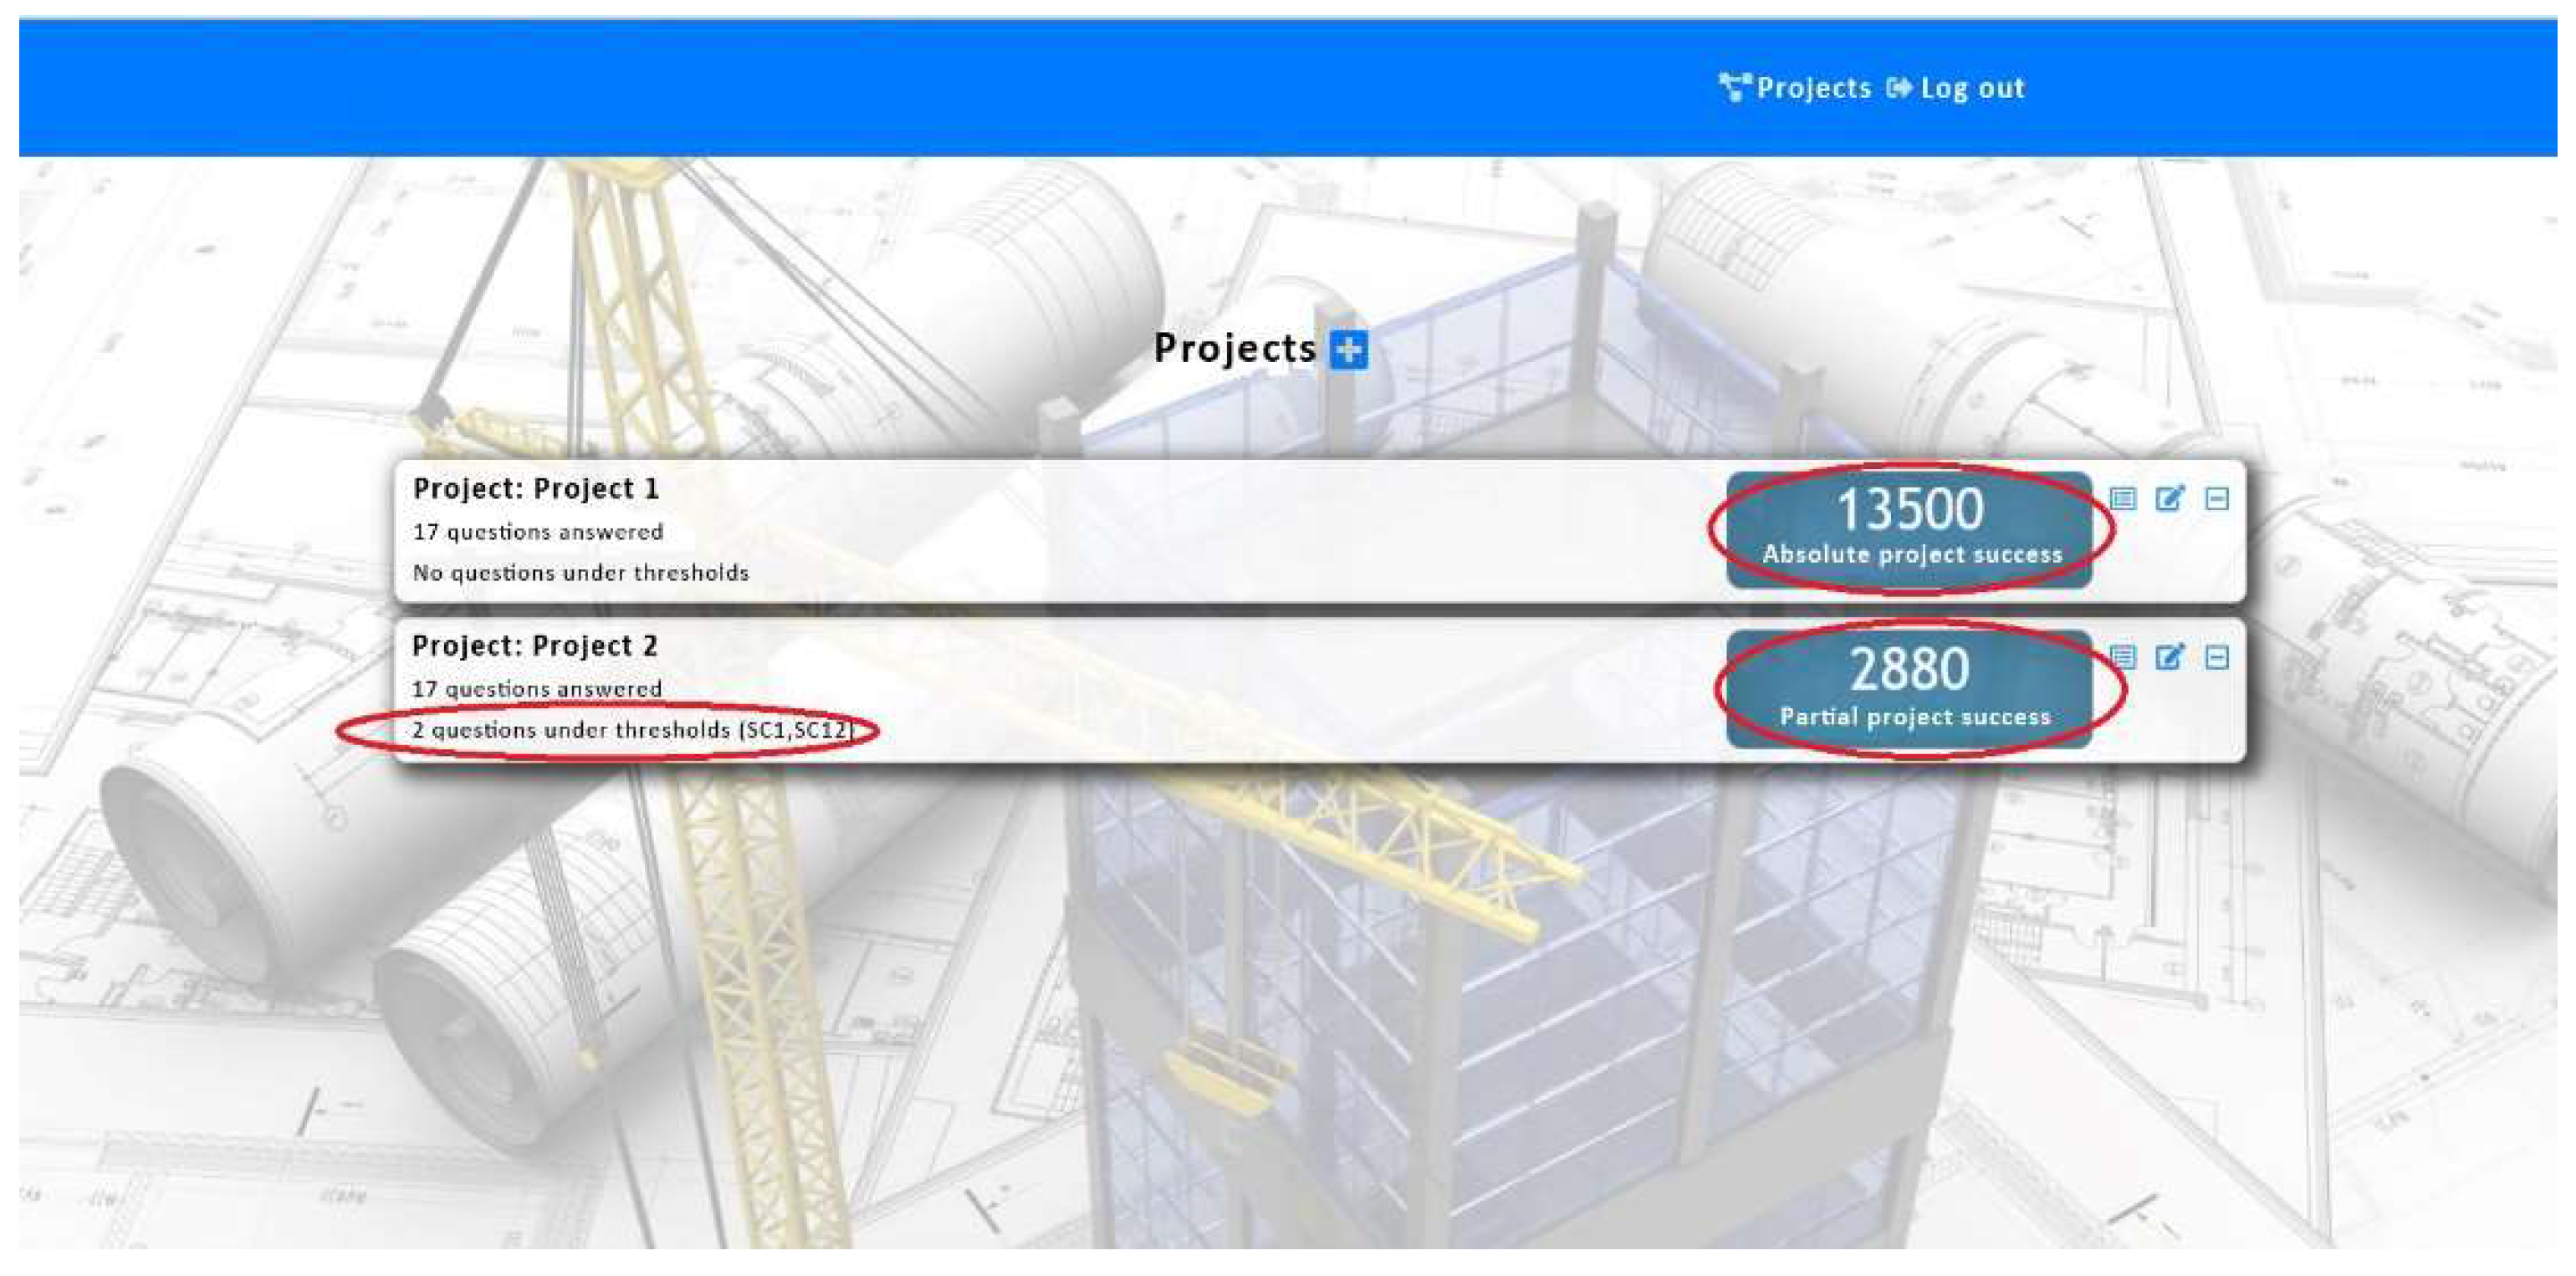
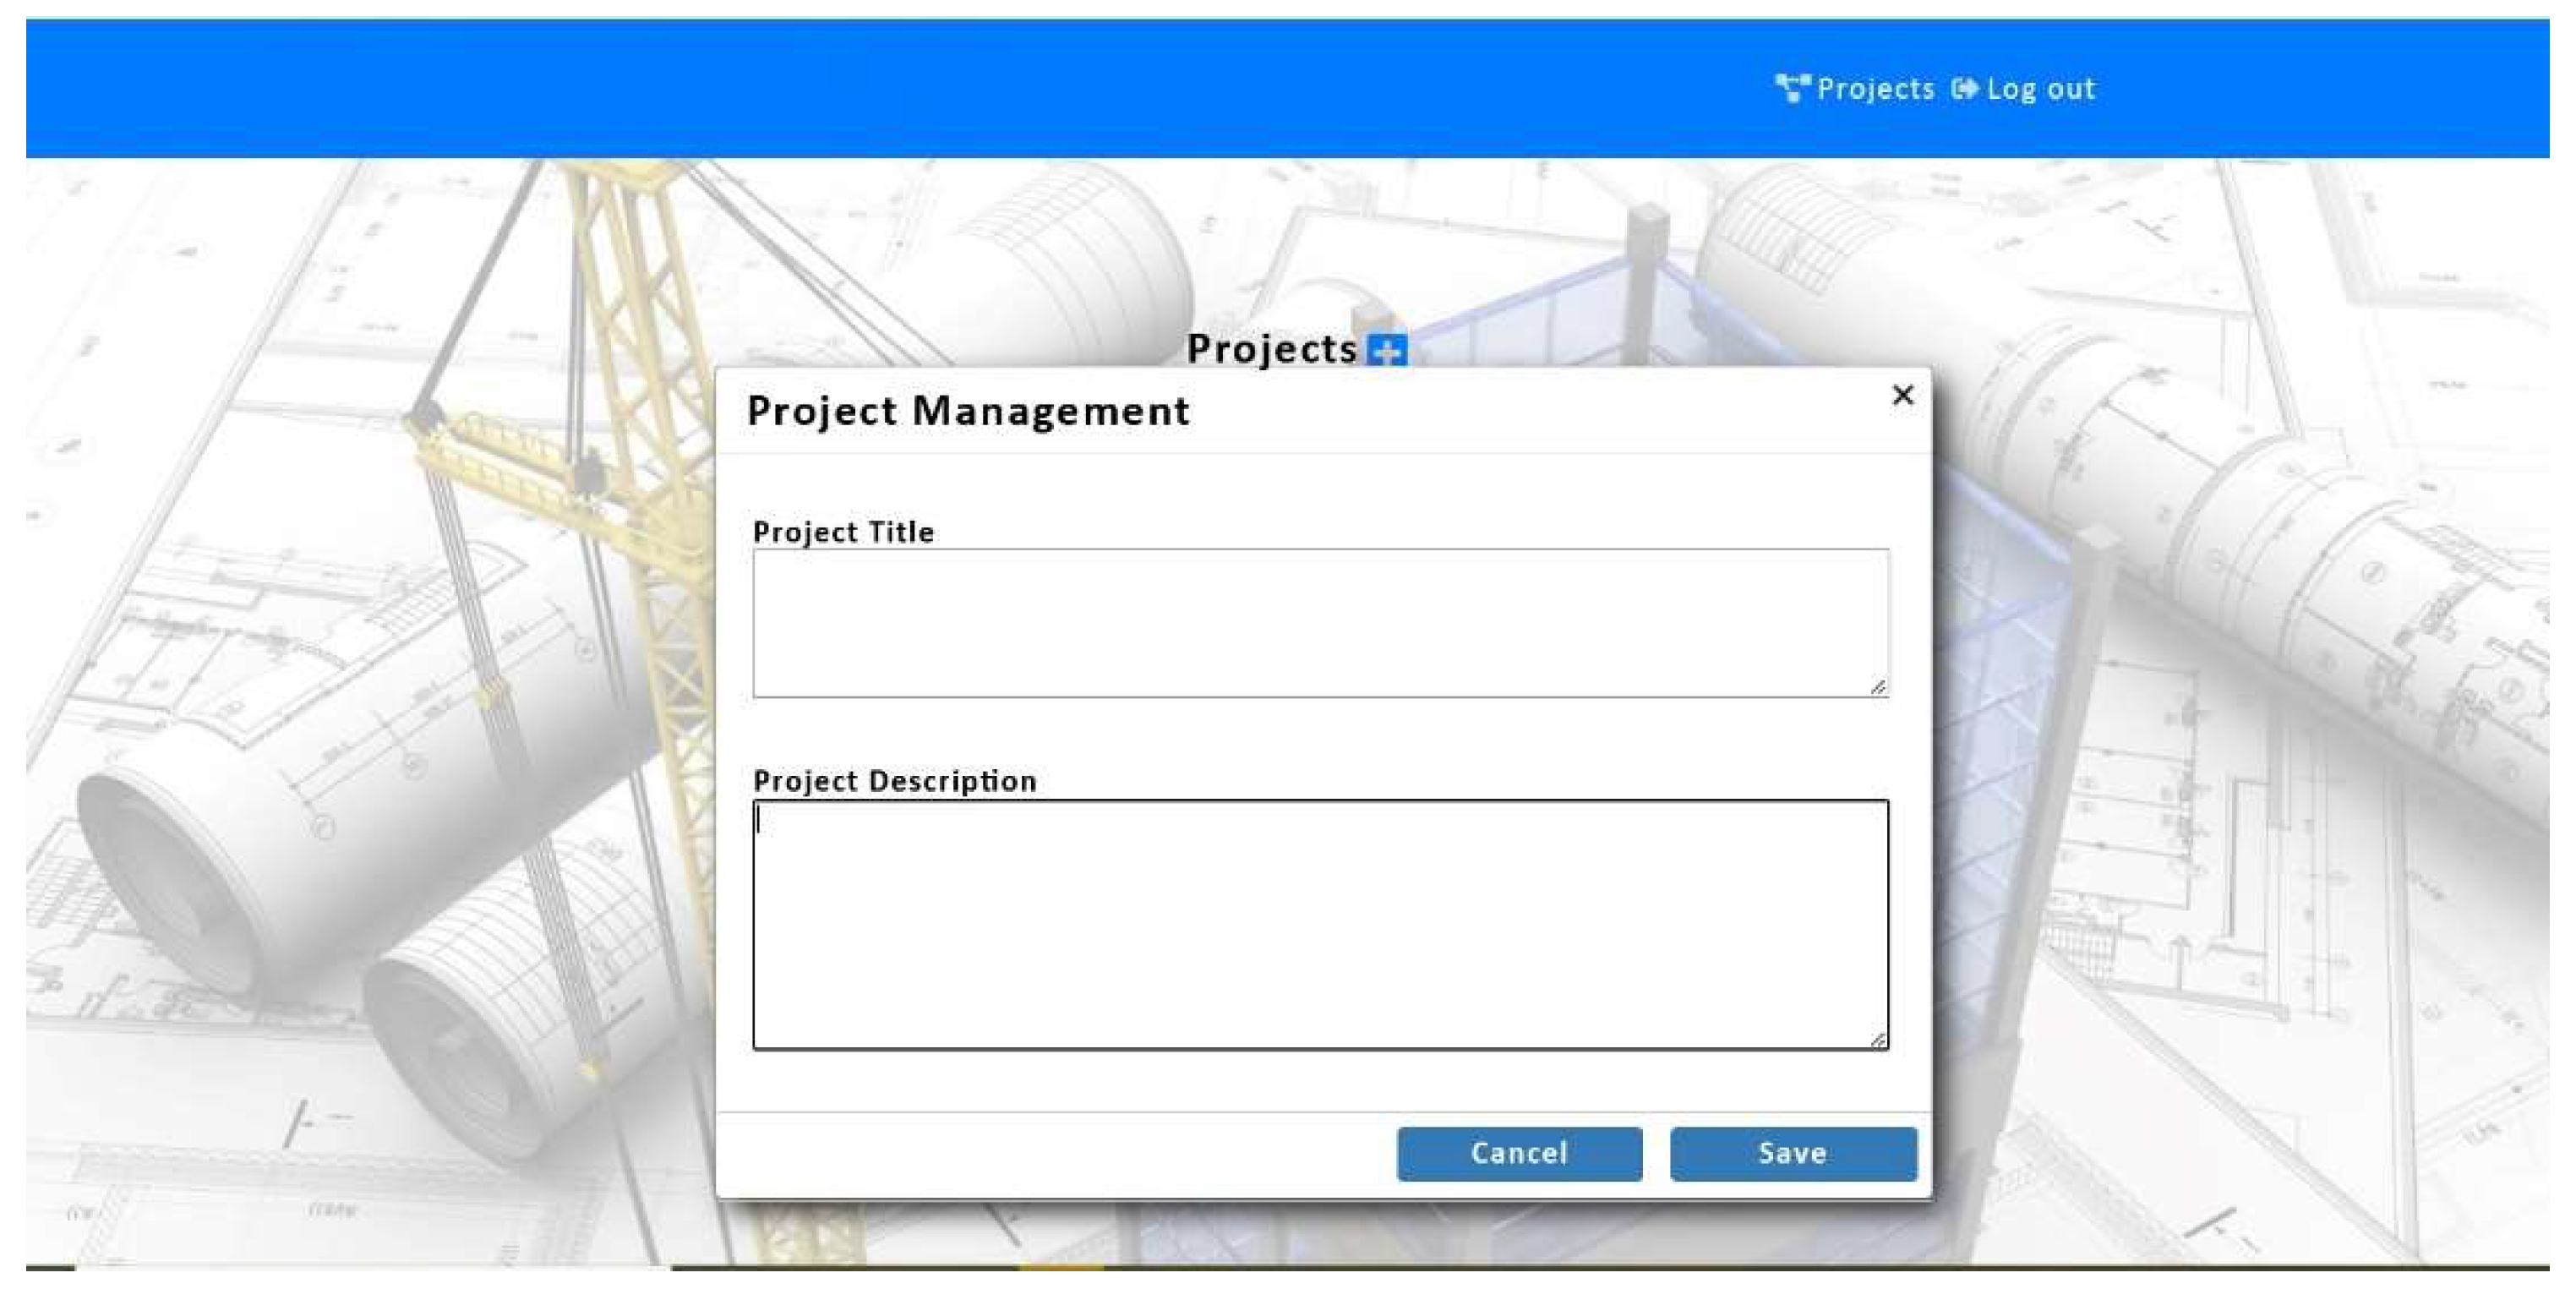
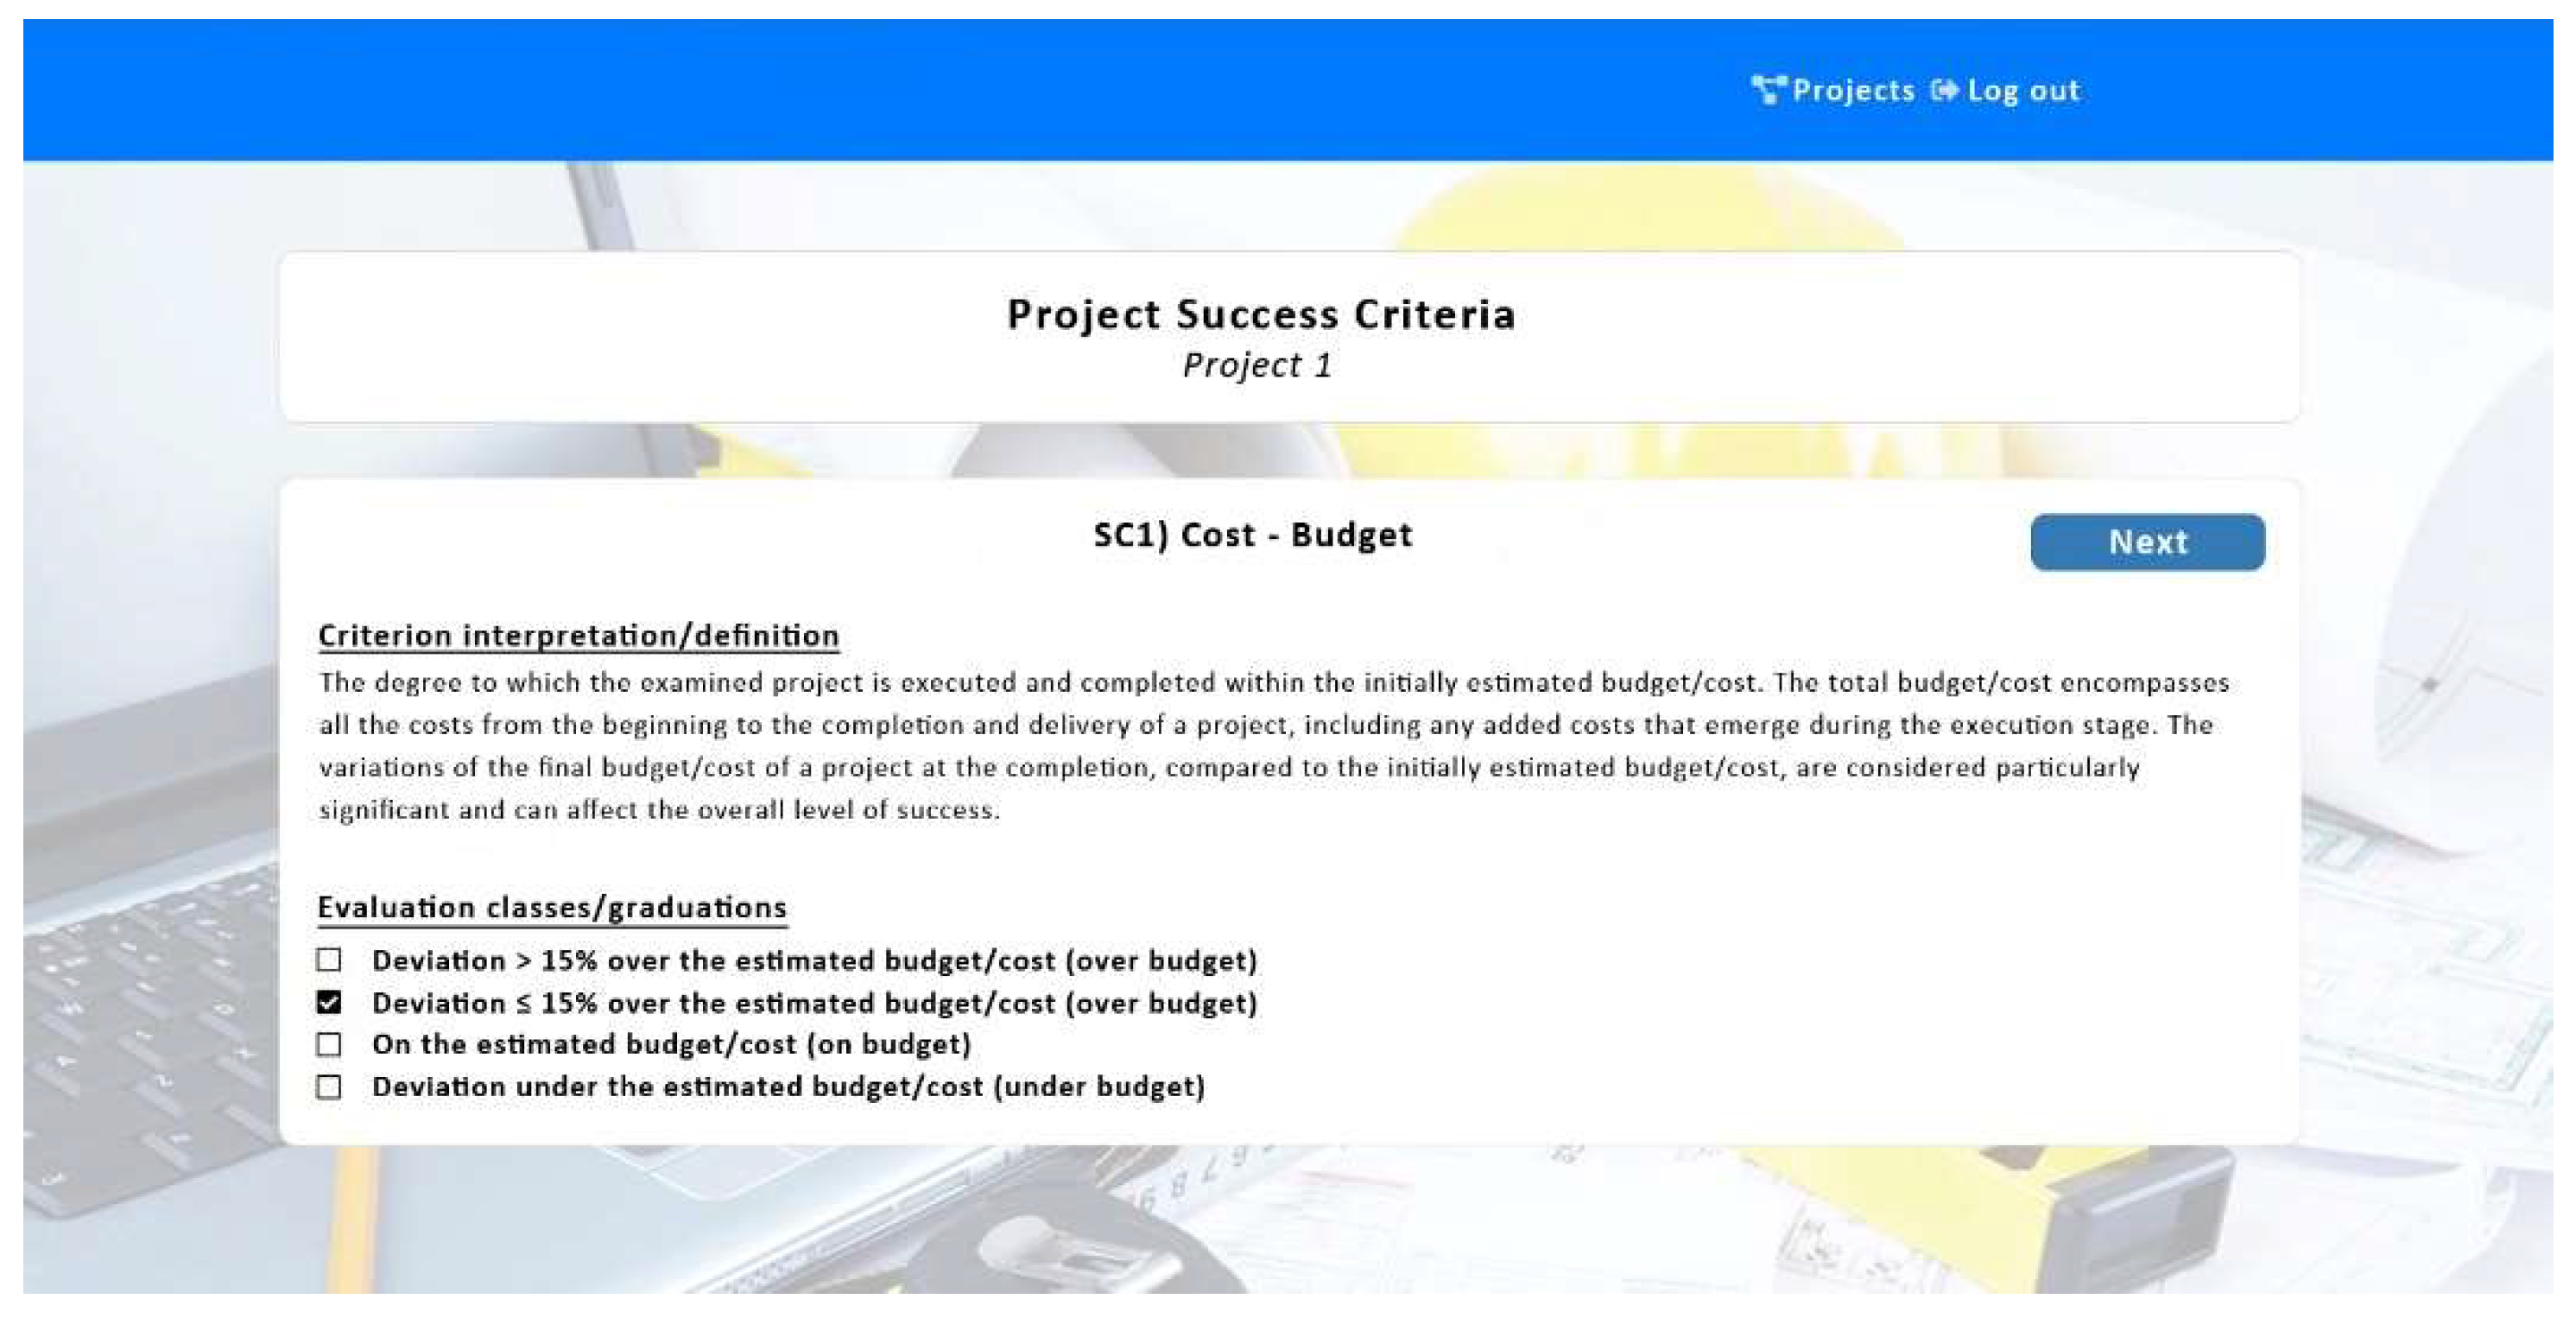
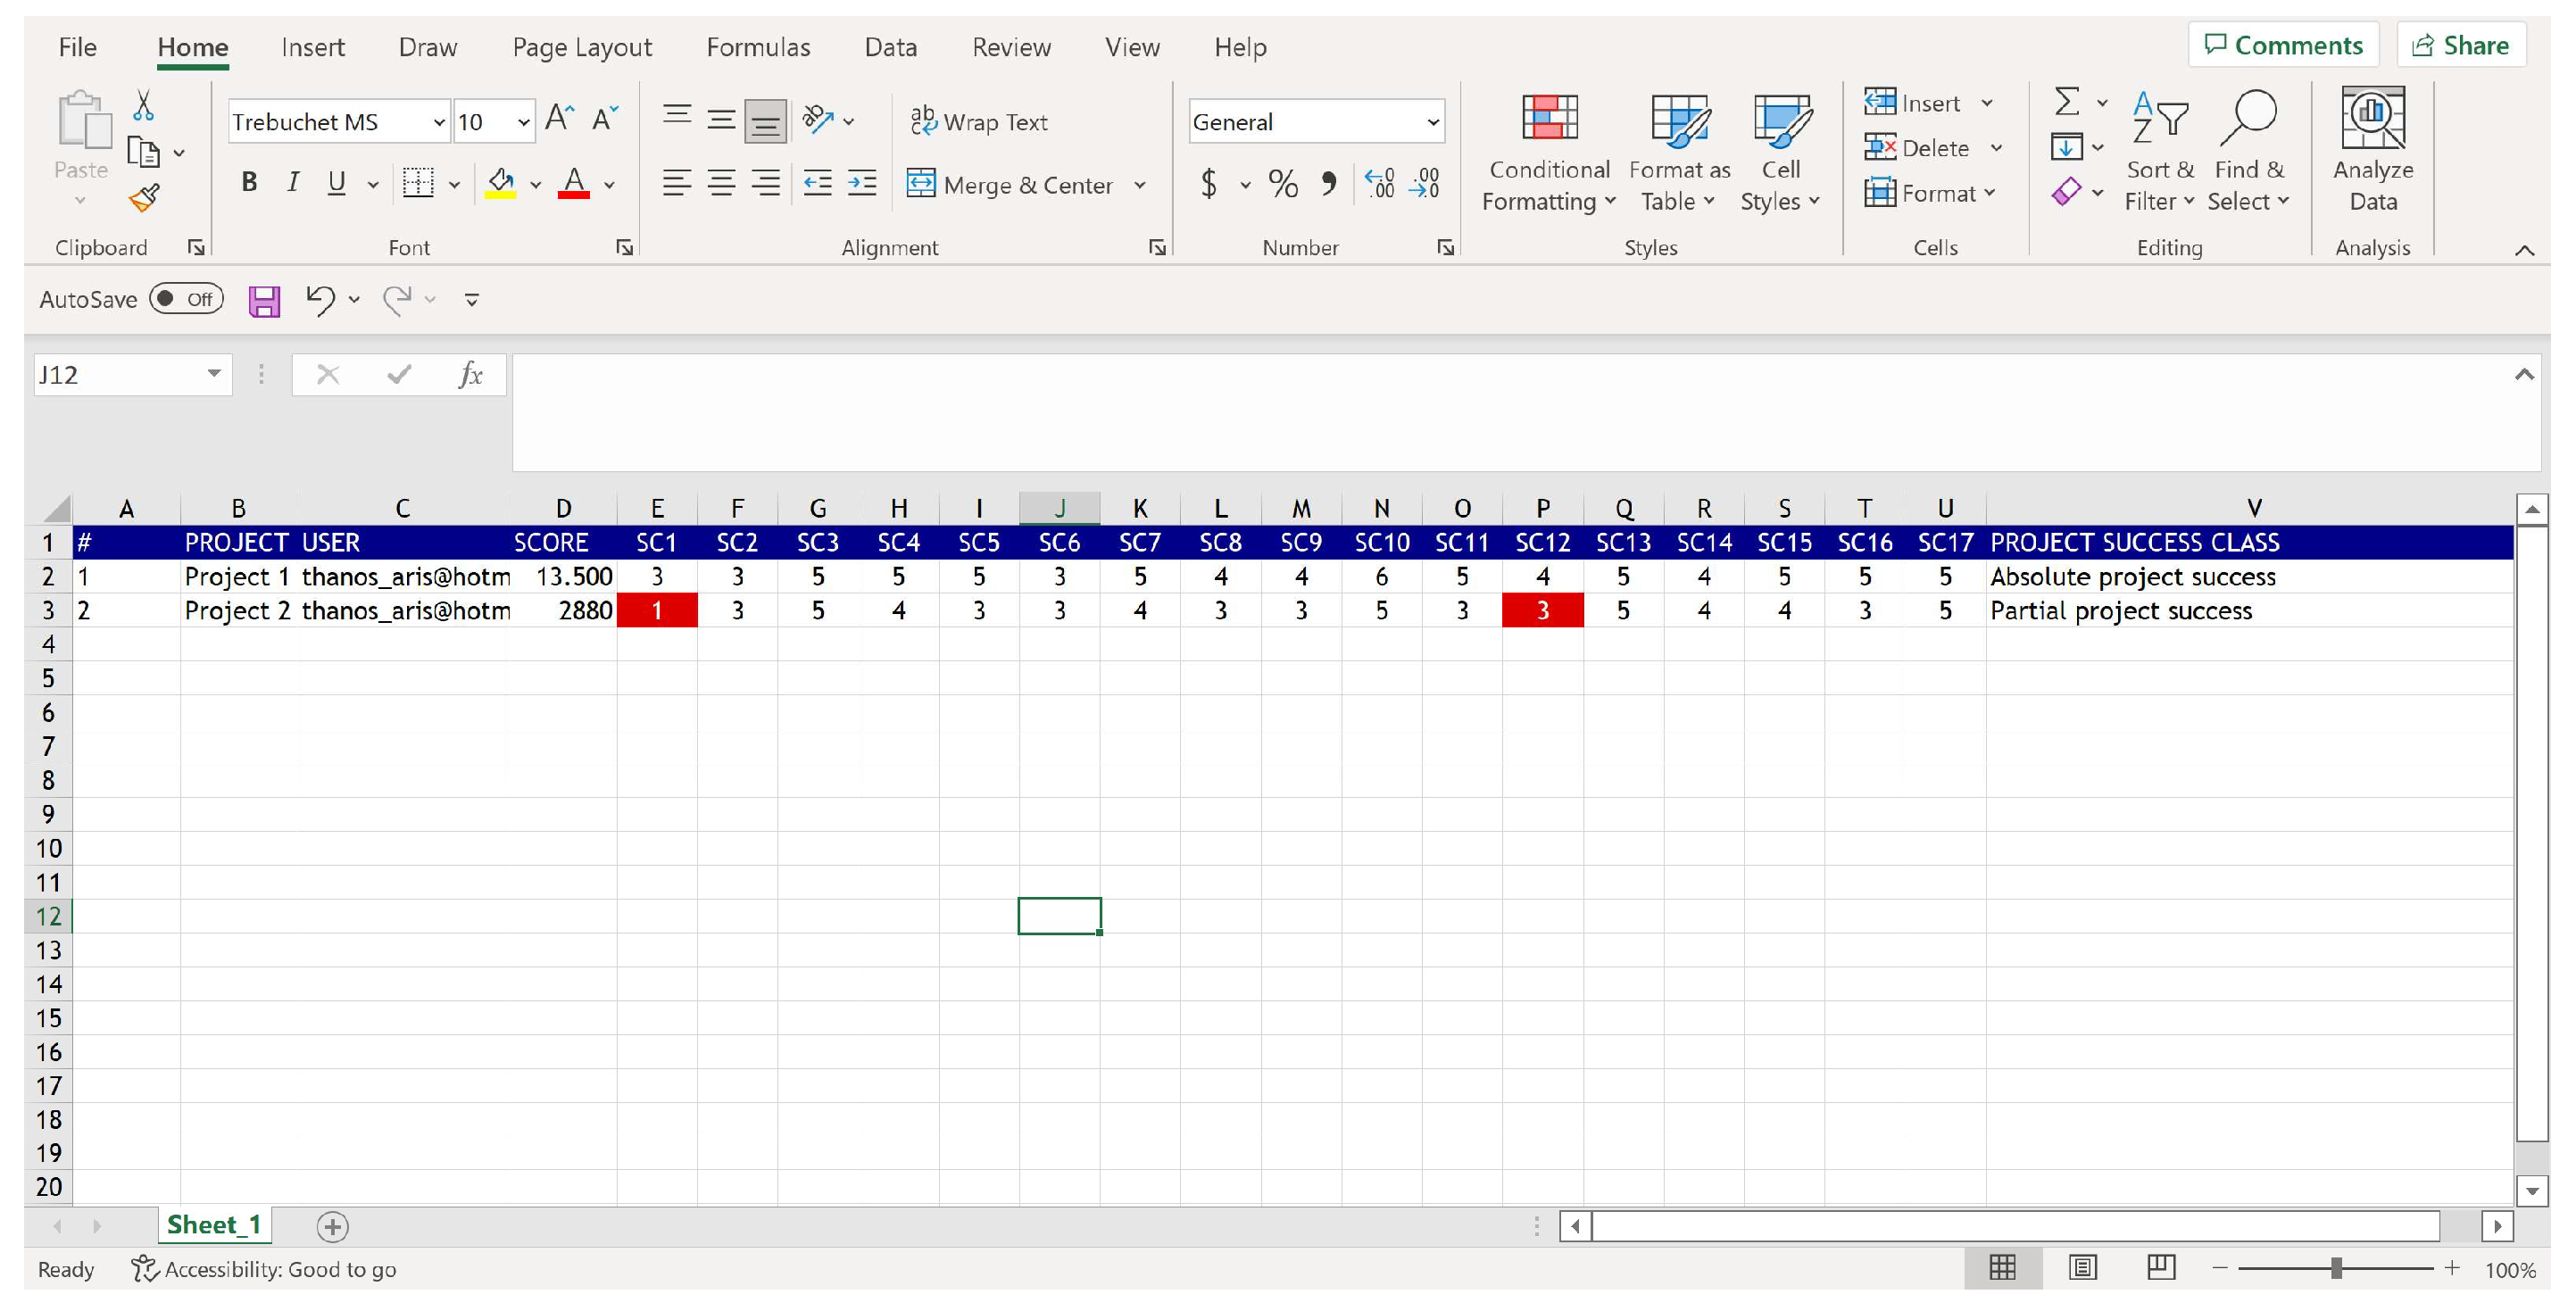
4. Project Success Score Web Application
5. Conclusions
Author Contributions
Funding
Institutional Review Board Statement
Informed Consent Statement
Data Availability Statement
Conflicts of Interest
References
- Bannerman, P.L. Defining project success: A multilevel framework. In Proceedings of the Project Management Institute Research Conference: Defining the Future of Project Management, Warsaw, Poland, 16 July 2008. [Google Scholar]
- De Wit, A. Measurement of project success. Int. J. Proj. Manag. 1988, 6, 164–170. [Google Scholar] [CrossRef]
- Muller, R.; Turner, R. The Influence of Project Managers on Project Success Criteria and Project Success by Type of Project. Eur. Manag. J. 2007, 25, 298–309. [Google Scholar] [CrossRef]
- Cox, R.F.; Issa, R.R.; Ahrens, D. Management’s Perception of Key Performance Indicators. J. Constr. Eng. Manag. 2003, 129, 142–151. [Google Scholar] [CrossRef]
- Chitkara, K.K. Construction Project Management; Planning, Scheduling and Controlling, 3rd ed.; McGraw Hill Education Private Limited: Noida, India, 2013. [Google Scholar]
- Ika, L.A. Project success as a topic in project management journals. Proj. Manag. J. 2009, 40, 6–19. [Google Scholar] [CrossRef]
- Wai, S.H.; Yusof, A.M.; Ismail, S. Exploring success criteria from the developers’ perspective in Malaysia. Int. J. Eng. Bus. Manag. 2012, 4, 33. [Google Scholar] [CrossRef] [Green Version]
- Mukhtar, M.M.; Amirudin, R. The Success Criteria of Public Housing Project in Nigeria. Int. J. Built Environ. Sustain. 2016, 3, 102–110. [Google Scholar] [CrossRef] [Green Version]
- Al-Tmeemy, S.M.H.M.; Abdul-Rahman, H.; Harun, Z. Future criteria for success of building projects in Malaysia. Int. J. Proj. Manag. 2011, 29, 337–348. [Google Scholar] [CrossRef]
- Chovichien, V.; Nguyen, T.A. List of indicators and criteria for evaluating construction project success and their weight assignment. In Proceedings of the 4th International Conference on Engineering, Project, and Production Management (EPPM 2013), Bangkok, Thailand, 23–25 October 2013. [Google Scholar]
- Khan, K.; Turner, J.R.; Maqsood, T. Factors that influence the success of public sector projects in Pakistan. In Proceedings of the 11th International Research Network on Organizing by Projects (IRNOP 2013) Conference, Oslo, Norway, 17–19 June 2013. [Google Scholar]
- Silva, G.A.S.K.; Warnakulasuriya, B.N.F.; Arachchige, B.J.H. Criteria for Construction Project Success: A Literature Review. In Proceedings of the 13th International Conference on Business Management (ICBM 2016), Colombo, Sri Lanka, 8 December 2016. [Google Scholar]
- Dosumu, O.S.; Onukwube, H.N. Analysis of project success criteria in the Nigerian construction industry. Int. J. Sustain. Constr. Eng. Technol. 2013, 4, 31–47. [Google Scholar]
- Turner, J.R. The Handbook of Project Based Management: Leading Strategic Change in Organizations, 3rd ed.; McGraw-Hill: New York, NY, USA, 2009. [Google Scholar]
- Atkinson, R. Project management: Cost, time and quality, two best guesses and a phenomenon, it’s time to accept other success criteria. Int. J. Proj. Manag. 1999, 17, 337–342. [Google Scholar] [CrossRef]
- Turner, J.R.; Müller, R. Choosing Appropriate Project Managers: Matching Their Leadership Style to the Type of Project; Project Management Institute: Newtown Square, PA, USA, 2006. [Google Scholar]
- Thomas, G.; Fernández, W. Success in IT projects: A matter of definition? Int. J. Proj. Manag. 2008, 26, 733–742. [Google Scholar] [CrossRef]
- Cooke-Davies, T. Consistently Doing the Right Projects and Doing Them Right—What Metrics Do You Need. Measured 2004, 4, 44–52. [Google Scholar]
- Yao, Q.; Yi Man Li, R.; Song, L. Construction safety knowledge sharing on YouTube from 2007 to 2021: Two-step flow theory and semantic analysis. Saf. Sci. 2022, 153, 105796. [Google Scholar] [CrossRef]
- Li, R.Y.M.; Tang, B.; Chau, K.W. Sustainable Construction Safety Knowledge Sharing: A Partial Least Square-Structural Equation Modeling and A Feedforward Neural Network Approach. Sustainability 2019, 11, 5831. [Google Scholar] [CrossRef] [Green Version]
- Yao, Q.; Li, R.Y.M.; Song, L.; Crabbe, M.; James, C. Construction safety knowledge sharing on Twitter: A social network analysis. Saf. Sci. 2021, 143, 105411. [Google Scholar] [CrossRef]
- Lamprou, A.; Vagiona, D.G. Identification and Evaluation of Success Criteria and Critical Success Factors in Project Success. Glob. J. Flex. Syst. Manag. 2022, 23, 237–253. [Google Scholar] [CrossRef]
- Pastakia, C. The Rapid Impact Assessment Matrix (RIAM)—A New Tool for Environmental Impact Assessment; VKI: Horsholm, Denmark, 1998. [Google Scholar]
- Pastakia, C.M.R.; Jensen, A. The rapid impact assessment matrix (RIAM) for EIA. Environ. Impact Assess. Rev. 1998, 18, 461–482. [Google Scholar] [CrossRef]
- El-Naqa, A. Environmental impact assessment using rapid impact assessment matrix (RIAM) for Russeifa landfill, Jordan. Environ. Geol. 2005, 47, 632–639. [Google Scholar] [CrossRef]
- Kuitunen, M.; Jalava, K.; Hirvonen, K. Testing the usability of the Rapid Impact Assessment Matrix (RIAM) method for comparison of EIA and SEA results. Environ. Impact Assess. Rev. 2008, 28, 312–320. [Google Scholar] [CrossRef]
- Ijäs, A.; Kuitunen, M.T.; Jalava, K. Developing the RIAM method (rapid impact assessment matrix) in the context of impact significance assessment. Environ. Impact Assess. Rev. 2010, 30, 82–89. [Google Scholar] [CrossRef]
- Mondal, M.K.; Dasgupta, R.B.V. EIA of municipal solid waste disposal site in Varanasi using RIAM analysis, Resources. Conserv. Recycl. 2010, 54, 541–546. [Google Scholar] [CrossRef]
- Gilbuena, R.R.; Kawamura, A.; Medina, R.; Amaguchi, H.; Nakagawa, N.; Bui, D.D. Environmental impact assessment of structural flood mitigation measures by a rapid impact assessment matrix (RIAM) technique: A case study in Metro Manila, Philippines. Sci. Total Environ. 2013, 456–457, 137–147. [Google Scholar] [CrossRef] [PubMed]
- Li, W.; Xie, Y.; Hao, F. Applying an improved rapid impact assessment matrix method to strategic environmental assessment of urban planning in China. Environ. Impact Assess. Rev. 2014, 46, 13–24. [Google Scholar] [CrossRef]
- Taheri, M.; Gholamalifard, M.; Ghazizade, M.J.; Rahimoghli, S. Environmental impact assessment of municipal solid waste disposal site in Tabriz, Iran using rapid impact assessment matrix. Impact Assess. Proj. Apprais. 2014, 32, 162–169. [Google Scholar] [CrossRef] [Green Version]
- Valizadeh, S.; Hakimian, H. Evaluation of waste management options using rapid impact assessment matrix and Iranian Leopold matrix in Birjand, Iran. Int. J. Environ. Sci. Technol. 2019, 16, 3337–3354. [Google Scholar] [CrossRef]
- Shayesteh, A.; Koohshekan, O.; Khadivpour, F.; Kian, M.; Ghasemzadeh, R.; Pazoki, M. Industrial waste management using the rapid impact assessment matrix method for an industrial park. Glob. J. Environ. Sci. Manag. 2020, 6, 261–274. [Google Scholar]


| Criteria | Scale | Description |
|---|---|---|
| SC1 | 3 | On the estimated budget/cost (on budget) |
| 3 | Deviation under the estimated budget/cost (under budget) | |
| 2 | Deviation ≤ 15% over the estimated budget/cost (over budget) | |
| 1 | Deviation > 15% over the estimated budget/cost (over budget) | |
| SC2 | 3 | On the estimated schedule/time (on schedule) |
| 3 | Deviation ≤ 5% under the estimated schedule/time (under schedule) | |
| 3 | Deviation > 5% under the estimated schedule/time (under schedule) | |
| 2 | Deviation ≤ 30% over the estimated schedule/time (over schedule) | |
| 1 | Deviation > 30% over the estimated schedule/time (over schedule) | |
| SC3 | 5 | Complete satisfaction of the client/user/end-user (client/user/end-user satisfaction percentage ≥ 80%) |
| 4 | Significant satisfaction of the client/user/end-user (client/user/end-user satisfaction percentage 60–80%) | |
| 3 | Partial satisfaction of the client/user/end-user (client/user/end-user satisfaction percentage 40–60%) | |
| 2 | Minimum satisfaction of the client/user/end-user (client/user/end-user satisfaction percentage 20–40%) | |
| 1 | Non-satisfaction of the client/user/end-user (client/user/end-user satisfaction percentage ≤ 20%) | |
| SC4 | 5 | Very high quality/technical performance |
| 4 | High quality/technical performance | |
| 3 | Moderate quality/technical performance | |
| 2 | Low quality/technical performance | |
| 1 | Very low quality/technical performance | |
| SC5 | 5 | Very high effectiveness (achievement ≥ 80% of goals/objectives + production ≥ 80% of expected results) |
| 4 | High effectiveness (achievement 60–80% of goals/objectives + production 60–80% of expected results) | |
| 3 | Moderate effectiveness (achievement 40–60% of goals/objectives + production 40–60% of expected results) | |
| 2 | Low effectiveness (achievement 20–40% of goals/objectives + production 20–40% of expected results) | |
| 1 | Very low effectiveness (achievement ≤ 20% of goals/objectives + production ≤ 20% of expected results) | |
| SC6 | 3 | Complete satisfaction of the technical specifications and requirements |
| 2 | Partial satisfaction of the technical specifications and requirements | |
| 1 | Non-satisfaction of the technical specifications and requirements | |
| SC7 | 5 | Very high functionality |
| 4 | High functionality | |
| 3 | Moderate functionality | |
| 2 | Low functionality | |
| 1 | Very low functionality | |
| SC8 | 4 | Maximum health and safety level (full compliance with health and safety measures/rules + zero accidents/injuries) |
| 3 | High health and safety level (significant compliance with health and safety measures/rules + minimum accidents/injuries) | |
| 2 | Moderate health and safety (level partial compliance with health and safety measures/rules + few accidents/injuries) | |
| 1 | Low health and safety level (incomplete compliance with health and safety measures/rules + several accidents/injuries) | |
| SC9 | 4 | Sufficient sustainability/durability + creation of new capabilities/opportunities + development of new technologies and innovations + activation of the development of future projects/works |
| 3 | Sufficient sustainability/durability + creation of new capabilities/opportunities + activation of the development of future projects/works | |
| 2 | Sufficient sustainability/durability + creation of new capabilities/opportunities | |
| 2 | Sufficient sustainability/durability + development of new technologies and innovations | |
| 2 | Sufficient sustainability/durability + activation of the development of future projects/works | |
| 1 | Lack of future perspective | |
| SC10 | 6 | High business performance + high commercial performance |
| 5 | High business performance + moderate commercial performance | |
| 5 | Moderate business performance + high commercial performance | |
| 4 | High business performance + low commercial performance | |
| 4 | Low business performance + high commercial performance | |
| 3 | Moderate business performance + moderate commercial performance | |
| 2 | Moderate business performance + low commercial performance | |
| 2 | Low business performance + moderate commercial performance | |
| 1 | Low business performance + low commercial performance | |
| SC11 | 5 | Easiness of acceptance and use/utilization + direct project impact |
| 4 | Easiness of acceptance and use/utilization + indirect project impact | |
| 3 | Difficulty of acceptance and use/utilization + direct project impact | |
| 2 | Difficulty of acceptance and use/utilization + indirect project impact | |
| 1 | Non acceptance and use/utilization + No project impact | |
| SC12 | 4 | Disturbing/non-disturbing activities + full compliance with Environmental Assessment Approval |
| 3 | Non-disturbing activities + partial compliance with Environmental Assessment Approval | |
| 3 | Disturbing activities + partial compliance with Environmental Assessment Approval | |
| 2 | Non-disturbing activities + low compliance with Environmental Assessment Approval | |
| 2 | Disturbing activities + low compliance with Environmental Assessment Approval | |
| 1 | Non-disturbing activities + non-compliance with Environmental Assessment Approval | |
| 1 | Disturbing activities + non-compliance with Environmental Assessment Approval | |
| SC13 | 5 | Complete satisfaction of other stakeholders (other stakeholder satisfaction percentage ≥ 80%) |
| 4 | Significant satisfaction of other stakeholders (other stakeholder satisfaction percentage 60–80%) | |
| 3 | Partial satisfaction of other stakeholders (other stakeholder satisfaction percentage 40–60%) | |
| 2 | Minimum satisfaction of other stakeholders (other stakeholder satisfaction percentage 20–40%) | |
| 1 | Non-satisfaction of other stakeholders (other stakeholder satisfaction percentage ≤ 20%) | |
| SC14 | 4 | Complete achievement of strategic goals/objectives + high competitiveness |
| 3 | Complete achievement of strategic goals/objectives + moderate competitiveness | |
| 3 | Partial achievement of strategic goals/objectives + high competitiveness | |
| 2 | Complete achievement of strategic goals/objectives + low competitiveness | |
| 2 | Partial achievement of strategic goals/objectives + moderate competitiveness | |
| 2 | Non achievement of strategic goals/objectives + high competitiveness | |
| 1 | Partial achievement of strategic goals/objectives + low competitiveness | |
| 1 | Non achievement of strategic goals/objectives + moderate competitiveness | |
| 1 | Non achievement of strategic goals/objectives + low competitiveness | |
| SC15 | 5 | Complete contractor satisfaction (satisfaction percentage ≥ 80%) |
| 4 | Significant contractor satisfaction (satisfaction percentage 60–80%) | |
| 3 | Partial contractor satisfaction (satisfaction percentage 40–60%) | |
| 2 | Minimum contractor satisfaction (satisfaction percentage 20–40%) | |
| 1 | Nonsatisfaction of the contractor (satisfaction percentage ≤ 20%) | |
| SC16 | 5 | Complete project team/personnel satisfaction (satisfaction percentage of project team members/personnel ≥ 80%) |
| 4 | Significant project team/personnel satisfaction (satisfaction percentage of project team members/personnel 60–80%) | |
| 3 | Partial project team/personnel satisfaction (satisfaction percentage of project team members/personnel 40–60%) | |
| 2 | Minimum project team/personnel satisfaction (satisfaction percentage of project team members/personnel 20–40%) | |
| 1 | Non project team/personnel satisfaction (satisfaction percentage of project team members/personnel ≤ 20%) | |
| SC17 | 5 | Complete supplier satisfaction (supplier satisfaction percentage ≥ 80%) |
| 4 | Significant supplier satisfaction (supplier satisfaction percentage 60–80%) | |
| 3 | Partial supplier satisfaction (supplier satisfaction percentage 40–60%) | |
| 2 | Minimum supplier satisfaction (supplier satisfaction percentage 20–40%) | |
| 1 | Nonsatisfaction of the suppliers (supplier satisfaction percentage ≤ 20%) |
| Success Criteria (SC) | Min | Max | Threshold | Project Success Score (PSS) | |||||
|---|---|---|---|---|---|---|---|---|---|
| 12 | 384 | 1188 | 2925 | 9360 | 13,500 | ||||
| SC1 | 1 | 3 | ≤2 | 1 | 2 | 2 | 3 | 3 | 3 |
| SC2 | 1 | 3 | ≤2 | 1 | 2 | 2 | 3 | 3 | 3 |
| SC3 | 1 | 5 | ≤2 | 1 | 2 | 3 | 5 | 4 | 5 |
| SC4 | 1 | 5 | ≤2 | 1 | 2 | 3 | 5 | 5 | 5 |
| SC5 | 1 | 5 | ≤2 | 1 | 2 | 3 | 1 | 5 | 5 |
| SC6 | 1 | 3 | ≤1 | 1 | 1 | 2 | 1 | 3 | 3 |
| SC7 | 1 | 5 | ≤2 | 1 | 2 | 3 | 1 | 5 | 5 |
| SC8 | 1 | 4 | ≤1 | 1 | 1 | 2 | 1 | 4 | 4 |
| SC9 | 1 | 4 | ≤1 | 1 | 1 | 1 | 1 | 2 | 4 |
| SC10 | 1 | 6 | ≤2 | 1 | 2 | 2 | 1 | 4 | 6 |
| SC11 | 1 | 5 | ≤2 | 1 | 2 | 3 | 1 | 5 | 5 |
| SC12 | 1 | 4 | ≤3 | 1 | 3 | 3 | 1 | 4 | 4 |
| SC13 | 1 | 5 | ≤2 | 1 | 2 | 3 | 1 | 4 | 5 |
| SC14 | 1 | 4 | ≤2 | 1 | 2 | 2 | 1 | 4 | 4 |
| SC15 | 1 | 5 | ≤2 | 1 | 2 | 3 | 1 | 4 | 5 |
| SC16 | 1 | 5 | ≤2 | 1 | 2 | 3 | 1 | 4 | 5 |
| SC17 | 1 | 5 | ≤2 | 1 | 2 | 3 | 1 | 4 | 5 |
| PSS | Description of Success Range |
|---|---|
| 13–384 | Absolute Project Failure |
| 385–1188 | Project Failure |
| 1189–2925 | Partial Project Success |
| 2926–9360 | Project Success |
| 9361–13,500 | Absolute Project Success |
Publisher’s Note: MDPI stays neutral with regard to jurisdictional claims in published maps and institutional affiliations. |
© 2022 by the authors. Licensee MDPI, Basel, Switzerland. This article is an open access article distributed under the terms and conditions of the Creative Commons Attribution (CC BY) license (https://creativecommons.org/licenses/by/4.0/).
Share and Cite
Lamprou, A.; Vagiona, D.G. Towards a Unified Framework for Project Success Score Computation in Construction Projects. CivilEng 2022, 3, 779-793. https://doi.org/10.3390/civileng3030045
Lamprou A, Vagiona DG. Towards a Unified Framework for Project Success Score Computation in Construction Projects. CivilEng. 2022; 3(3):779-793. https://doi.org/10.3390/civileng3030045
Chicago/Turabian StyleLamprou, Athanasios, and Dimitra G. Vagiona. 2022. "Towards a Unified Framework for Project Success Score Computation in Construction Projects" CivilEng 3, no. 3: 779-793. https://doi.org/10.3390/civileng3030045
APA StyleLamprou, A., & Vagiona, D. G. (2022). Towards a Unified Framework for Project Success Score Computation in Construction Projects. CivilEng, 3(3), 779-793. https://doi.org/10.3390/civileng3030045