
Wind Forces on Medium-Span Bridges: A Comparison of Eurocode 1 Part 4 and Computational Fluid Dynamics


Abstract
:
1. Introduction
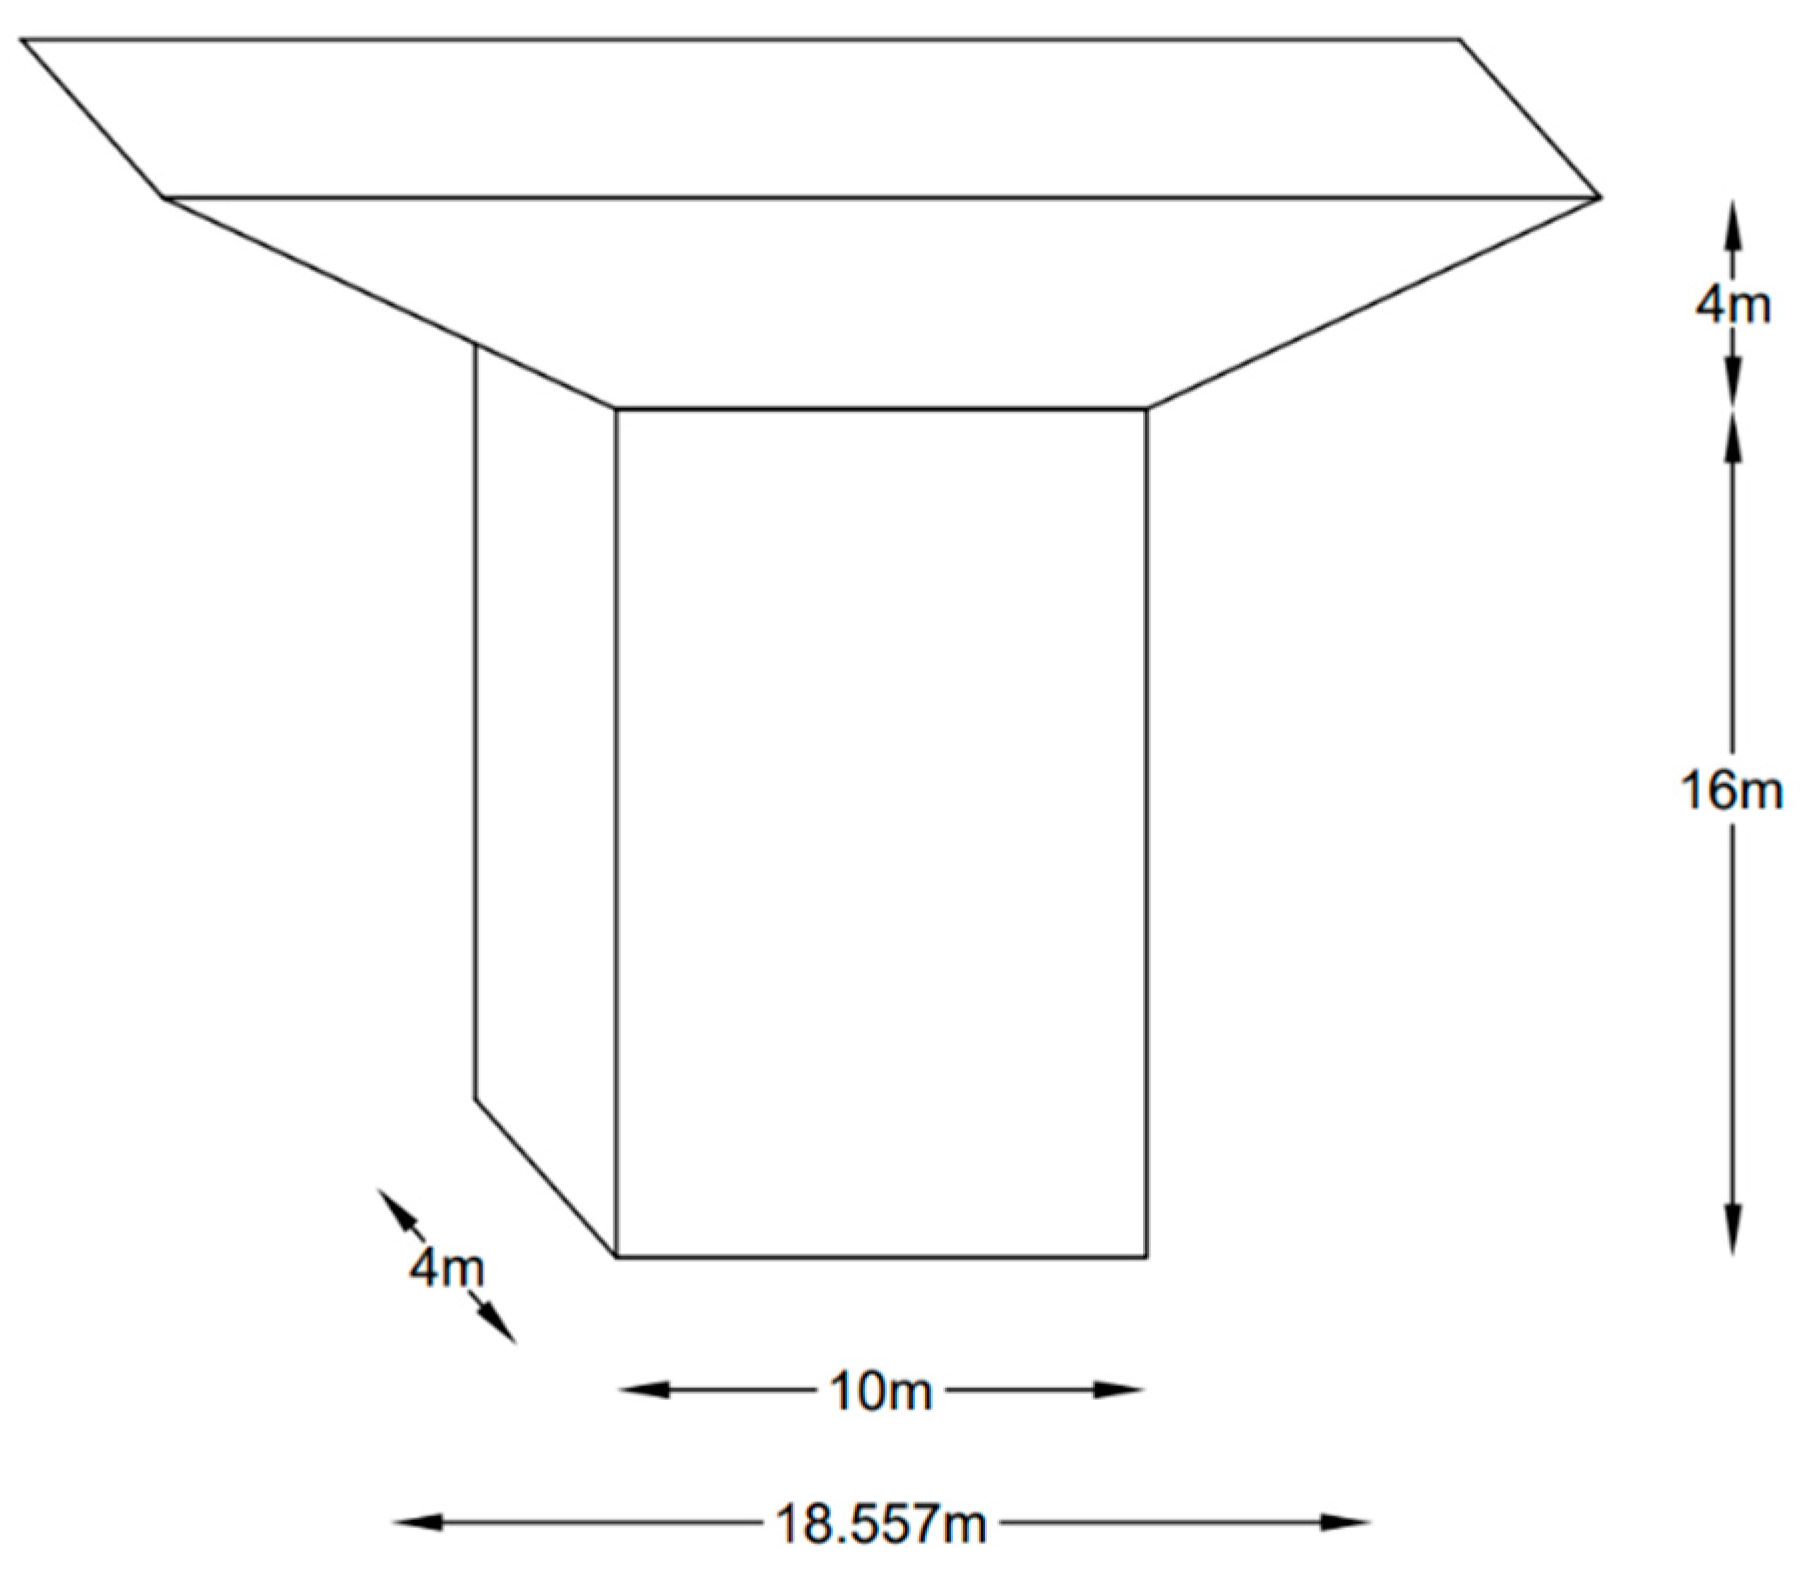
2. Bridge Details
3. Eurocode Analysis
3.1. Eurocode Parameters
3.2. Eurocode Values for Wind Actions
4. CFD Analysis
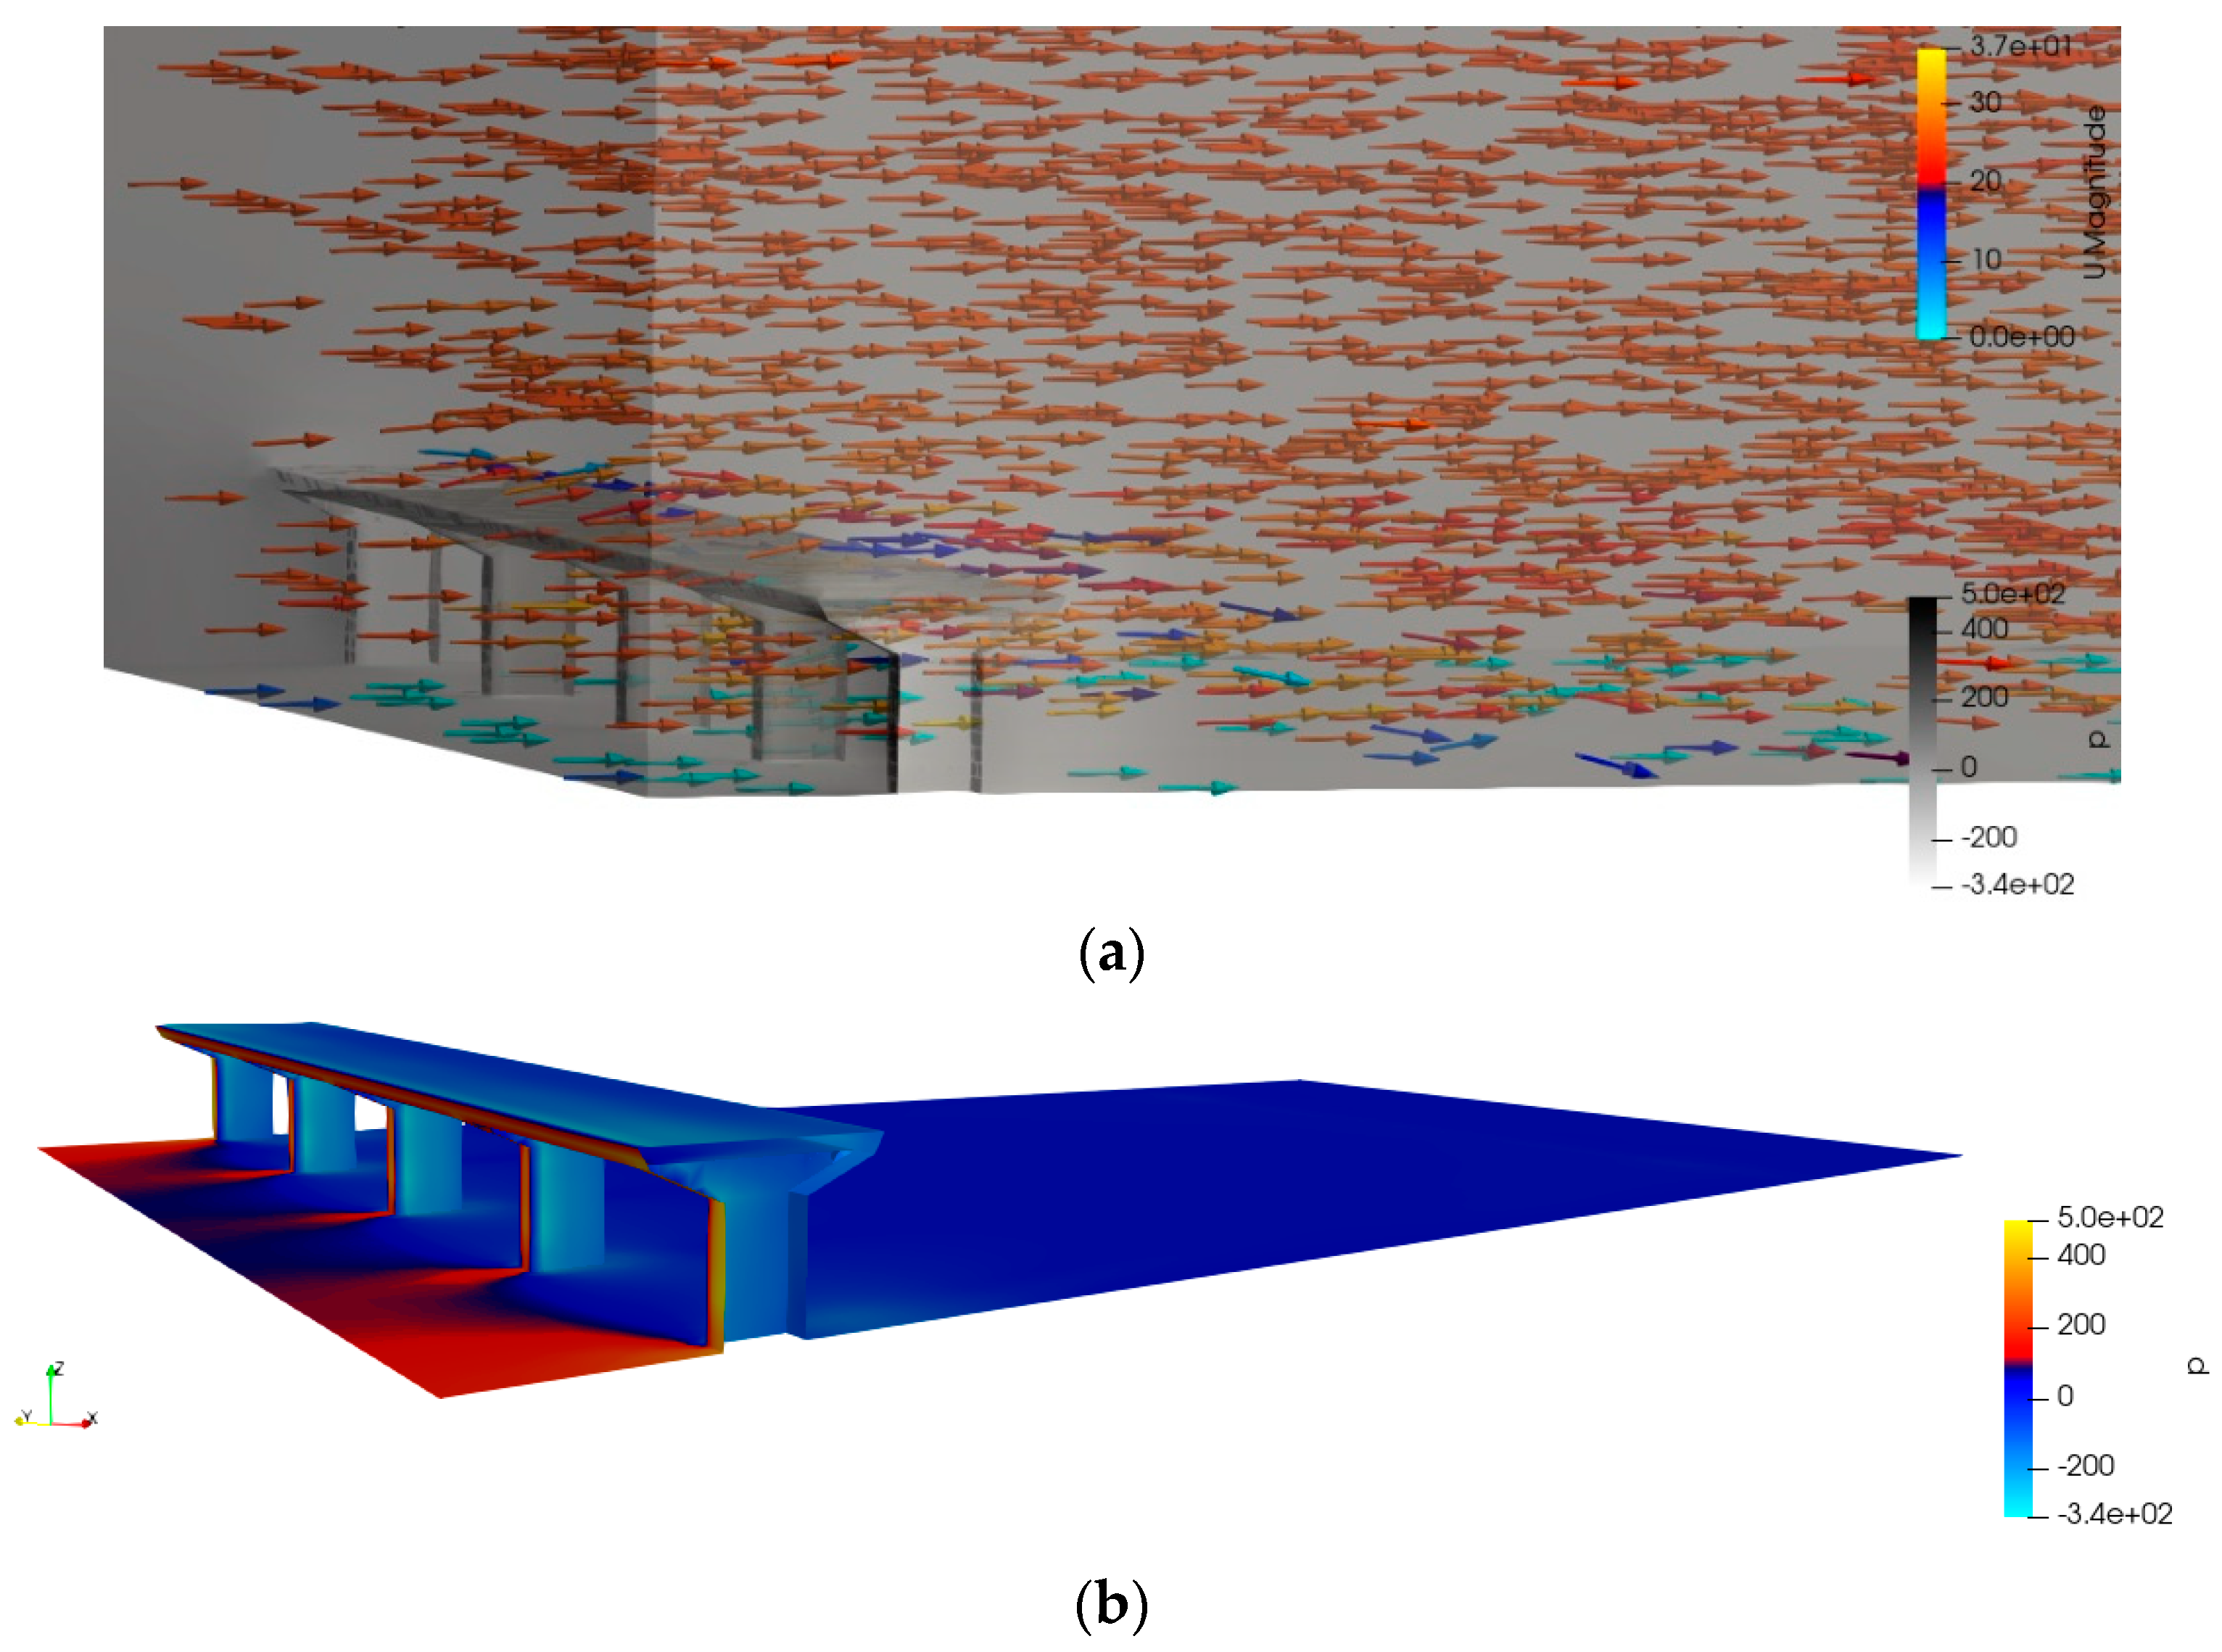
4.1. Model Description
4.2. Wind Input Values—From Met Eireann Data
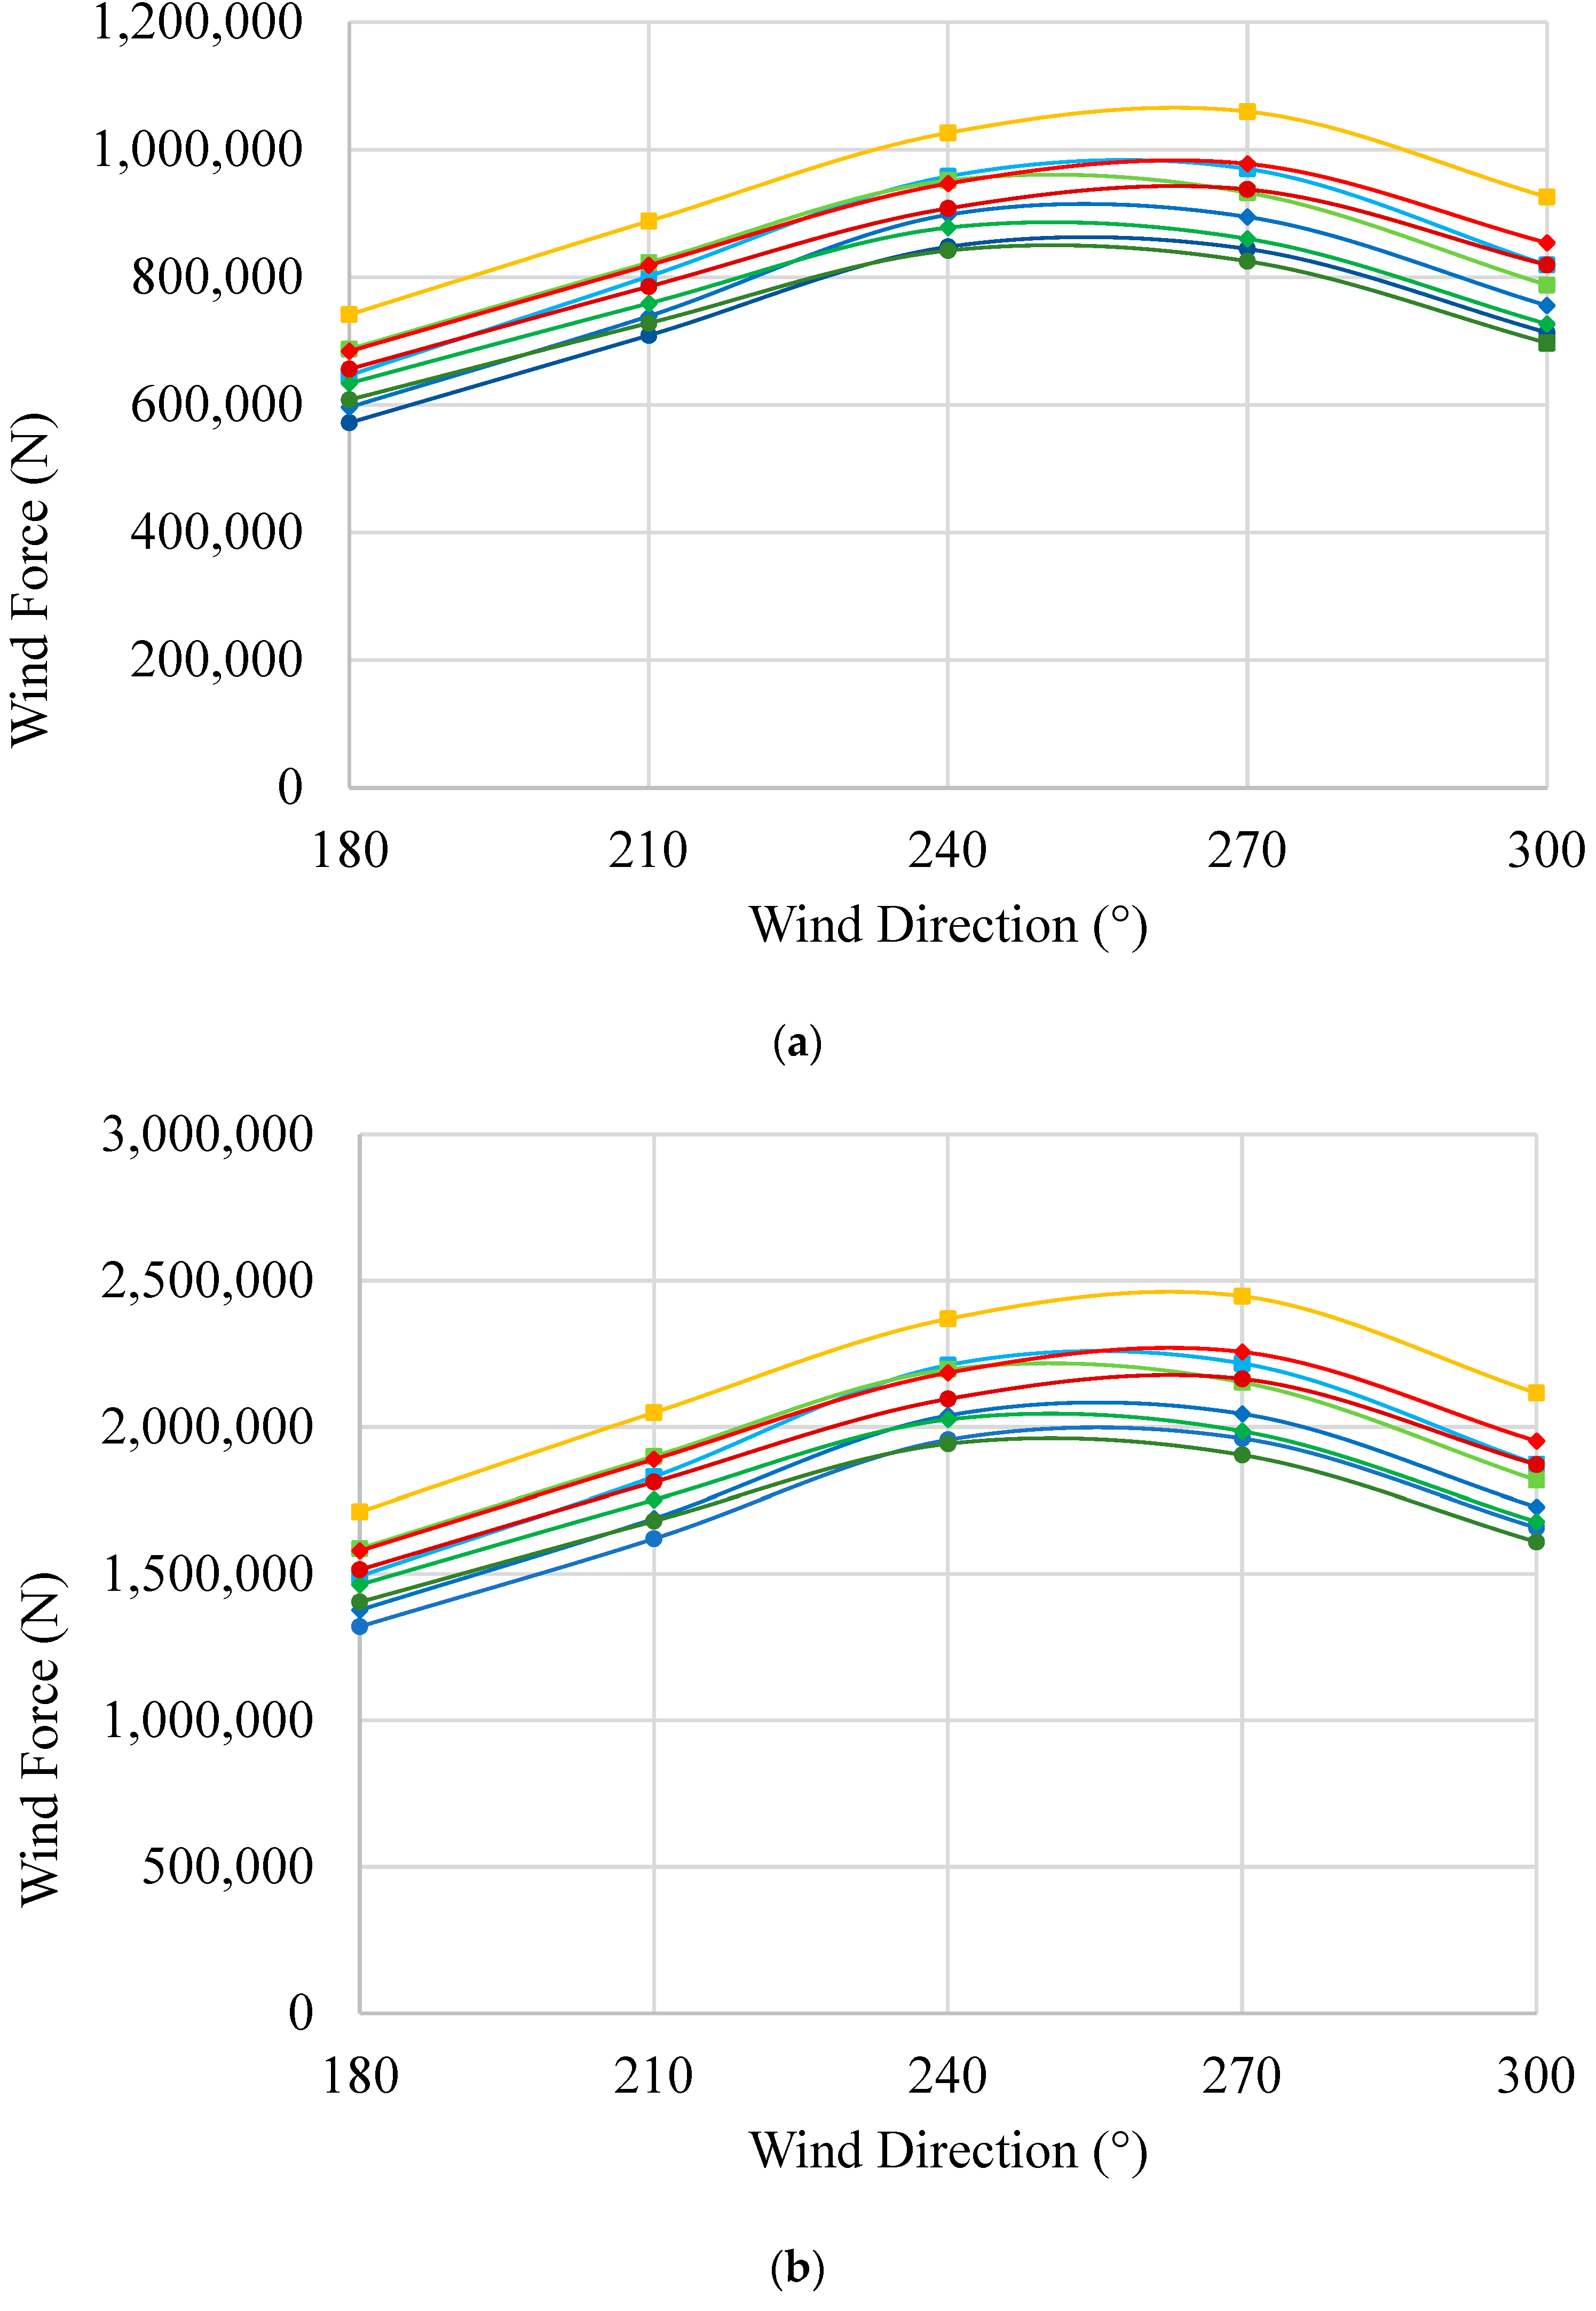
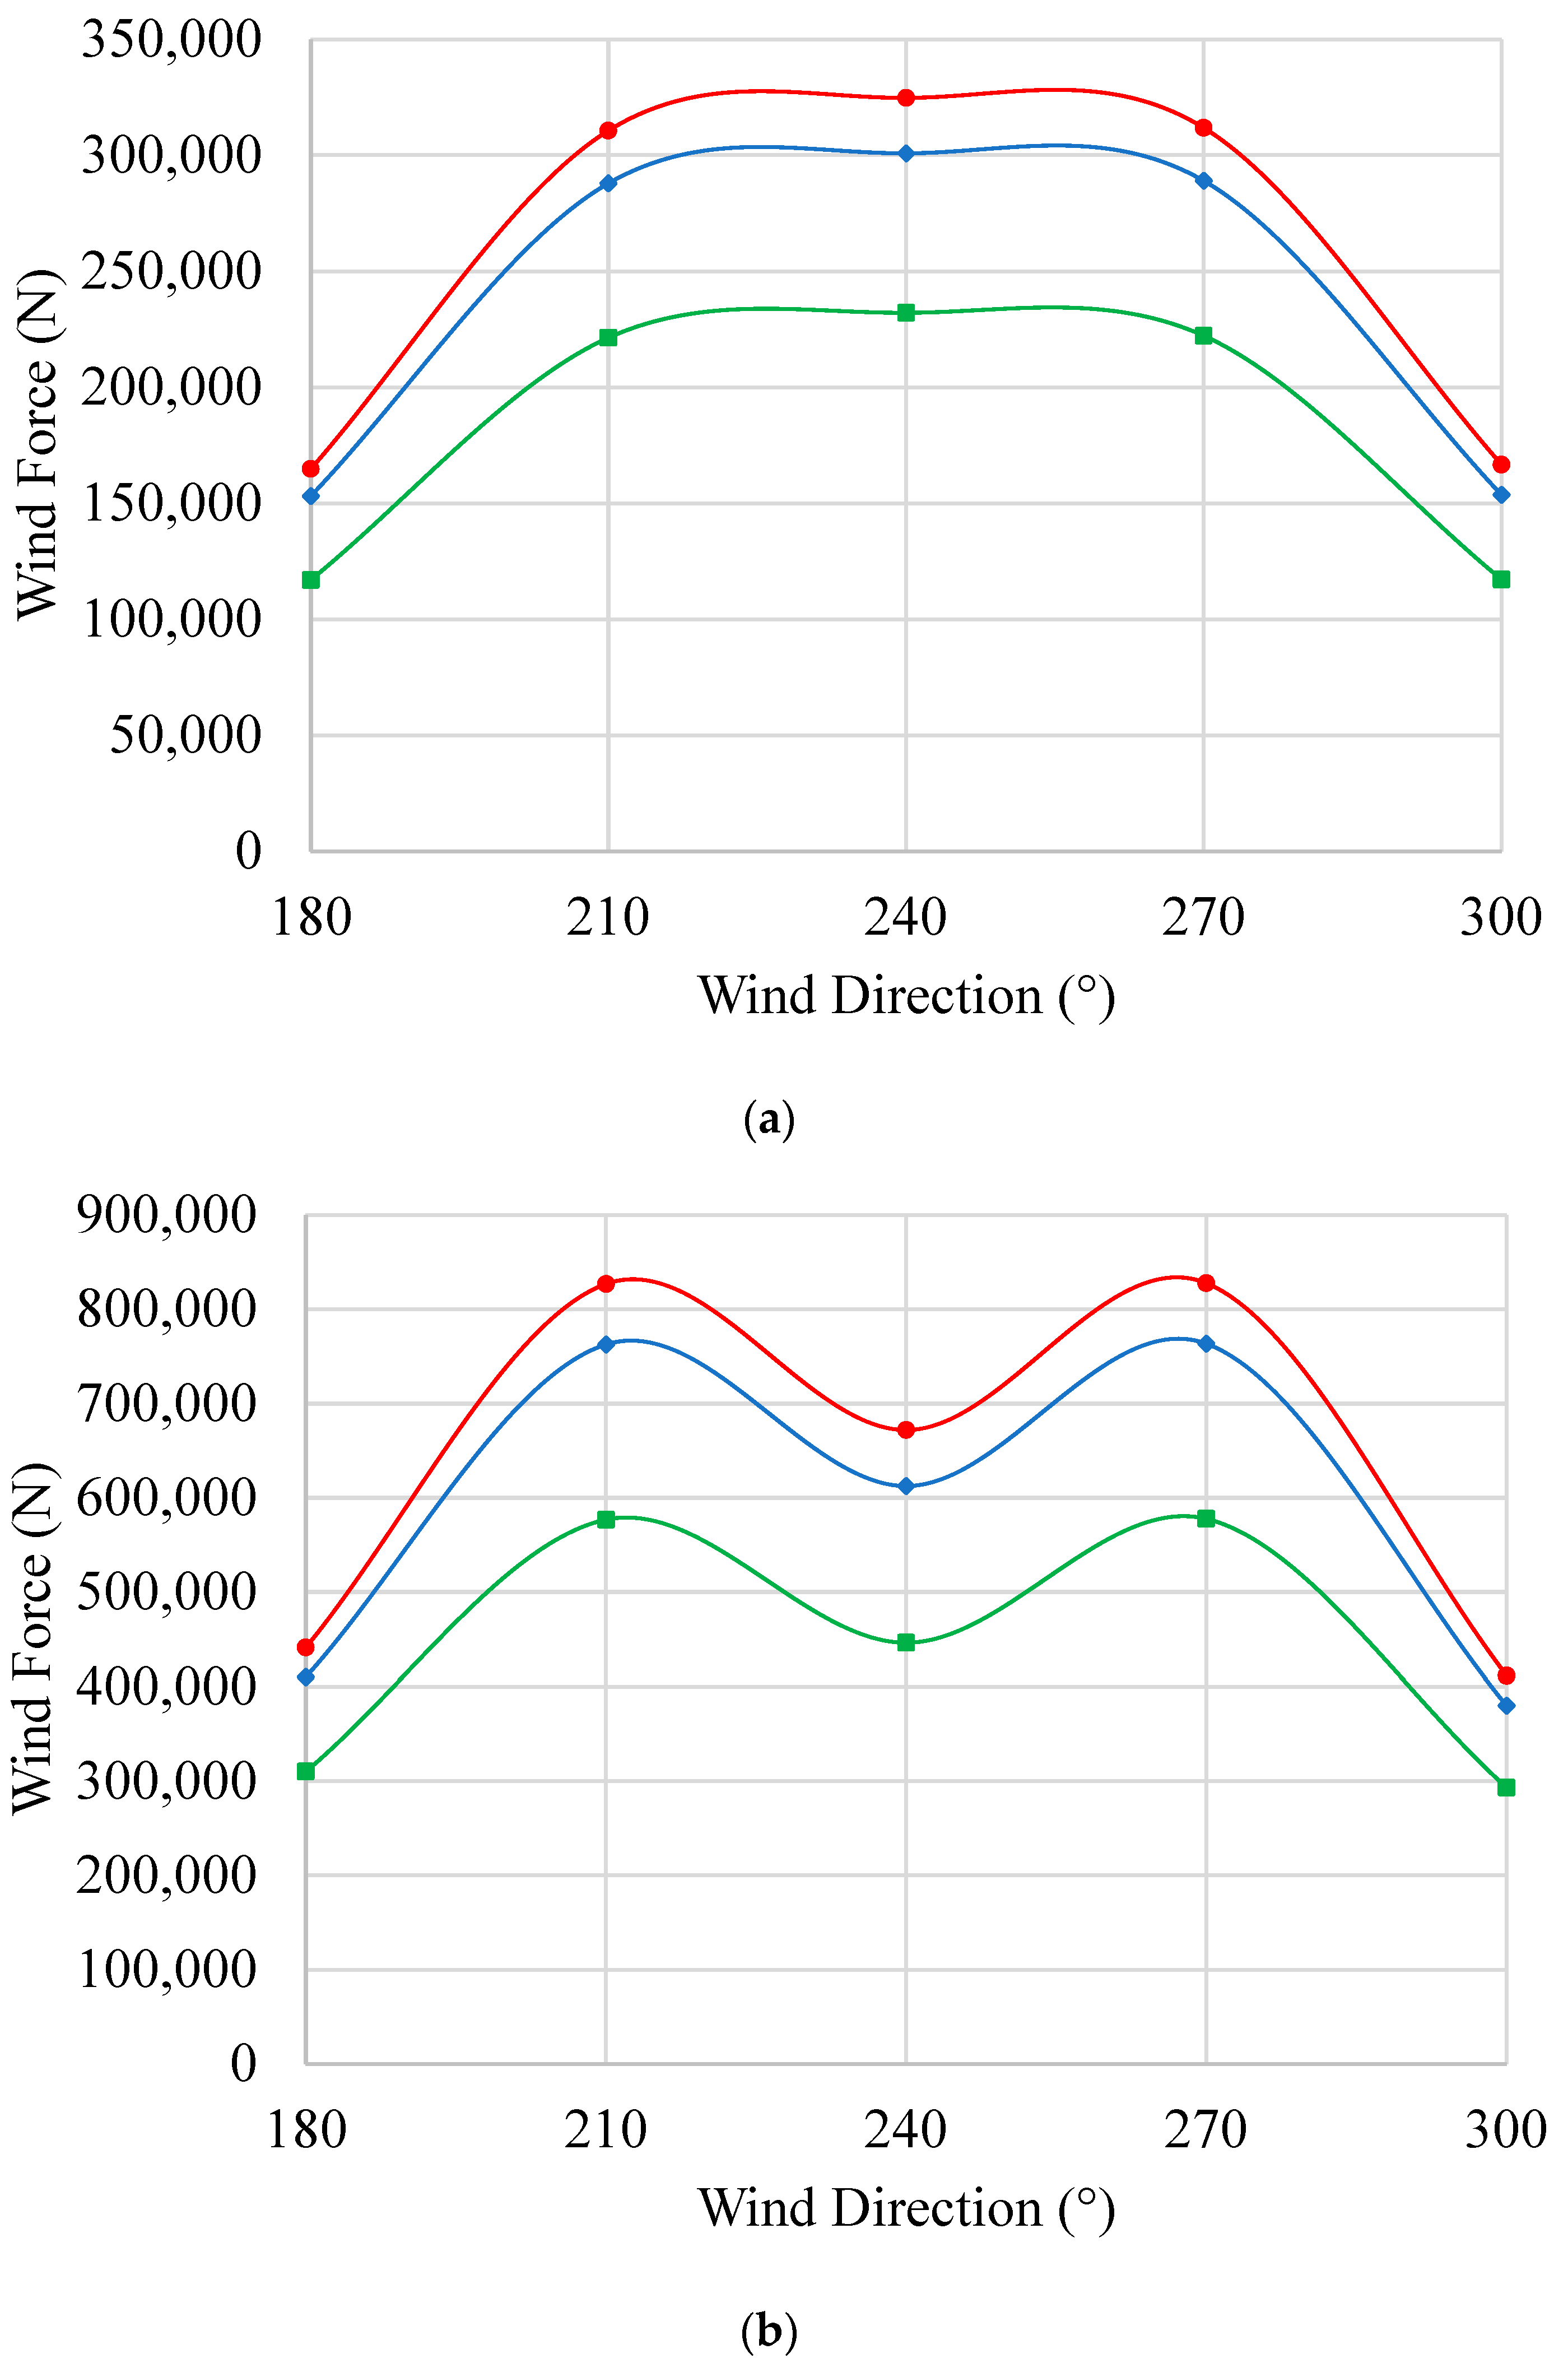
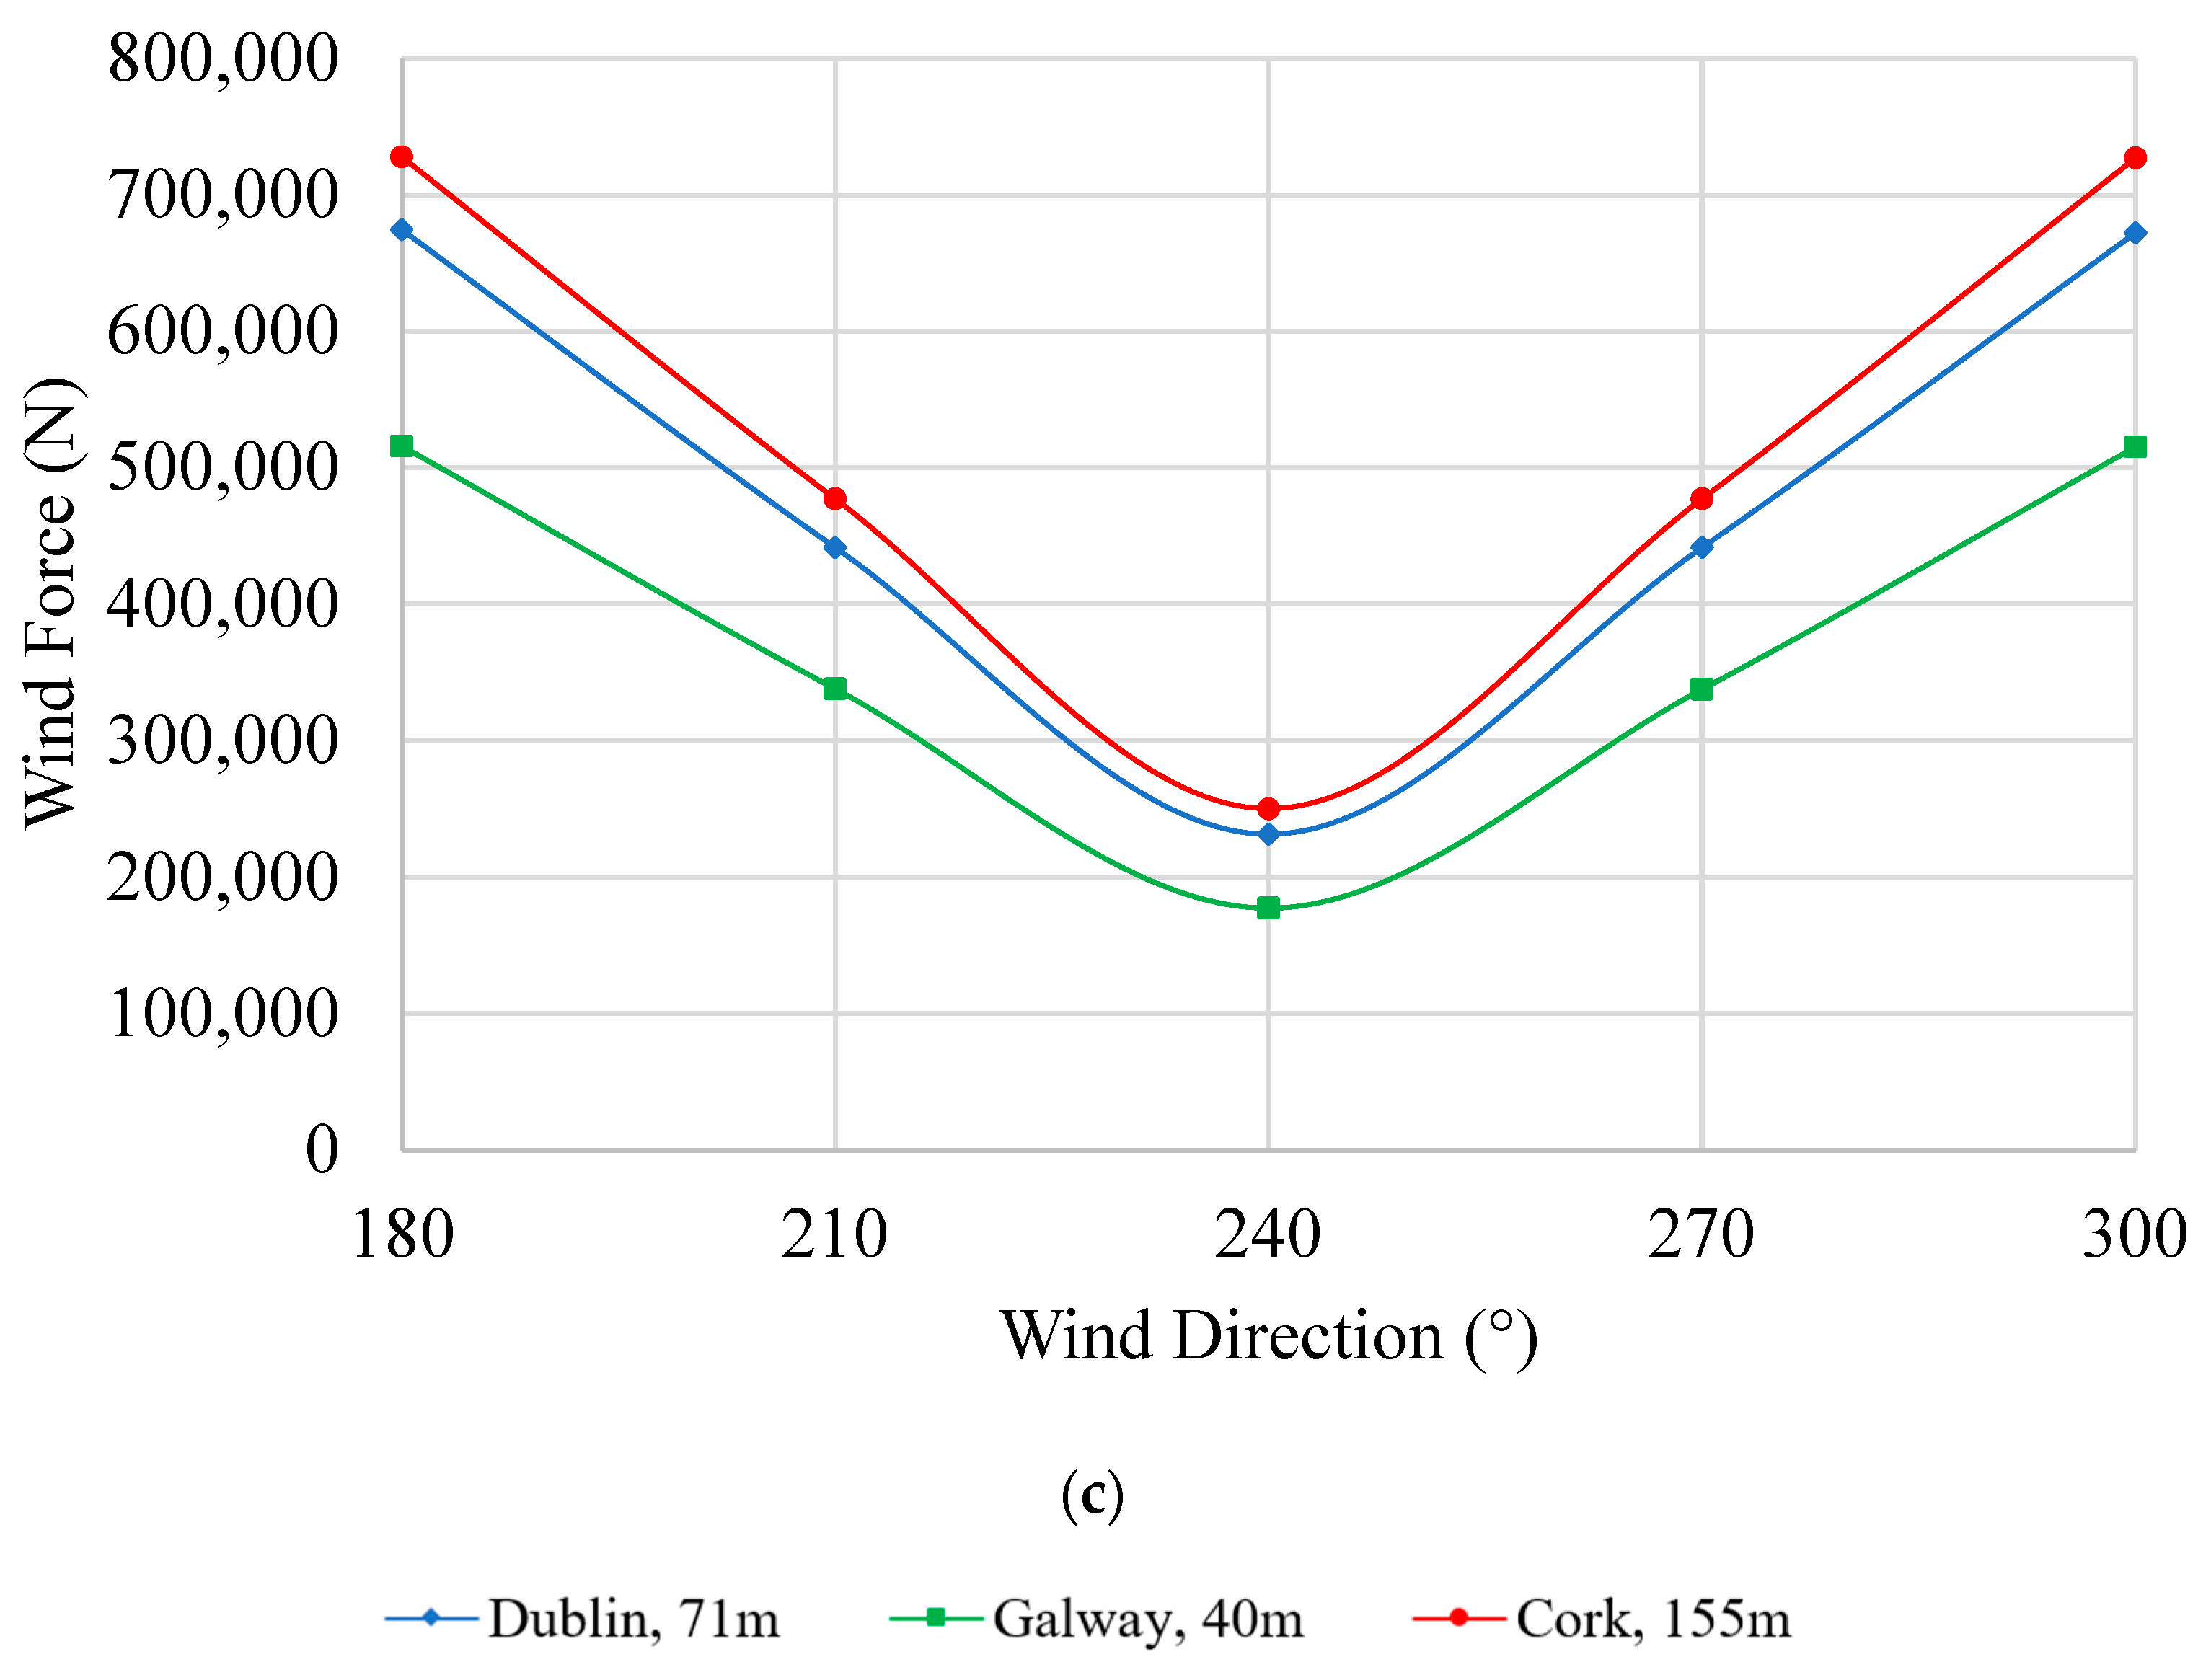
4.3. CFD Values for Wind Actions
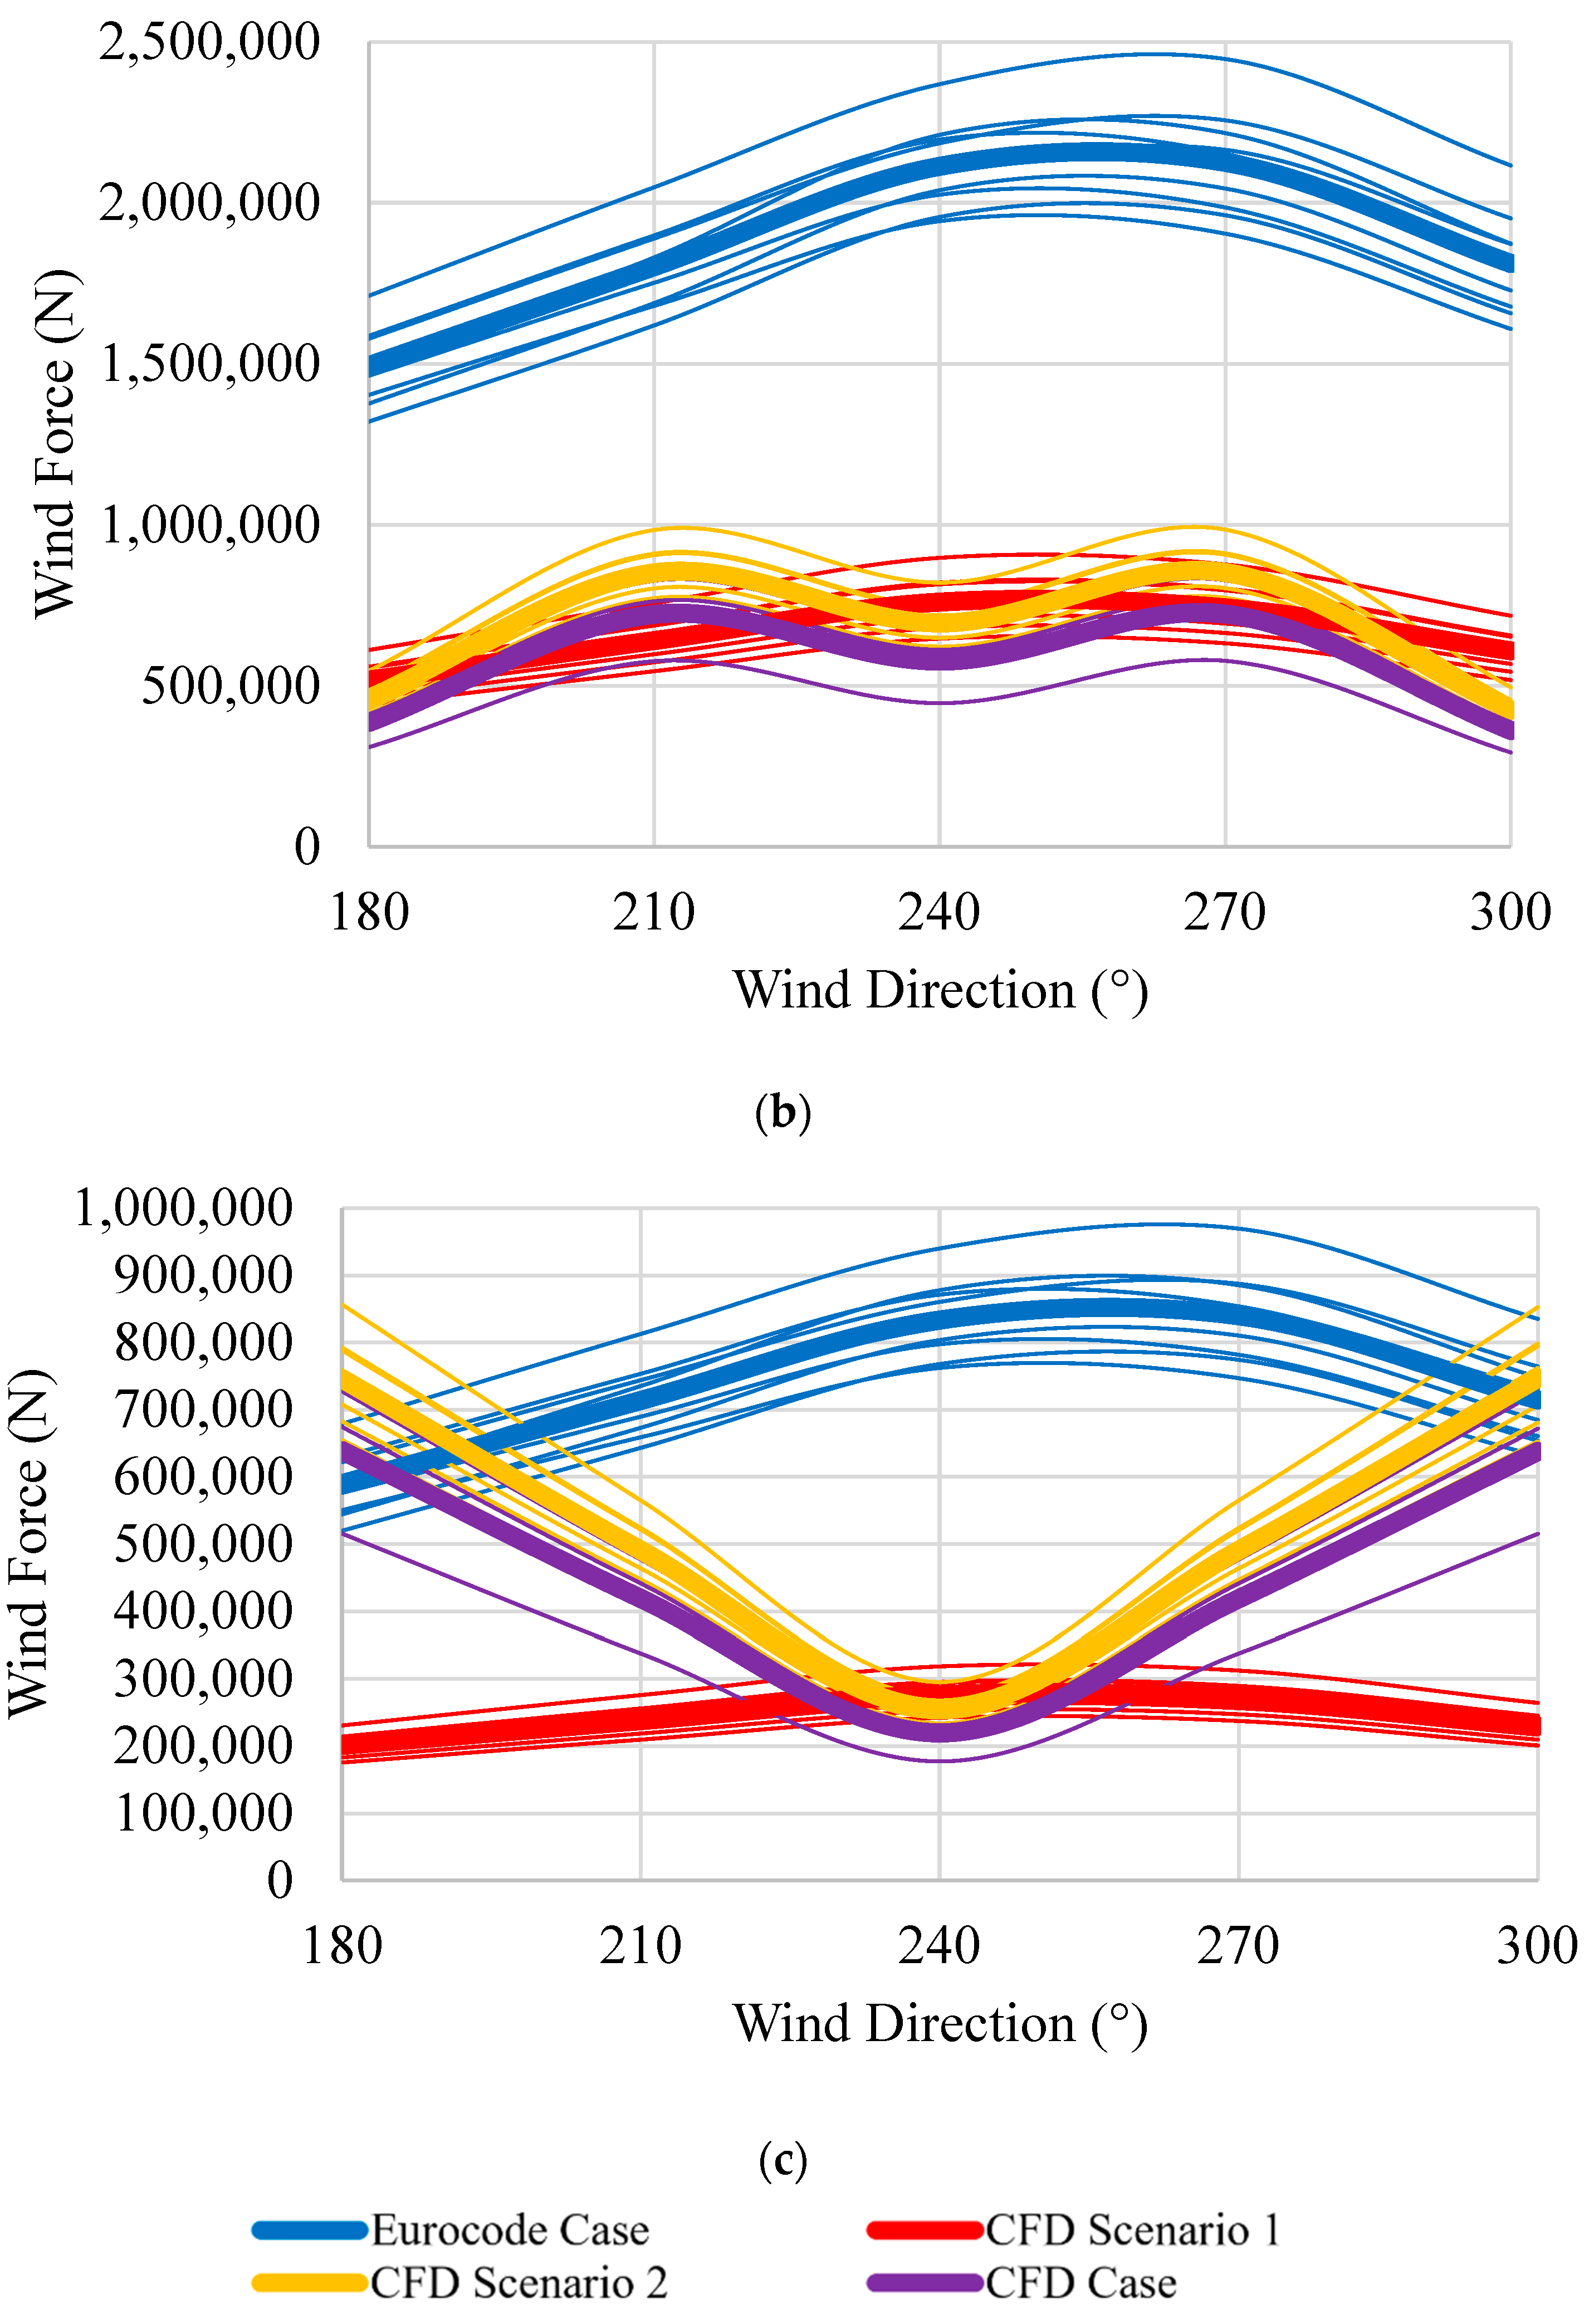
5. Comparison of the Eurocode and CFD Wind Actions
6. Conclusions
Author Contributions
Funding
Conflicts of Interest
References
- Fujino, Y.; Siringoringo, D. Vibration Mechanisms and Controls of Long-Span Bridges: A Review. Struct. Eng. Int. 2013, 23, 248–268. [Google Scholar] [CrossRef]
- Jami, M.; Rupakhety, R.; Elias, S.; Bessason, B.; Snæbjörnsson, J.T. Recent Advancement in Assessment and Control of Structures under Multi-Hazard. Appl. Sci. 2022, 12, 5118. [Google Scholar] [CrossRef]
- JJacobs, D.W.; Dhakal, S.; Malla, R.B. Live-Load Response of Eyebars on a 110-Year-Old Steel Truss Railroad Bridge. Pract. Period. Struct. Des. Constr. 2021, 26, 04020045. [Google Scholar] [CrossRef]
- Li, X.; Ding, P.; Chen, X.; Liu, A.; Qi, Y. Dynamic response analysis of the wind–train–bridge coupling based on the stiffness change of the long-span track bridge. J. Low Freq. Noise Vib. Act. Control 2020, 39, 523–534. [Google Scholar] [CrossRef]
- Bai, Y.; Zhang, Y.; Liu, T.; Kennedy, D.; Williams, F. Numerical predictions of wind-induced buffeting vibration for structures by a developed pseudo-excitation method. J. Low Freq. Noise Vib. Act. Control 2019, 38, 510–526. [Google Scholar] [CrossRef]
- EN 1991-1-4; Eurocode 1: Actions on Structures. Part 1–4: General Actions-Wind Actions. European Committee for Standardization (CEN): Brussels, Belgium, 2010.
- Markovic, Z.; Dobric, J.; Gluhovic, N. Comparison of wind actions according to Eurocode and previous regulations. Sci. J. Civ. Eng. 2020, 9, 83–92. [Google Scholar] [CrossRef]
- De Miranda, M. Long-span bridges. In Innovative Bridge Design Handbook; Elsevier: Amsterdam, The Netherlands, 2022; pp. 463–508. [Google Scholar]
- CEN/TC 250; Eurocode 1-Actions on Structures-Part 1–4: General Actions-Wind Actions. Third Draft: October 2019 Version. CEN: Paris, France, 2019.
- Massey, B.S.; Ward-Smith, A.J. Mechanics of Fluids: Solutions Manual; Taylor & Francis: London, UK, 2006. [Google Scholar]
- Hughes, A. Wind Actions to BS EN 1991-1-4; Steel Construction Institute: Ascot, UK, 2014. [Google Scholar]
- CEN/TC 250/SC 1/WG 1; Climate Change Coverage in the 2nd Generation of Eurocodes-Inputs and Proposals from SC1–WG1 Climatic Actiond. iTeh Standards: Etobicoke, ON, Canada, 2021.
- Zhang, Y.; Cardiff, P.; Keenahan, J. Wind-Induced Phenomena in Long-Span Cable-Supported Bridges: A Comparative Review of Wind Tunnel Tests and Computational Fluid Dynamics Modelling. Appl. Sci. 2021, 11, 1642. [Google Scholar] [CrossRef]
- Brar, P.; Raul, R.; Scanlan, R. Numerical calculation of flutter derivatives via indicial functions. J. Fluids Struct. 1996, 10, 337–351. [Google Scholar] [CrossRef]
- Murakami, S.; Mochida, A. 3-D numerical simulation of airflow around a cubic model by means of the k-ϵ model. J. Wind. Eng. Ind. Aerodyn. 1988, 31, 283–303. [Google Scholar] [CrossRef]
- Tominaga, Y.; Mochida, A.; Murakami, S.; Sawaki, S. Comparison of various revised k–ε models and LES applied to flow around a high-rise building model with 1:1:2 shape placed within the surface boundary layer. J. Wind Eng. Ind. Aerodyn. 2008, 96, 389–411. [Google Scholar] [CrossRef]
- Launder, B.E.; Spalding, D.B. The numerical computation of turbulent flows. In Numerical Prediction of Flow, Heat Transfer, Turbulence and Combustion; Elsevier: Amsterdam, The Netherlands, 1983; pp. 96–116. [Google Scholar]
- Greenshields, C.J. OpenFOAM User Guide; OpenFOAM Foundation Ltd.: Reading, UK, 2015; Volume 3, p. 47. [Google Scholar]
- MET Eireann. Climate of Ireland-Historical Data; Munster: Dublin, Ireland, 2022. [Google Scholar]


| Location | Wind Direction Clockwise from Due North (Degrees) | Distance Upwind to Shoreline (km) |
|---|---|---|
| Dublin | 180 | 40 |
| 210 | 20 | |
| 240 | 6 | |
| 270 | 3 | |
| 300 | 3 | |
| Galway | 180 | 110 |
| 210 | 230 | |
| 240 | 270 | |
| 270 | 190 | |
| 300 | 210 | |
| Cork | 180 | 170 |
| 210 | 430 | |
| 240 | 270 | |
| 270 | 16 | |
| 300 | 8 |
| Case | Altitude | Wind Direction | Wind Velocity | Wind Force |
|---|---|---|---|---|
| Eurocode Case | Altitude factor used to show effect of altitude on wind intensity | Directional factor changed to simulate the changes in wind intensity for different directions | Vb value used, which is influenced by the altitude factor and directional factor 1 | Fw determined using the Eurocode calculation |
| CFD Case | Altitude of each Met Eireann weather station is observed | Direction of the wind changed by rotating the bridge in the x–y plane within the CFD model | Velocity values generated from historical Met Eireann data | Net wind force determined using CFD models |
| CFD Case 1 | Altitude factor used to show effect of altitude on wind intensity | Directional factor changed to simulate the changes in wind intensity for different directions | Vb value used, which is influenced by the altitude factor and directional factor 1 | Net wind force determined using CFD models |
| CFD Case 2 | Altitude factor used to show effect of altitude on wind intensity | Direction of the wind changed by rotating the bridge in the x–y plane within the CFD model | Vb,0 value used, which is influenced by the altitude factor only. | Net wind force determined using CFD models |
Publisher’s Note: MDPI stays neutral with regard to jurisdictional claims in published maps and institutional affiliations. |
© 2022 by the authors. Licensee MDPI, Basel, Switzerland. This article is an open access article distributed under the terms and conditions of the Creative Commons Attribution (CC BY) license (https://creativecommons.org/licenses/by/4.0/).
Share and Cite
Moore, N.; Keenahan, J. Wind Forces on Medium-Span Bridges: A Comparison of Eurocode 1 Part 4 and Computational Fluid Dynamics. CivilEng 2022, 3, 794-808. https://doi.org/10.3390/civileng3030046
Moore N, Keenahan J. Wind Forces on Medium-Span Bridges: A Comparison of Eurocode 1 Part 4 and Computational Fluid Dynamics. CivilEng. 2022; 3(3):794-808. https://doi.org/10.3390/civileng3030046
Chicago/Turabian StyleMoore, Niamh, and Jennifer Keenahan. 2022. "Wind Forces on Medium-Span Bridges: A Comparison of Eurocode 1 Part 4 and Computational Fluid Dynamics" CivilEng 3, no. 3: 794-808. https://doi.org/10.3390/civileng3030046
APA StyleMoore, N., & Keenahan, J. (2022). Wind Forces on Medium-Span Bridges: A Comparison of Eurocode 1 Part 4 and Computational Fluid Dynamics. CivilEng, 3(3), 794-808. https://doi.org/10.3390/civileng3030046