Article

Hygrothermal Modelling of the Differences between Single versus Variable Relative Humidity Vapour Diffusion Resistivity Properties of Pliable Membranes

1
Architecture and Design, University of Tasmania, Inveresk, Launceston 7250, Australia
2
Fraunhofer Institute for Building Physics IBP Fraunhoferstr. 10, 83626 Valley, Germany
*
Author to whom correspondence should be addressed.
CivilEng 2022, 3(3), 687-716; https://doi.org/10.3390/civileng3030040
Submission received: 16 June 2022 / Revised: 1 August 2022 / Accepted: 5 August 2022 / Published: 10 August 2022
(This article belongs to the Section Construction and Material Engineering)

Abstract

:
The study investigates through hygrothermal modelling the effect of different boundary conditions and varying measured vapour diffusion resistivity values on the hygrothermal performance of five pliable membranes. Previously, this research quantified the variable water vapour diffusion resistivity properties of five different pliable building membranes. The membranes were assessed under varying humidity conditions using the gravimetric wet and dry cup test method. The varying humidity conditions better represent the boundary conditions experienced by materials in the building envelope. The pliable membranes include two permeable, two impermeable, and one variable products, which are commonly used to provide air and vapour control layers in the construction of framed external wall systems. This article focusses on the transient hygrothermal modelling of each of these membranes as a component of a typical timber-framed, clay brick veneer external wall system. The simulations were completed for three different climate types, namely, hot and humid, temperate, and cool-temperate with snow, and with a northern and western orientation. The results from hygrothermal and bio-hygrothermal simulations highlighted different responses subject to climate type and orientation. These results show that there are significant differences in simulated moisture and mould growth risk between the results of pliable membranes with single vapour resistance factor value and pliable membranes with multipoint vapour resistance factor values.

1. Introduction

The aim of this comparative assessment was to investigate if there are significant differences between the hygrothermal performance of pliable membranes when modelled with a single point measured value of water vapour diffusion resistance factor, versus the same product modelled with multipoint vapour diffusion resistance factor. To test this matter, the most common external wall system in Australia, a timber-framed brick veneer wall system, was used for the simulation. Pliable membranes are internationally used as water, vapour, and air control layers on the exterior of building envelopes. Furthermore, all elements within an external wall system provide multiple or singular functions and responses to provide moisture, vapour, air, thermal, and solar control layers. The presence of these layers, their location, and their precise physical properties in a building envelope are essential for providing energy efficient and durable external wall systems. To establish the likelihood of moisture accumulation and mould growth, hygrothermal and bio-hygrothermal simulation tools are used to inform the design and construction processes [1,2,3,4]. Pliable building membranes are used to prevent the presence of unmanaged and excess indoor moisture from water vapour, which can lead to moisture accumulation, support mould growth, and affect the durability of a building [5,6]. Apart from this, unplanned moisture accumulation within the built fabric of an insulated building can significantly reduce envelope thermal efficiency, which is an important issue when considering the world’s collective goal of reducing carbon emission from the operation of buildings [7,8]. In addition to building durability, the issue of unmanaged moisture in buildings has been identified as a significant health risk to building occupants, where mould and other pathogens thrive, which are detrimental to human health [9].
Interestingly, hygrothermal risk assessment (HRA), through numerical simulation offers a great potential for predicting the performance of an envelope regarding moisture, air, and heat, to prevent building envelope deterioration and other adverse occurrences associated with moisture accumulation during the service life of an envelope [10]. The more complex hygrothermal simulation tools can predict coupled heat air, and moisture transfer in a building envelope. This helps to understand the possible behaviour of temperature and relative humidity which recognise the wetting and drying capacity of building envelopes. In the last two decades, there has been significant advancement in building physics knowledge and calculation methods about the movement of heat and moisture through the building envelope. This has led to the development, testing, and empirical validation of transient hygrothermal and bio-hygrothermal tools, such as WUFI, UMIDUS, Delphin HAMT, EMPD, and DOMUS [11,12]. To provide timely advice for the design and construction professions, and building regulators, these tools were developed to simplify the calculation complexity for condensation risk assessment and to provide significantly more guidance than the hand calculation method of the 1950s to 1990s.
To assess the risk of moisture damage through hygrothermal modelling, several factors are considered, which include how the materials are layered in the wall system, the interior environmental conditions, and the exterior environmental conditions [13]. To adequately calculate the heat and moisture flow through each wall material, its thickness, density, conductivity, thermal capacitance, and water vapour diffusion resistance factor must be known. The interior environmental conditions include temperature, relative humidity, internal thermal and moisture loads, and air change rates. The external climate should comprise at least one full year of data that include temperature; humidity; barometric pressure; global, direct, and diffuse solar radiation; and hourly precipitation.
It is also important to consider the location and the class of building pliable membrane, based on an understanding of the vapour diffusion resistance factor, the type and position of the insulation, and the material and the finishes on the internal lining. Moreover, depending on the climate and material-based risk factors in the data libraries of any above hygrothermal tools mentioned earlier, several simulation iterations may be required at design stage to understand wetting events and drying potential of a proposed external wall system. A durable and healthy external wall system is one that can withstand the calculated moisture and drying events within the wall, such that moisture does not accumulate, or affect individual materials, and mould growth is kept at the microscopic level, that is, a Mould Index of less than 2. This calculation must also consider the expected moisture and air ingress due to construction methods and the service life of the wall system.
The integration of hygrothermal simulation tools has facilitated several investigations into the performance of wall systems as a whole, and component analysis of individual elements within the building envelope [14,15,16,17,18]. While some studies have also looked into hygrothermal performance of whole building at larger scale, with specific attention to preserving heritage and historic buildings and improving their energy efficiency [19,20,21,22,23], some studies have explored risks associated with emerging materials, such as Cross Laminated Timber buildings [24,25,26,27,28]. However, more recent research has been undertaking more specific empirical validation tasks and questioning the material properties and calculation methods within the hygrothermal simulation tools. This reflects the recognition that the composition of many construction materials has changed over the last five decades and that façade construction has become more precise due to the need for more energy efficient buildings. It also highlights the need for reliable and current data to ensure that hygrothermal simulation results are useful and reasonably accurate for predicting moisture load in a building envelope. Consequently, more attention is being focused on the published physical properties of materials that are included in the hygrothermal software data libraries. Some studies have critiqued the methodology for sourcing input data and provided new innovative methods for establishing some critical hygrothermal properties such as water vapour diffusion resistivity of construction materials [6,16,29,30].
However, there are few or scanty studies which have investigated the effect of varying the relative humidity boundary condition on the performance of construction materials, with specific attention to comparing the results of simulations where materials have used a single-point or multipoint water vapour diffusion resistance factors. To date, it also appears that there is no uniformity in the methods used for plotting hygrothermal curves for construction materials, under different relative humidity boundary conditions. This an emerging concern, and relates to the international standard, which only specifies that measurement is carried out under single point temperature 23 °C and relative humidity 50%. This may be a somewhat rare occurrence within elements that comprise the external envelope, which must endure significant changes in temperature, humidity, radiation, and moisture on a daily and seasonal basis. Due to this narrow guidance by the international standard, most materials within the hygrothermal simulation tools only include a single vapour diffusion resistance factor, which is used for the calculation process, regardless of the temperature and relative humidity that the components are experiencing within the simulation. An example of this is shown in Figure 1 below, which is from the WUFI Pro material library and is for a pliable building membrane.
This approach not only makes the hygrothermal calculation simpler, but also minimises material testing costs for manufacturers, where a manufacturer can choose the most desirable vapour resistance factor from the single point wet-cup, or a dry-cup, gravimetric analysis. The material testing and the calculation method may become difficult when a material is gravimetrically tested under different relative humidity conditions. This would lead to the calculation and plotting of multipoint relative humidity vapour diffusion resistance factor values as input data to the hygrothermal simulation tool. However, our recent published research addressed how to plot multipoint vapour resistance factors. This also demonstrated that irrespective of the vapour resistance class, the tested membranes behaved differently when tested under different relative humidity conditions [1]. Following this line of thought, if the water vapour diffusion resistance factor of materials is variable subject to the relative humidity conditions, the hygrothermal simulation, or real life, response will not be the same as the single point plotted values. That research paper recommended that the quantification of construction material water vapour diffusion properties should be completed for various agreed steps between 30% and 80% relative humidity, the measured gravimetric values undergo harmonic mean adjustment, and the muti-point values be applied to the material physical properties within hygrothermal simulation tools. However, the previous paper did not include the results of the differences that may occur when the hygrothermal simulation uses either a single point or multipoint water vapour diffusion values [1,6]. This is an important matter, as all simulation results are the sum of their inputs, and if the inputs do not correctly reflect the true physical situation, the simulation is likely to provide inadequate or even incorrect, guidance. This paper attempts to understand if there are significant differences between hygrothermal simulations with single point water vapour diffusion resistance factor values and hygrothermal simulations with multipoint variable relative humidity water vapour diffusion resistance factor values, and if there is a discernible difference, how this may or may not contribute to moisture accumulation and mould growth in a building envelope.

2. Materials and Methods

The premise of this research is the need to use multipoint, rather than single-point water vapour diffusion resistance factors within hygrothermal simulations. The analysis presented in this paper aims at evaluating if the result from hygrothermal simulations using single-point or multipoint values for the water vapour diffusion resistance factor produces similar or dissimilar results. This will further establish the need for more detailed and diverse water vapour diffusion resistivity properties for construction materials within a range of humidity conditions, which better represent the conditions experienced within a building’s external envelope. The hygrothermal simulations in this analysis used the most common external envelope system in Australian low-rise residential construction, a timber-framed, clay masonry veneer wall system. This research previously identified that the vapour diffusion properties are different when the five pliable building membrane types used in this analysis were tested within laboratory conditions with a temperature of 23 °C and RH conditions of 35%, 50%, 65% and 80%, respectively [1,6]. This is notably different to the gravimetric water vapour transmission testing methods for construction materials, described in the two international standards, ISO 12572 and ASTM E 96 m, which only prescribes a single temperature of 23 °C (±1 °C) and a single relative humidity of 50% (±5%). We equally posited that data from single point measurement may not be sufficient for completing long-term hygrothermal performance simulations.
To demonstrate whether the input data from a single-point measurement of vapour diffusion resistivity values described by these two standards are adequate or not, this research completed hygrothermal modelling to compare the simulation results from using single-point data against and multipoint data. The water vapour diffusion resistance values used in these simulations were obtained through previously reported research [1,6]. For each of the five pliable membranes that had water vapour diffusion resistance testing completed, a simulation that includes a single-point value and a simulation that includes a multipoint value was completed. This will establish if there is significant difference between the results from the hygrothermal simulations using the single-point water vapour diffusion resistance factors versus the multipoint vapour diffusion resistance factors. The WUFI Pro 6.5 hygrothermal simulation software was used in the research.
The detail of this methodology included:
  • creating user defined material data for the pliable membranes within the WUFI Pro 6.5 data library,
  • completing the hygrothermal simulations using WUFI Pro 6.5, followed by
  • bio-hygrothermal simulations the WUFI VTT post processing software to analyse differences in Mould Index results.

2.1. Creating New User-Defined Material Data

The WUFI Pro 6.5 hygrothermal simulation program includes a library of construction materials used in buildings. For each material, relevant physical properties for the calculation of heat and moisture flows through each component exist. During this research, the density and material thicknesses of pliable membranes were obtained during the process to measure and calculate water vapour diffusion resistivity values. Other material properties, such as conductivity and thermal capacitance were adopted from the same or very similar materials within the software’s materials database, as shown in Table 1. Unlike the water vapour resistivity values that were measured in this research, the other physical properties were not measured. The focus of this research was questioning whether the single point test method was adequate for quantifying water vapour diffusion resistance properties, which are used as critical inputs for building envelope hygrothermal and bio-hygrothermal simulation. As mentioned above, the previously published research identified non-linear relative humidity-dependent water vapour diffusion resistivity properties for all five products that were tested. At this early stage of this research program, only pliable building membranes have been assessed. Future research will explore whether other materials used in the construction of external envelopes also have relative humidity dependent water vapour diffusion resistance properties. In this research, the physical properties of a standard pliable building membrane were adopted such that the porosity, specific heat capacity, and thermal conductivity values were the same, as shown in Table 1. The procedure for inputting the laboratory measured water vapour diffusion resistance values for the five pliable membranes analysed is discussed next.

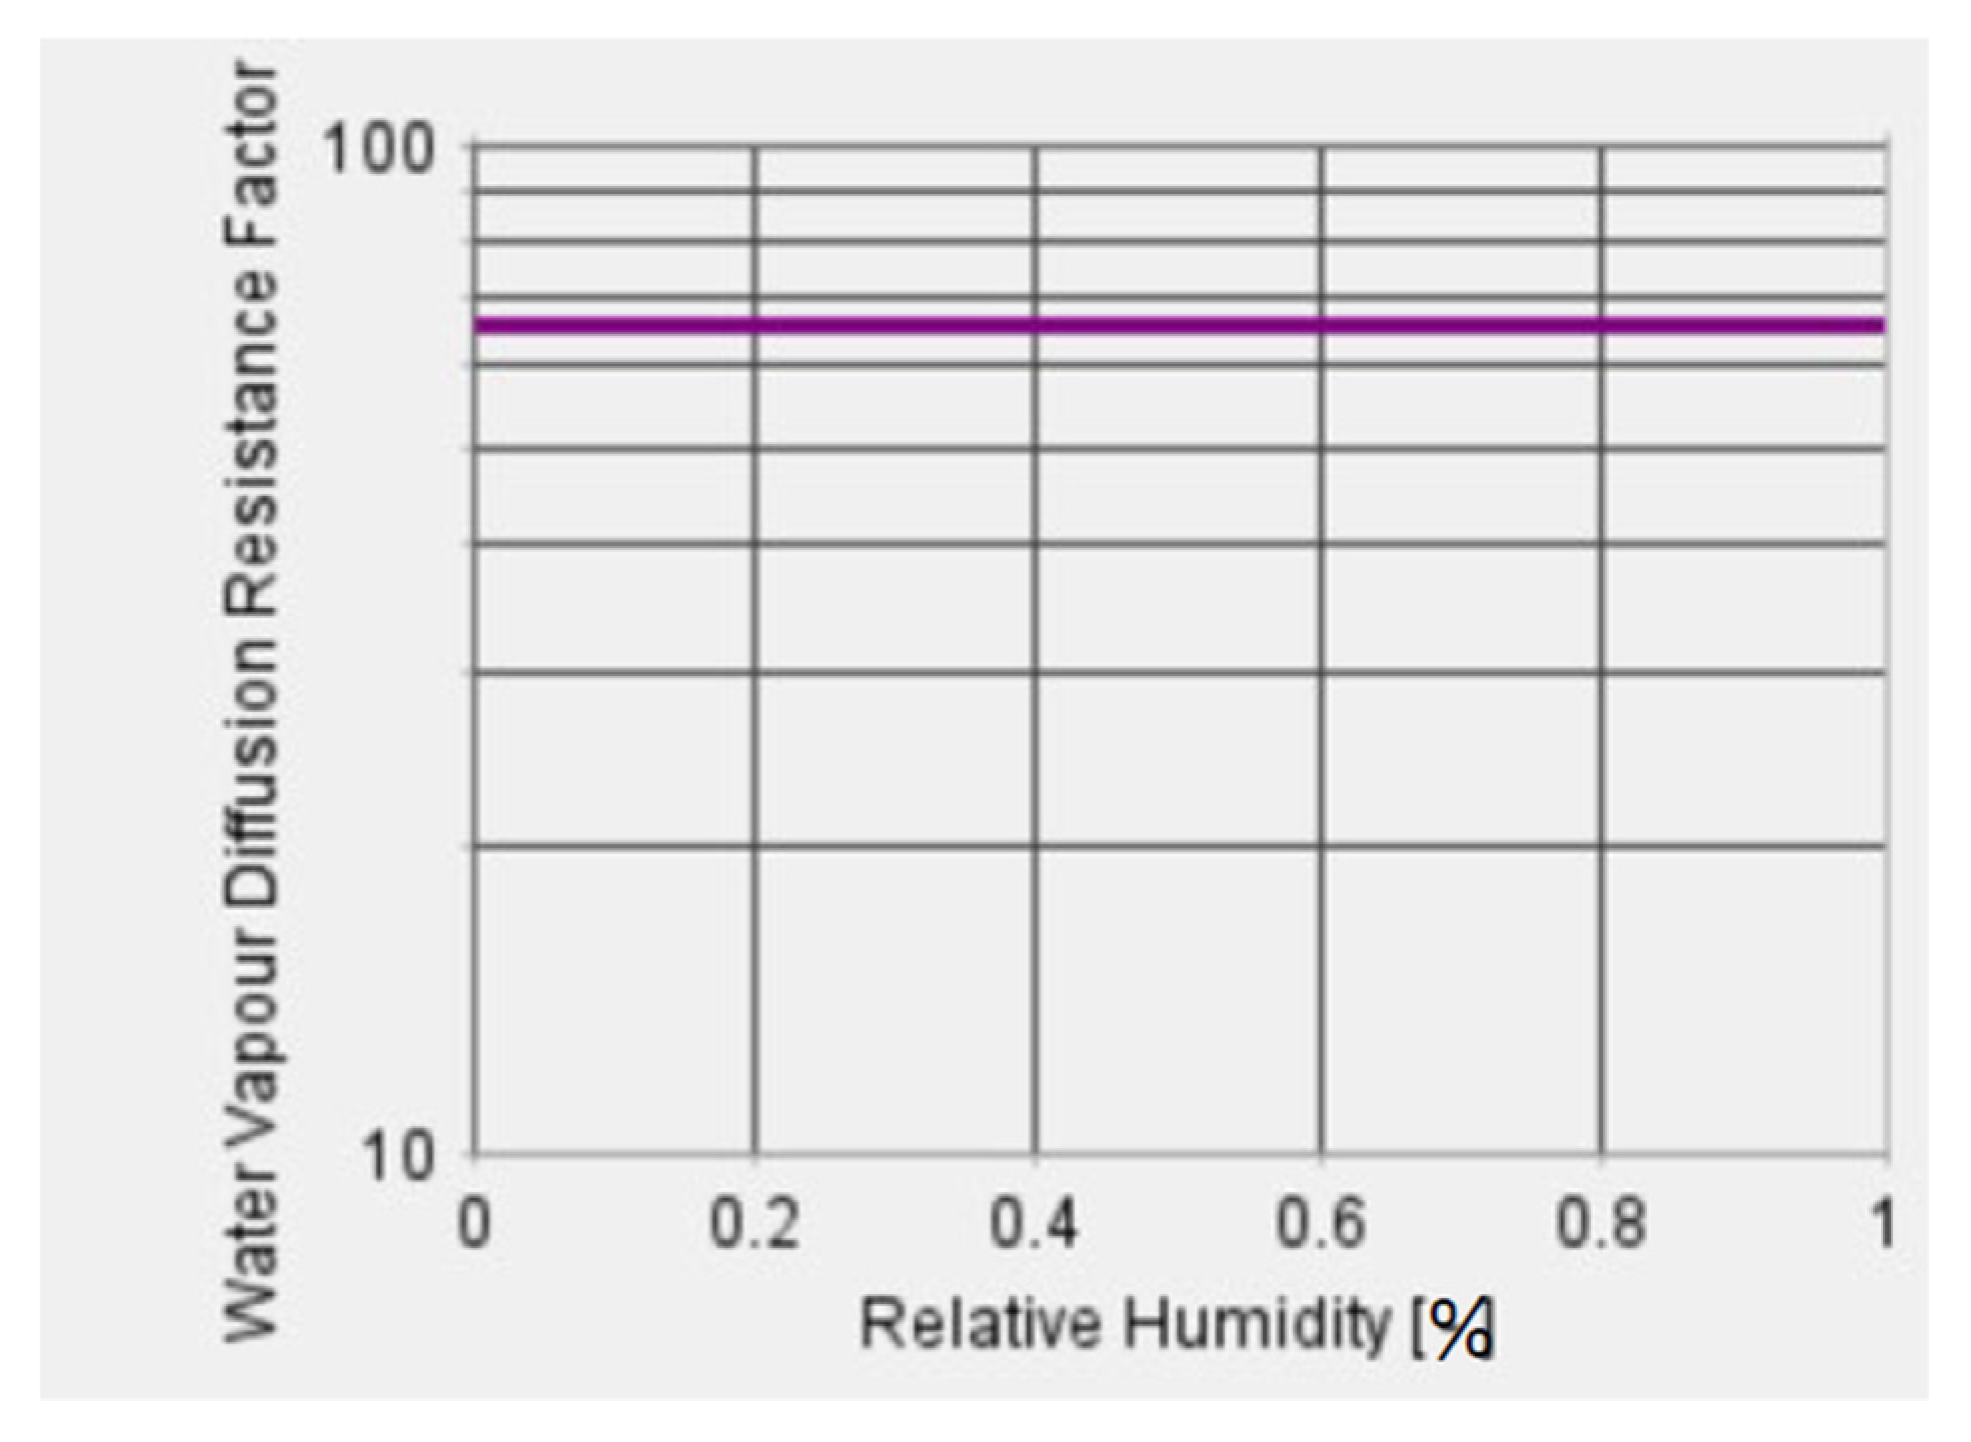
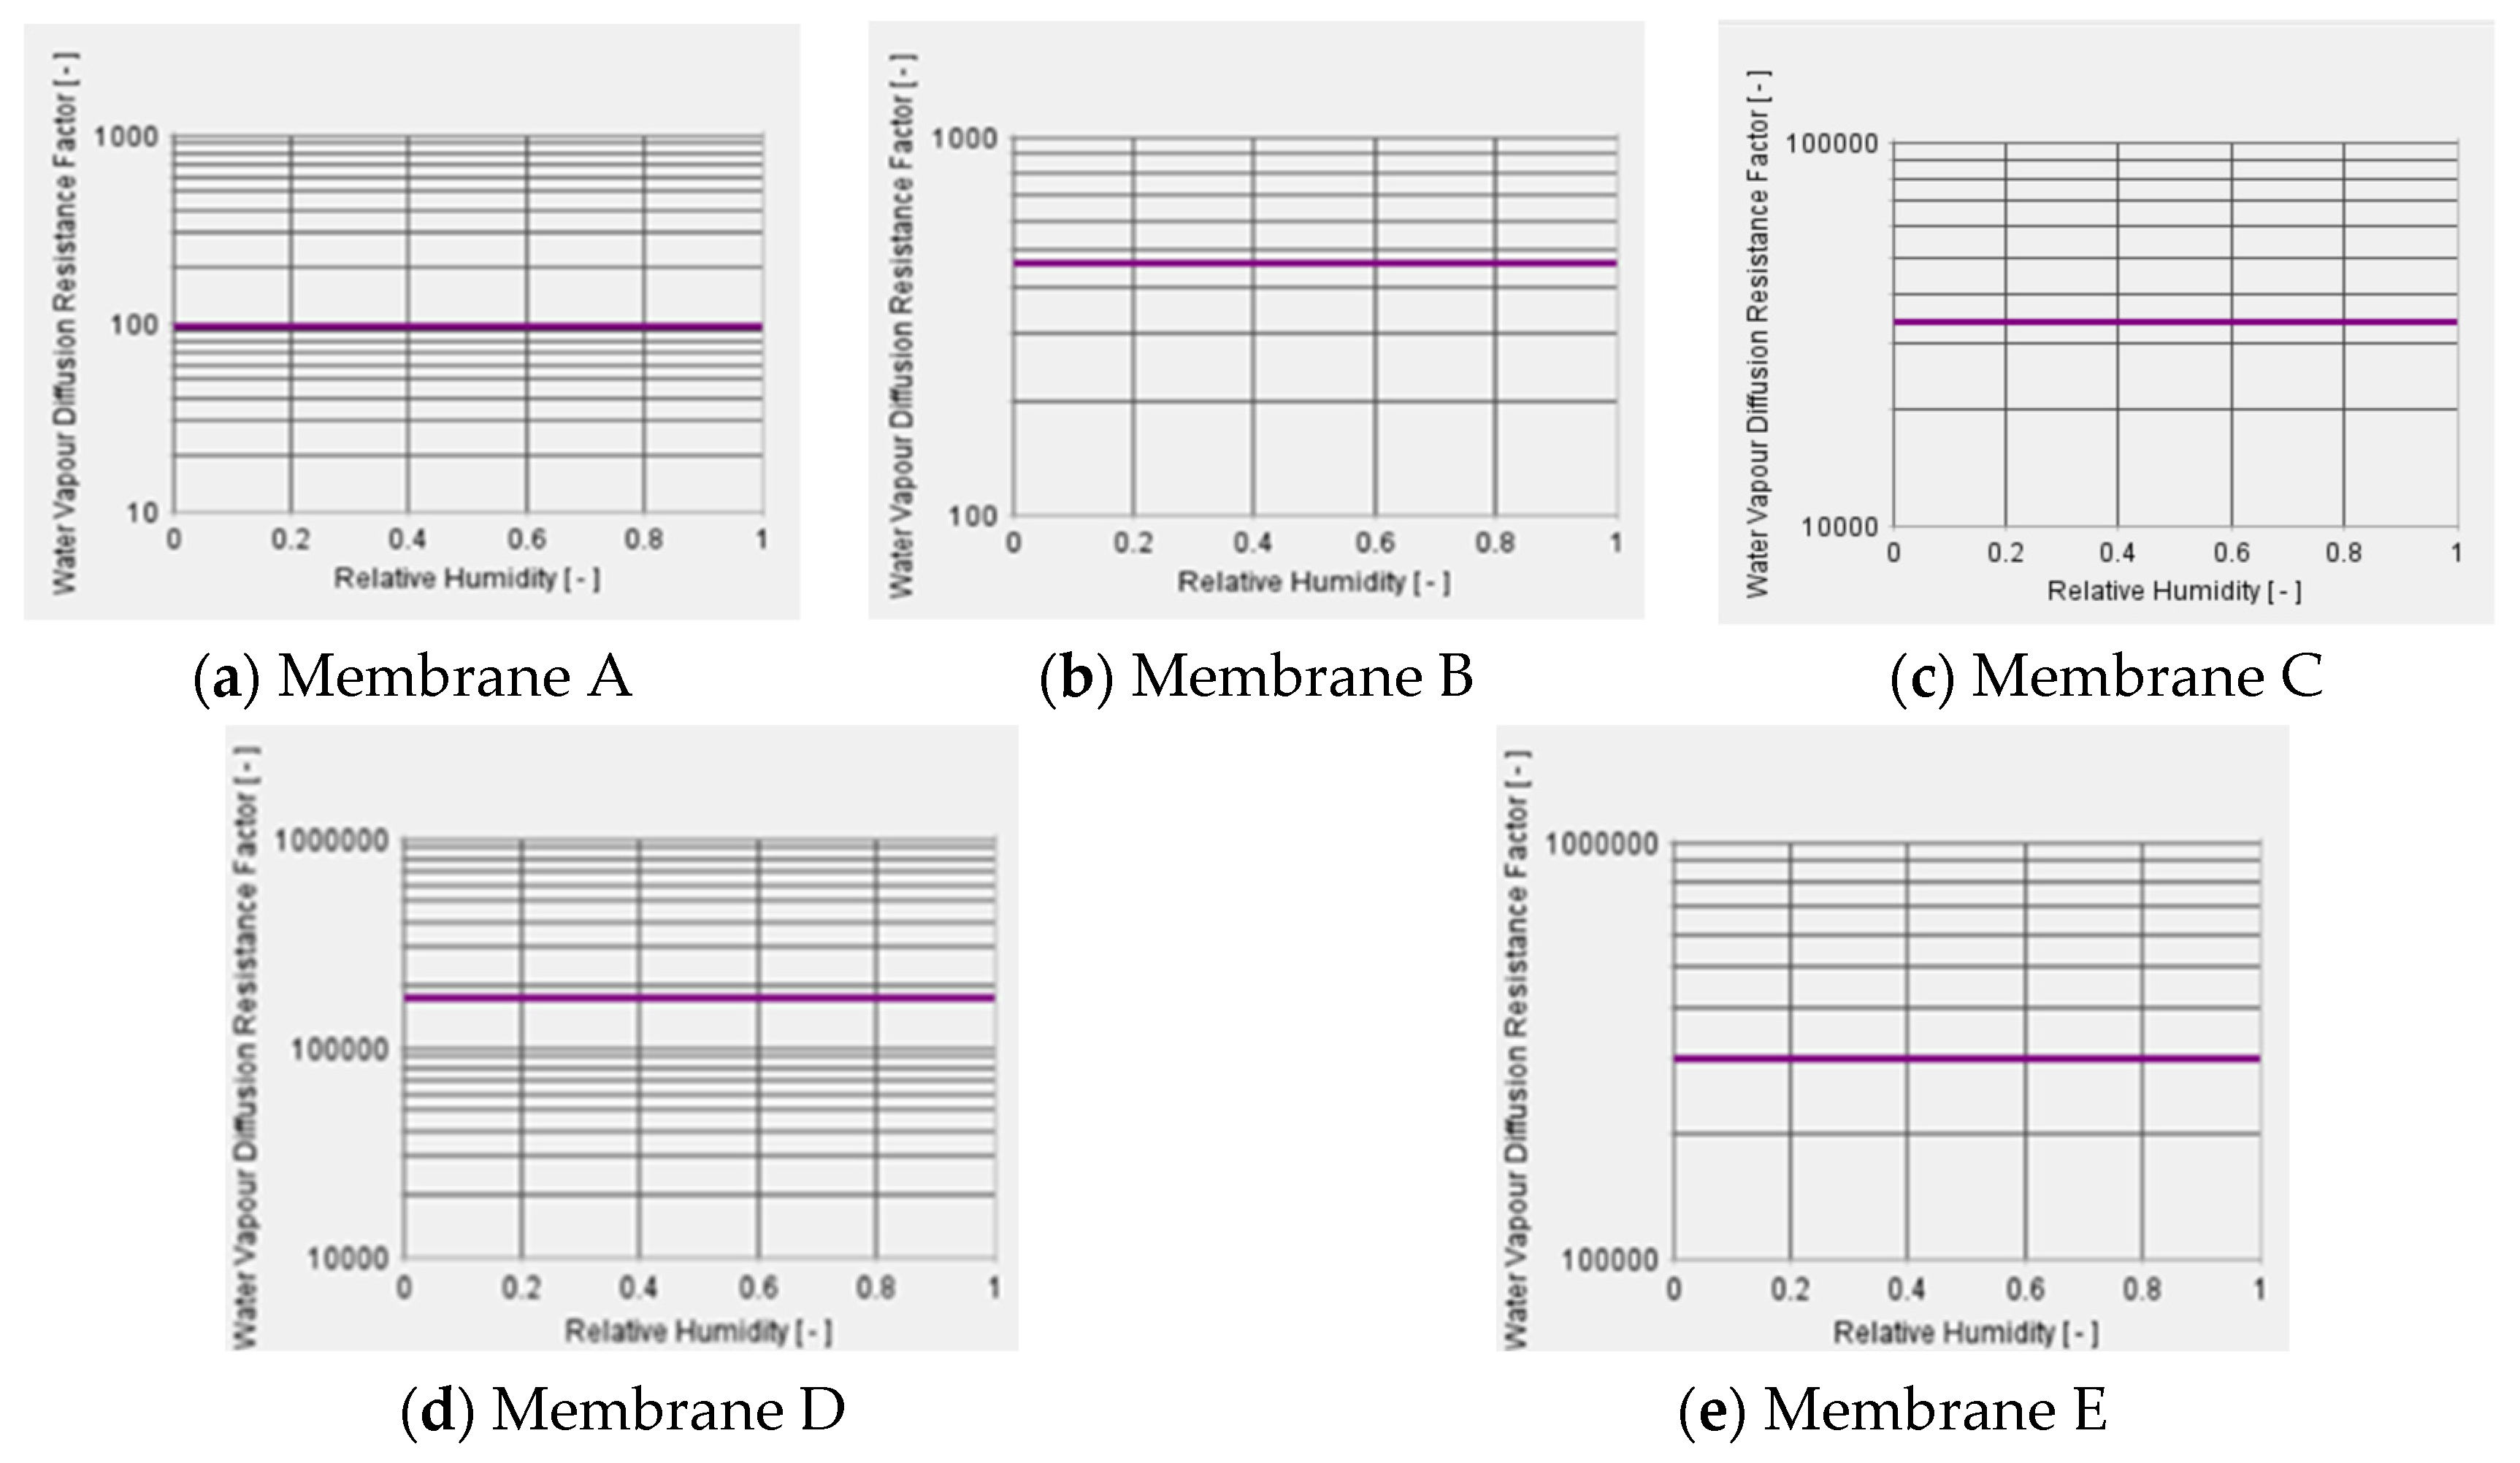
2.2. Single Point Values

The single point water vapour diffusion resistivity test method specifies material water vapour diffusion resistance factor to be measured under environmental conditions of 23 °C and 50% relative humidity. This was one of the conditions established in the hygrothermal test room and the results from this process have been previously reported. The average values obtained from the dry and wet cup tests were applied to the material properties of similar products within the software database. Table 2 shows the measured bulk density and relative humidity-dependent water vapour diffusion resistivity properties that was based on laboratory quantification.
The single point vapour diffusion resistance factor graphs, produced by the software, for the five pliable membranes are shown in Figure 2. Please note, that as these are produced by the software, the Y-axes have different values.

2.3. Establishing and Plotting the Variable Relative Humidity Multipoint Water Vapour Diffusion Resistivity Values after Harmonic Adjustment

The same five membranes were also tested via the gravimetric method at 23 °C and at relative humidities of 35%, 65%, and 80%. Including the single point data mentioned above, this provided water vapour diffusion resistance values for 23 °C and at relative humidities of 35%, 50%, 65%, and 80%. To establish the water vapour diffusion resistance factors, these measured values were modified based on harmonic mean adjustment. This method was previously reported in [6]. This method needed to be applied as the cup measurement process is only providing single points of value between 35% and 80% RH. To obtain effective μ-values across the boundary curve for a given humidity range, the harmonic mean adjustment of the μ(ϕ)-curve was established for the humidity range using data from gravimetric measurement. Therefore, when plotting the boundary curve, it would be misleading to draw a μ(ϕ)-curve by simply plotting the effective μ-values against the mean applied humidity ranges from purely gravimetric measurements alone. As the water vapour resistivity properties of the tested materials was not constant for each of the different relative humidity conditions, plotting these trends would not indicate the exact values from gravimetric measurement. The mean harmonic adjustment enables the μ-values to vary continuously along the cross section of the material, from the highest resistance factor to the minimum resistance factor in varying relative humidity. Figure 3 shows the boundary curves plotted by the software, after the harmonic mean adjustment was applied to the five pliable membranes that were measured within this research. The horizontal water vapour diffusion resistance factors remain unchanged between 0% and 20% RH, and between 85% and 100% RH due to gravimetric measurements not being taken within these conditions.

2.4. Simulation, Procedures, and Input Parameters

The main goal of hygrothermal assessment through simulation is to evaluate the long-term transient transport of the temperature and moisture conditions across any given part of a building envelope, over a given period of time. In Australia, at the time of writing this article, there are no guidelines or national standards for performing hygrothermal modelling. This is in contrast to Europe and North America where, for over two decades, there has been extensive development and acceptance of standards and guideline for conducting, evaluating, and reporting the results of hygrothermal analysis on new and existing building envelopes [31,32]. For instance, ASHRAE 160 standard provides a detailed procedure and guidelines. Similarly, EN 15026 or DIN 4108 (European or Germany standard, respectively) are used in Europe [33,34]. In 2019, the Australian national building regulations, the National Construction Code (NCC), included the first moisture management regulation in Australia within the Health and Amenity clauses. The new clauses included some very simple acceptable construction requirements for Australia’s coolest climates or a performance based hygrothermal simulation pathway for demonstrating that moisture will not accumulate in a new residential buildings [35]. The performance requirement involves a calculation method that includes indoor and outdoor temperature and humidity conditions, rain absorption, wind pressure, solar radiation, and material hygrothermal properties. The calculation needs to demonstrate that
Moisture will not accumulate interior to the primary water control layer within a building envelope; or on the interior surface of the water control layer.”
The regulations do not explicitly describe the procedure, conditions, or parameters for completing the hygrothermal calculation and the manner in which the result from hygrothermal analysis through simulation should be presented [6]. In 2020, the Australian Institute of Refrigeration, Air Conditioning, and Heating (AIRAH) negotiated the majority adoption of the principles in ASHRAE 160, as AIRAH DA07, as part of their multi-national standards and guidelines sharing agreement [36]. Furthermore, parallel research which explored the merits of ASHRAE 160 and DIN4108 and included collaboration with the Fraunhofer Institute of Building Physics established a hygrothermal simulation method that should be used in Australia [37]. This method has been applied in these hygrothermal simulations.

2.5. Selection of Construction Components for Hygrothermal Modelling

As the broader research is exploring hygrothermal and bio-hygrothermal risk associated with Australia’s residential envelope systems, in this task, the most common form of residential external wall was adopted. Figure 4 below shows data from the Commonwealth Scientific and Industrial Research Organisation (CSIRO) indicating that 50% of all low-rise residential buildings, that were certified via the Nationwide House Energy Rating Scheme (NatHERS) portal, used a timber-framed clay masonry veneer (commonly called brick veneer) wall system for external walls. Generally, this wall system comprises, from the exterior to the interior, a 110 mm extruded clay brick, 40 mm ventilated cavity, 1 mm pliable membrane, 90 mm timber framing (with bulk insulation), and 10 mm gypsum plasterboard lining, as shown in Figure 5 below, while Figure 6 shows WUFI simulation profile of the wall assembly
The thermal properties of the timber-framed brick veneer wall system are shown below in Table 3. The wall system has a total R-value of 3.83 (m2 K)/W and a U-value of 0.26 W/m2K. The R-values of these materials were not measured, as they are materials selected from the WUFI database and they have very similar conductivity, density, and specific heat capacity values to the manufacturers’ material data, therefore, the degree of uncertainty is not available in this database. Moreover, the focus of this article is on the impact of single point or multipoint water vapour resistance properties. By varying more than one property (i.e., vapour resistance and conductivity), the results would be less clear due to the need to assess which property is causing differences.
To achieve the aim of this study, there are two wall system scenarios that were hygrothermally simulated, namely:
  • − CR 1 which simulated the timber-framed clay masonry veneer wall with the five different pliable membranes using the single-point value for vapour diffusion resistance factor, and
  • − CR 2 which simulated the timber-framed clay masonry veneer wall with the five different pliable membranes using the harmonic balanced multipoint values for vapour diffusion resistance factor.

2.6. Simulation’s Orientation, Initial Condition, and Surface Transfer Co-Efficient

Orientation is the compass direction towards which a particular part of a building component is facing. In hygrothermal simulation, building orientation is an important factor for the determination of a building’s wetting and drying capacity. The two orientations selected were the northern orientation, which provided maximum solar driven drying capacity and the western orientation, which has been documented to pose significant risk due to its limited drying capacity [37].
The surface transfer coefficient (STC) is important because it indicates the interaction between the climate data and the conditions within the building components. To establish the STC, it is necessary to define heat transfer resistance (m2K/W), diffusion air layer thickness values (SD layer value in m), short-wave (solar) radiation absorptivity, and rainwater absorption factor. The long-wave (thermal) radiation emissivity is often neglected because data on sky and ground counter-radiation are rarely available. For this research, heat transfer resistance of 0.059 m2K/W was calculated for the veneer brick external wall with no coating. The short-wave radiation absorptivity of 0.68 for red brick with standard ground short-wave reflectivity of 0.2 and adhering fraction of rain of 0.7 were selected for exterior surface transfer coefficient. For the interior surface, the heat resistance of 0.125 m2K/W was generated, being a paper-faced plasterboard with a typical latex paint (2) selected with the calculated SD layer is 0.7 m. Table 4 shows a typical initial moisture content in each layer of the wall assembly that was simulated, with an assumption that the initial constant temperature and relative humidity across all the layers of the wall were 23 °C and 80% respectively.

2.7. Exterior environmental conditions

Australia’s climates typically range from hot-humid to cool-temperate, as shown in Figure 7 below. To ensure the usefulness of this research internally, and its possible implication, a third climate type was included from outside Australia, which represents a cooler climate. The three climates selected for this research were:
  • − Darwin—Australia’s most northern capital city, located in a hot and humid climate, with no hourly rain data (tropical savannah; Köppen climate classification—Aw)
  • − Sydney—Australia’s most populous city, with a temperate climate and no hourly rain data (humid subtropical; Köppen climate classification—Cfa), and
  • − Holzkirchen—southern Germany, as shown in Figure 8, a humid temperate, but cooler climate with rain and climate data that include values for hourly rainfall (oceanic/marine west coast climate; Köppen climate classification—Cfb).

2.8. Interior Environmental Conditions

The Australian building regulations for energy efficiency include expectations for heating and cooling within housing. There is some minor variation between heating thermostat set points, subject to climate type, room function, and time of day ranging from 15 °C (bedroom overnight) to 20 °C (living rooms). In a similar manner, cooling thermostat setpoints range from 23 °C in Australia’s cooler climates to 26.5 °C in Australia’s warmest climates. Although ASHARE 160 specifies recommended values for interior heating and cooling, with the heating thermostat set point being 20 °C and the cooling thermostat set point being 25 °C. Nevertheless, this research supplied the heating and cooling set points according to the NatHERS recommendation for different Australia climatic zones. For instance, Table 5 shows the thermostat set points established by NatHERS for the two Australian climates included in this research, which include heating and cooling thermostat set points for Darwin (hot and humid) and Sydney (temperate) [39]. This table also shows that subject to a room’s function, there are periods requiring conditioning and periods when the room is not conditioned. Subject to climate types, the thermostat set points for heating and cooling vary slightly. For example, in the case of a bedroom in a house in Hobart:
  • − between 7:00 a.m. and 9:00 a.m., the room is to be conditioned between 20 °C and 23 °C,
  • − between 10:00 a.m. and 3:00 p.m. the room is unconditioned,
  • − between 4:00 p.m. and 11:00 p.m., the room is to be conditioned between 18 °C and 23 °C, and
  • − between midnight and 6:00 a.m. the room is to be conditioned to between 15 °C and 23 °C.
Therefore, the floating indoor temperature shift for each of the three climates were generated based on the difference between their set point for heating and set point for cooling in accordance with ASHARE 160 guidelines.
The ASHRAE standard expects that the indoor relative humidity must be kept below 70% for at least 80% of time in a year. This is dependent on the moisture generation rate within the simulated building, which in turn is dependent on the number of bedrooms. In Australia, at this stage, there is no requirement for relative humidity control in new housing. This study adopted a 366 m3, 3-bedroom detached building for testing the hypothesis, which is typical of Class 1 low-rise residential buildings in Australia [40]. A standard air exchange rate of 0.2 ACH was adopted for each simulation, which represents the minimum air supply of 30 m3/h per person for hygienic supply of air rate recommended by DIN 1946-6 [24,41].
The final important step in the modelling is the duration of the simulation. WUFI pro 6.5 has the capacity to deliver a long-term transient calculation for several years of 8760 h per a calendar year. Recognising the international trend toward a minimum decade-long simulation, the simulations were completed for a period of 10 years to enable a more detailed analysis and understanding of hygrothermal performance of the wall assembly.
An important aspect of this hygrothermal modelling involves determining if any differences occur in the Mould Growth Index values between the simulations using a single-point value or multipoint value for water vapour diffusion resistance values. This research assessed this risk by using the WUFI VTT add-on, which is a post-processor tool for WUFI Pro 6.5. The VTT Mould Growth Index was developed by the Technical Research Centre of Finland in collaboration with Fraunhofer IBP and has been extensively used for determining the risk of mould growth within building envelopes. The VTT mould growth add-on has the capacity to simulate and present the different amounts of calculated mould growth that may occur on selected materials, including timber [42]. The clay masonry wall includes a structural softwood framing system. The Mould Growth Index algorithm uses the output from moisture conditions for each layer to calculate the intensity of Mould Index values (MI of 0 to 5). Similar to the identified need for decade long hygrothermal simulations, as mentioned above, the effect of mould growth is better seen when the simulation is performed for the same ten-year period. This is because subject to the conditions (climate, orientation, and water vapour diffusion resistance properties), the Mould Index may be less than 3.0 in a single-year, two-year, or five-year simulation, but may well exceed the MI 3.0 before the completion of a ten-year simulation [37]. As we wish for residential buildings to last much longer than ten years, the minimum ten-year hygrothermal and bio-hygrothermal simulation process is increasingly being adopted in national guidelines and standards.

3. Results

The results as discussed below have been grouped under two categories, namely Australia and Germany. The climate data available for Australia did not include rain data, whilst the climate data for Germany did include rain data. The following sections present the summary of the results for the hygrothermal simulation of a typical clay masonry veneer wall assembly that has been used to establish if significant differences occur between single-point and multipoint input values of measured water vapour diffusion resistivity of five pliable membranes. As mentioned earlier, these hygrothermal simulations were completed in north and west orientations in the temperate climate of Sydney and the hot and humid climate of Darwin, and a cooler climatic zone of Holzkirchen in Germany. For this reason, and to establish if simulation results may be affected by the combination of multipoint water vapour diffusion resistivity properties and the inclusion of wind driven rain data, the Holzkirchen climate of Germany was included in this research.

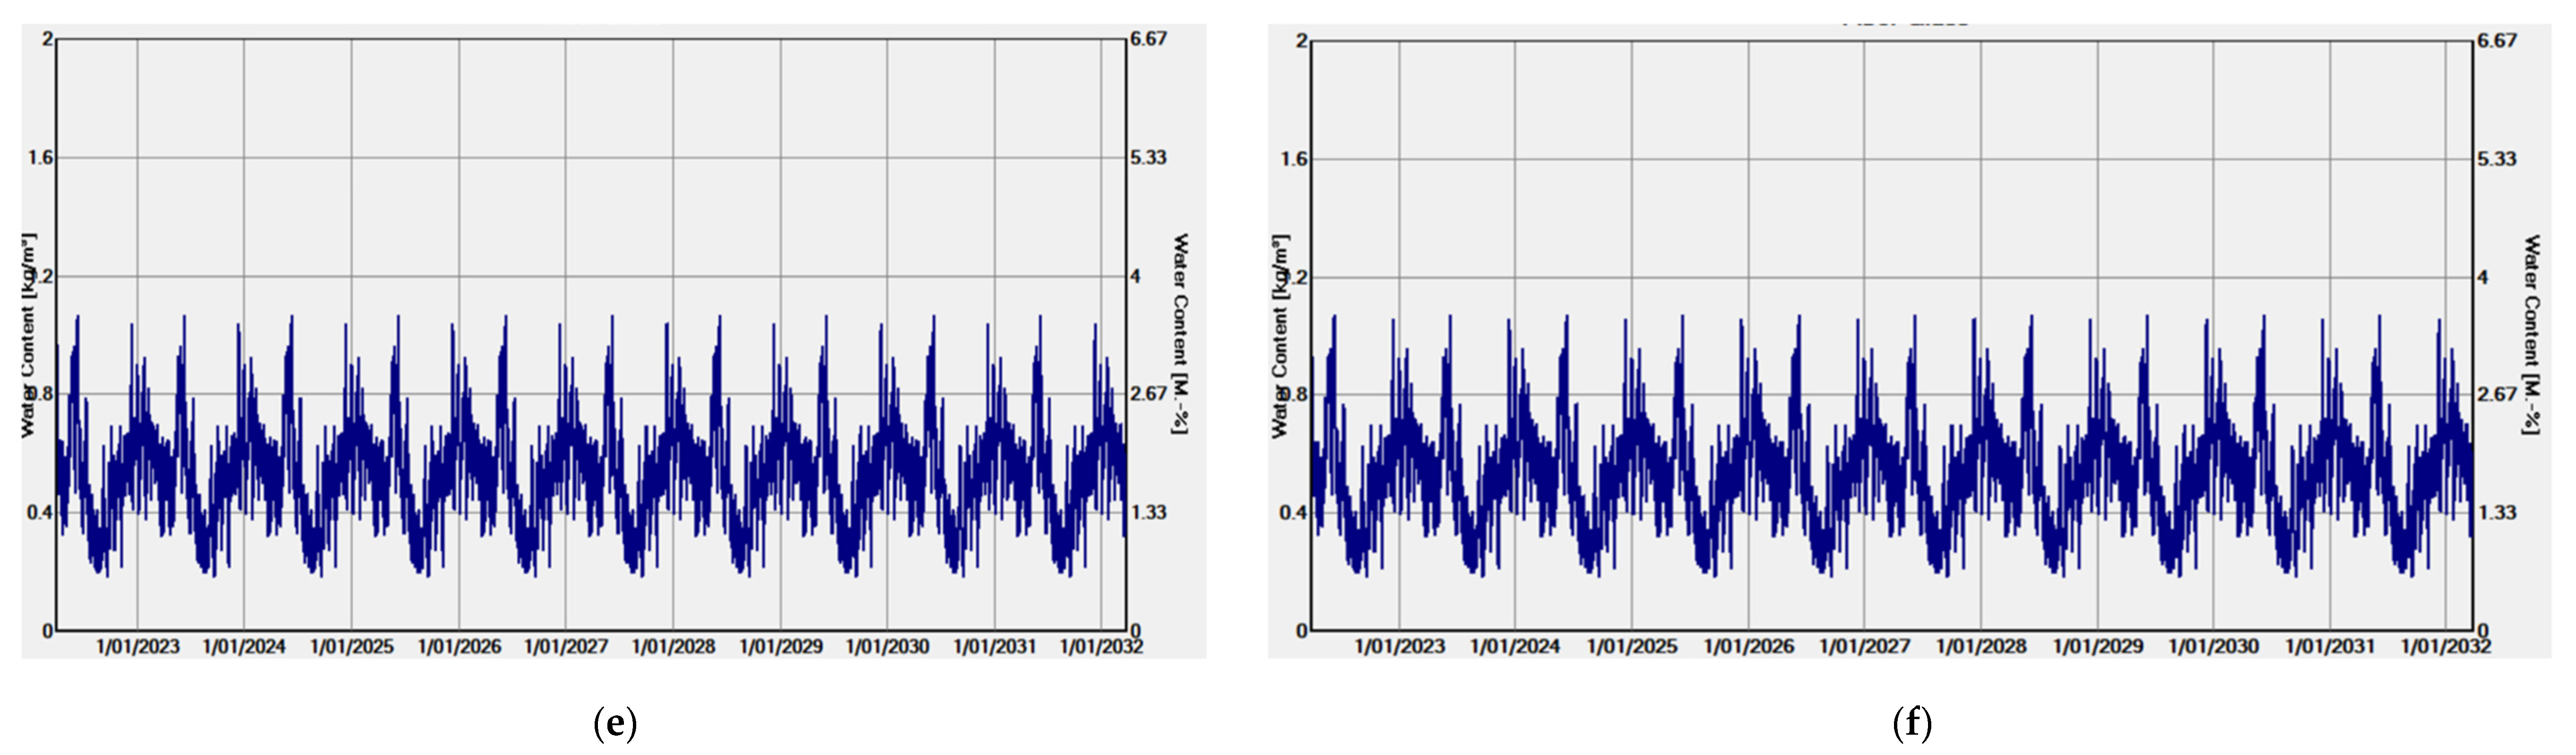
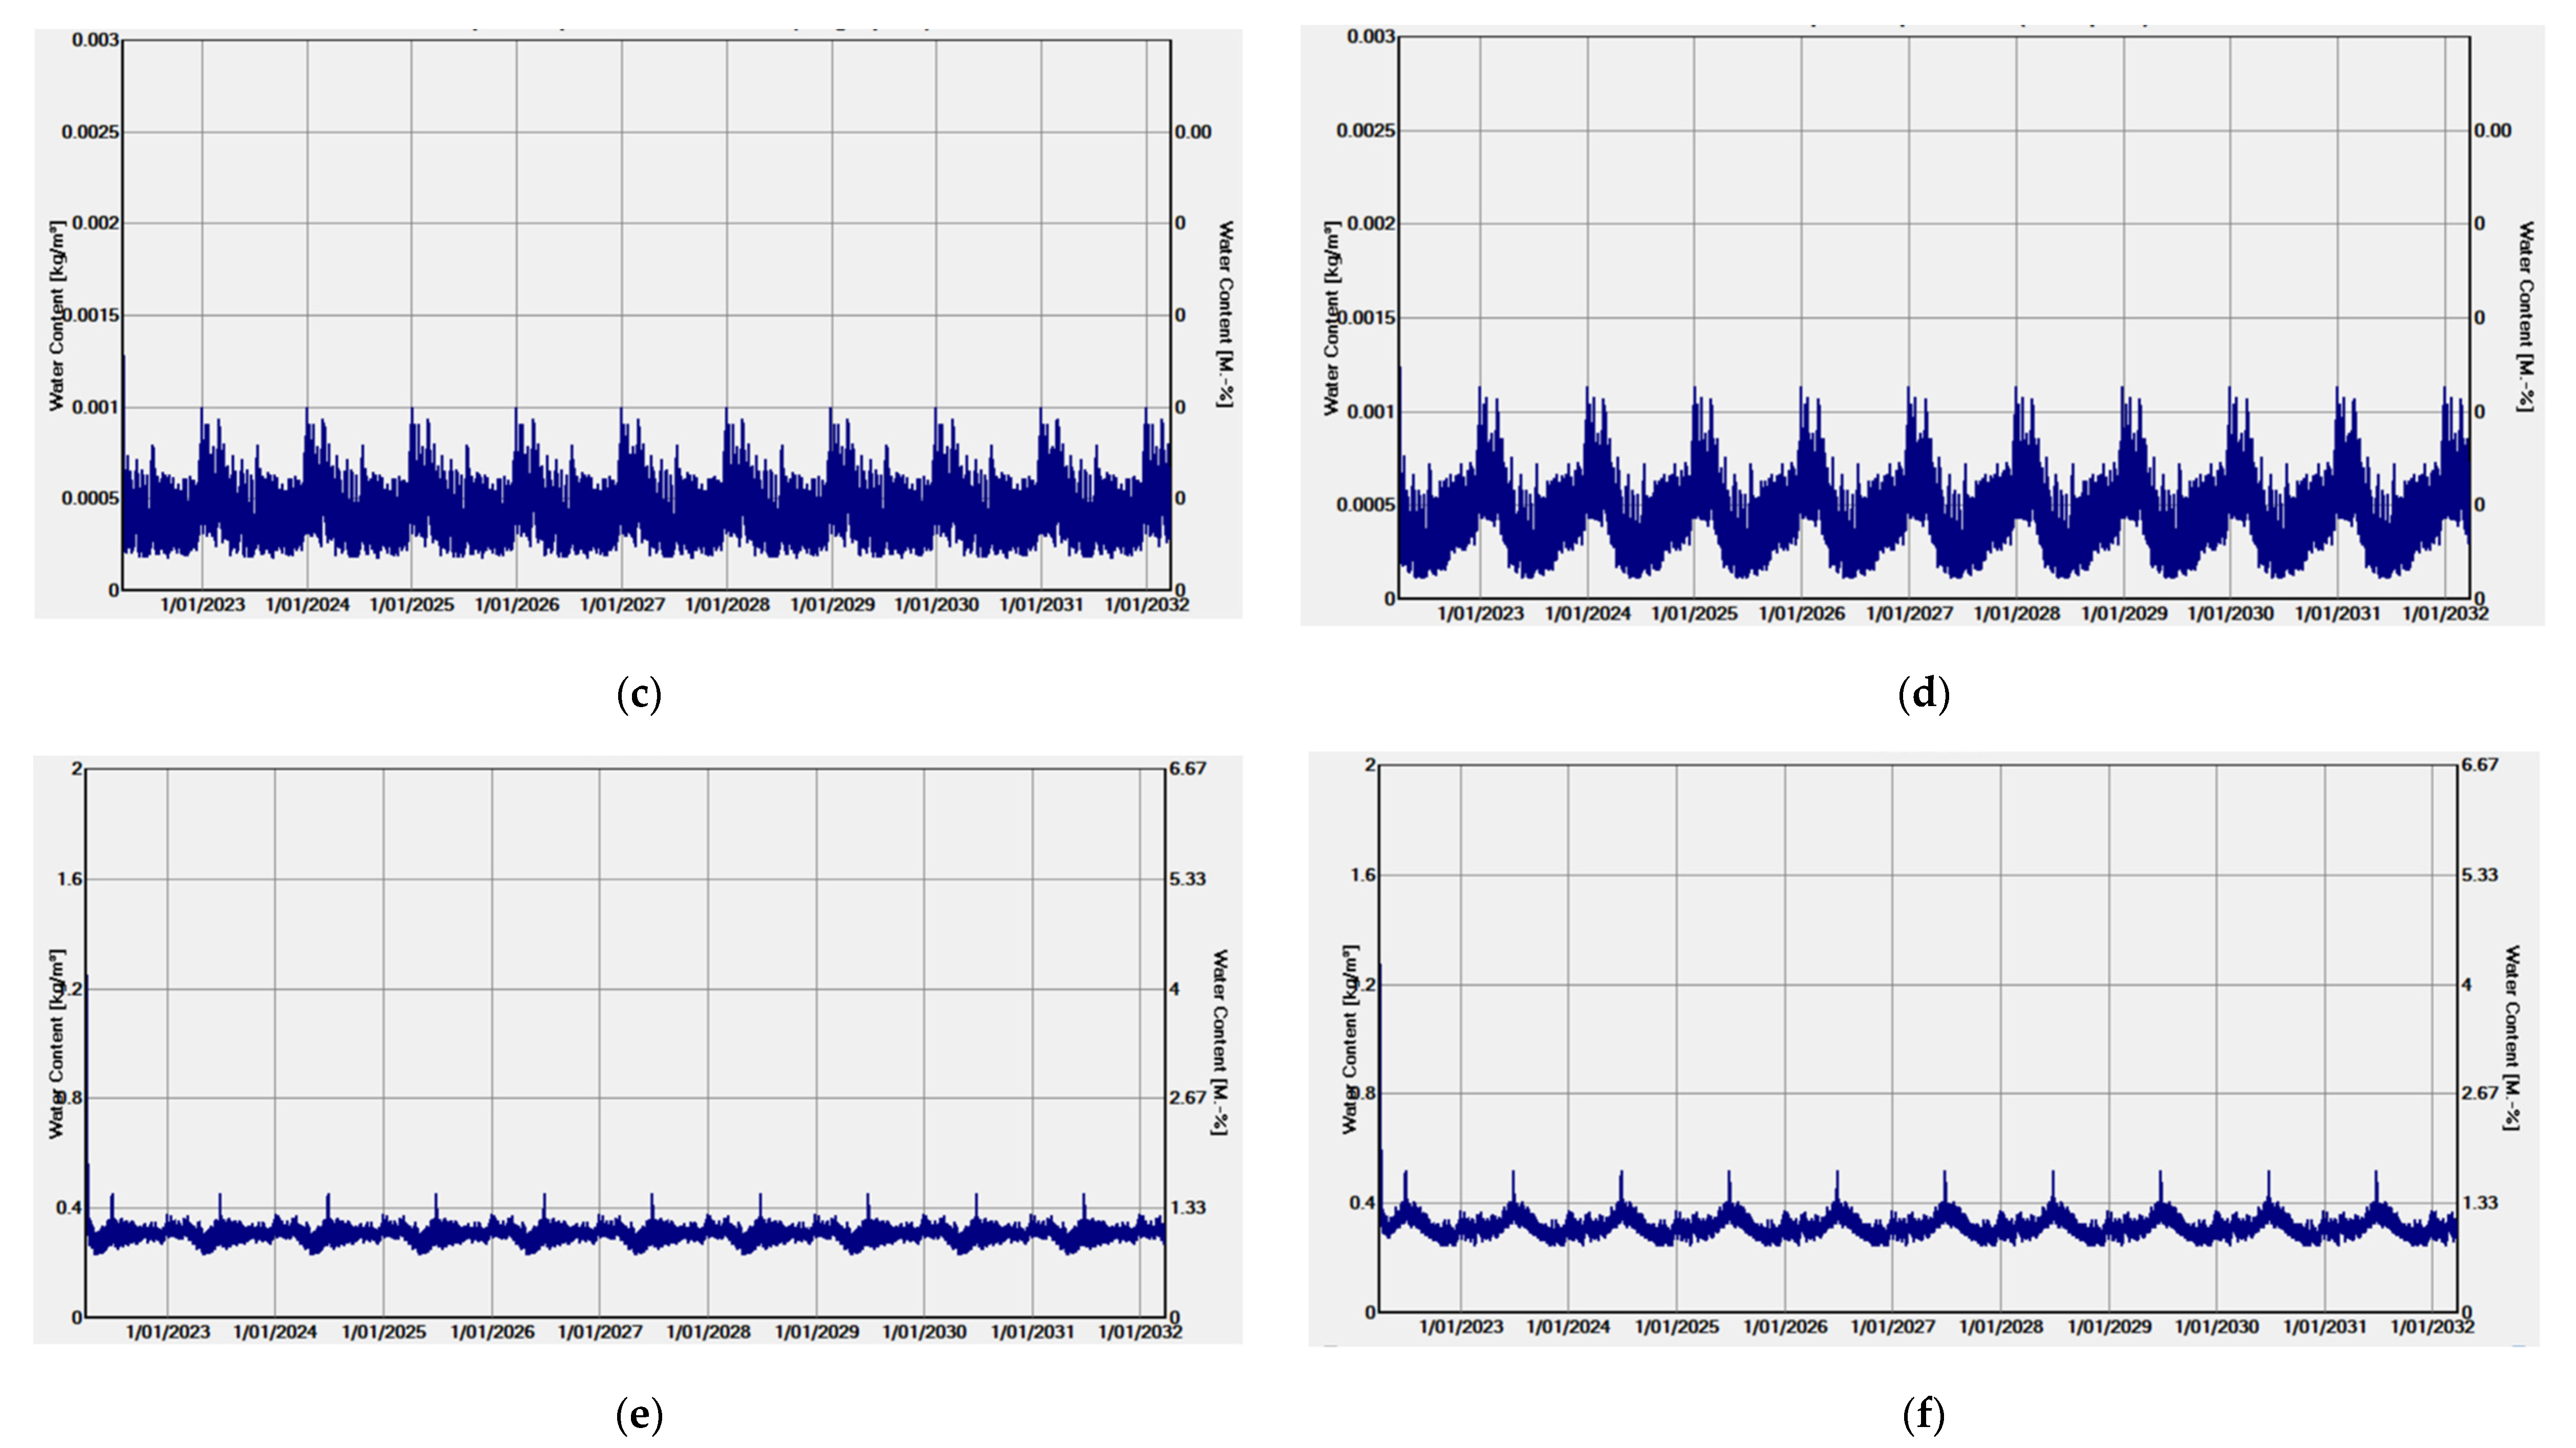
3.1. Result for the Risk of Moisture Accumulation for Two Australian Climates

In Australia, climate files used for performing building energy simulation are provided by the Australian government via the National House Energy Rating Scheme (NatHERS) administrator. These files have no rain data and therefore the hygrothermal simulation cannot generate wind-driven rain and solar irradiation effects. However, Wind-Driven Rain (WDR) is a critical factor that can cause significant effects in the hygrothermal performance of building envelopes [43]. Climate data with wind-driven rain are available in WUFI 6.5 for most developed countries including New Zealand. In contrast, due to the slower adoption of hygrothermal assessment for moisture management in Australia, there are no government-sanctioned Australian climate files imbedded in any hygrothermal simulation tool, including WUFI 6.5. Given this evolving situation, this research first adopted the use of climate files from Energy Plus, which are an EPW format of NatHERS RMY. Although these files have no precipitation data, they are currently the approved climate files for building thermal in Australia. Table A1 and Table A2 in the Appendix A show the summary of the moisture content in each layer of the wall assembly and the hygrothermal numerical calculation qualities for Australia’s temperate climate (Sydney) using the EPW climate file without rain data.
The tables include the results of the simulation in the two orientations (north and west) as mentioned above for the five pliable membranes, for single-point and multipoint vapour resistivity values. Figure 9a–f show some selected hygrothermal simulation graphical results of the calculated moisture content using the Sydney EPW climate file, that does not include precipitation data. Figure 9a,b show the whole of wall system results for the northern and western simulation scenarios. These two figures show that there is no difference in the simulation results that include pliable membranes A and B with single point and multipoint water vapour diffusion resistance values. Figure 9c,d show the results for the pliable membrane layer, and like Figure 9a,b, all four simulation results are identical. To highlight this unlikely outcome, Figure 9e,f show the results for the moisture content within the glass fibre insulation, with Figure 9e showing the single-point and Figure 9f showing the multipoint water vapour diffusion inputs, respectively. These graphs are identical.
Table A3 and Table A4 in the Appendix A show the results obtained for the moisture content observed in the wall assembly for the hot and humid climate of Darwin in both north and westerly orientation when EPW, the climate file, which includes no rain data, was used for simulating the differences between single point and multipoint vapour resistivity values for the five pliable membranes. For the Darwin climate, the moisture performance of pliable membrane A and B is similar to the above-described graphs in Sydney climate. Figure 10a–f shows the graphs of typical moisture contents movement for some selected layers of the wall assembly with either pliable C, D, or E. They have similar behaviour and characteristics in both single point and multipoint vapour resistivity and in both northern and western orientation for Darwin. Like the results for the Sydney example discussed above, there is no discernible difference between the results for the hygrothermal thermal simulations that include the single-point or multipoint water vapour diffusion resistance values.
From these results and graphs, for both Sydney and Darwin climate, it appears that there is no discernible difference between hygrothermal simulations that use a single-point or multipoint water vapour diffusion resistance value. Section 3.3 explores whether these differences in moisture content may affect simulated mould growth risk.

3.2. Result for the Risk of Moisture Accumulation for Holzkirchen Climate

To establish if this unlikely result is due to the lack of precipitation data, the third group of hygrothermal simulations analysed the same wall system and pliable membrane properties but used the climate data from Holzkirchen, which includes hourly precipitation data. Table A5 and Table A6 in the Appendix A show the summary of the moisture content in each layer of the wall assembly and the hygrothermal numerical calculation qualities for Holzkirchen climate with rain data. Figure 11 shows the moisture content of the wall assembly with pliable membrane A, having both single point and multipoint water vapour diffusion resistivity values in north orientation, while Figure 12 and Figure 13 show differences in their presentation for moisture content in west orientation for pliable membrane A in single point and multipoint, respectively. From these graphs, it is evident that the risk of moisture accumulation is high in west orientation due to mix of driven rain and lesser solar radiation occurring on the western orientation of the wall when compared with the northern orientation. Moreover, the risk and magnitude of the moisture accumulation was significantly reduced in pliable membrane A with multipoint vapour resistivity value.
Given that specimen A and B are vapour-permeable membranes, which are open to water vapour diffusion, the presentation of the graph for pliable membrane B is the same in north orientation, while Figure 14 shows the 10-year fluctuation of the moisture content of the wall assembly for pliable membrane B in western orientation for single point vapour resistivity value, which remains unchanged for the multipoint vapour resistivity value. Even though both membranes are permeable, it is evident that the magnitude of moisture flow through the wall assembly is higher in membrane A. This is because membrane A has lower vapour diffusion resistivity than membrane B, which implies that membrane A is more open to water vapour diffusion processes than membrane B (see Figure 2).
Next is the performance of pliable membranes C, D, and E, and it is important to mention that while pliable membrane C is a semi-impermeable membrane, pliable membranes D and E are classed as vapour impermeable, which implies that they allow a very slow vapour diffusion process. The typical graph showing the fluctuations of moisture content across the cross section of the wall assembly for the ten-year period of this simulation in northern orientation is shown in Figure 15. The graph is the same for pliable C, D, and E in north orientation both for single and multipoint resistivity values. However, there is a different result in the western orientation for the graph when considering single point versus multipoint resistivity as shown in Figure 16a,b. For pliable membrane C, there is a slight difference between the response of moisture fluctuation as seen in Figure 17a,b for single point and the multipoint variable relative humidity vapour resistivity in western orientation. Although it appears that these three pliable membranes are similar in behaviour regarding moisture accumulation, Section 3.4 explores whether these differences in moisture content may affect simulated mould growth risk.

3.3. Results of Mould Growth Simulation for Sydney and Darwin Climate with No Rain Data

Figure 18 shows the VTT MI simulation result for all the five pliable membranes using the Sydney climate EPW data, with no precipitation data, whilst Figure 19a,b show the mould growth indices graphs for the entire wall system in the Darwin climate. Figure 19a shows the result from the simulation using the single-point water vapour diffusion resistivity value, whilst Figure 19b shows the results using the multipoint water vapour diffusion resistance values for pliable membrane A. These figures show a discernible difference in the results. At first glance they look the same, but the Y axis of these two graphs is very different, which identifies that the mould index for the multipoint simulation is significantly higher. The mould growth simulations for pliable membranes B, C, D, and E, as shown in Figure 20a below show similar patterns, where there is a difference between simulations that used single-point or multipoint water vapour diffusion resistance values.
To some extent, this result may have been unexpected, as the hygrothermal simulation results had shown no discernible difference in results. However, there is a significant difference in the Mould Index calculations between inputs that included single-point or multipoint water vapour diffusion resistance values.

3.4. Results of Mould Growth Simulation for Holzkirchen Cliamte with Rain Data

The final Mould Growth Index analyses included the VTT add-on simulation of the hygrothermal simulation results for Holzkirchen, which included precipitation data. The VTT Mould Index for the clay masonry wall assembly in the Holzkirchen climate showed significant differences between single-point and multipoint simulation results for each of the five pliable membranes. Figure 21a shows the Mould Index for the wall assembly simulated with single point water vapour resistivity value of pliable membrane C, while Figure 21b shows the index of the wall with membrane C with multipoint water vapour resistivity value. The resultant Mould Indices for these two simulations are significantly different. Figure 21a has a MI greater than 3.0, whilst 21b has a MI of less than 1.5. Figure 22a,b show the Mould Growth Index results for pliable membrane c. Once again, the results from the simulation using a single-point (Figure 22a) and multipoint (Figure 22b) water vapour diffusion resistance values are significantly different. Figure 22a shows a Mould Growth Index greater than 3.0, whilst Figure 22b shows a Mould Growth Index of 0.0.

4. Discussion

The hygrothermal modelling of a typical Australian clay masonry wall system, with five different pliable membranes, using EPW climate files with no precipitation data showed no discernible difference in the moisture accumulation results from inputs using single-point and multipoint water vapour diffusion resistivity values, whereas the hygrothermal simulation results from the same wall system, with the Holzkirchen climate data, which included precipitation data, showed differences in moisture accumulation between simulations that used the single-point and multipoint water vapour diffusion resistance properties. This agrees with previous research which recognised that moisture content in walls may increase as much as ten-fold when wind-driven rain is calculated from precipitation data within a hygrothermal simulation [44,45]. This difference is more observable in results of the western orientated simulation, which has significantly less radiation-driven drying potential [32,46]. This result shows that the EPW climate file with no wind driven data, which is currently used for hygrothermal and moisture load calculation in Australia, may be insufficient for modelling the true nature of a long-term transient hygrothermal behaviour of construction materials. This highlights an immediate need for the development of government sanctioned climate files for hygrothermal simulation, which include precipitation data.
Furthermore, the results from the VTT mould growth simulations showed two distinct patterns. The Mould Index results that did not include the precipitation data (Sydney and Darwin) showed discernible differences between simulations that used single-point or multipoint water vapour diffusion resistance values for the pliable membranes. The same pattern but with a much more significant difference was observable in the Mould Index results that did include the precipitation data for Holzkirchen, which showed significant and discernible differences between simulations that used single-point or multipoint water vapour diffusion resistance values for the pliable membranes.
Table 6 shows a summary of the results from the 60 bio-hygrothermal simulations undertaken for this research. This table highlights the different responses subject to climate type and orientation, which show the effect of the differences between using pliable membrane with single point versus that of multipoint water vapour diffusion resistivity values during hygrothermal and bio-hygrothermal simulation. These results show that in all but 3 of 60 bio-hygrothermal simulations, the resultant Mould Index is different. In all three climates, all the west oriented bio-hygrothermal simulations showed a different Mould Index, while in Darwin, three scenarios presented a different calculated Mould Growth Index. Therefore, subject to climate and membrane variables, the simulated wall system has a significant increased Mould Index.
The differences between the mould growth simulations that used single point or multipoint water vapour diffusion resistance values were very significant, such that a wall system that was deemed climatically unsuitable became climatically suitable.

5. Conclusions

This research explored whether the inclusion of relative humidity-dependent water vapour diffusion resistance properties for pliable building membranes would have an impact on hygrothermal simulation and mould growth simulation results. Contemporary hygrothermal simulation programs normally only use a single-point water vapour diffusion resistance value for each material.
The hygrothermal and bio-hygrothermal simulations considered three climates namely, Sydney and Darwin (Australia), and Holzkirchen (Germany). Significantly, the climate data for Sydney and Darwin did not include precipitation data, whilst the climate data for Holzkirchen did include precipitation data. The wall system used in this analysis was a clay masonry wall system with an insulated timber frame, which is very common in Australian low-rise residential buildings.
The results for the risk of moisture accumulation from the hygrothermal simulations that did not include precipitation data showed no discernible difference between pliable membranes that included single-point and multipoint water vapour diffusion resistance values. However, the results of the Mould Growth Index simulations that did not include precipitation data showed discernible differences between pliable membranes that included single-point and multipoint water vapour diffusion resistance values. The result for the risk of moisture accumulation from the hygrothermal simulations that included precipitation data showed discernible differences between pliable membranes that included single-point and multipoint water vapour diffusion resistance values. Furthermore, the results of the Mould Growth Index simulations that included precipitation data showed significantly discernible differences between pliable membranes that included single-point and multipoint water vapour diffusion resistance values.
This research has identified two important aspects for hygrothermal and bio-hygrothermal (mould growth) simulation. Firstly, precipitation data did affect the results of the moisture accumulation in the hygrothermal and bio-hygrothermal simulations. Secondly, the use of multipoint (or relative humidity dependent water vapour diffusion resistance values) in hygrothermal and bio-hygrothermal simulations provided significantly different results to simulations that use only a single-point water vapour diffusion resistance value. Within this context, all materials that are used within the external envelope of a building should be evaluated to obtain relative humidity-dependent water vapour diffusion resistance properties. These new values should then be incorporated within international hygrothermal simulation material databases.

Author Contributions

T.S.O.—Main author carried out the all the experiments at UTAS, involved in the conceptualization; performed hygrothermal modelling; collected data; analysed data; graphs and visualization; provided the original draft manuscript, and revised manuscript. M.D.—Second author provided guidance for the hygrothermal simulation, project administration; edited and provided revision to the manuscript. L.W.—Third author involved in the editing of the manuscript, provided supervision. H.K.—Fourth author provided guidance for the laboratory operation, provided hygrothermal simulation software (WUFI), provided supervision on simulation; provided supervision on analysis of simulation result, provided input to the revision of the manuscript. All authors have read and agreed to the published version of the manuscript.

Funding

This research was co-funded by Commonwealth Scientific Industrial Research Organisation (CSIRO), grant number 00004612.

Conflicts of Interest

The authors declare no conflict of interest.

Nomenclature

ABCBAustralian Building Codes Board
ACHAir Exchange
AIRAHAustralian Institute for Refrigeration, Air-conditioning, and Heating
ASHRAEAmerican Society for Heating, Refrigeration, and Air-conditioning Engineers
ASTMAmerican Society for Testing and Materials
BOMBureau of Meteorology, Australia
BSBritish Standards
CENEuropean committee for Standardisation (in French: Comité Européen de Normalisation)
CSIROCommonwealth Scientific and Industrial Research Organisation, Australia
DINDeutsches Institut für Normung
ENEuropean standard (in German: Europaische Norm)
EPWEnergy Plus Weather
HAMHeat, Air, and Moisture
HRAHygrothermal Risk Assessment
HVACHeating, Ventilation, and Air-Conditioning
IAQIndoor Air Quality
IEQIndoor Environmental Quality
ISOInternational Organisation for Standardisation
MIMould Index
NatHERSNational House Energy Rating Scheme, Australia
NCCNational Construction Code, Australia
ϕRelative Humidity (RH) (%)
qHeat Flux (J/m2s)
lThermal Conductivity (J/msK)
RMYReference Meteorological Year
R-valuesThermal Resistance (m2 K)/W
SDDiffusion Air layer Thickness (m)
STCSurface Transfer Coefficient
T Temperature (°C)
μWater Vapour Resistance Factor
WDRWind-Driven Rain
WHOWorld Health Organisation
WUFIWärme Und Feuchte Instationär (heat and moisture transiency)
WVWater Vapour
WVTRWater Vapour Transmission Rate

Appendix A

Table A1. Hygrothermal calculation result for Sydney climate on EPW climate file without rain data.
Moisture Content in Layer after Simulation
MaterialsPliable Membrane APliable Membrane BPliable Membrane C
Single PointMultipointSingle PointMultipointSingle PointMultipoint
OrientationNorthWestNorthWestNorthWestNorthWestNorthWestNorthWest
External brick veneer (kg/m2)4.384.844.384.844.404.874.404.864.434.894.424.88
40 mm air cavity layer (kg/m2)0.010.010.010.010.010.010.010.010.010.010.010.01
1 mm vapour control layer (kg/m2)0.000000000004.474.96
Insulation layer (kg/m2)0.550.590.550.590.490.530.500.530.440.480.440.48
Interior plaster (kg/m2)3.623.773.643.793.473.583.473.583.313.443.313.44
Total water content after simulation (kg/m2)1.241.241.241.241.241.241.241.241.241.241.251.25
Simulation numerical qualities
Balance 1 (kg/m2)−0.68−0.62−0.68−0.62−0.68−0.62−0.68−0.63−0.68−0.63−0.69−0.63
Balance 2 (kg/m2)−0.70−0.61−0.69−0.61−0.70−0.62−0.70−0.64−0.73−0.64−0.720.63
Number of convergence errors000000000000
Table A2. Hygrothermal modelling calculation result for Sydney climate on EPW file without rain data.
Moisture Content after Simulation
MaterialsPliable Membrane DPliable Membrane E
Single PointMultipointSingle PointMultipoint
OrientationNorthWestNorthWestNorthWestNorthWest
External brick veneer (kg/m2)9.24.894.434.894.434.894.444.89
40 mm air cavity layer (kg/m2)0.010.010.010.010.010.010.010.01
1 mm vapour control layer (kg/m2)0.000.000.000.000.000.000.000.00
Insulation layer (kg/m2)1.870.480.440.480.440.480.390.48
Interior plaster (kg/m2)8.753.443.313.443.313.443.013.31
Total water content after simulation (kg/m2)1.241.241.241.241.241.241.241.24
SimulationNumericalQualities
Balance 1 (kg/m2)0.67−0.63−0.68−0.63−0.68−0.63−0.63−0.63
Balance 2 (kg/m2)0.71−0.64−0.73−0.640.64−0.64−0.64−0.64
Number of convergence errors00000000
Table A3. Hygrothermal calculation result for Darwin climate on EPW climate file without rain data.
Moisture Content in Layer after Simulation
MaterialsPliable Membrane APliable Membrane BPliable Membrane C
Single PointMultipointSingle PointMultipointSingle PointMultipoint
OrientationNorthWestNorthWestNorthWestNorthWestNorthWestNorthWest
External brick veneer (kg/m2)4.664.934.564.934.674.954.674.959.29.29.29.2
40 mm air cavity layer (kg/m2)0.010.010.010.010.010.010.010.010.010.010.010.01
1 mm vapour control layer (kg/m2)000000000000
Insulation layer (kg/m2)0.961.000.991.030.710.730.720.751.871.871.871.87
Interior plaster (kg/m2)6.566.436.746.595.75.705.745.748.757.398.737.34
Total water content after simulation (kg/m2)1.241.241.241.241.241.241.241.241.241.241.241.25
Simulation numerical qualities
Balance 1 (kg/m2)−0.57−0.54−0.57−0.54−0.60−0.57−0.60−0.570.670.610.670.61
Balance 2 (kg/m2)−0.83−0.76−0.83−0.76−0.84−0.75−0.84−0.750.710.620.710.61
Number of convergence errors000000000000
Table A4. Hygrothermal calculation result for Darwin climate on EPW climate file without rain data.
Moisture Content after Simulation
MaterialsPliable Membrane DPliable Membrane E
Single PointMultipointSingle PointMultipoint
OrientationNorthWestNorthWestNorthWestNorthWest
External brick veneer (kg/m2)4.745.034.745.034.745.034.745.03
40 mm air cavity layer (kg/m2)0.010.010.010.010.010.010.010.01
1 mm vapour control layer (kg/m2)0.000.000.000.000.000.000.000.00
Insulation layer (kg/m2)0.300.310.300.310.300.300.300.30
Interior plaster (kg/m2)3.423.443.413.443.413.433.413.44
Total water content after simulation (kg/m2)1.241.241.241.241.241.241.241.24
SimulationNumericalQualities
Balance 1 (kg/m2)−0.65−0.62−0.65−0.62−0.65−0.62−0.65−0.62
Balance 2 (kg/m2)−0.80−0.70−0.8−0.7−0.8−0.70−0.80−0.7
Number of convergence errors00000000
Table A5. Hygrothermal calculation result for Holzkirchen with wind-driven rain data.
Moisture Content in Layer during Simulation
MaterialsPliable Membrane APliable Membrane BPliable Membrane C
Single PointMultipointSingle PointMultipointSingle PointMultipoint
OrientationNorthWestNorthWestNorthWestNorthWestNorthWestNorthWest
External brick veneer (kg/m2)7.41146.397.0188.597.0188.597.2489.586.1189.4214.8689.32
40 mm air cavity layer (kg/m2)0.010.020.010.020.010.020.010.020.018.340.010.02
1 mm vapour control layer (kg/m2)0.000.020.010.020.010.020.010.00.000.0829.2448.71
Insulation layer (kg/m2)0.653.296.0412.926.0412.923.1510.7460.5330.706.279.89
Interior plaster (kg/m2)3.093.813.983.933.983.933.953.924.013.856.303.92
Total water content after simulation (kg/m2)1.241.071..3510.951.3510.951.1210866.1612.971.8210.8
Simulation numerical qualities
Balance 1 (kg/m2)−0.3415.060.119.540.119.54−0.139.454.9211.560.059.38
Balance 2 (kg/m2)−0.23−153.360.20−6.8.40.26.84−0.037.374.9−67.920.1110.24
Number of convergence errors0124620510215102149584099002535
Table A6. Hygrothermal calculation result for Holzkirchen with wind-driven rain data.
Moisture Content after Simulation
MaterialsPliable Membrane DPliable Membrane E
Single PointMultipointSingle PointMultipoint
OrientationNorthWestNorthWestNorthWestNorthWest
External brick veneer (kg/m2)6.1090.706.1188.296.1089.266.1189.32
40 mm air cavity layer (kg/m2)0.0117.040.010.020.012.500.012.46
1 mm vapour control layer (kg/m2)0.000.050.000.020.000.040.010.07
Insulation layer (kg/m2)65.1931.0463.7330.5366.0830.6861.5430.43
Interior plaster (kg/m2)4.013.854.013.934.013.854.013.85
Total water content after simulation (kg/m2)6.58813.496.4512.56.6812.726.2512.7
SimulationNumericalQualities
Balance 1 (kg/m2)5.3312.085.2011.095.4111.315.0111.29
Balance 2 (kg/m2)5.32−78.205.19−45.065.40−49.714.99−65.08
Number of convergence errors409644280032910391090

References

  1. Olaoye, T.; Dewsbury, M.; Künzel, H. Empirical Investigation of the Hygrothermal Diffusion Properties of Permeable Building Membranes Subjected to Variable Relative Humidity Condition. Energies 2021, 14, 4053. Available online: https://www.mdpi.com/1996-1073/14/13/4053 (accessed on 10 July 2022). [CrossRef]
  2. AS/NZS 4200:1; Pliable Building Membranes and Underlays. Council of Standards Australia: Sydney, NSW, Australia, 2017.
  3. Künzel, H. Adapted vapour control for durable building enclosures. In Proceedings of the 10th International Conference on Durability of Building Materials & Components, Lyon, France, 17–20 April 2005. [Google Scholar]
  4. Olaoye, T.S.; Dewsbury, M. Establishing an environmentally controlled room to quantify water vapour resistivity properties of construction materials. In Revisiting the Role of Architecture for ’Surviving’ Development. In Proceedings of the 53rd International Conference of the Architectural Science Association 2019, Roorkee, India, 28–30 November 2019; pp. 675–684. [Google Scholar]
  5. Hens, H.L. Combined heat, air, moisture modelling: A look back, how, of help? Build. Environ. 2015, 91, 138–151. [Google Scholar] [CrossRef]
  6. Olaoye, T.S.; Dewsbury, M.; Künzel, H. Laboratory Measurement and Boundary Conditions for the Water Vapour Resistivity Properties of Typical Australian Impermeable and Smart Pliable Membranes. Buildings 2021, 11, 509. [Google Scholar] [CrossRef]
  7. Künzel, H.M. Simultaneous Heat and Moisture Transport in Building Components. One-and Two-Dimensional Calculation Using Simple Parameters; IRB-Verlag: Stuttgart, Germany, 1995. [Google Scholar]
  8. Olaoye, T.; Dewsbury, M.; Kunzel, H.; Nolan, G. An empirical measurement of the water vapour resistivity properties of typical australian pliable membrane. In Proceedings of the The 54th International Conference of the Architectural Science Association (ANZAScA), Auckland, New Zealand, 25–28 November 2020; pp. 161–170. [Google Scholar]
  9. WHO. Who Guidelines for Indoor Air Quality: Dampness and Mould; WHO Regional Office for Europe Scherfigsvej 8 DK-2100 Copenhagen Ø; WHO: Copenhagen, Denmark, 2009. [Google Scholar]
  10. Ramos, N.M.; Delgado, J.Q.; Barreira, E.; De Freitas, V.P. Hygrothermal properties applied in numerical simulation: Interstitial condensation analysis. J. Build. Apprais. 2009, 5, 161–170. [Google Scholar] [CrossRef]
  11. Defo, M.; Lacasse, M.; Laouadi, A. A comparison of hygrothermal simulation results derived from four simulation tools. J. Build. Phys. 2021, 45, 432–456. [Google Scholar] [CrossRef]
  12. Mendes, N.; Oliveira, R.C.L.F.; Santos, G.D. Domus 2.0: A whole-building hygrothermal simulation program. Proc. Build. Simul. 2003, 2003, 863–870. [Google Scholar]
  13. Olaoye, T.S.; Dewsbury, M.; Kunzel, H. A Method for Establishing a Hygrothermally Controlled Test Room for Measuring the Water Vapor Resistivity Characteristics of Construction Materials. Energies 2020, 14, 4. [Google Scholar] [CrossRef]
  14. Langmans, J.; Klein, R.; Roels, S. Numerical and experimental investigation of the hygrothermal response of timber frame walls with an exterior air barrier. J. Build. Phys. 2013, 36, 375–397. [Google Scholar] [CrossRef]
  15. Lelievre, D.; Colinart, T.; Glouannec, P. Hygrothermal behavior of bio-based building materials including hysteresis effects: Experimental and numerical analyses. Energy Build. 2014, 84, 617–627. [Google Scholar] [CrossRef]
  16. López, O.; Torres, I.; Guimarães, A.; Delgado, J.; de Freitas, V.P. Inter-laboratory variability results of porous building materials hygrothermal properties. Constr. Build. Mater. 2017, 156, 412–423. [Google Scholar] [CrossRef]
  17. Mukhopadhyaya, P.; Kumaran, M.K.; Lackey, J.; Normandin, N.; Reenen, D.V.; Tariku, F. Hygrothermal Properties of Exterior Claddings, Sheathing Boards, Membranes, and Insulation Materials for Building Envelope Design. In ASHRAE; 2007. Available online: https://web.ornl.gov/sci/buildings/conf-archive/2007%20B10%20papers/121_Mukhopadhyaya.pdf (accessed on 4 November 2021).
  18. Slimani, Z.; Trabelsi, A.; Virgone, J.; Freire, R.Z. Study of the Hygrothermal Behavior of Wood Fiber Insulation Subjected to Non-Isothermal Loading. Appl. Sci. 2019, 9, 2359. [Google Scholar] [CrossRef] [Green Version]
  19. Freire, R.Z.; Dos Santos, G.H.; Coelho, L.D.S. Hygrothermal Dynamic and Mould Growth Risk Predictions for Concrete Tiles by Using Least Squares Support Vector Machines. Energies 2017, 10, 1093. [Google Scholar] [CrossRef] [Green Version]
  20. Muñoz-González, C.M.; León-Rodríguez, Á.L.; Medina, R.C.S.; Teeling, C. Hygrothermal performance of worship spaces: Preservation, comfort, and energy consumption. Sustainability 2018, 10, 3838. [Google Scholar] [CrossRef] [Green Version]
  21. Akkurt, G.; Aste, N.; Borderon, J.; Buda, A.; Calzolari, M.; Chung, D.; Costanzo, V.; Del Pero, C.; Evola, G.; Cardenas, H.E.H.; et al. Dynamic thermal and hygrometric simulation of historical buildings: Critical factors and possible solutions. Renew. Sustain. Energy Rev. 2019, 118, 109509. [Google Scholar] [CrossRef]
  22. Hansen, T.K.; Bjarløv, S.P.; Peuhkuri, R.H.; Harrestrup, M. Long term in situ measurements of hygrothermal conditions at critical points in four cases of internally insulated historic solid masonry walls. Energy Build. 2018, 172, 235–248. [Google Scholar] [CrossRef]
  23. Coelho, G.B.; Silva, H.E.; Henriques, F.M. Calibrated hygrothermal simulation models for historical buildings. Build. Environ. 2018, 142, 439–450. [Google Scholar] [CrossRef]
  24. Strang, M.; Leardini, P.; Brambilla, A.; Gasparri, E. Mass Timber Envelopes in Passivhaus Buildings: Designing for Moisture Safety in Hot and Humid Australian Climates. Buildings 2021, 11, 478. [Google Scholar] [CrossRef]
  25. Setter, L.; Smoorenburg, E.; Wijesuriya, S.; Tabares-Velasco, P.C. Energy and hygrothermal performance of cross laminated timber single-family homes subjected to constant and variable electric rates. J. Build. Eng. 2019, 25, 100784. [Google Scholar] [CrossRef]
  26. Busser, T.; Pailha, M.; Piot, A.; Woloszyn, M. Simultaneous hygrothermal performance assessment of an air volume and surrounding highly hygroscopic walls. Build. Environ. 2019, 148, 677–688. [Google Scholar] [CrossRef]
  27. Chang, S.J.; Yoo, J.; Wi, S.; Kim, S. Numerical analysis on the hygrothermal behavior of building envelope according to CLT wall assembly considering the hygrothermal-environmental zone in Korea. Environ. Res. 2020, 191, 110198. [Google Scholar] [CrossRef]
  28. Schmidt, E.; Riggio, M. Monitoring Moisture Performance of Cross-Laminated Timber Building Elements during Construction. Buildings 2019, 9, 144. [Google Scholar] [CrossRef] [Green Version]
  29. Lackey, J.C.; Marchand, R.G.; Kumaran, M.K. A logical extension of the astm standard e96 to determine the dependence of water vapour transmission on relative humidity. In Insulation Materials: Testing and Applications, 3rd Volume; ASTM International: West Conshohocken, PA, USA, 1997. [Google Scholar]
  30. Feng, C.; Janssen, H.; Feng, Y.; Meng, Q. Hygric properties of porous building materials: Analysis of measurement repeatability and reproducibility. Build. Environ. 2015, 85, 160–172. [Google Scholar] [CrossRef]
  31. Glass, S.V.; Gatland, S.D., II; Ueno, K.; Schumacher, C.J. Analysis of improved criteria for mold growth in ashrae standard 160 by comparison with field observations. In Advances in Hygrothermal Performance of Building Envelopes: Materials, Systems and Simulations, ASTM STP1599; Mukhopadhyaya, P., Fisler, D., Eds.; ASTM International: West Conshohocken, PA, USA, 2017; pp. 1–27. [Google Scholar]
  32. Künzel, H.M.; Zirkelbach, D. Advances in hygrothermal building component simulation: Modelling moisture sources likely to occur due to rainwater leakage. J. Build. Perform. Simul. 2013, 6, 346–353. [Google Scholar] [CrossRef]
  33. Künzel, H.M. Accounting for unintended moisture sources in hygrothermal building analysis. In Proceedings of the 10th Nordic Symposyum of Building Physics, Lund, Sweden, 15–19 June 2014; pp. 947–953. [Google Scholar]
  34. Ashrae Standard 160; Criteria for moisture-control design analysis in buildings. American Society of Heating, Refrigerating and Air-Conditioning Engineers (ASHARE): Atlanta, GA, USA, 2016.
  35. ABCB. Ncc 2019 Building Code of Australia—Volume Two; Australia Building Code Board: Canberra, Australia, 2019; Volume 2. [Google Scholar]
  36. AIRAH. Criteria for moisture control design analysis in buildings. In Da07; Australian Institute of Refrigeration, Air Conditioning and Heating: Melbourne, Australia, 2020. [Google Scholar]
  37. Nath, S.; Dewsbury, M.; Watson, P.; Lovell, H.; Kunzel, H. A bio-hygrothermal mould growth analysis of typical australian residential wall systems. In Proceedings of the 54th International Conference of the Architectural Science Association (ANZAScA) 2020, School of Future Environments, Built Environment Engineering, Auckland University of Technology, Architectural Science Association, Virtual, Auckland, New Zealand, 26–27 November 2020; pp. 1–10. [Google Scholar]
  38. Commonwealth Scientific Industrial Research Organisation. Australian Housing Data: Wall Construction. Available online: https://ahd.csiro.au/dashboards/construction/ (accessed on 28 December 2021).
  39. The NatHERS National Administrator. NatHERS Software Accreditation Protocol. Available online: https://www.nathers.gov.au/sites/default/files/2019-10/2019%20NatHERS%20Software%20Accreditation%20Protocol.pdf2019 (accessed on 15 June 2022).
  40. Dewsbury, M.; Soudan, A.; Su, F.; Geard, D.; Cooper, A.; Law, T. Condensation Risk Mitigation for Tasmanian Housing; University of Tasmania: Tasmania, Australia, 2018. [Google Scholar]
  41. Din 1946-6; Ventilation and Air Conditioning—Part 6: Ventilation for Residential Buildings—General Requirements, Requirements for Design, Construction, Commissioning and Handover as Well as Maintenance. Deutsches Institut für Normung: Berlin, Germany, 2019.
  42. Viitanen, H.; Krus, M.; Ojanen, T.; Eitner, V.; Zirkelbach, D. Mold Risk Classification Based on Comparative Evaluation of Two Established Growth Models. Energy Procedia 2015, 78, 1425–1430. [Google Scholar] [CrossRef]
  43. Vandemeulebroucke, I.; Defo, M.; Lacasse, M.A.; Caluwaerts, S.; Van Den Bossche, N. Canadian initial-condition climate ensemble: Hygrothermal simulation on wood-stud and retrofitted historical masonry. Build. Environ. 2021, 187, 107318. [Google Scholar] [CrossRef]
  44. Karagiozis, A.N.; Salonvaara, M.; Holm, A.; Kuenzel, H. Influence of wind-driven rain data on hygrothermal performance. In Proceedings of the Eighth International IBPSA Conference, Eindhoven, The Netherlands, 11–14 August 2003; pp. 627–634. [Google Scholar]
  45. Nascimento, M.L.M.; Bauer, E.; De Souza, J.S.; Zanoni, V.A.G. Wind-driven rain incidence parameters obtained by hygrothermal simulation. J. Build. Pathol. Rehabil. 2016, 1, 1–7. [Google Scholar] [CrossRef] [Green Version]
  46. Schöner, T.; Zirkelbach, D. Zirkelbach. Development of hygrothermal reference years for Germany. In Proceedings of the Central European Symposium on Building Physics (CESBP), Dresden, Germany, 14–16 September 2016; pp. 133–140.
Figure 1. Snapshot of water vapour diffusion resistance factor showing a single point value.
Civileng 03 00040 g001
Figure 2. Single-point water vapour diffusion resistance factor graphs for the five tested pliable membranes.
Civileng 03 00040 g002
Figure 3. Multipoint vapour diffusion resistance factor graphs for five tested pliable membranes.
Civileng 03 00040 g003
Figure 4. Types of external walls for Australia residential class 1 house. Source: https://ahd.csiro.au/dashboards/construction/walls/ (accessed on 4 November 2021) [38].
Civileng 03 00040 g004
Figure 5. Section drawing of timber-framed brick veneer wall system.
Civileng 03 00040 g005
Figure 6. Simulation layers of the wall assembly with their camera positions.
Civileng 03 00040 g006
Figure 7. Map of Australia showing the climate types for building regulation energy efficiency simulation purposes Adapted http://www.nathers.gov.au. (accessed on 10 July 2018).
Civileng 03 00040 g007
Figure 8. Holzkirchen map (sourced from https://www.britannica.com/place/Alps) (accessed on 1 June 2022).
Civileng 03 00040 g008
Figure 9. (af): Selected hygrothermal simulation results of the moisture content for Pliable membranes A and B for Sydney. (a): Total moisture content of the wall assembly in northern orientation when either single or multipoint water vapour resistivity values of pliable membrane A and B. (b): Total moisture content of the wall assembly in western orientation when either single or multipoint water vapour resistivity values of pliable membrane A and B. (c): Moisture content of the vapour control layer in northern orientation for pliable membrane A and B with both single and multipoint water vapour resistivity values. (d): Moisture content of the vapour control layer in western orientation for pliable membrane A and B with both single and multipoint water vapour resistivity values. (e): Insulation, fibre glass (single point). (f): Insulation, fibre glass (multipoint).
Civileng 03 00040 g009aCivileng 03 00040 g009b
Figure 10. (af): Selected result of the moisture content for Pliable C, D, and E for Darwin. (a): Total moisture content of the wall assembly in northern orientation when either single or multipoint water vapour resistivity values of pliable membrane C, D, and E. (b): Total moisture content of the wall assembly in western orientation when either single or multipoint water vapour resistivity values of pliable membrane C, D, and E. (c): Moisture content of the vapour control layer in northern orientation for pliable membrane C, D, and E with both single and multipoint water vapour resistivity values. (d): Moisture content of the vapour control layer in western orientation for pliable membrane C, D, and E with both single and multipoint water vapour resistivity values. (e): Insulation, fibre glass (single point). (f): Insulation, fibre glass (multipoint).
Civileng 03 00040 g010aCivileng 03 00040 g010b
Figure 11. Graph of 10-year fluctuation of moisture content for the wall assembly in north orientation for pliable membrane A (single and multipoint).
Civileng 03 00040 g011
Figure 12. Graph of 10-year fluctuation of moisture content for the wall assembly in west orientation for pliable membrane A with single point.
Civileng 03 00040 g012
Figure 13. Graph of 10-year fluctuation of moisture content for the wall assembly in west orientation for pliable membrane A, multipoint.
Civileng 03 00040 g013
Figure 14. Graph of typical 10-year fluctuation of moisture content for the wall assembly in west orientation for pliable membrane B (single and multipoint).
Civileng 03 00040 g014
Figure 15. The 10-year fluctuation of moisture content for the wall assembly in northern orientation for pliable membrane D and E.
Civileng 03 00040 g015
Figure 16. (a): Single point 10-year fluctuation of moisture content for the wall assembly in west orientation for pliable membrane D and E; (b): multipoint 10-year fluctuation of moisture content for the wall assembly in west orientation for pliable membrane D and E.
Civileng 03 00040 g016
Figure 17. (a): Single point 10-year fluctuation of moisture content for the wall assembly in west orientation for pliable membrane for pliable membrane C; (b): multipoint 10-year fluctuation of moisture content for the wall assembly in west orientation for pliable membrane for pliable membrane C.
Civileng 03 00040 g017aCivileng 03 00040 g017b
Figure 18. Typical mould growth index graph for Australia’s temperate climate using EPW climate file.
Civileng 03 00040 g018
Figure 19. (a): Mould Growth Index graph for the wall assembly with single point resistivity value of membrane A in west orientation of Australian hot and humid climate; (b): Mould Growth Index graph for the wall assembly with multipoint resistivity value of membrane A in west orientation of Australian hot and humid climate.
Civileng 03 00040 g019
Figure 20. (a): Typical Mould Growth Index graph for the wall assembly with single point resistivity value of membrane B, C, D, and E in both north and west orientation of Australian hot and humid climate; (b): typical Mould Growth Index graph for the wall assembly with multipoint resistivity value of membrane B, C, D, and E in both north and west orientation of Australian hot and humid climate.
Civileng 03 00040 g020
Figure 21. (a) Mould Growth Index graph for the wall assembly with single point resistivity value of membrane C in west orientation of cold Holzkirchen climate; (b): Mould Growth Index graph for the wall assembly with multipoint resistivity value of membrane C in west orientation of cold Holzkirchen climate.
Civileng 03 00040 g021
Figure 22. (a): Mould Growth Index graph for the wall assembly with single point resistivity value of membrane C in north orientation of cold Holzkirchen climate; (b): Mould Growth Index graph for the wall assembly with multipoint resistivity value of membrane C in north orientation of cold Holzkirchen climate.
Civileng 03 00040 g022
Table 1. Properties adopted from existing materials within the software materials database.
PropertiesMembrane AMembrane BMembrane CMembrane DMembrane E
Porosity (m3/m3)0.410.4110.0860.0010.001
Specific Heat Capacity, Dry (J/(kg K))850850250023002300
Thermal Conductivity, Dry (W/(m K))0.60.62.42.32.3
Temp-dep. Thermal Conductivity (W/(m K2))2.0000 × 10−42.0000 × 10−42.0000 × 10−42.0000 × 10−42.0000 × 10⁻⁴
Table 2. Bulk density and single point water vapour diffusion resistance factor of the five tested pliable membranes.
PropertiesMembrane AMembrane BMembrane CMembrane DMembrane E
Bulk Density (kg/m3)272 ± 10159 ± 6115 ± 25212 ± 6373 ± 5
Water Vapour Diffusion Resistance Factor90 ± 5.98369 ± 41.6264,755 ± 1980174,600 ± 10323307,317 ± 16,850
Table 3. Summary of calculation of R-value for the wall assembly.
MaterialThickness
(m)
R-Value
((m2 K)/W)
Exterior surface film 0.06
Clay brick0.1100.18
Ventilated cavity0.0390.16
Pliable membrane0.0010.00
Bulk insulation0.0902.70
Plasterboard0.0100.07
Interior surface film 0.12
Totals0.2503.29
Table 4. Initial moisture content in each layer of the wall assembly.
NoMaterial LayersDimension (m)Initial Water Content (kg/m3)
1Red veneer brick0.1109.2
2Air layer; without additional moisture capacity0.040.01
3Pliable membrane0.0010.0
4Fibre glass insulation0.0901.86
5Gypsum plaster0.0106.3
Table 5. Australian NatHERS heating and cooling thermostat set point temperatures for two Australian capital cities.
Australia
Cities
NatHERS Climate ZoneBuilding LocationTime Period (Hours)Heating Thermostat Set Point (°C)Cooling Thermostat Set Point (°C)
Sydney17Living room/Dining and Kitchen
Bedroom
07:00 to 24
07:00 to 09:00
10:00 to 15:00
24:00 to 06:00
20
18
Unconditioned
15
25.5
25.5
Unconditioned
25.5
25.5
Darwin1Living room/Dining and Kitchen
Bedroom
07:00 to 24
07:00 to 09:00
10:00 to 15:00
24:00 to 06:00
20
18
Unconditioned
15
26.5
26.5
Unconditioned
26.5
26.5
Table 6. Ratio of bio-hygrothermal Mould Index results that changed when a multipoint water vapour diffusion resistance was applied.
LocationKoppen Climate ClassificationNorthern OrientationWestern Orientation
DarwinAw3 of 55 of 5
SydneyCfa4 of 55 of 5
HolzkirchenCfb5 of 55 of 5
Publisher’s Note: MDPI stays neutral with regard to jurisdictional claims in published maps and institutional affiliations.

