1. Introduction
It is virtually standard practice in SA to construct base layers with good quality freshly crushed rock (i.e., engineered materials) compacted to relatively high-density standards in the base layer with a relatively thin asphalt surfacing layer (20 mm to 50 mm) [
1]. Between 50% and 80% of the bituminous surfacing layers on the provincial roads are either chip and spray or double seal or Cape seals (with slurry) which are thinner types of asphalt surfacing (between 15 and 20 mm thick) [
2]. The root cause of premature failures in relatively thin (<50 mm) asphalt-surfaced roads is often a challenge to solve during forensic investigations in South Africa (SA) [
1].
The collective experience and knowledge gained via forensic investigations of cracks development are described here in terms of the embryonic microcracks that develop. These cracks are the most “telling” but are not always observed early on for several physical and subjective reasons. Further crack development, herein sequentially referred to as cracks of the second kind, is mostly due to moisture ingress. The cracks of the second kind are often the type of cracks that are observed first. The development of these cracks of the second kind is accelerated by high water pressure under the wheel contact areas. These high-water pressure situations cause and facilitate the debonding of the thin asphalt surfacing. It has also been observed in the field that such a loose debonded surface layer exacerbates premature fatigue crack development. Once the cracks show such exponential growth due to fatigue they can be described as cracks of the third kind. They are now not only clearly visible but are also often associated with the distress of the rest of the pavement structure. Keen observations in the field have shown that cracks of the second and third kinds show signs of bow waves (BWs) in front of and at the sides of loaded tires.
These kinds of cracks are described based on forensic investigations and observations. In some cases, their development or effects are measured or indirectly measured. There is a clear gap in knowledge that needs to be filled through research and new measuring technologies. There is a need for actual stress and strain measurements under the truck wheels to help quantify and describe these cracks of first, second, and third kinds more accurately and relate them objectively to traffic-associated fatigue crack development. Added to the need for improved measurement technologies new mathematical modeling or application are needed to calculate or quantify the stresses and strains associated with this relatively thin asphalt surface fatigue crack development.
2. Embryonic Crack Development of the First Kind
The embryonic crack development phase needs keen and close-up observations at all times of the crack distress development, but particularly very early on when they tend to be very difficult to observe. The manifestations of premature failure seldom involve the total pavement system in the infantile stages of distress development of the pavement type described above.
These embryonic crack developments are often described as “microcracks”. Microcracks can have a multitude of causes ranging from stabilized subbase crack reflection through base and surfacing, the effect of rolling technique during thin asphalt layer compaction, and rapid temperature changes due to typical thunderstorms and wind. These aspects often cause roller-induced micro shear cracks [
2,
3,
4]. In practice, it has to be acknowledged that sometimes post compaction rolling is allowed to try to achieve specified densities. This action often results in cracking due to the rolling taking place outside the compaction temperature window (range) [
3,
4]. Temperature drop can happen due to the typical thunderstorms experienced in SA while such rolling is still in progress with known negative effects.
The early signs of crack development are often overlooked as they tend to be less visible in the early stages. See the illustration in
Figure 1 where the microcrack is highlighted in yellow next to the normal yellow line to identify its presence.
3. The Transition from Microcracks to Visible Cracks of the Second Kind
The first detection of these microcracks is often associated after water intrusion. Microcracks initially are invisible, as stated before. Such microcracks in themselves are an entry point (breech) for seasonal rainwater on the surface. These microcracks do allow surface water to infiltrate the cracked surface. In due course [
5], it infiltrates under gravity and suction into the next layer, the granular base layer, and may cause secondary distress in terms of deformation or shear failure. In this paper, the aspect of asphalt permeability is acknowledged, but due to space limitations, not explored in depth.
The cracks of the second kind are defined as the observable post microcracks phase enlarged to the extent it now becomes visible, often due to the fines pumped from the granular base below under the action of traffic loading. These pumped fines cause rimming of the crack lips with a white or brownish deposit of fines. Those white rimmed crack lips are therefore suddenly visible due to contrast with the black asphalt surface often creating a perception of appearing “overnight”. Such cracks of the second kind may still be defined as microcracks in terms of degree.
A specific example often observed in SA may be subbase stabilization cracks that reflect through the granular base as well as the asphalt surface. The cracks may initially be merely microcracks that are invisible to the casual observer (cracks of the first kind). These stabilization cracks will allow moisture to enter the asphalt layer and flow with greater ease horizontally [
1,
6] or at the interface of the base top and bottom of the thin asphalt and seal surfacing. This water invariably crosses the wheel path linked to cross fall and longitudinal gradient which dictates flow ‘strive lines’.
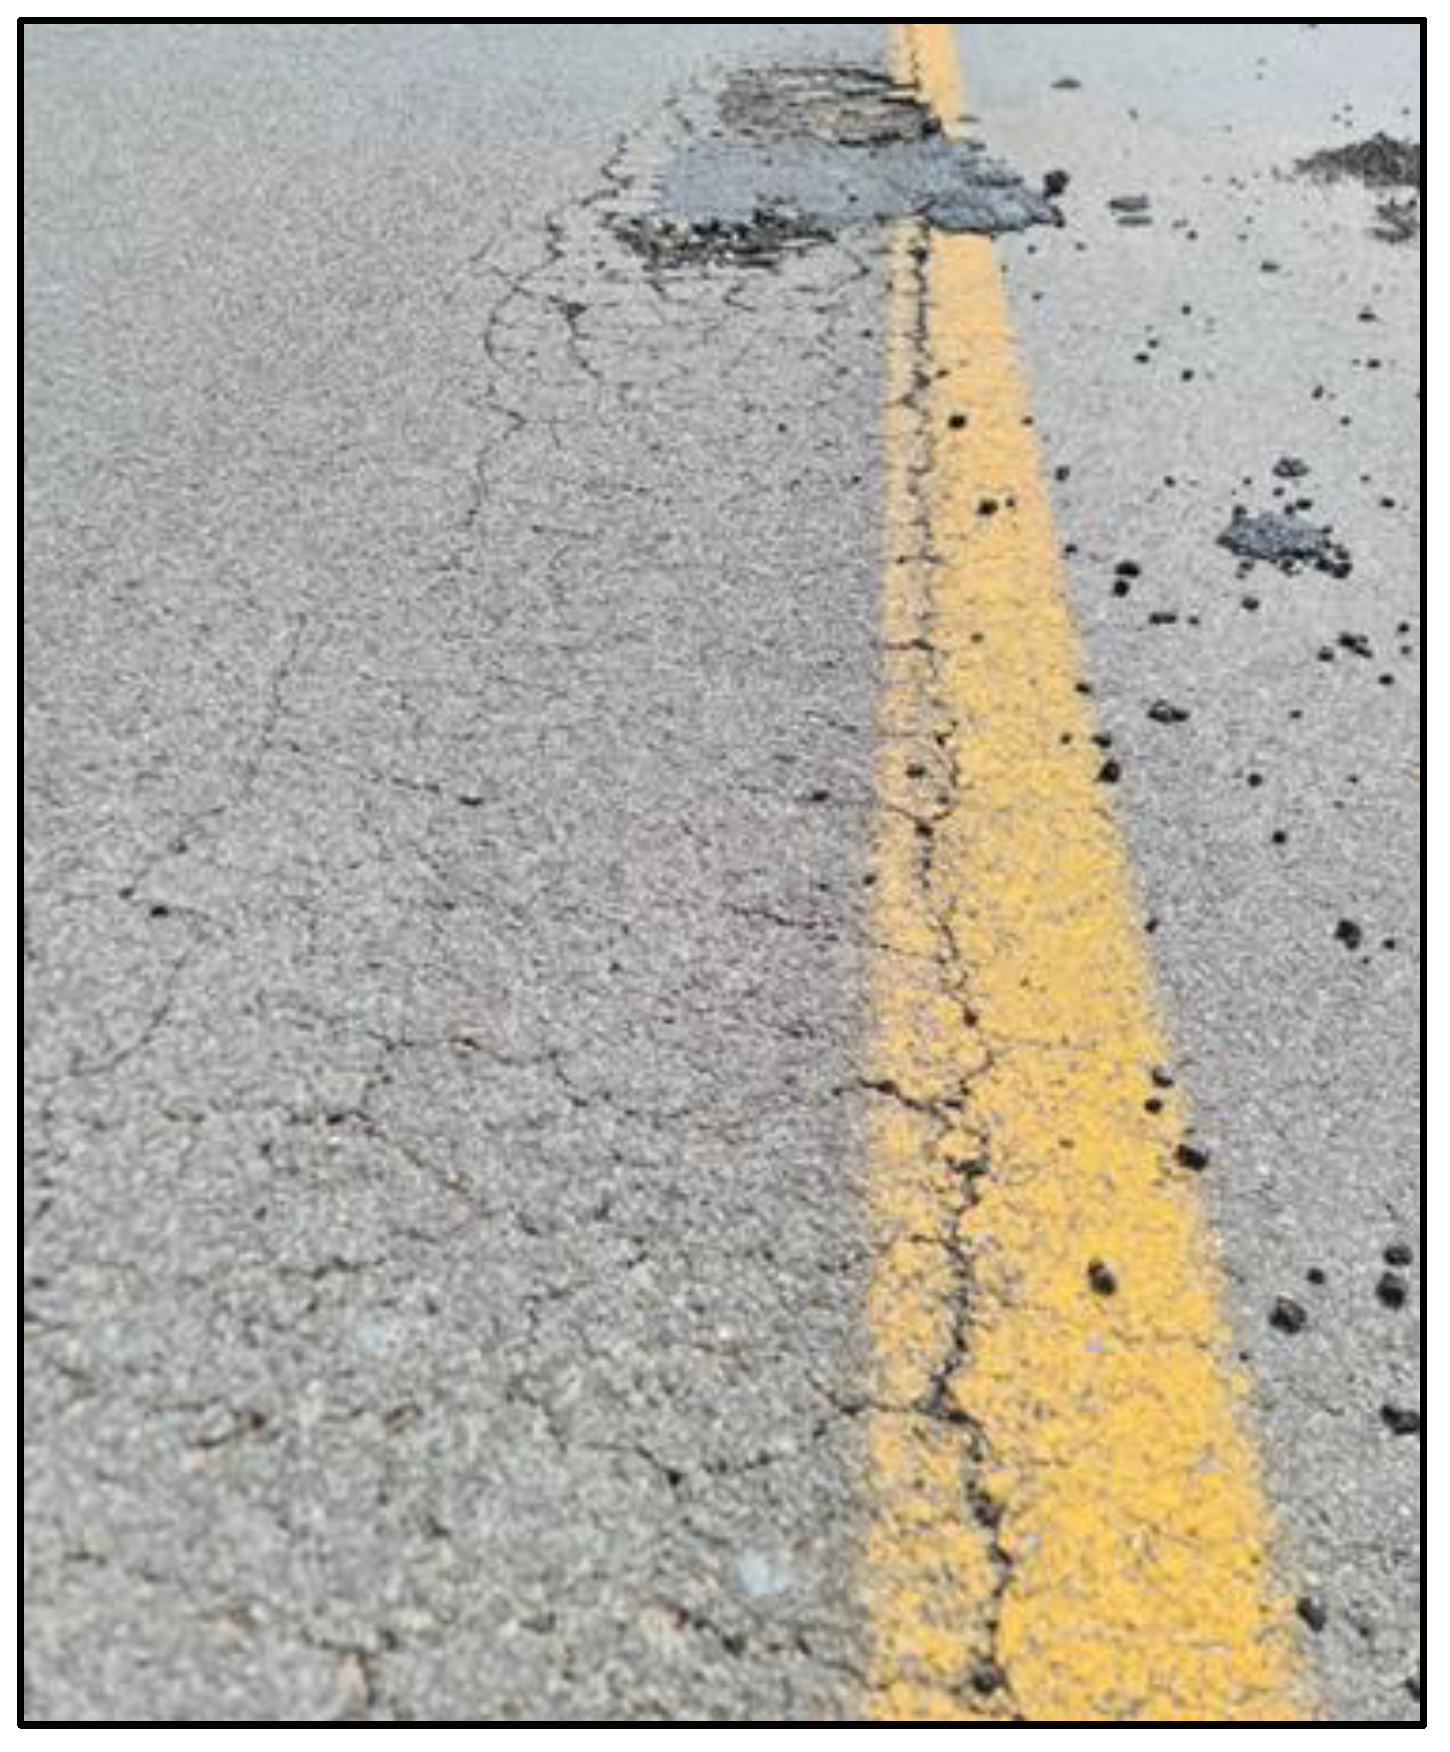
Fines from the base and subbase are pumped upwards to make the microcracks visible by rimming the cracks’ lips with a whitish residue. Due to the influence of water intrusion, these cracks also tend to rapidly develop longitudinally and often into the so-called chicken net or early map cracking, or irregular crocodile type cracks shown in
Figure 2 [
4]. In this image, it is clear that the crack of the second kind is more visible against the yellow line (on the edge of the outer wheel path) versus the larger extent of chicken wire or map type cracks now clearly observable in the wheel path next to the yellow line. Several cases indicated that the transverse cracking was followed by ladder cracking and then followed by irregular cracking or map cracking or chicken net cracking or described as early irregular crocodile pattern as shown in
Figure 3 [
4].
At this stage, these cracks of the second kind may even resemble a crocodile crack pattern, but without any rut or permanent deformation (rut) as the base layer has not softened and deformed yet. The latter crack definition or name as merely crocodile cracking literally may give the misleading message of a base failure as the origin of the crack development.
The actual recording of distress is often only recorded “after the event” of the first and second kind of crack development and in the final stages observed merely as crocodile kind of cracking or cracking of the third kind. Classical crocodile cracking is often accompanied by downward rut development as well, implying base failure. In pavement forensic investigations, it was found that if only observing and recording these cracks of the third kind when various forms of distress started to manifest, merely describing them as “crocodile cracking” can lead to a faulty definition or description of the origin of distress [
7].
4. De-Bonding of the Asphalt Surfacing Layer
A better understanding of cause and effect can be achieved by dwelling on the forces and mechanisms that facilitate the lesser-seen cracks of the first and second kinds to develop. It is now known that the moisture ingress into the top of the granular base may experience 10 to 30 times easier horizontal flow of the water [
1]. The water flows in the horizontal plane inside the thin asphalt surfacing or at the interface between the granular base and the surfacing [
6]. If the water then flows with the normal gradient or superelevation and longitudinal gradient, obeying the laws of gravity, it has to pass the wheel path zones at some stage. This is where it often gets exposed to the effects of the moving wheel loads and associated contact stresses transferring to the water leading to relatively high positive and negative pore-water pressures.
The contact pressure due to a passing wheel in wet weather, normally exceeding the tire inflation pressure (TiP), can also cause a squirting action that can force water through such microcracks, multi-dimensionally [
1,
2]. This has led to the development of a High-Pressure Permeability Test (HPPT) [
4,
6] to simulate this high-water pressure in the asphalt layer. The HPPT has proven to be very discriminative regarding asphalt sensitivity to high-pressure permeability. The whole scene of field and laboratory permeability testing is currently under critical review [
1], but the HPPT seems to give an additional viewpoint of permeability regarding these high pore water pressures. Basic calculations of water pressure under a moving wheel load indicated there may be even higher pore water pressures in the asphalt that the HPPT is currently simulating.
The net effect of such high-water pressure squirting is often a de-bonded thin asphalt surface on top of a still fully intact base top. In this de-bonded state, the thin asphalt surface layer operates now very similar to a loose carpet in a corridor. The observations in the field and structural modeling of a de-bonded thin asphalt surface show that the added flexing of the asphalt thin surface layer consumes the fatigue life of the asphalt layer exponentially [
4,
8]. The observation in the field shows upwards flexing also and not merely downward deflection as normally assumed directly under the wheel load.
This additional flexing of the asphalt loose surface layer leads to very rapid and often premature fatigue failure of the thin asphalt layer, with both “bottom-up” and “top-down cracking” contributing to the rapid crack development. This early fatigue causes the breaking up of the asphalt layer into the earlier described map type crack (or chicken net) patterns in the wheel path.
Well-published and peer-reviewed research state that a good quality unbound base (G1, engineered granular material), [
9] is in effect impermeable. Basic visual proof of such impermeability of a good quality base is illustrated in
Figure 4. It shows the water level in a tests hole after 8 h showing no penetration on its own. Such good quality aggregate bases have a clean mosaic surface finish due to a proper slushing and brooming protocol. However, if the surface of the base was not properly cleaned after slushing it have a slushed interlayer (of fines). If the crushed stone base material does not meet the low Plasticity Index (PI) requirements for a G1, it is now a lubrication interlayer. This leads to rapid debonding of the asphalt layer with clear premature fatigue failure of the asphalt surfacing. Typically, base materials such as G3, G4, and G5 have more relaxed PI requirements and thus the sensitivity to such lubricated interlayers are more pronounced [
9].
Moisture entering the pavement system, as described above via a cracked asphalt surfacing, can soften the top of the granular or stabilized base material if the quality is less than specified [
2,
8]. Typically, if the base layer is a lower quality or has lower compaction density, the ingress is quicker and possibly also deeper than merely 20 mm to 40 mm of the top of the base. The top of the base literally becomes soft due to the water ingress in the rainy season. This effect can be measured, even though indirectly, with the Falling Weight Deflectometer (FWD). In
Figure 5, the deflection bowl shape shows a distinct increase in the positive curvature portion for a case where the top of the base, and possibly depending on the period of water exposure, has become soft as indicated by the moisture content (MC) referenced against the Optimum Moisture Content (OMC) [
4].
The Radius of Curvature (RoC) [
10,
11] which can be calculated from the positive curvature portion of the elastic deflection bowl now becomes smaller than in the dry condition. Other examples of softening the top of the base have also been observed in the field where cracks on the shoulders can also, similarly, influence the RoC. The softening of the top of the base due to such softening means the thin asphalt layer now flexes much deeper and therefore bottom-up fatigue cracking ensues much earlier. Temperature can also have a significant effect on the RoC. In
Figure 6 [
4], the RoC derived from the Traffic Speed Deflectometer (TSD) [
10] reading on the same stretch of road at two different temperatures (7 °C and 30 °C) at different times of the day are shown to vary.
Figure 6 clearly shows higher RoC at relatively colder temperatures and lower RoCs at relatively higher temperatures, therefore relatively higher flexing.
5. Bow Wave Mechanism on the Surface around Rolling Tire Loading
The rolling wheel on the de-bonded asphalt layer is analogous to “bow waves” radiating in front and more important to the sides of boats as illustrated in
Figure 7. Such standing waves in water are highly dampened on the asphalt surface, but they cause significant flexing in the longitudinal as well as transverse directions next to the wheel. Under traffic loading, this relatively softened top of the base layer (i.e., weak interlayer) causes even more flexing of the asphalt surfacing loose layer due to downwards and upwards flexing added to the normal structural flexing behavior of road pavements. See
Figure 8 where the phenomenon is illustrated for the front bow wave. [
4]. This additional flexing accelerates the traffic associated fatigue crack development exponentially and may explain why longitudinal or transverse cracking is often followed by ladder-type cracks (of the second type and observable) as shown in
Figure 3.
It has long been known that there is also an upwards ‘pinching’ between the dual wheels under such circumstances as illustrated in
Figure 9 in the transverse direction as originally determined with the mechanical Dehlen Curvature meter [
11]. Improved digital measuring technology just never pursued this significant observation. There is now new awareness that the transverse flexing between and along the sides of the moving wheel significantly contribute to observed crack development patterns. This helps to explain how such transverse flexing contributes to such exponential crack progression along the tire sides literally morphs into the irregular map type cracking (chicken net) or the start of real crocodile crack patterns in a relatively short time as illustrated in
Figure 3.
6. Measurement Technology and Modeling Frontiers
6.1. Micro-Crack Detection
The problem with premature cracks is it often happens “under the radar” and early tell-tale signs are either not seen or ignored due to well-entrenched preconceived biases or lack of actual measurement technologies. In the past, limited success was experienced with in situ pavement instrumentation on Accelerated Pavement Test (APT) sections, such as the Multi-Depth Deflectometer (MDD) [
12], to give indirect indications of early microcrack development.
Different measuring techniques from other built environment fields have lately been observed reaching maturity and showing promise for transition to the field of road surface observations. Microcracking and delamination using Infrared Thermography (IRT) appear to also have potential in thin asphalt surface layers even when attached to drones [
13]. Some tweaking is still needed though to achieve the correct temperature differentials and or presence of moisture in the microcracks to enable the detection of their presence.
Remote sensing using Light Detection and Ranging (LiDAR), using a pulsed laser to measure and help define the morphology of surfaces had already transitioned into standard Pavement Management Systems (PMSs) survey technology [
13,
14]. Extraction of road surfaces from volumetric point cloud data is still in the infancy stage because of heavy data processing requirements and the complexity of the road environment.
The development in the field of High Definition Video (HDV) imagery also allowed the transition of PMS level visual condition assessment to project level survey and condition assessment. Lately, the coupling of such semi-automatic survey and evaluation technologies has found a niche application specific to the South African socio-political environment [
15] with in office survey evaluation via play-back and recording software. This HDV technology has also allowed the further development of more automated machine learning via artificial intelligence (AI) software augmentation that can detect even micro-cracks not always detected by humans [
16].
6.2. Bow Wave Detection
The de-bonded asphalt thin surface layer, described before causes the phenomenon of a “bow wave” running around the moving wheel. The bow wave action is currently difficult to measure, but even older technology such as the MDD managed to confirm this bow wave behavior of thin asphalt surfacing [
17,
18].
This is indeed an area for further research, especially for relatively thin surfacing and possibly improved measuring technology. Measuring technology that can measure the whole bow wave longitudinally as well as transversely is needed and an adaptation of the original MDD technology with an ’anchor’ refence linked to the actual surface is showing great promise will be pursued. Description of such development is currently restricted due to proprietary and intellectual property rights.
The Stress in Motion (SIM) measuring equipment [
18,
19] has highlighted the effect of tire inflation pressure coupled to wheel loading for a variety of tire types as illustrated in
Figure 10. It tends to also illustrate the transverse edge effects due to variance in tire load and pressure. SIM measurements have also shown that as much as 30% of static free-rolling wheel load transfer into a horizontal force [
19]. This has direct implications for bow wave influence on longitudinal strain development due to sharp flexing longitudinally as well as transversely, therefore similar to the standing waves illustrated in the boat bow waves shown in
Figure 7 before [
17].
An exciting parallel development in the field of ‘in tire’ instrumentation [
20,
21] shows great promise to measure stress and strain directly from inside a moving tire. The SIM technology (road surface mounted) is well-positioned to help calibrate this in tire measuring technology. The aim is therefore to be able to measure early strain anomalies in the asphalt surface via such an instrumented moving tire. Elsewhere [
22,
23] using different in tire instrumentation the tire contact information is transformed as a deflection signature by means of correlations with FWD and TSD measurements. It also indicates a potential for an indication of ‘apparent rolling resistance’ or bow wave information may be possible to retrieve from the correlated deflection signature transformation.
6.3. Modeling Frontier
The framework on the vehicle–pavement interaction (VPI) proposed by Steyn [
24] can form the basis for further research considering possible pavement surface loading types including vertical, horizontal (shear), torsional, moment, and centripetal forces. It is proposed that for purpose of comparison, the effects of static and constant moving loads be investigated incorporating potential slippages at pavement layer interfaces. Multilayer linear elastic modeling may therefore also need to develop the actual modeling of these various observable effects of thin asphalt surfacing due to the bow wave effect. Relevant background work has been done by the co-authors [
25,
26]. Current modeling development is also currently under proprietary and intellectual property restrictions and therefore restricting further description here.
7. Concluding Remarks
This paper attempts to better define, describe, measure, and analyze crack development in relatively thin asphalt layers associated with traffic loading. The findings and observations during forensic investigations and field experiences of the authors over the years are used to describe the development of cracks in thin asphalt surfacing. It describes the first kind as at an embryonic level crack, often unseen, through a microcrack phase (the second kind) where it becomes visible due to water intrusion and developing into cracks of the third kind. The third kind of cracking rapidly progresses under traffic loading and leads to other forms of total pavement system defects.
In that regard, the observed flexing of the relatively thin asphalt surfacing could be linked to support base quality and sensitivity to moisture ingress. Softening of the top of the granular base and de-bonding could all be liked to an exponential reduction in asphalt layer fatigue life. This often leads to debonding of the thin asphalt surfacing. In that de-bonded state, moving wheels over it simulates “bow wave” phenomena around the tire. This bow wave phenomena further increases the flexing of the asphalt layer around the rolling wheel. The reality that it is not just the longitudinal flexing but lately the realization that more so transverse flexing can be corroborated by observed crack pattern development during forensic investigations. These cracks are clearly exposed to ‘top down’ as well as ‘bottom up’ type crack mechanisms.
The findings and observations highlight the need for further research and development in:
The use of Infrared Thermography (IRT) measuring techniques for microcracking and delamination;
The use of high definition video and/or LiDAR imagery and machine learning technology to detect microcracks in the early phases of crack development;
Evaluation of permeability potential of the asphalt layers and its effect on the weakening of the layer interfaces and hence cracking of the asphalt layer;
Contribution of the stabilization cracks, roller technique-induced shear microcracks, cold rolling of asphalt, and other mechanisms causing microcracks the asphalt layer going initially undetected due to their lack of contrast with the black surface of the asphalt;
Effects of vehicle–pavement interactions (VPI) with high water pressures at the interlayer between asphalt surface and top of the base layer or in the relatively thin asphalt layer itself causing debonding and contributions to fatigue cracking of these thin asphalt surfacing layers;
Multi-Depth Deflectometer (MDD) technology and possibly new variations thereof to measure the actual dampened bow waves and flexing of asphalt next to and in front of moving wheel loads;
New exciting ‘in tire’ measuring technology that need to be calibrated with the SIM technology to enable stress and strain measurement of the asphalt surface, directly under the loaded tire as well as the zone of transverse and longitudinal bow wave occurrence; and
Study and develop improved modeling of the bow wave (BW) effects in thin layers de-bonding and associated slip and flexing by numerical modeling of moving constant truck wheel load.
Funding
This research received no external funding. As shown below the research was done as part of normal projects executed for a number of road authorities and Universities in SA.
Data Availability Statement
This paper is based on conceptual aspects described in the paper. No data specific to this paper was used separately and any data are linked with the referenced papers and can be sourced accordingly.
Acknowledgments
Most of the work reported here is based on the respective authors’ own initiatives, but the Western Cape Provincial Road Authority, South African National Roads Agency (SANRAL), University of Pretoria, and University of Stellenbosch are thanked for their support.
Conflicts of Interest
The authors declare no conflict of interest. The funders (see acknowledgement) had no role in the design of the study; in the collection, analyses, or interpretation of data; in the writing of the manuscript, or in the decision to publish the results.
Patents and Contributions
Where there are potential patents pending, it is clearly mentioned in the paper. Author contributions are indicated via the references following their contributions.
References
- Horak, E.; Hofsink, W.; Marais, H.; Muller, J.; Cromhout, A. A paradigm shift on permeability of thin asphalt surfacings. In Proceedings of the 12th Conference on Asphalt Pavements for Southern Africa (CAPSA), Sun City, South Africa, 13–16 October 2019. [Google Scholar]
- Zyl, G.D.V.; Jenkins, K. Overview of Long-Term Seal Performance. In Proceedings of the 12th Conference on Asphalt Pavements for Southern Africa (CAPSA), Sun City, South Africa, 13–16 October 2019. [Google Scholar]
- Horak, E.; Marais, H.; Hofsink, W.; Aswegen, E.V. Premature failures of asphalt wearing courses on newly constructed crushed stone base course. In Proceedings of the Conference on Asphalt Pavements in Southern Africa (CAPSA), Sun City, South Africa, 16–19 August 2015. [Google Scholar]
- Zyl, G.D.V.; Wessels, R. Performance and cost-effectiveness of bitumen rubber chip seals. In Proceedings of the Rubberized Asphalt Rubber Conference, Málaga, Spain, 27–30 June 2022. [Google Scholar]
- Chen, J.S.; Lin, K.Y.; Young, S.Y. Effects of Crack Width and Permeability on Moisture-Induced Damage of Pavements. J. Mater. Civ. Eng. 2004, 16, 276–282. [Google Scholar] [CrossRef]
- Reason, J. The contribution of latent human failures to the breakdown of complex systems. Philos. Trans. R. Soc. B Biol. Sci. 1990, 327, 475–484. [Google Scholar] [CrossRef]
- Grobbelaar, O.R. Towards the Development of a Standard Test Protocol: Permeability of Chip Seals under Pressure. Master’s Thesis, Stellenbosch University, Stellenbosch, South Africa, December 2016. [Google Scholar]
- Zyl, G.D.V.; Fourie, G. Key Aspects of good performing Cape Seals. In Proceedings of the CAPSA Conference, Sun City, South Africa, 16–19 August 2015. [Google Scholar]
- Maree, J.H.; Freeme, C.R.; Zyl, N.J.V.; Savage, P.F. The permanent deformation of pavements with untreated crushed stone bases as measured in heavy vehicle simulator tests. In Proceedings of the Eleventh Australian Road Research Board Conference, Melbourne, VIC, Australia, 23–27 August 1982. [Google Scholar]
- Horak, E.; Emery, S.; Maina, J. Review of Falling Weight Deflectometer Deflection Benchmark Analysis on Roads and Airfields. In Proceedings of the Conference on Asphalt Pavements in Southern Africa (CAPSA), Sun City, South Africa, 16–19 August 2015. [Google Scholar]
- Dehlen, G.L. Flexure of road surfacings, its relation to fatigue cracking and factors determining its severity. HRB Highw. Res. Board Bull. 1962, 321, 26–39. [Google Scholar]
- De Beer, M.; Horak, E.; Visser, A.T. The Multidepth Deflectometer (MDD) System for Determining the Effective Elastic Moduli of Pavement Layers. In Non-Destructive Testing of Pavements and Back-Calculation of Moduli; ASTM International: West Conshohocken, PA, USA, 1989. [Google Scholar]
- Yadav, M.; Lohani, M.; Singh, A.K. Road surface detection from mobile lidar data. Ann. Photogramm. Remote Sens. Spat. Inf. Sci. 2018, 4, 5. [Google Scholar] [CrossRef] [Green Version]
- Li, W.; Burrow, M.; Metje, N.; Ghataora, G. Automatic Road Survey by Using Vehicle Mounted Laser for Road Asset Management. IEEE Access 2020, 8, 94643–94653. [Google Scholar] [CrossRef]
- Cromhout, A.; Horak, E.; Toit, T.D.; Merwe, D.V.D.; Maina, J.M. Digital video assessment (DVA) as catalyst for skill transfer in the road and airport visual condition survey environment in RSA. In Proceedings of the Southern African Transportation Convention (SATC), Covid Caused Online Conference, Virtual, 5–7 July 2021. [Google Scholar]
- Topamo, H.; Bosman, A.; Maina, J.M.; Horak, E. Evaluating the feasibility of convolutional neural networks in detecting cracks on flexible road pavements. In Proceedings of the 9th Symposium on Pavement Surface Characteristics (SURF), Milan, Italy, 12–14 September 2022. [Google Scholar]
- De Beer, M. Pavement Response Measuring System. In Proceedings of the 2nd International Symposium State of the Art of Pavement Response Monitoring Systems for Roads and Airfields, Lebanon, NH, USA, 10–13 September 1991; p. 18, ISBN 0872628906. [Google Scholar]
- De Beer, M.; Fisher, C.; Jooste, F.J. Evaluation of non-uniform tyre contact stresses on thin asphalt pavements. In Proceedings of the 9th International Conference on Asphalt Pavements (ICAP 2002), Copenhagen, Denmark, 17–22 August 2002. [Google Scholar]
- De Beer, M.; Fisher, C. Stress-In-Motion (SIM) system for capturing tri-axial tyre–road interaction in the contact patch. Measurement 2013, 46, 2155–2173. [Google Scholar] [CrossRef]
- Guthrie, A.G.; Botha, T.R.; Els, P.S. 3D contact patch measurement inside rolling tyres. J. Terramechanics 2017, 69, 13–21. [Google Scholar] [CrossRef]
- Feldesi, F.; Botha, T.R.; Els, P.S. Full-field strain measurements of the inside of an agricultural tyre using digital image correlation. J. Terramechanics 2020, 91, 309–318. [Google Scholar] [CrossRef]
- Vepa, T.S.; George, K.P.; Shekharan, A. Pavement Structural Performance: Predicting Remaining Life Using Rapid Non-Destructive Testing. In Proceedings of the Bearing Capacity of Roads, Railways and Airfields (BCRRA) Conference, Trondheim, Norway, 27–30 June 2022. [Google Scholar]
- Salt, G.; Grimshaw Land Maredi, A. The Multi-Speed Deflectometer: New technology developed for traffic-speed non-destructive structural testing of pavements. In Proceedings of the 9th Symposium on Pavement Surface Characteristics (SURF), Milan, Italy, 12–14 September 2022. [Google Scholar]
- Steyn, W.J. Considerations of Vehicle-Pavement Interaction for Pavement Design. Ph.D. Thesis, The University of Pretoria, Pretoria, South Africa, 2002. [Google Scholar]
- Maina, J.W.; Kawana, F.; Matsui, K. Numerical modelling of flexible pavement incorporating cross-anisotropic material properties. Part I: Surface circular loading. J. S. Afr. Inst. Civ. Eng. 2017, 59, 22–27. [Google Scholar] [CrossRef] [Green Version]
- Maina, J.W.; Kawana, F.; Matsui, K. Numerical modelling of flexible pavement incorporating cross-anisotropic material properties. Part II: Surface rectangular loading. J. S. Afr. Inst. Civ. Eng. 2017, 59, 28–34. [Google Scholar] [CrossRef] [Green Version]
| Publisher’s Note: MDPI stays neutral with regard to jurisdictional claims in published maps and institutional affiliations. |
© 2022 by the authors. Licensee MDPI, Basel, Switzerland. This article is an open access article distributed under the terms and conditions of the Creative Commons Attribution (CC BY) license (https://creativecommons.org/licenses/by/4.0/).


