
Climate Change Effects on Heating and Cooling Demands of Buildings in Canada


Abstract
:1. Introduction
2. Methods
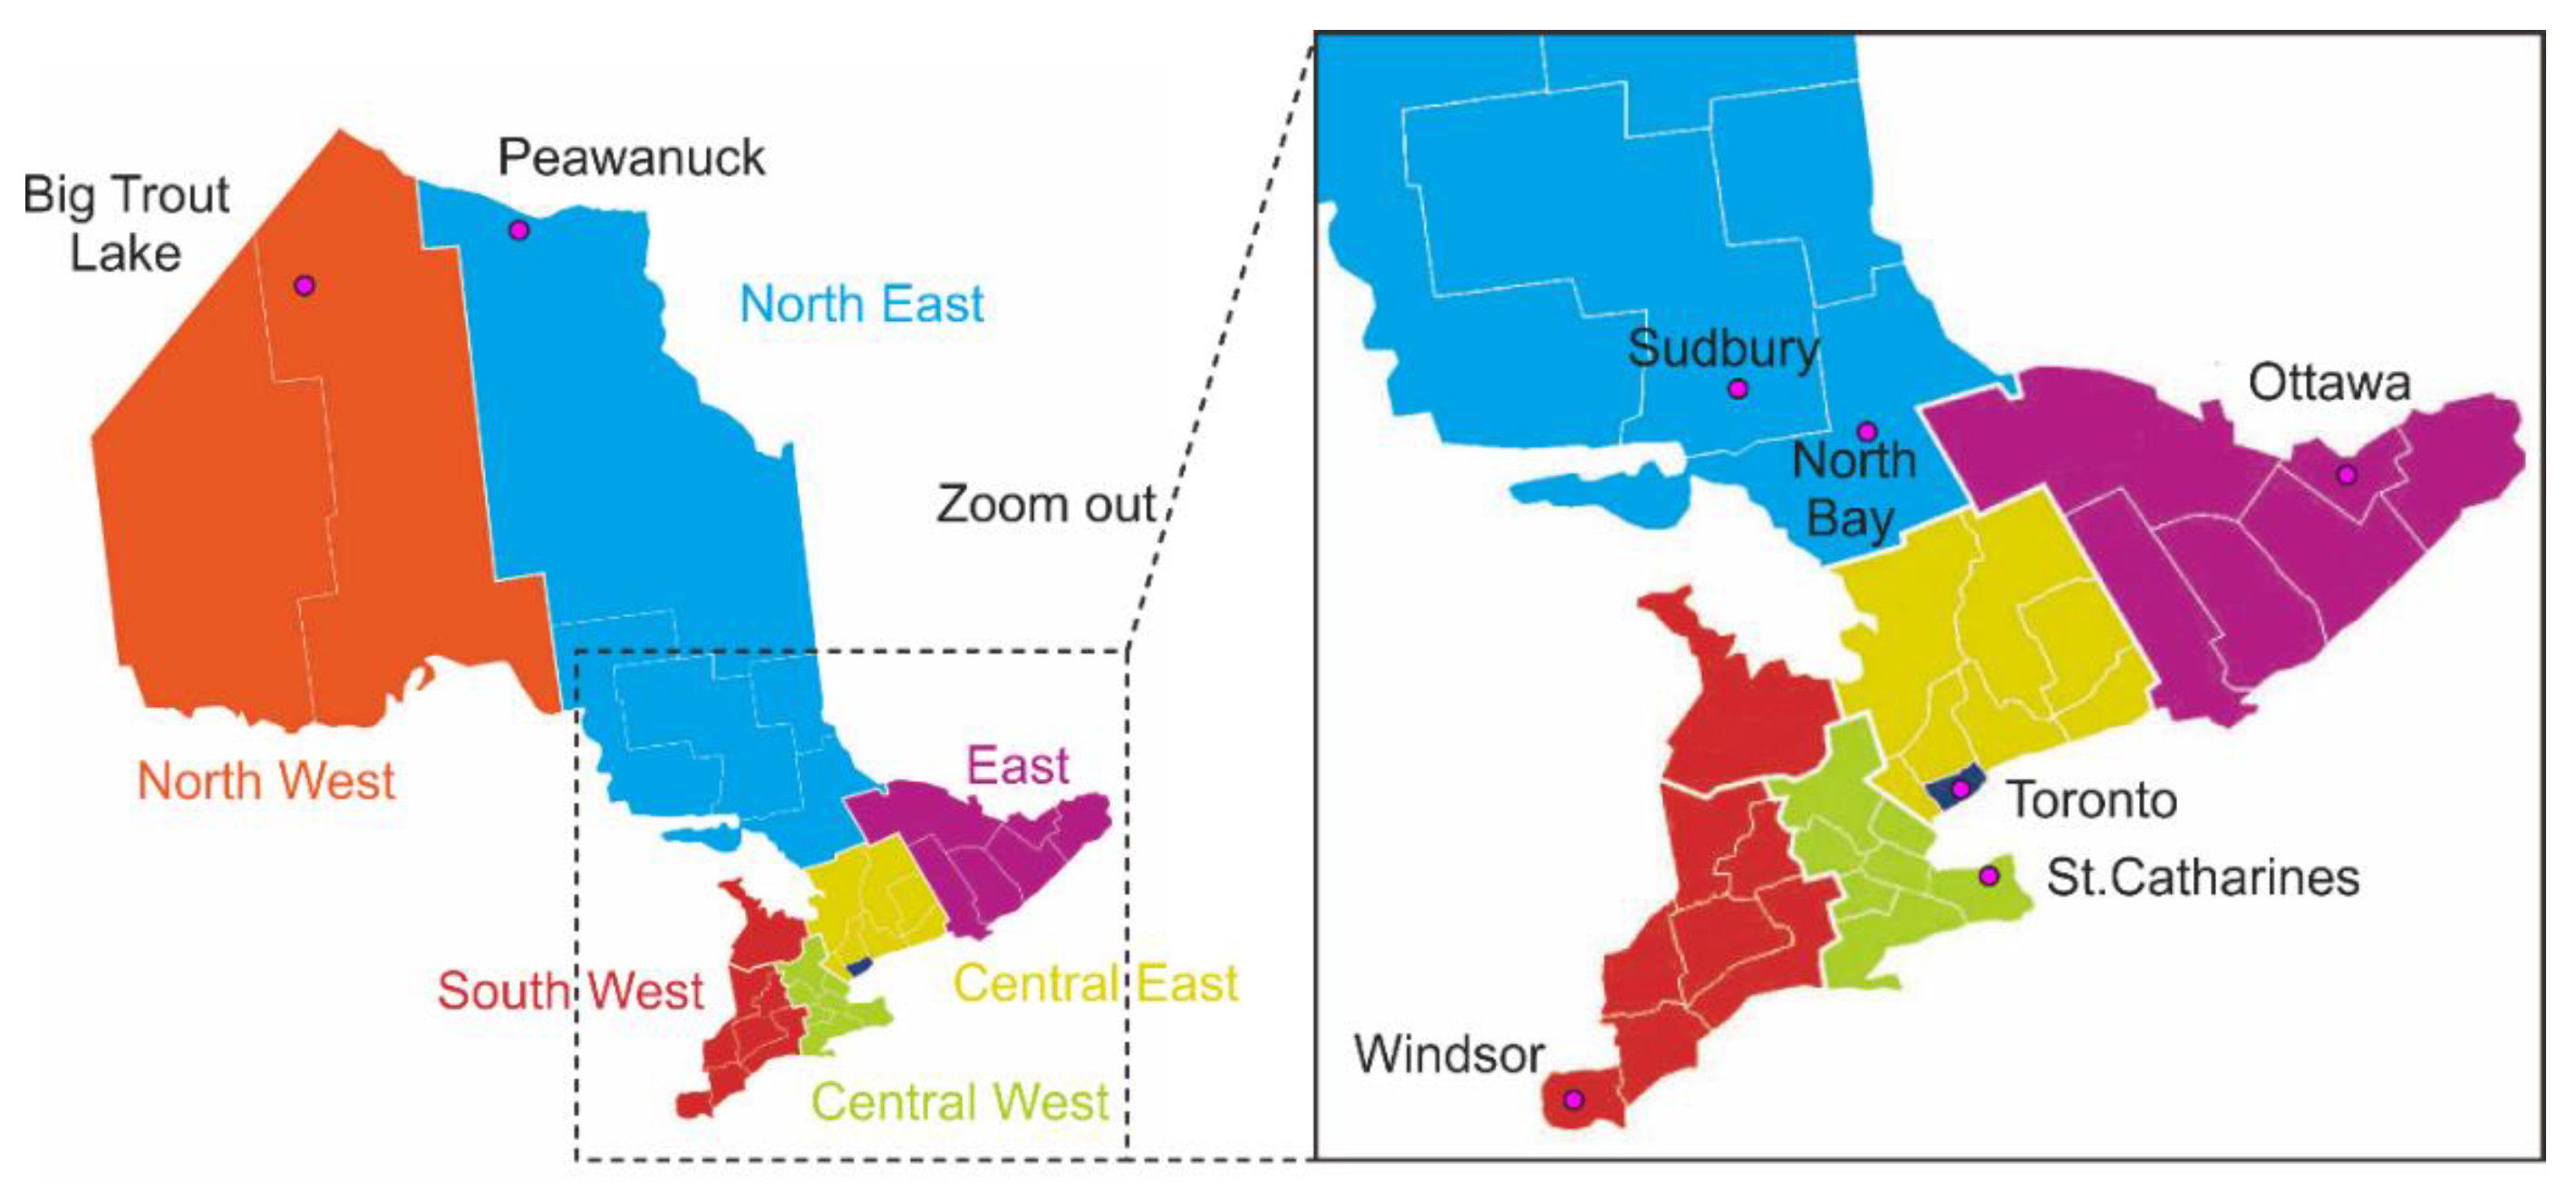
2.1. Climate Zones & Cities
2.2. Climate Models
2.3. Degree Days
2.4. ASHRAE Climate Design Condition
2.5. Data Analysis
2.5.1. Probability of Exceedance
2.5.2. Weather Data Analysis
3. Results and Discussion
3.1. Past and Future Temperature
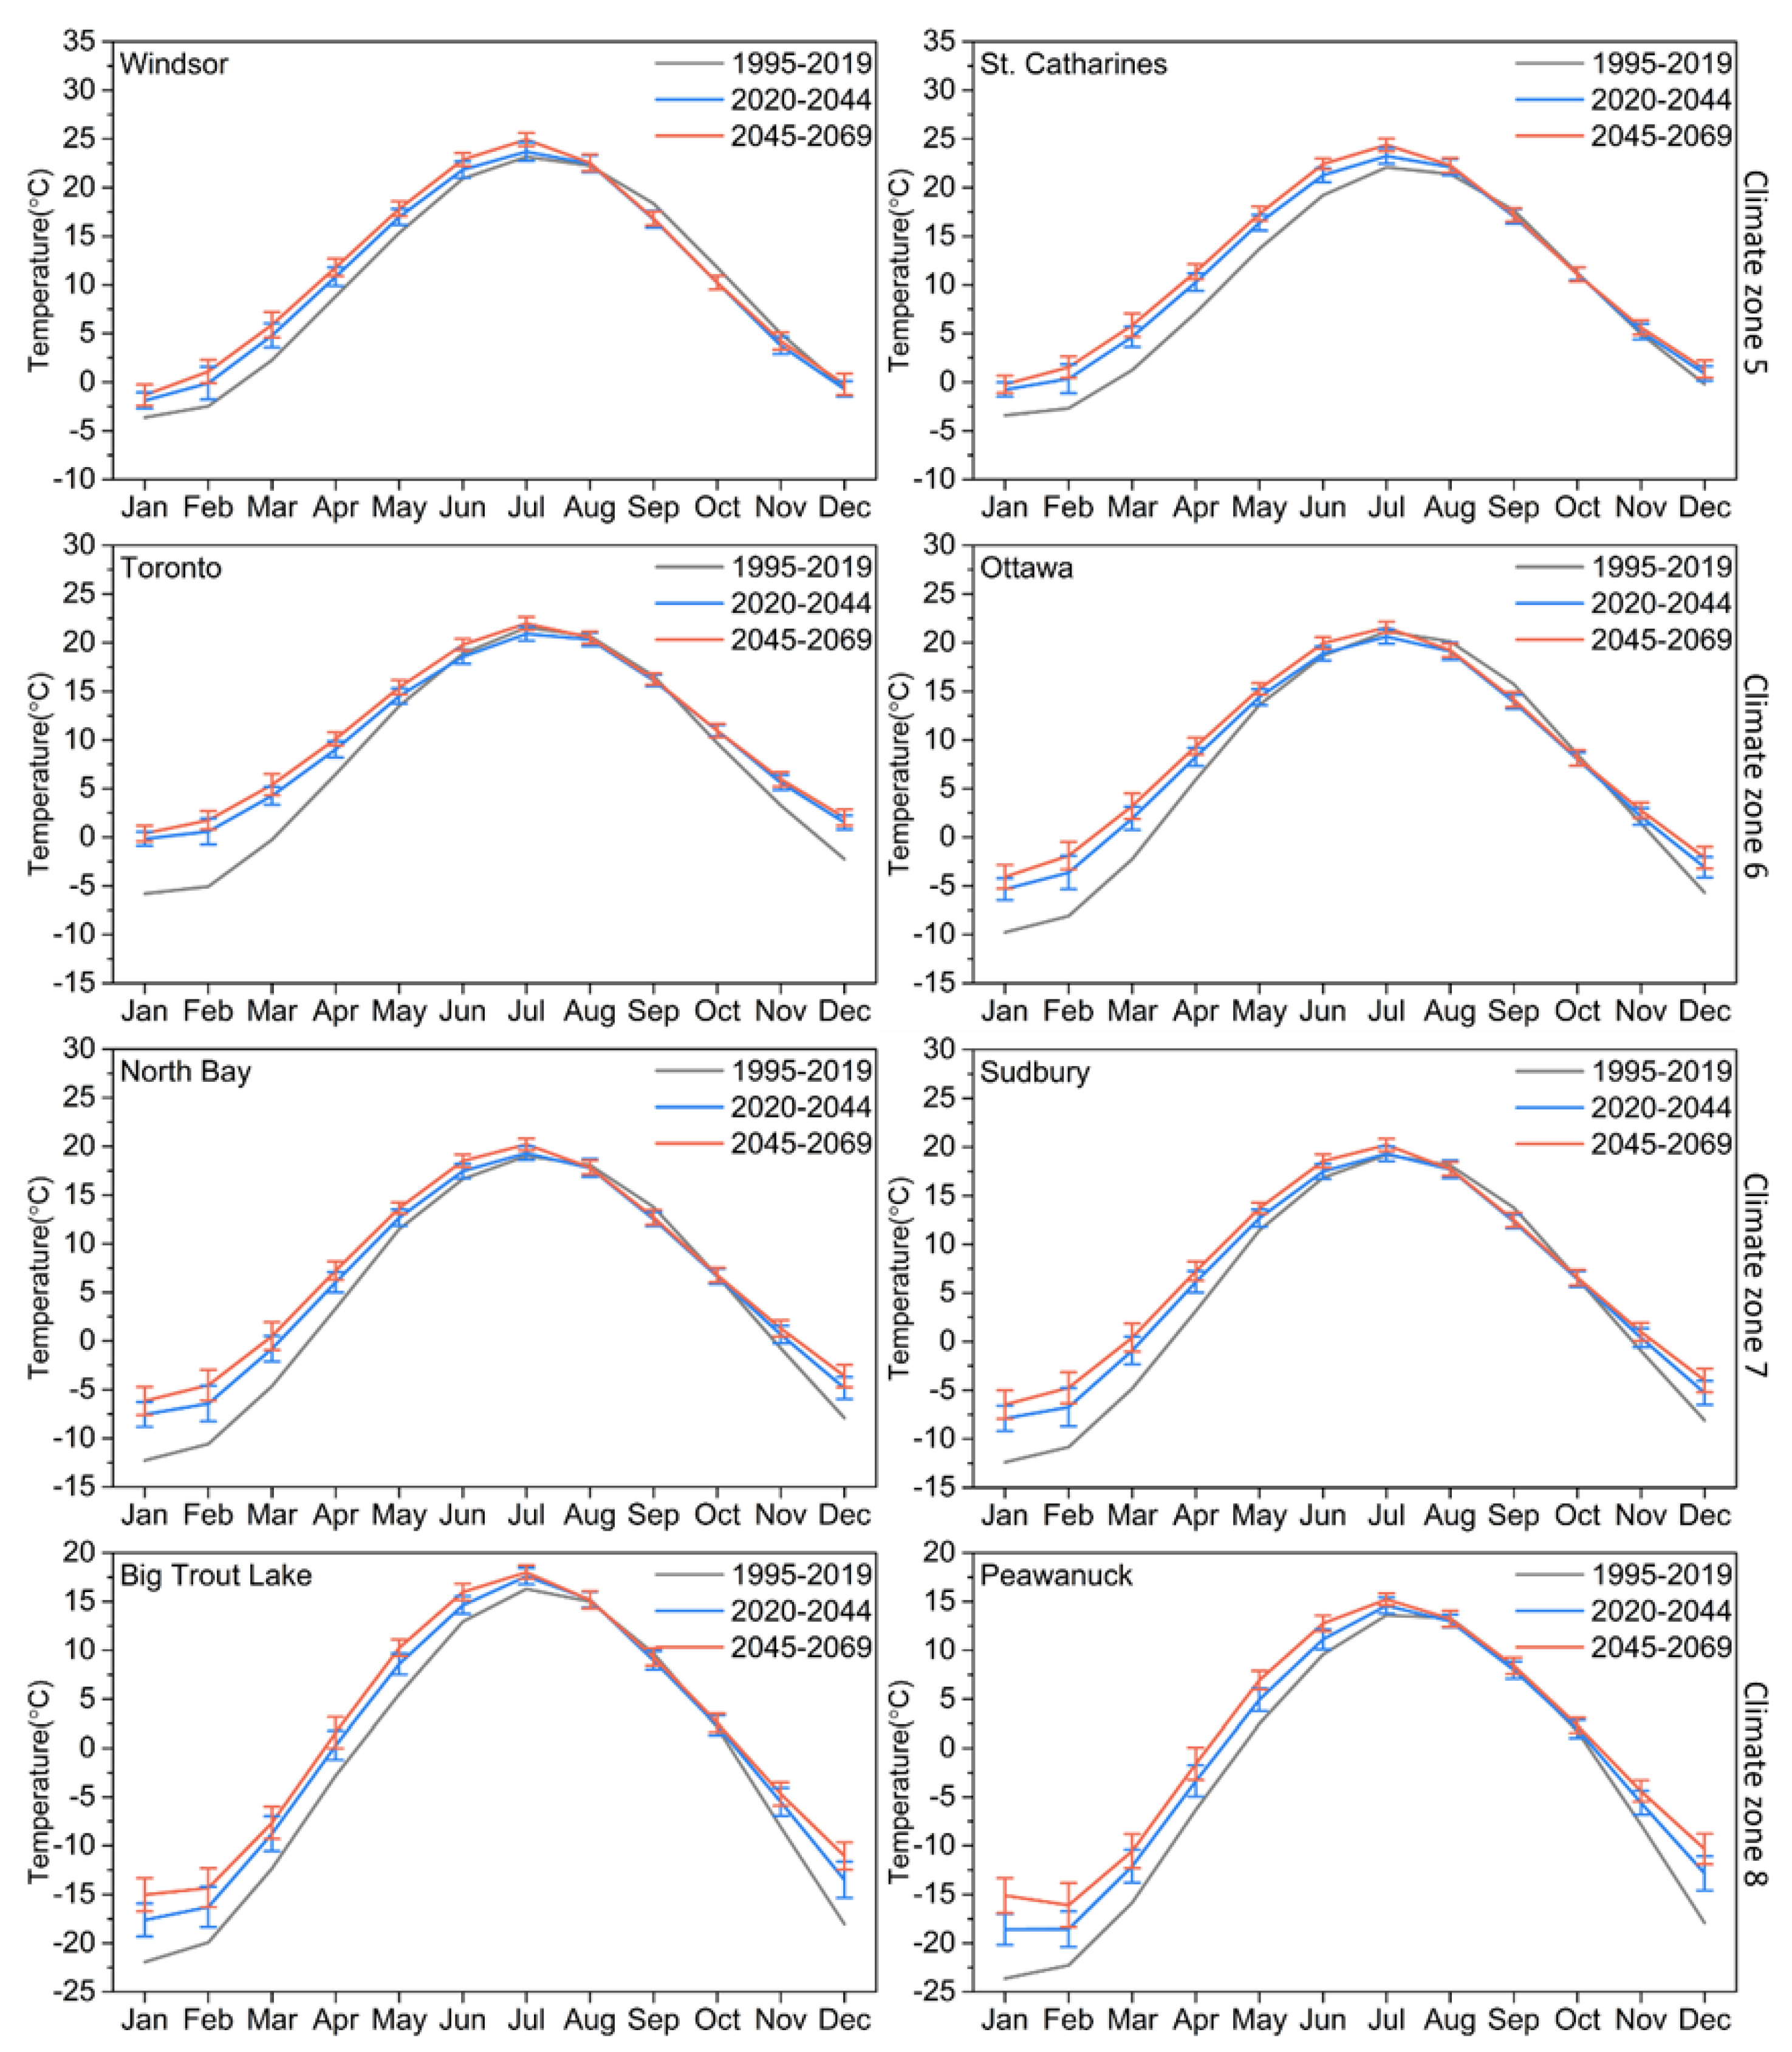
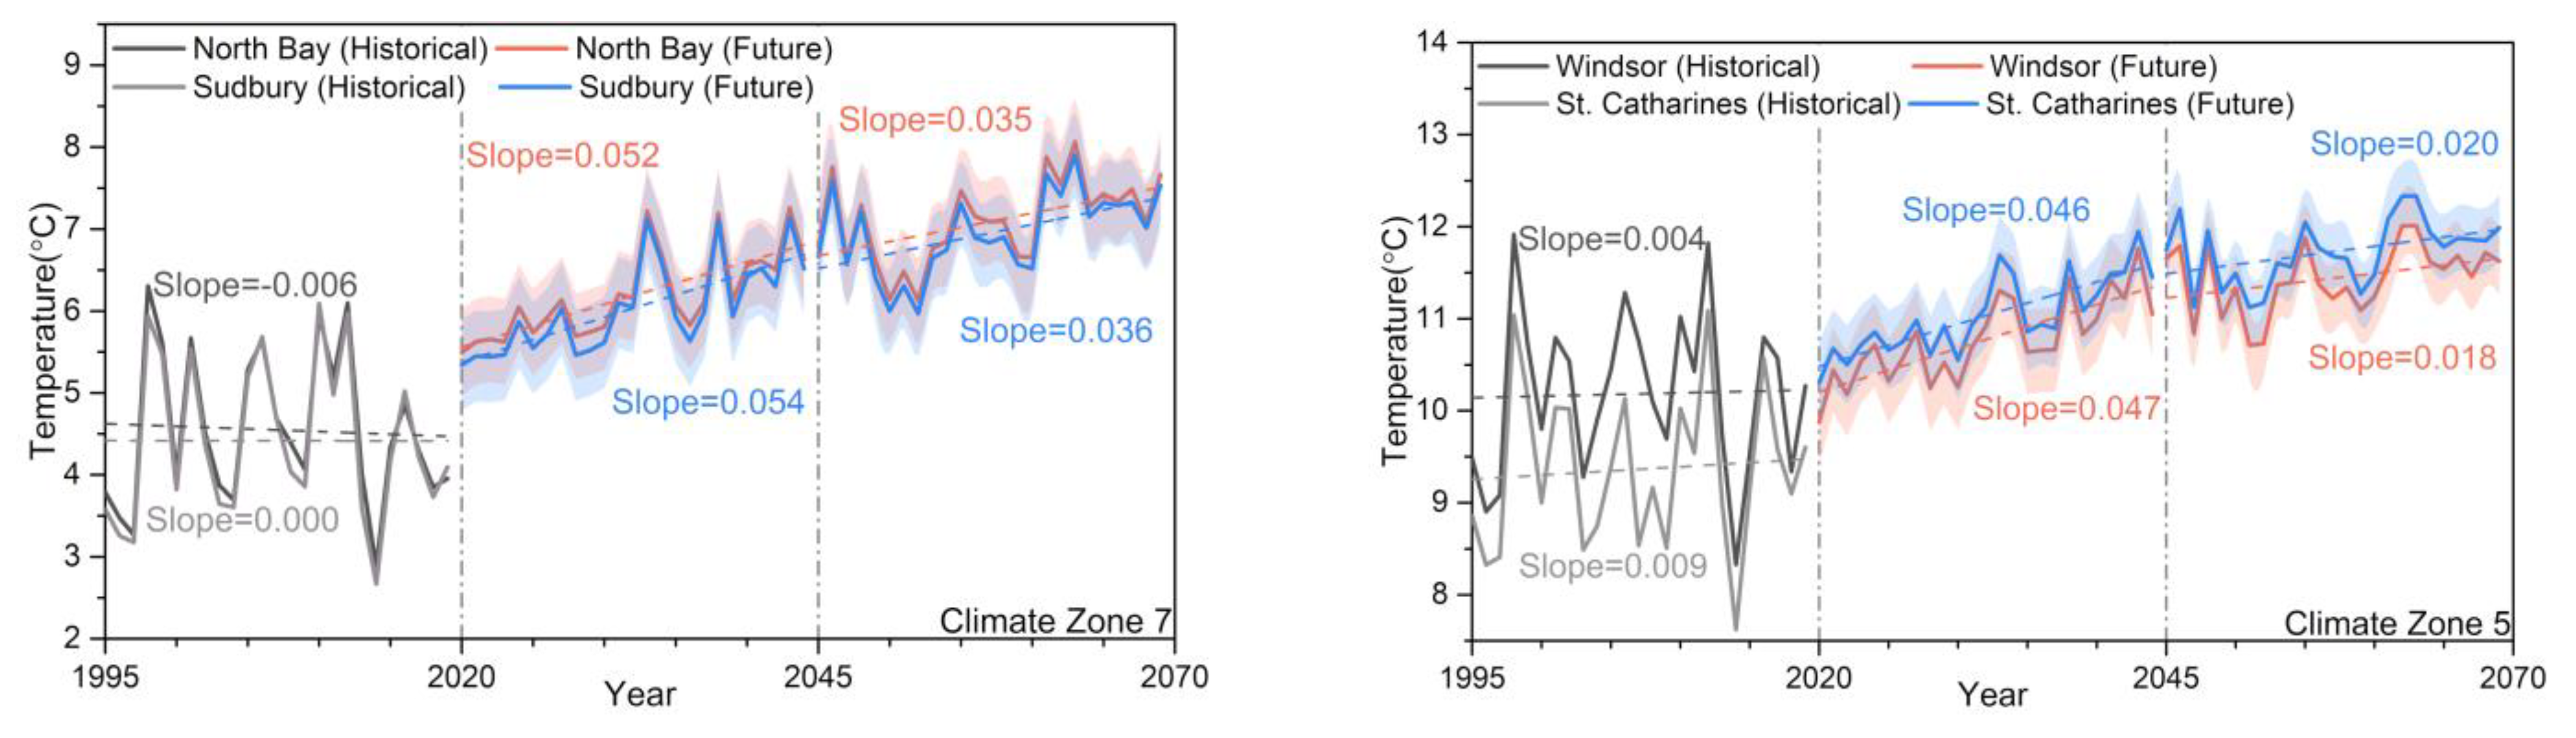
3.1.1. Monthly
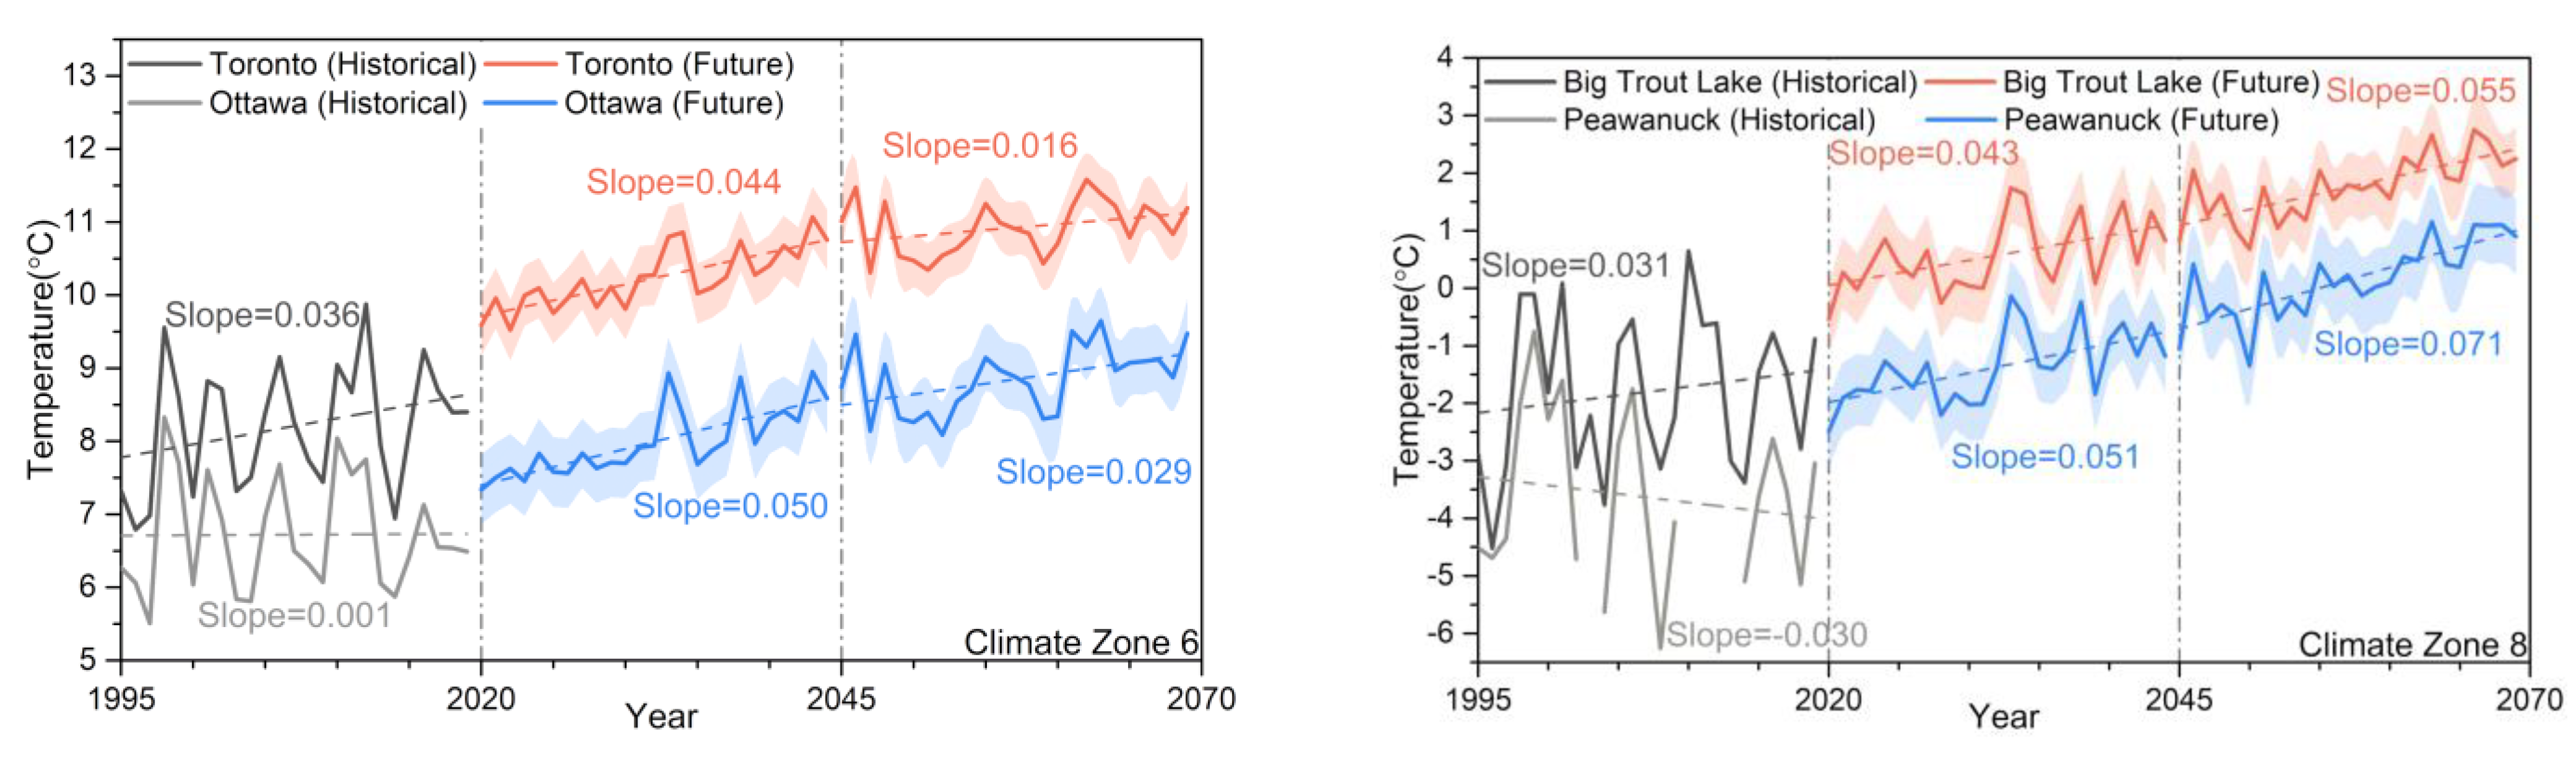
3.1.2. Annual
3.2. Past and Future Degree Day
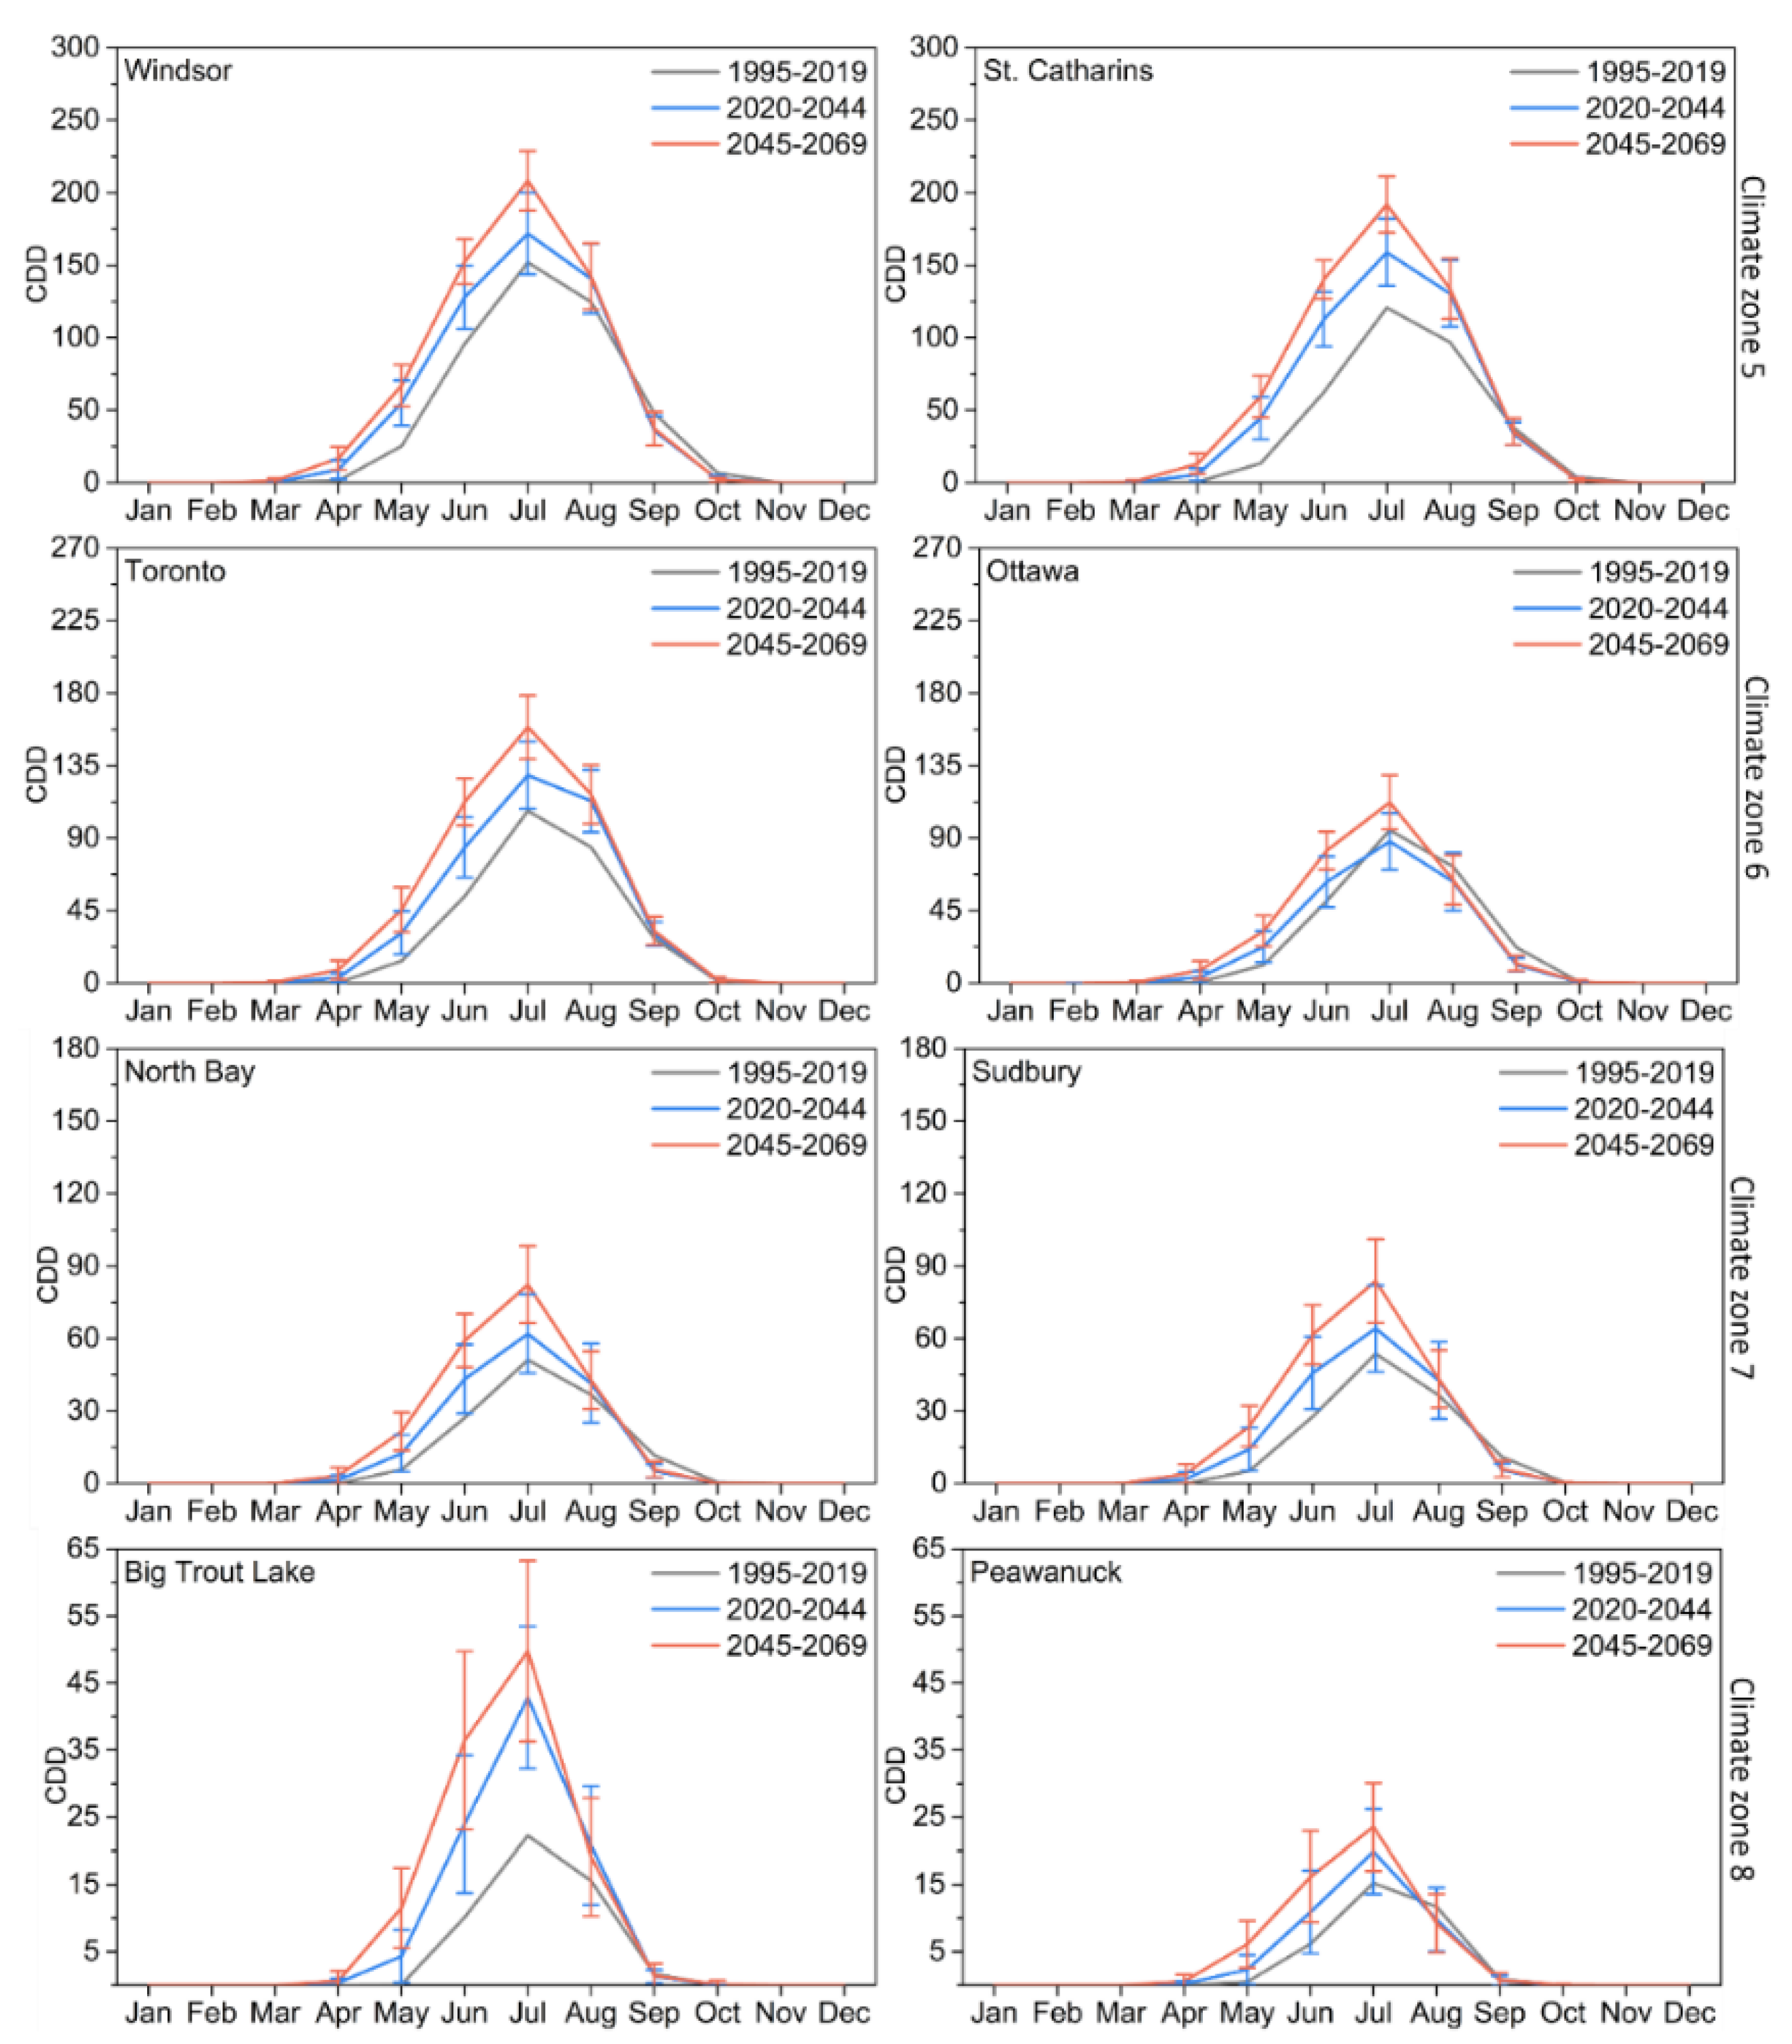
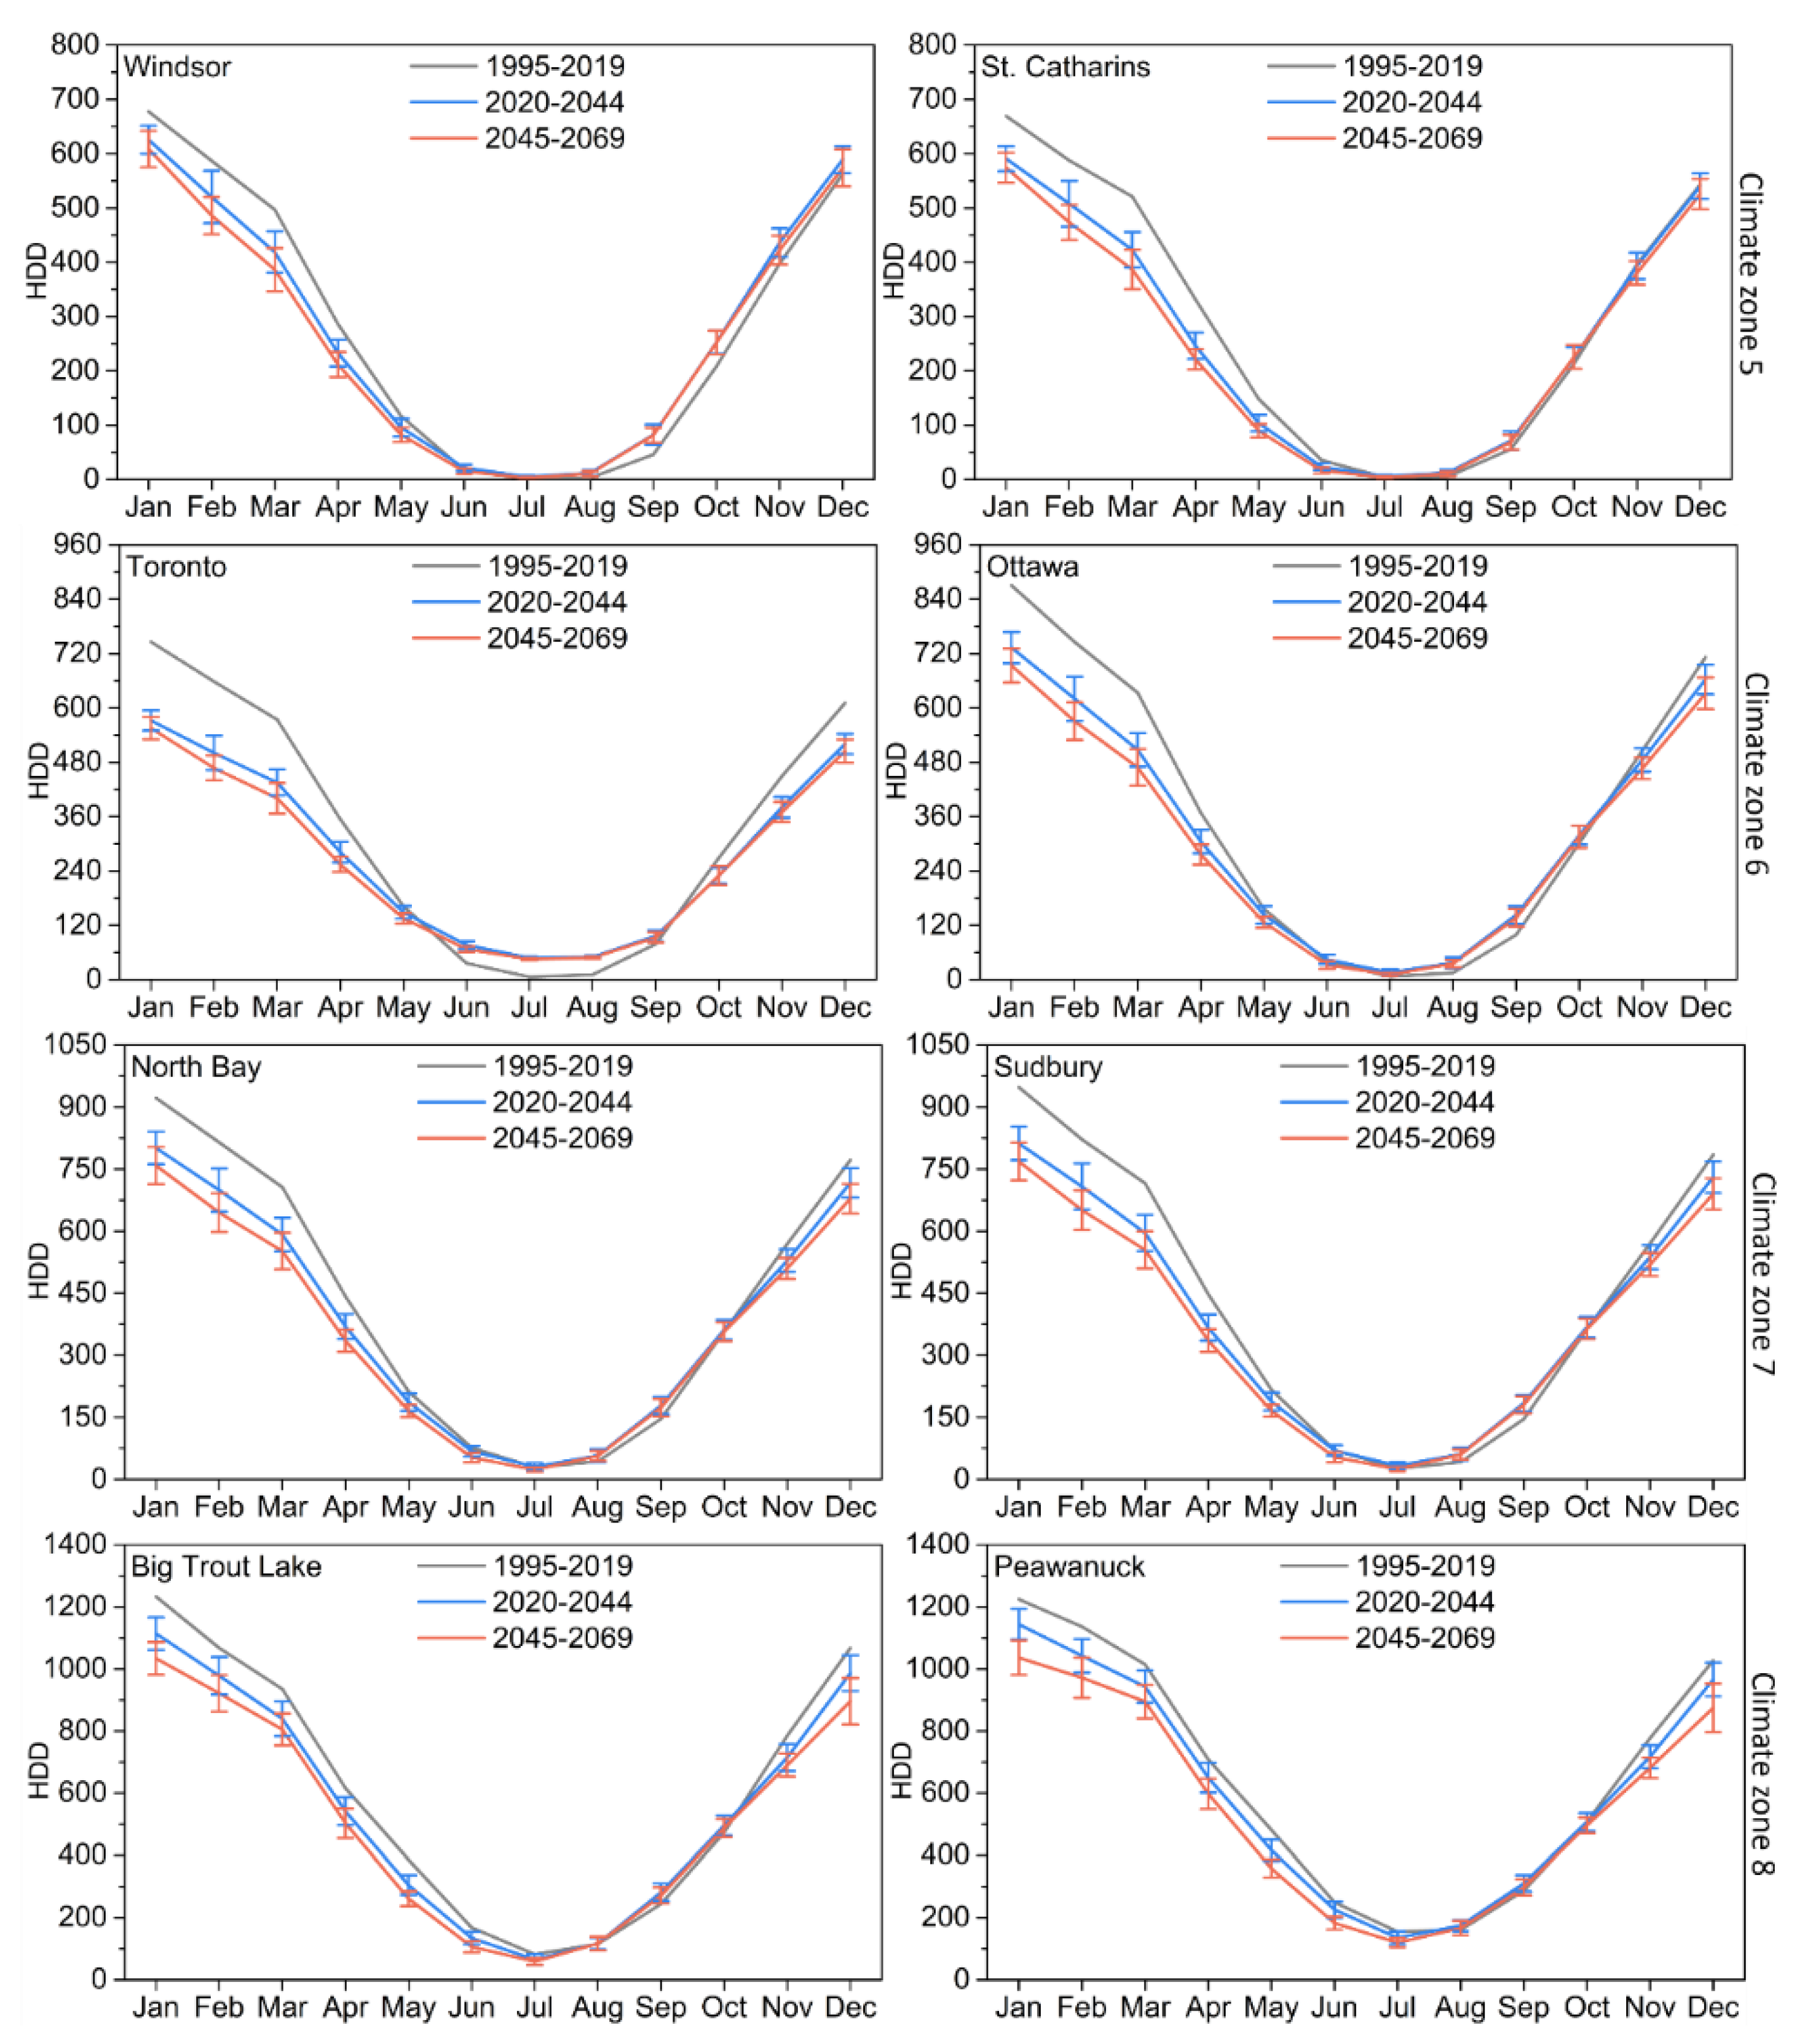
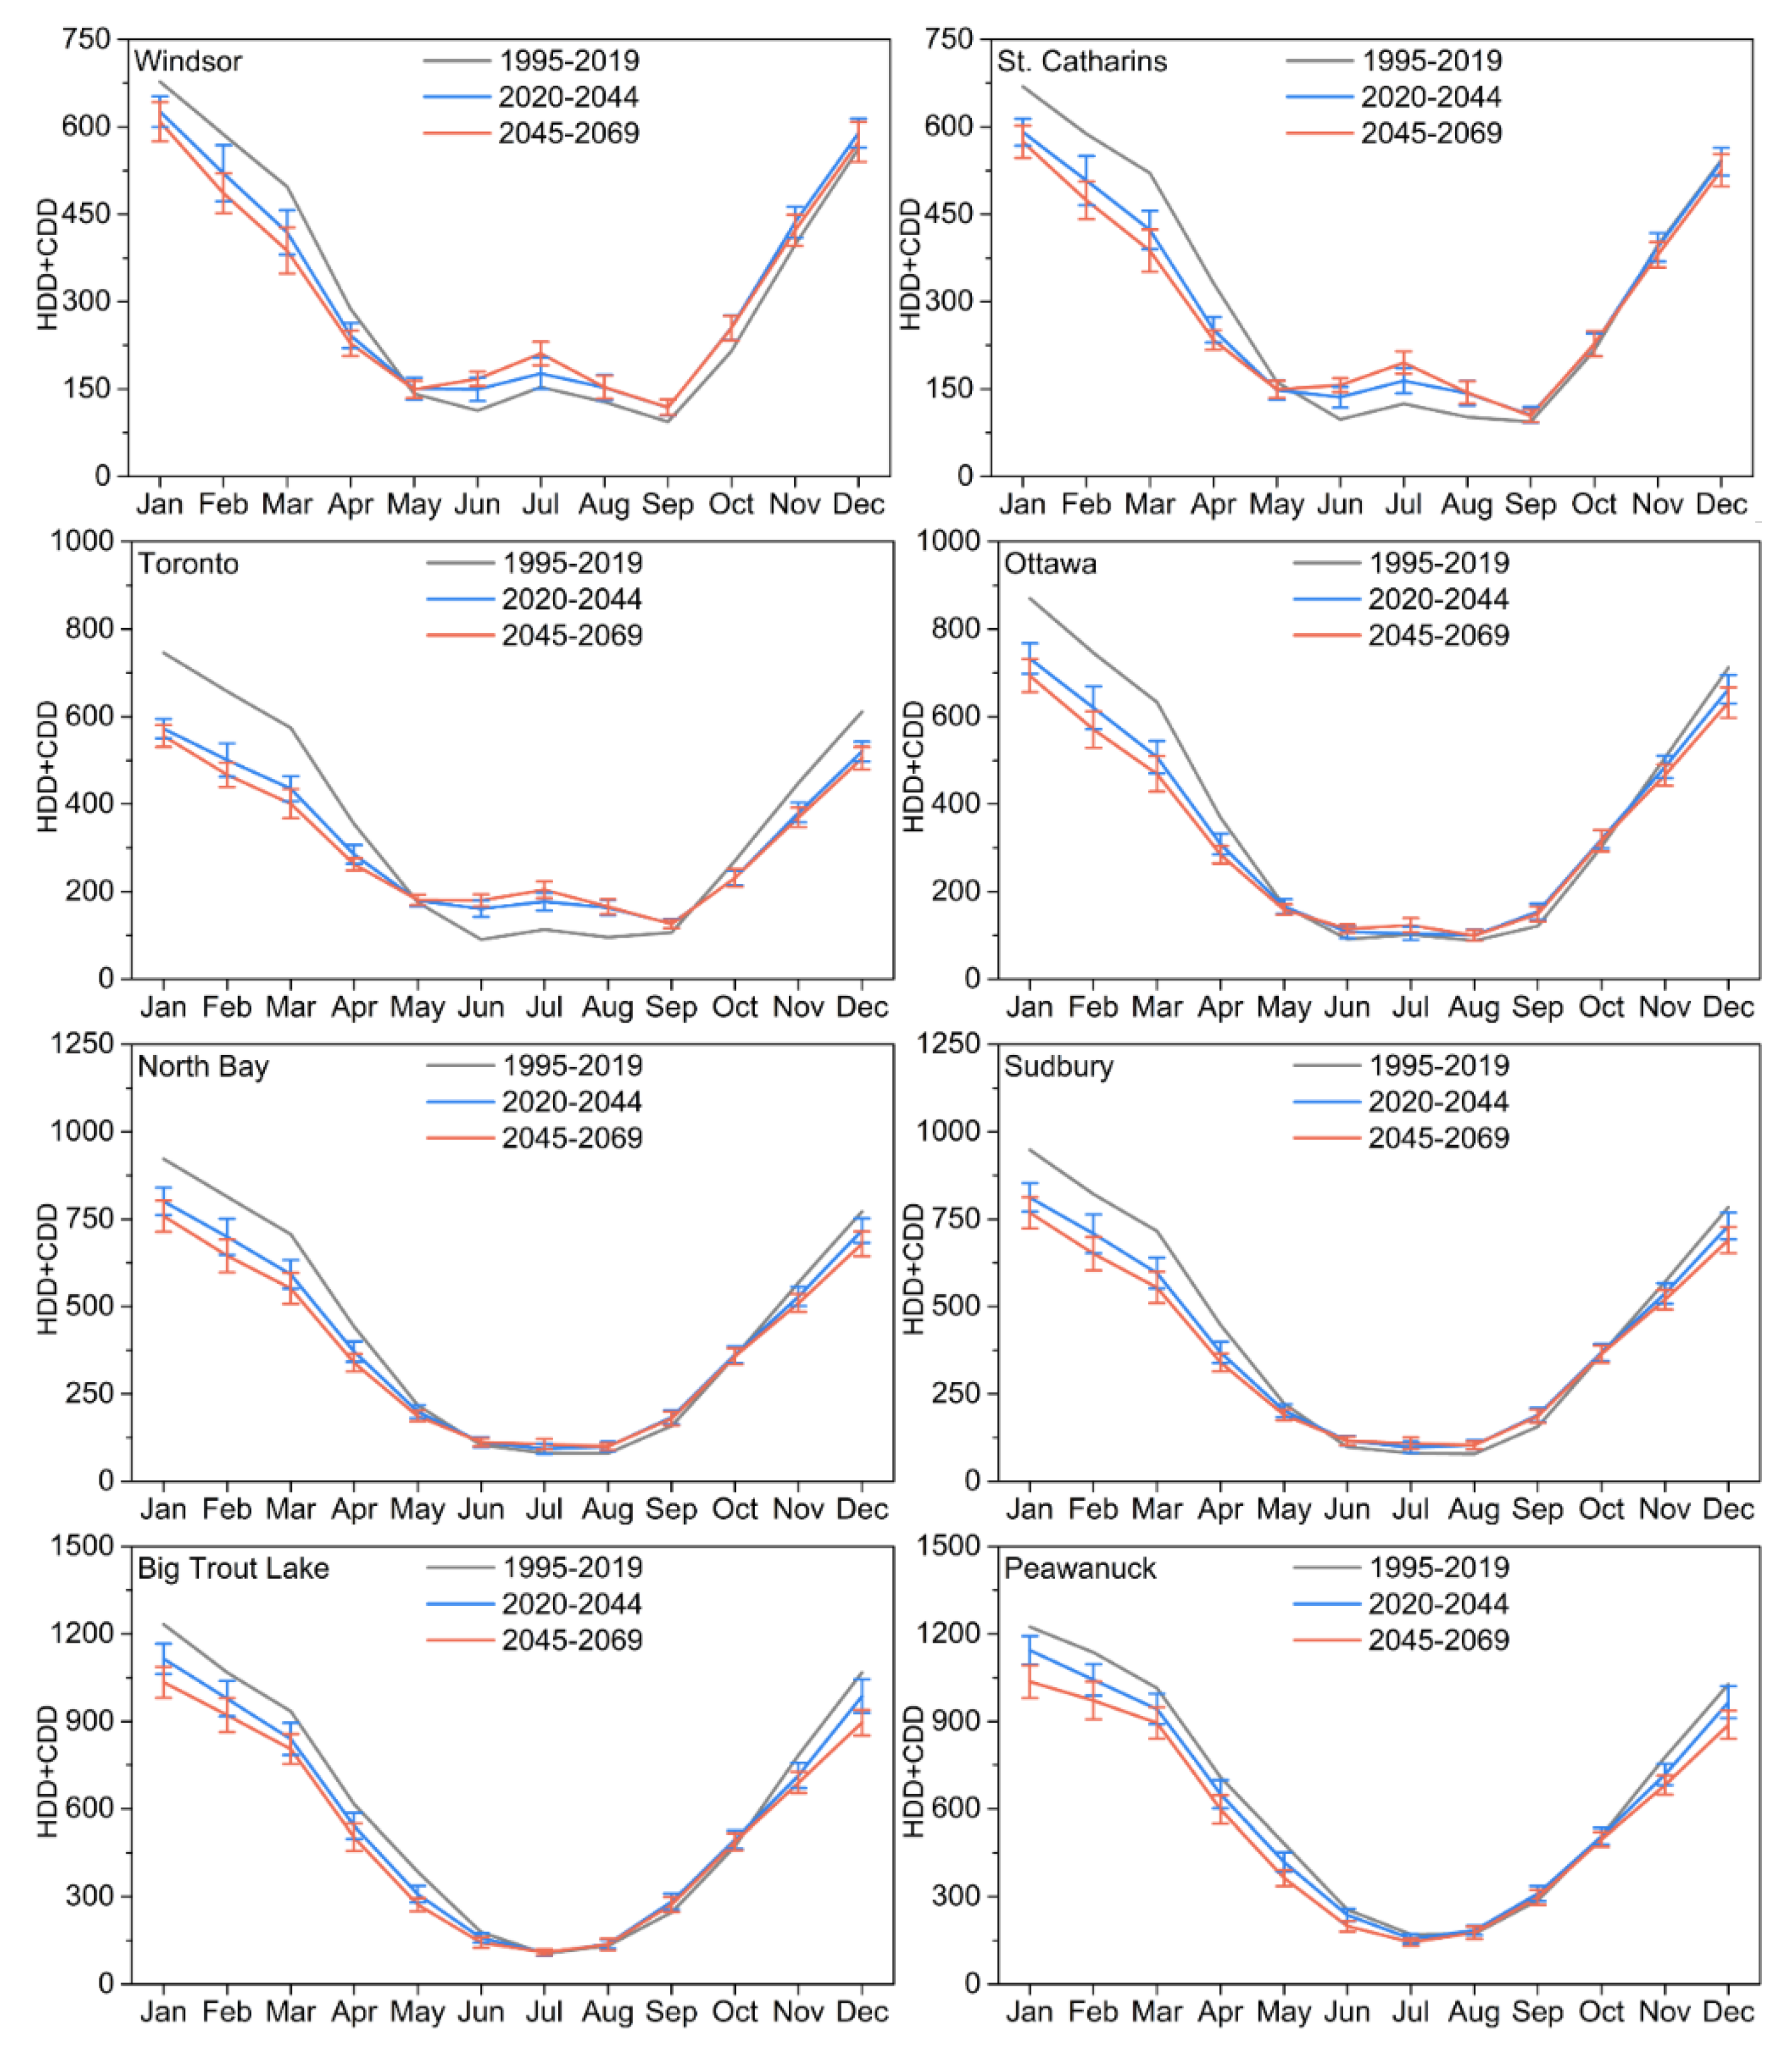
3.2.1. Monthly
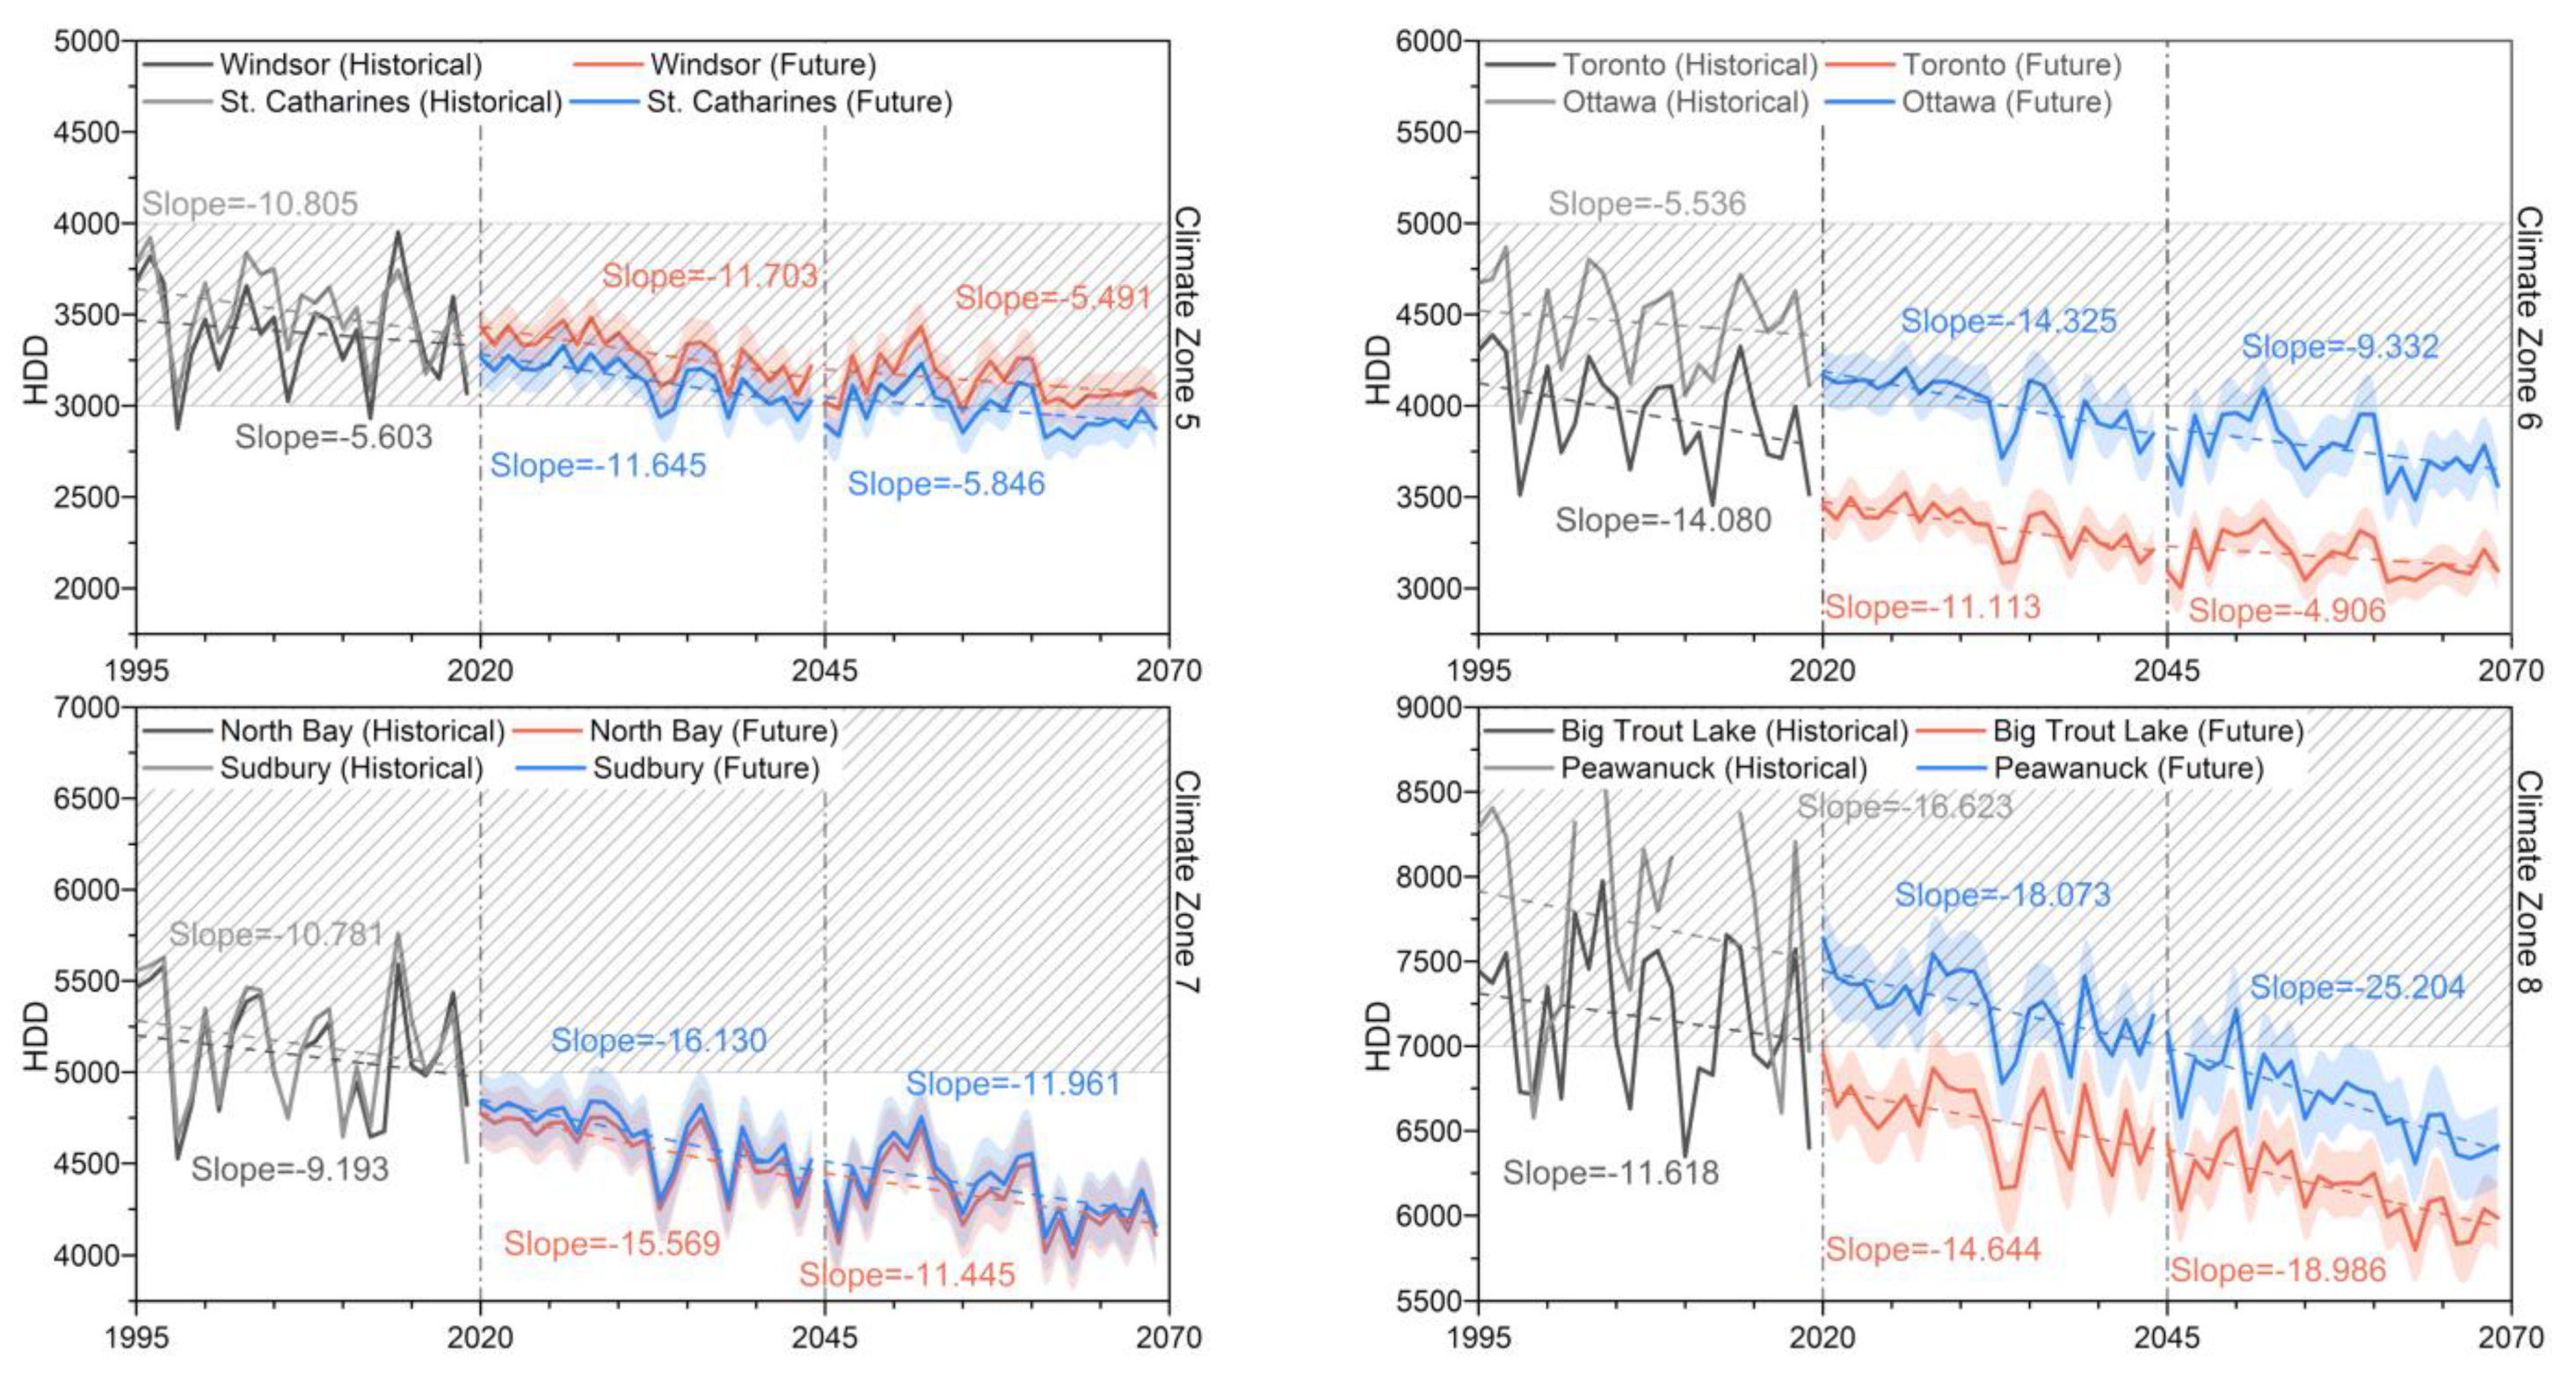
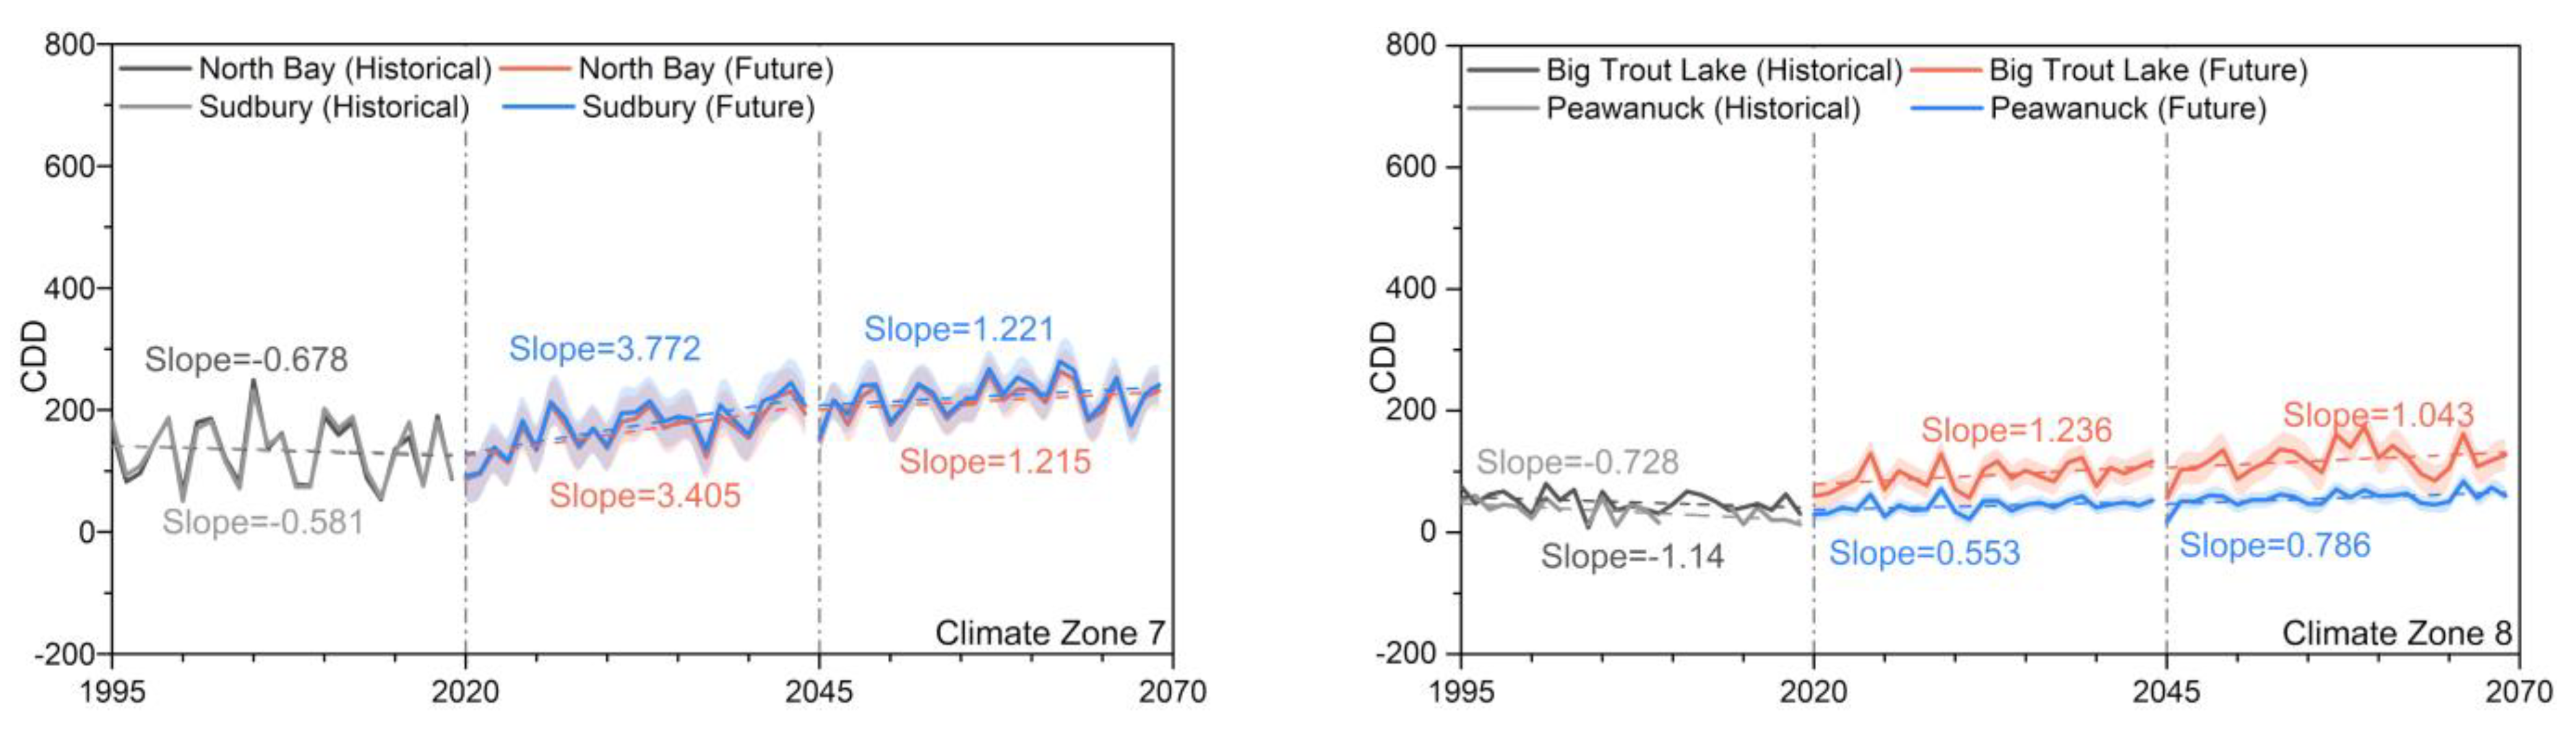
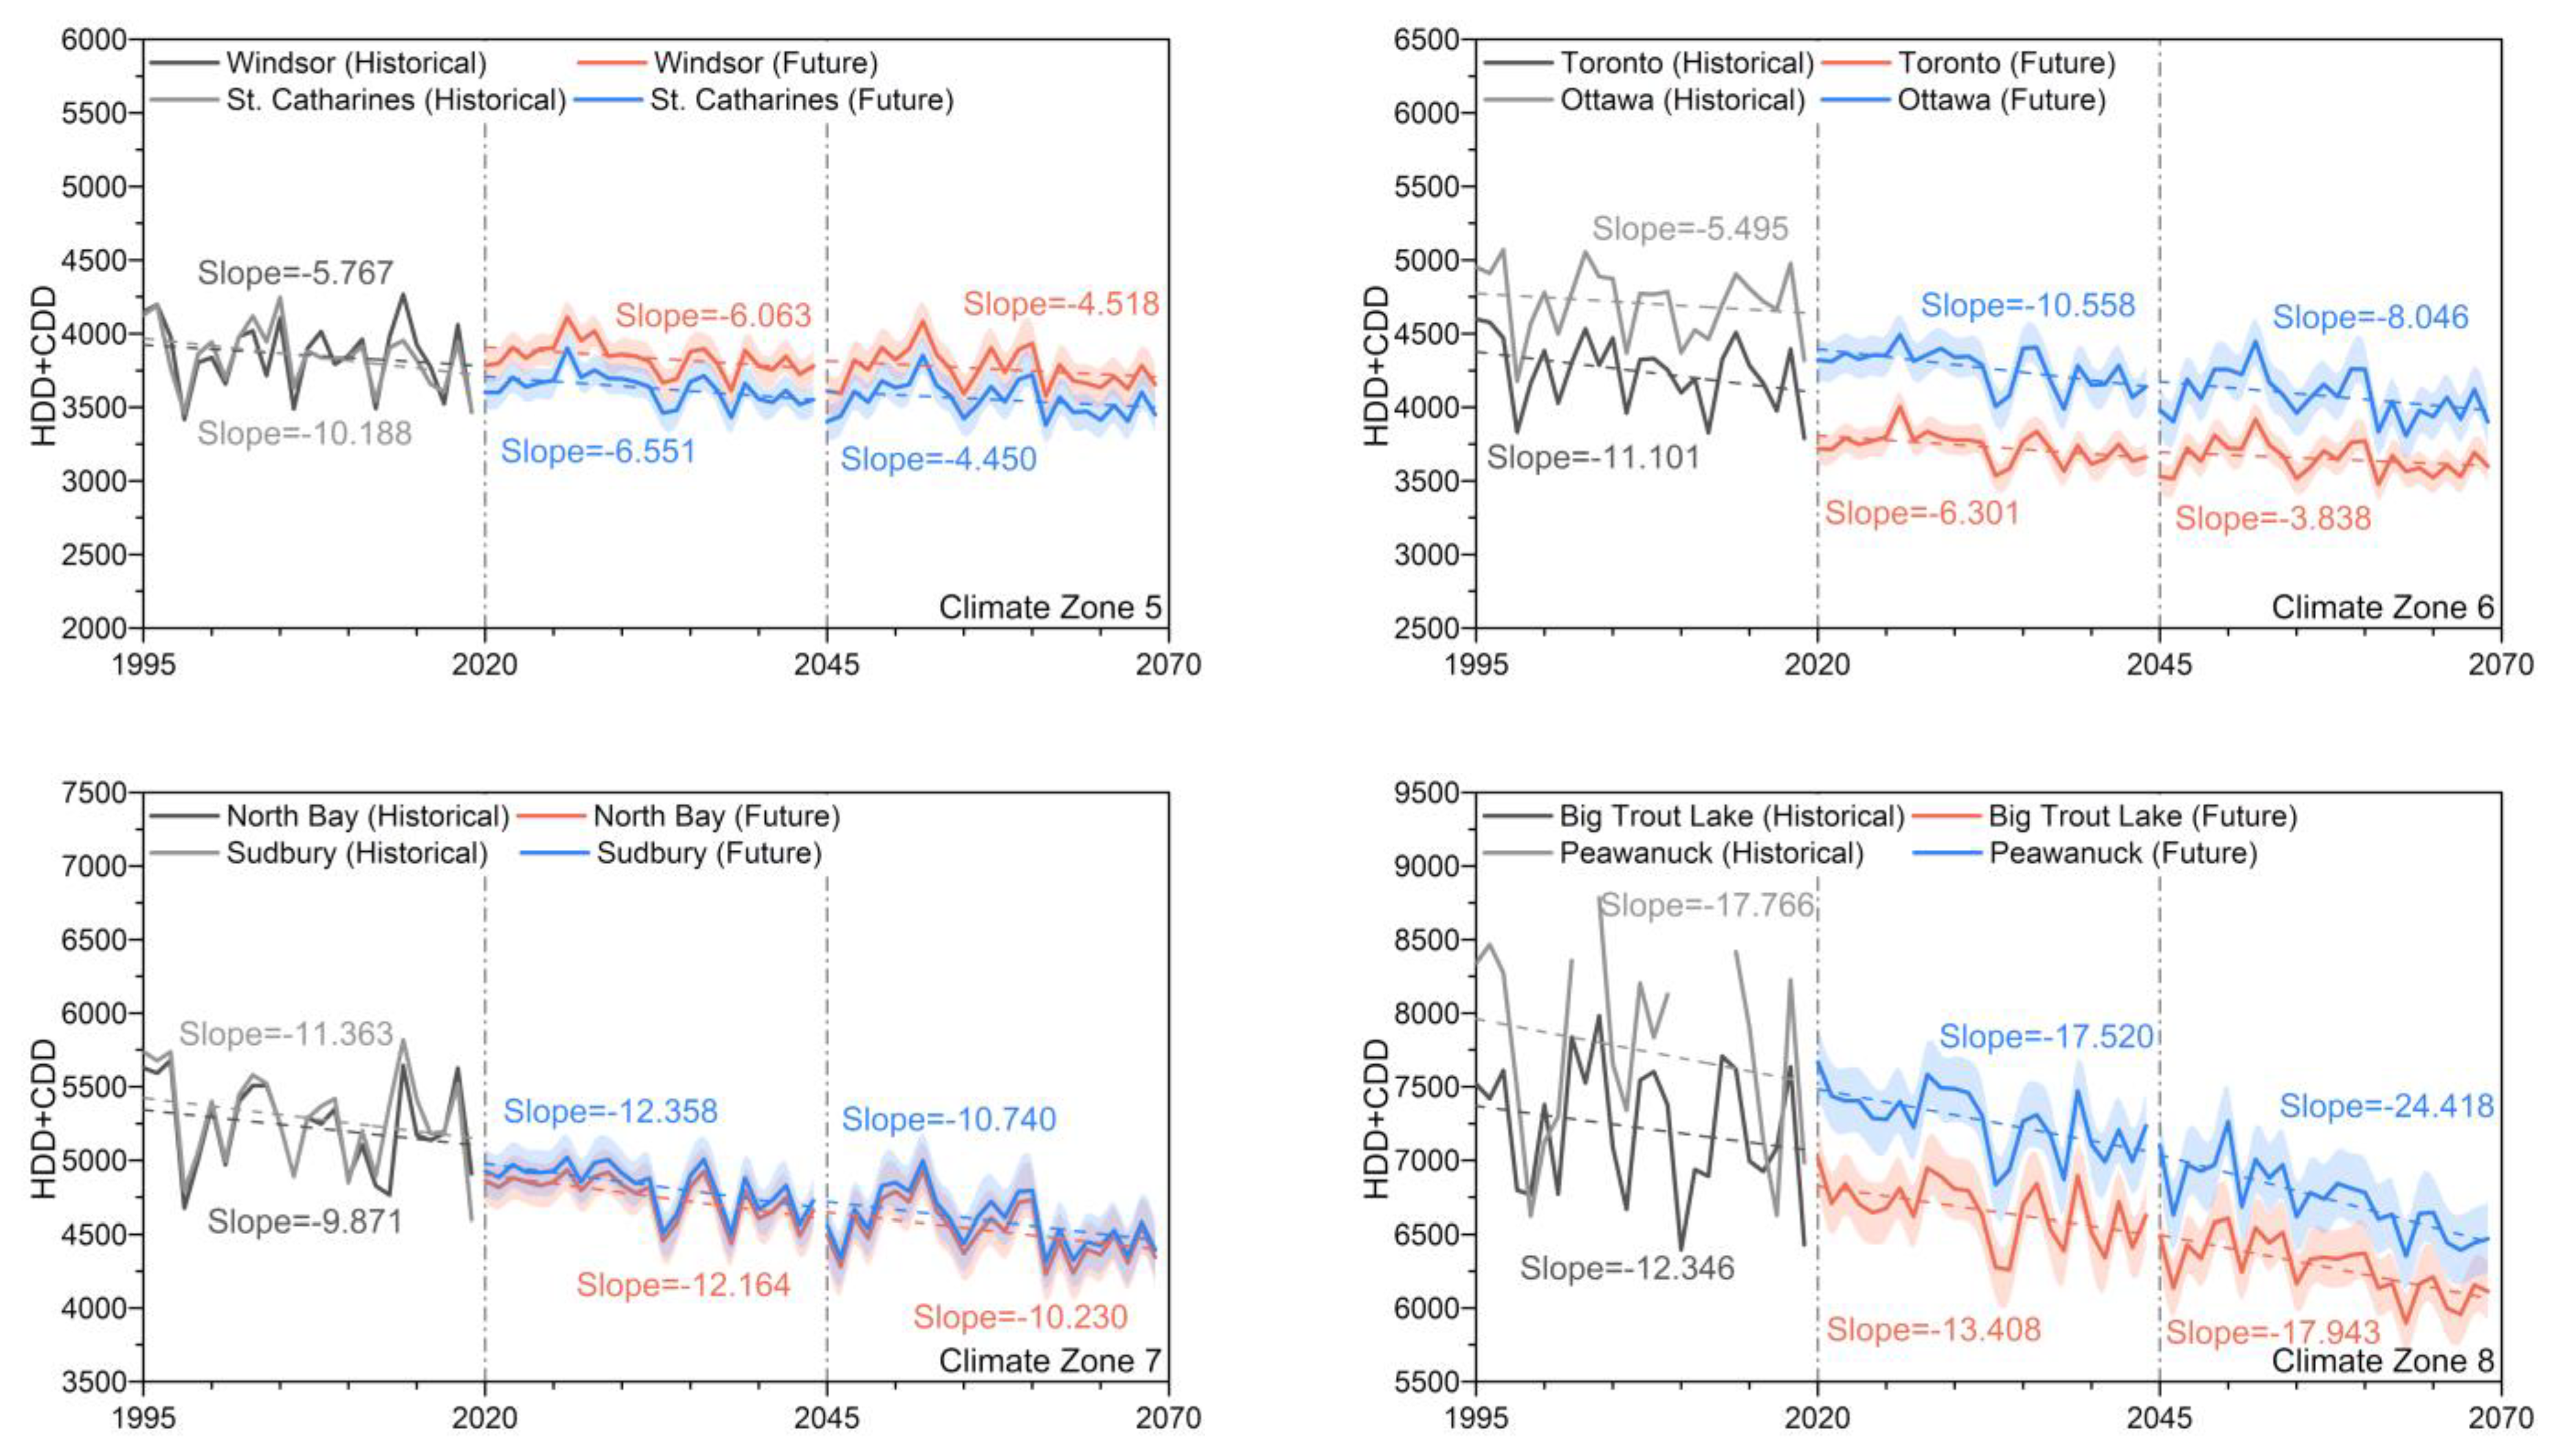
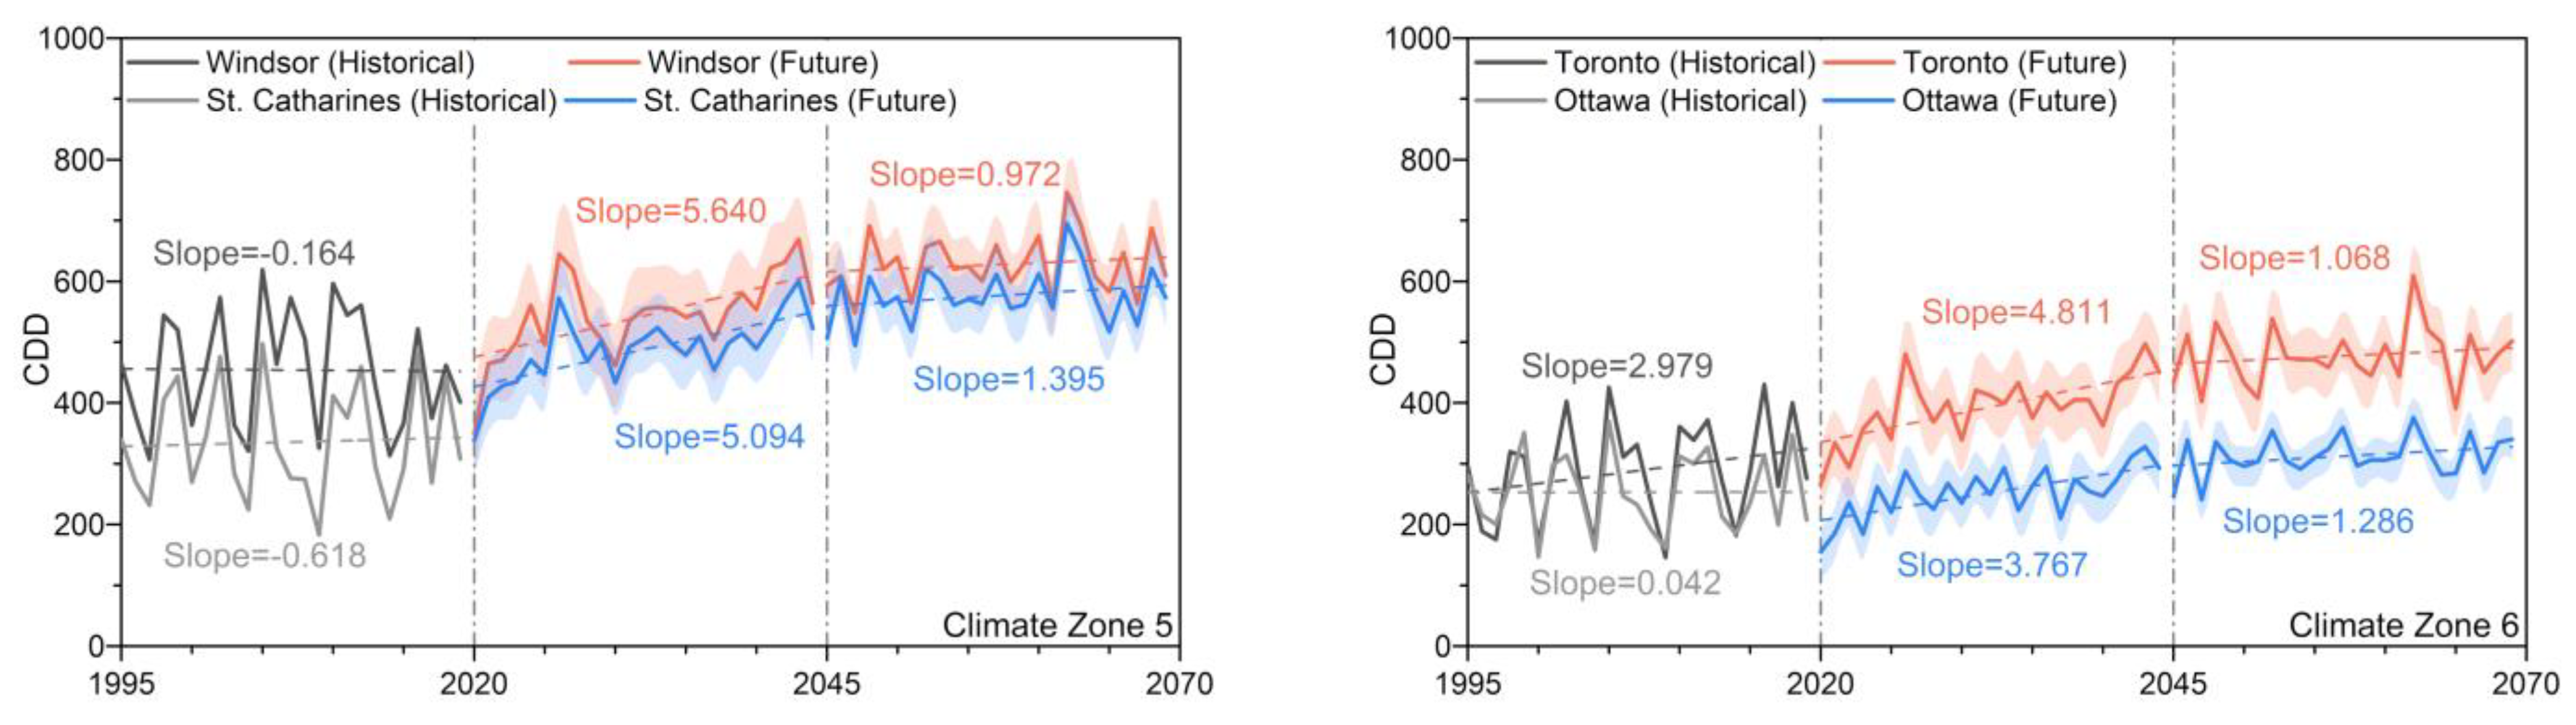
3.2.2. Annual
3.3. Probability of Degree Days Exceeding ASHRAE Design Requirement
3.4. Risk Assessment
3.4.1. Health
3.4.2. Safety
3.4.3. Economy
4. Conclusions & Recommendations
Author Contributions
Funding
Acknowledgments
Conflicts of Interest
References
- The Earth Observatory. If Earth Has Warmed and Cooled Throughout History, What Makes Scientists Think That Humans Are Causing Global Warming Now? 2020. Available online: https://earthobservatory.nasa.gov/blogs/climateqa/category/climate-human-impact/ (accessed on 14 July 2021).
- Intergovernmental Panel on Climate Change. Climate change 2014: Synthesis report. In Contribution of Working Groups I, II and III to the Fifth Assessment Report of the Intergovernmental Panel on Climate Change; Core Writing Team, Pachauri, R.K., Meyer, L.A., Eds.; IPCC: Geneva, Switzerland, 2014; p. 151. [Google Scholar]
- Karl, T.R.; Trenberth, K.E. Modern Global Climate Change. Science 2003, 302, 1719–1723. [Google Scholar] [CrossRef] [PubMed] [Green Version]
- Bush, E.; Lemmen, D.S. Canada’s Changing Climate Report; Government of Canada: Ottawa, ON, Canada, 2019.
- Intergovernmental Panel on Climate Change. Summary for Policymakers. In Global Warming of 1.5 °C; Masson-Delmotte, V., Zhai, P., Pörtner, H.O., Eds.; World Meteorological Organization: Geneva, Switzerland, 2018. [Google Scholar]
- Government of Canada. Oil Sands: A Strategic Resource for Canada, North America and the Global Market: GHG Emissions; Government of Canada: Ottawa, ON, Canada, 2016.
- Abergel, T.; Dean, B.; Dulac, J. Towards a Zero-Emission, Efficient, and Resilient Buildings and Construction Sector: Global Status Report 2017; UN Environment and International Energy Agency: Paris, France, 2017. [Google Scholar]
- NRCan. Energy and Greenhouse Gas Emissions (GHGs); Natural Resources Canada: Ottawa, ON, Canada, 2020.
- Boyd, D.W. Degree Days: The Different Types; National Research Council Canada: Ottawa, ON, Canada, 1979. [Google Scholar] [CrossRef]
- American Society of Heating Refrigerating Air-Conditioning Engineers. 2017 ASHRAE Handbook: Fundamentals; ASHRAE: Peachtree Corners, GA, USA, 2017. [Google Scholar]
- Day, T. Degree-Days: Theory and Application; The Chartered Institution of Building Services Engineers: London, UK, 2006; p. 106. [Google Scholar]
- Semmler, T.; McGrath, R.; Steele-Dunne, S.; Hanafin, J.; Nolan, P.; Wang, S. Influence of climate change on heating and cooling energy demand in Ireland. Int. J. Clim. 2009, 30, 1502–1511. [Google Scholar] [CrossRef]
- Matzarakis, A.; Thomsen, F. Heating and Cooling Degree Days as an Indicator of Climate Change in Freiburg; University of Freiburg: Freiburg, Germany, 2008; Available online: https://www.researchgate.net/publication/237533426_HEATING_AND_COOLING_DEGREE_DAYS_AS_AN_INDICATOR_OF_CLIMATE_CHANGE_IN_FREIBURG (accessed on 1 April 2022).
- Petri, Y.; Caldeira, K. Impacts of global warming on residential heating and cooling degree-days in the United States. Sci. Rep. 2015, 5, 12427. [Google Scholar] [CrossRef] [PubMed] [Green Version]
- Li, D.H.; Yang, L.; Lam, J.C. Impact of climate change on energy use in the built environment in different climate zones—A review. Energy 2012, 42, 103–112. [Google Scholar] [CrossRef]
- Shi, Y.; Wang, G.; Gao, X.; Xu, Y. Effects of climate and potential policy changes on heating degree days in current heating areas of China. Sci. Rep. 2018, 8, 10211. [Google Scholar] [CrossRef] [PubMed] [Green Version]
- De Rosa, M.; Bianco, V.; Scarpa, F.; Tagliafico, L.A. Historical trends and current state of heating and cooling degree days in Italy. Energy Convers. Manag. 2015, 90, 323–335. [Google Scholar] [CrossRef]
- Shi, J.; Cui, L.; Tian, Z.; Yu, Q. Impact of temperature change on heating and cooling energy consumption of residential buildings in East China. J. Nat. Resour. 2011, 26, 460467. [Google Scholar]
- Olonscheck, M.; Holsten, A.; Kropp, J.P. Heating and cooling energy demand and related emissions of the German residential building stock under climate change. Energy Policy 2011, 39, 4795–4806. [Google Scholar] [CrossRef]
- Christensen, O.B.; Drews, M.; Christensen, J.H.; Dethloff, K.; Ketelsen, K.; Hebestadt, I.; Rinke, A. The HIRHAM Regional Climate Model, Version 5 (Beta); Technical Report; Danish Climate Centre, Danish Meteorological Institute: Copenhagen, Denmark, 2007. [Google Scholar]
- Cartalis, C.; Synodinou, A.; Proedrou, M.; Tsangrassoulis, A.; Santamouris, M. Modifications in energy demand in urban areas as a result of climate changes: An assessment for the southeast Mediterranean region. Energy Convers. Manag. 2001, 42, 1647–1656. [Google Scholar] [CrossRef]
- Lee, K.; Levermore, G.J. Weather data for future climate change for South Korean building design: Analysis for trends. Arch. Sci. Rev. 2010, 53, 157–171. [Google Scholar] [CrossRef]
- Borah, P.; Singh, M.K.; Mahapatra, S. Estimation of degree-days for different climatic zones of North-East India. Sustain. Cities Soc. 2015, 14, 70–81. [Google Scholar] [CrossRef]
- Wang, H.; Chen, Q. Impact of climate change heating and cooling energy use in buildings in the United States. Energy Build. 2014, 82, 428–436. [Google Scholar] [CrossRef] [Green Version]
- Radhi, H. Evaluating the potential impact of global warming on the UAE residential buildings—A contribution to reduce the CO2 emissions. Build. Environ. 2009, 44, 2451–2462. [Google Scholar] [CrossRef]
- Wan, K.K.; Li, D.H.; Pan, W.; Lam, J.C. Impact of climate change on building energy use in different climate zones and mitigation and adaptation implications. Appl. Energy 2012, 97, 274–282. [Google Scholar] [CrossRef]
- Frank, T. Climate change impacts on building heating and cooling energy demand in Switzerland. Energy Build. 2005, 37, 1175–1185. [Google Scholar] [CrossRef]
- Kwok, Y.T.; Lau, K.K.-L.; Lai, A.K.L.; Chan, P.W.; Lavafpour, Y.; Ho, J.C.K.; Ng, E.Y.Y. A comparative study on the indoor thermal comfort and energy consumption of typical public rental housing types under near-extreme summer conditions in Hong Kong. Energy Procedia 2017, 122, 973–978. [Google Scholar] [CrossRef]
- Asimakopoulos, D.; Santamouris, M.; Farrou, I.; Laskari, M.; Saliari, M.; Zanis, G.; Giannakidis, G.; Tigas, K.; Kapsomenakis, J.; Douvis, C.; et al. Modelling the energy demand projection of the building sector in Greece in the 21st century. Energy Build. 2012, 49, 488–498. [Google Scholar] [CrossRef]
- Guan, L. Energy use, indoor temperature and possible adaptation strategies for air-conditioned office buildings in face of global warming. Build. Environ. 2011, 55, 8–19. [Google Scholar] [CrossRef]
- Wang, X.; Chen, D.; Ren, Z. Assessment of climate change impact on residential building heating and cooling energy requirement in Australia. Build. Environ. 2010, 45, 1663–1682. [Google Scholar] [CrossRef]
- ANSI/ASHRAE/IESNA Standard 90.1-2019; Energy Standard for Buildings Except Low-Rise Residential Buildings. American Society of Heating Refrigerating Air-Conditioning Engineers: Atlanta, GA, USA, 2019.
- Council of Canadian Academies. Canada’s Top Climate Change Risks. The Expert Panel on Climate Change Risks and Adaptation Potential; Council of Canadian Academies: Ottawa, ON, Canada, 2019. [Google Scholar]
- Feltmate, B. Canada’s Climate Adaptation Deficit. 2018. Available online: https://policyoptions.irpp.org/magazines/october-2018/canadas-climate-adaptation-deficit/ (accessed on 1 April 2022).
- Eyring, V.; Bony, S.; Meehl, G.A.; Senior, C.A.; Stevens, B.; Stouffer, R.J.; Taylor, K.E. Overview of the Coupled Model Intercomparison Project Phase 6 (CMIP6) experimental design and organization. Geosci. Model Dev. 2016, 9, 1937–1958. [Google Scholar] [CrossRef] [Green Version]
- Gutowski, W.J., Jr.; Giorgi, F.; Timbal, B.; Frigon, A.; Jacob, D.; Kang, H.-S.; Raghavan, K.; Lee, B.; Lennard, C.; Nikulin, G.; et al. WCRP Coordinated Regional Downscaling Experiment (CORDEX): A diagnostic MIP for CMIP6. Geosci. Model Dev. 2016, 9, 4087–4095. [Google Scholar] [CrossRef] [Green Version]
- Dunlea, E.; Elfring, C. A National Strategy for Advancing Climate Modeling; The National Academies Press: Washington, DC, USA, 2012. [Google Scholar] [CrossRef] [Green Version]
- Rummukainen, M. State-of-the-art with regional climate models. Wiley Interdiscip. Rev. Clim. Chang. 2010, 1, 82–96. [Google Scholar] [CrossRef]
- Martynov, A.; Laprise, R.; Sushama, L.; Winger, K.; Šeparović, L.; Dugas, B. Reanalysis-driven climate simulation over CORDEX North America domain using the Canadian Regional Climate Model, version 5: Model performance evaluation. Clim. Dyn. 2013, 41, 2973–3005. [Google Scholar] [CrossRef] [Green Version]
- Šeparović, L.; Alexandru, A.; Laprise, R.; Martynov, A.; Sushama, L.; Winger, K.; Tete, K.; Valin, M. Present climate and climate change over North America as simulated by the fifth-generation Canadian regional climate model. Clim. Dyn. 2013, 41, 3167–3201. [Google Scholar] [CrossRef] [Green Version]
- Zadra, A.; Caya, D.; Côté, J.; Dugas, B.; Jones, C.; Laprise, R.; Winger, K.; Caron, L.-P. The next Canadian regional climate model. Phys. Can. 2008, 64, 75–83. [Google Scholar]
- Samuelsson, P.; Jones, C.G.; En, U.W.; Ullerstig, A.; Gollvik, S.; Hansson, U.; Jansson, E.; M, C.K.; Nikulin, G.; Wyser, K. The Rossby Centre Regional Climate model RCA3: Model description and performance. Tellus A Dyn. Meteorol. Oceanogr. 2011, 63, 4–23. [Google Scholar] [CrossRef] [Green Version]
- Samuelsson, P.; Gollvik, S.; Kupiainen, M.; Kourzeneva, E.; van de Berg, W.J. The Surface Processes of the Rossby Centre Regional Atmospheric Climate Model (RCA4); Swedish Meteorological and Hydrological Institute, (SMHI): Norrköping, Sweden, 2015. [Google Scholar]
- Al Samouly, A.; Luong, C.N.; Li, Z.; Smith, S.; Baetz, B.; Ghaith, M. Performance of multi-model ensembles for the simulation of temperature variability over Ontario, Canada. Environ. Earth Sci. 2018, 77, 524. [Google Scholar] [CrossRef]
- Thomson, A.M.; Calvin, K.V.; Smith, S.J.; Kyle, G.P.; Volke, A.; Patel, P.; Delgado-Arias, S.; Bond-Lamberty, B.; Wise, M.A.; Clarke, L.E.; et al. RCP4.5: A pathway for stabilization of radiative forcing by 2100. Clim. Chang. 2011, 109, 77–94. [Google Scholar] [CrossRef] [Green Version]
- American Society of Heating Refrigerating Air-Conditioning Engineers. 2009 ASHRAE Handbook: Fundamentals; ASHRAE: Peachtree Corners, GA, USA, 2009. [Google Scholar]
- American Society of Heating Refrigerating Air-Conditioning Engineers. 2013 ASHRAE Handbook: Fundamentals; ASHRAE: Peachtree Corners, GA, USA, 2013. [Google Scholar]
- Government of Canada. Historical Climate Data. 2019. Available online: https://climate.weather.gc.ca (accessed on 15 July 2021).
- Mearns, L.; McGinnis, S.; Korytina, D.; Arritt, R.; Biner, S.; Bukovsky, M.; Chang, H.-I.; Christensen, O.; Herzmann, D.; Jiao, Y. The NA-CORDEX Dataset, Version 1.0, NCAR Climate Data Gateway; The North American CORDEX Program: Boulder, CO, USA, 2017. [Google Scholar]
- Patt, A.G.; Schrag, D.P. Using Specific Language to Describe Risk and Probability. Clim. Chang. 2003, 61, 17–30. [Google Scholar] [CrossRef]


| City | Station | Latitude (N) | Longitude (E) | Climate Zone | Thermal Criteria | Cities’ Climate Design Condition [10] | |
|---|---|---|---|---|---|---|---|
| HDD18 °C | CDD18 °C | ||||||
| Windsor | Windsor International Airport | 42.28 | 277.04 | 5 | 3000 < HDD18 °C ≤ 4000 | 3421 | 438 |
| St. Catharines | Niagara Falls Airport | 43.11 | 281.05 | 3664 | 323 | ||
| Toronto | Toronto Downsview Airport | 43.68 | 280.37 | 6 | 4000 < HDD18 °C ≤ 5000 | 3837 | 304 |
| Ottawa | Ottawa International Airport | 45.32 | 284.33 | 4483 | 241 | ||
| North Bay | North Bay Airport | 46.36 | 280.58 | 7 | 5000 < HDD18 °C ≤ 7000 | 5151 | 126 |
| Sudbury | Greater Sudbury Airport | 46.62 | 279.20 | 5214 | 124 | ||
| Big Trout Lake | Big Trout Lake | 53.83 | 270.13 | 8 | 7000 < HDD18 °C | 7349 | 52 |
| Peawanuck | Peawanuck (AUT) | 54.98 | 274.57 | 8002 | 36 | ||
| No. | GCM | RCM | Simulation | Scenario | Data Resource | Data Time Period |
|---|---|---|---|---|---|---|
| 1 | CanESM2 | CRCM5 | 0.44°/50 km | RCP 4.5 | NA-CORDEX | 1 January 2020–31 December 2069 |
| 2 | CanESM2 | RCA4 | 0.44°/50 km | RCP 4.5 | ||
| 3 | EC-EARTH | HIRHAM5 | 0.44°/50 km | RCP 4.5 | ||
| 4 | EC-EARTH | RCA4 | 0.44°/50 km | RCP 4.5 | ||
| 5 | MPI-ESM-LR | CRCM5 | 0.44°/50 km | RCP 4.5 |
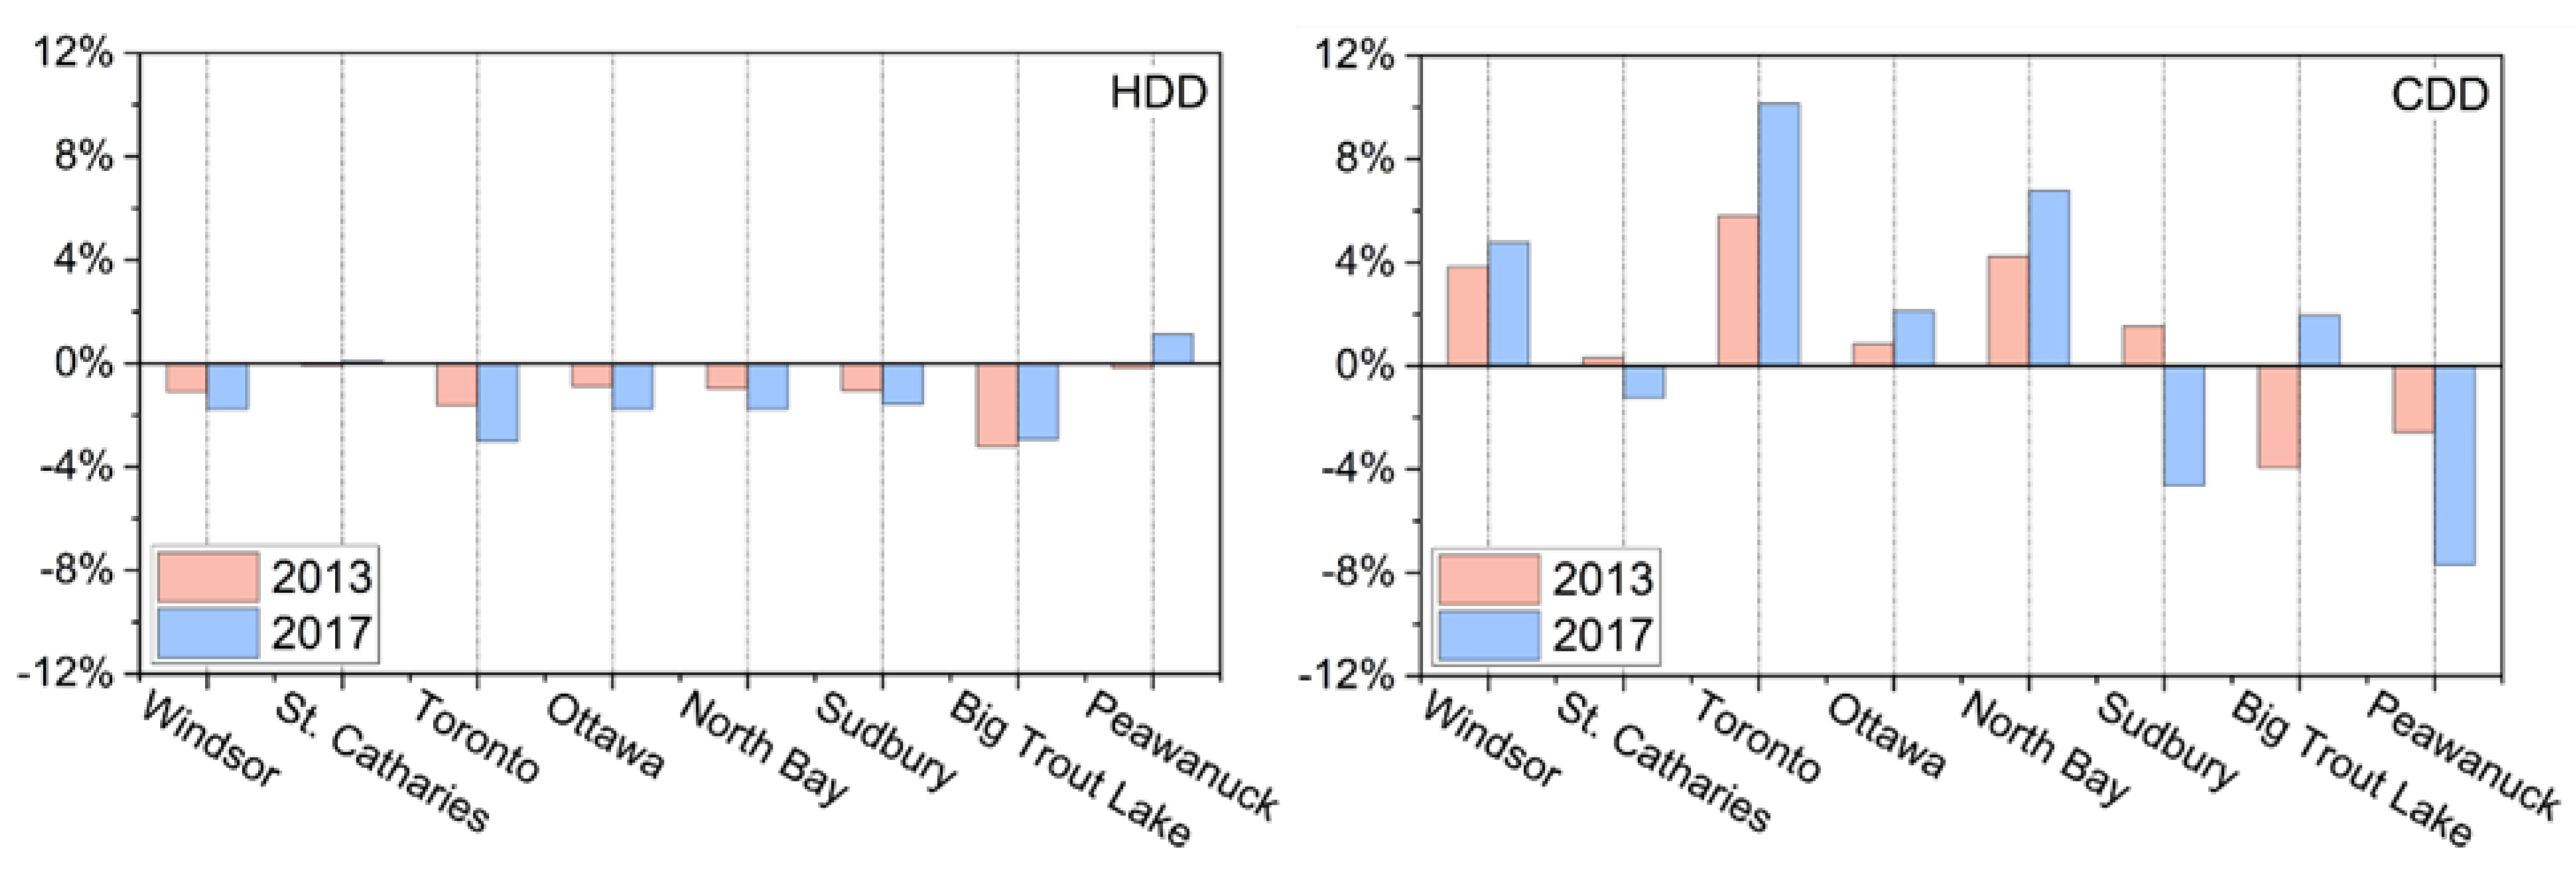
| City Name | 2009 Edition | 2013 Edition | 2017 Edition | |||
|---|---|---|---|---|---|---|
| HDD18.3 | CDD18.3 | HDD18.3 | CDD18.3 | HDD18.3 | CDD18.3 | |
| Windsor | 3482 | 418 | 3444 | 434 | 3421 | 438 |
| St. Catharines | 3661 | 327 | 3658 | 328 | 3664 | 323 |
| Toronto | 3956 | 276 | 3892 | 292 | 3837 | 304 |
| Ottawa | 4563 | 236 | 4523 | 238 | 4483 | 241 |
| North Bay | 5243 | 118 | 5192 | 123 | 5151 | 126 |
| Sudbury | 5297 | 130 | 5241 | 132 | 5214 | 124 |
| Big Trout Lake | 7572 | 51 | 7329 | 49 | 7349 | 52 |
| Peawanuck | 7912 | 39 | 7898 | 38 | 8002 | 36 |
| Climate Zone 5 | Climate Zone 6 | Climate Zone 7 | Climate Zone 8 | |||||
|---|---|---|---|---|---|---|---|---|
| Windsor (°C) | St. Catharines (°C) | Toronto (°C) | Ottawa (°C) | North Bay (°C) | Sudbury (°C) | Big Trout Lake (°C) | Peawanuck (°C) | |
| January | 1.75 | 2.65 | 5.63 | 4.42 | 4.72 | 4.50 | 4.31 | 5.02 |
| February | 2.38 | 3.03 | 5.65 | 4.46 | 4.16 | 4.10 | 3.65 | 3.72 |
| March | 2.54 | 3.41 | 4.51 | 4.17 | 3.84 | 3.90 | 3.57 | 3.74 |
| April | 2.04 | 3.14 | 2.56 | 2.34 | 2.71 | 2.99 | 3.08 | 2.98 |
| May | 1.63 | 2.67 | 1.02 | 0.80 | 1.17 | 1.24 | 3.12 | 2.46 |
| June | 0.92 | 2.06 | −0.33 | 0.23 | 0.81 | 0.64 | 1.69 | 1.57 |
| July | 0.52 | 1.16 | −0.64 | −0.53 | 0.30 | 0.12 | 1.29 | 0.99 |
| August | 0.21 | 0.72 | −0.35 | −1.01 | −0.30 | −0.42 | 0.20 | −0.34 |
| September | −1.63 | −0.64 | −0.50 | −1.83 | −1.25 | −1.43 | −0.73 | −0.40 |
| October | −1.57 | −0.10 | 1.29 | −0.50 | −0.06 | −0.06 | 0.21 | 0.23 |
| November | −1.21 | 0.22 | 2.35 | 0.72 | 1.42 | 1.34 | 2.59 | 2.24 |
| December | −0.07 | 1.07 | 3.77 | 2.61 | 3.09 | 2.83 | 4.54 | 5.08 |
| Climate Zone 5 | Climate Zone 6 | Climate Zone 7 | Climate Zone 8 | |||||
|---|---|---|---|---|---|---|---|---|
| Windsor (°C) | St. Catharines (°C) | Toronto (°C) | Ottawa (°C) | North Bay (°C) | Sudbury (°C) | Big Trout Lake (°C) | Peawanuck (°C) | |
| January | 0.56 | 0.53 | 0.54 | 1.27 | 1.38 | 1.41 | 2.59 | 3.48 |
| February | 1.18 | 1.19 | 1.16 | 1.73 | 1.89 | 1.99 | 1.95 | 2.45 |
| March | 1.09 | 1.19 | 1.14 | 1.27 | 1.29 | 1.33 | 1.12 | 1.55 |
| April | 0.96 | 1.08 | 1.06 | 1.09 | 1.20 | 1.11 | 1.30 | 1.76 |
| May | 0.83 | 0.93 | 0.89 | 0.85 | 0.99 | 1.02 | 1.64 | 2.00 |
| June | 1.04 | 1.15 | 1.24 | 1.05 | 1.05 | 1.08 | 1.35 | 1.62 |
| July | 1.25 | 1.13 | 1.06 | 0.94 | 0.89 | 0.89 | 0.42 | 0.63 |
| August | 0.09 | 0.18 | 0.19 | 0.10 | 0.07 | 0.06 | −0.05 | 0.24 |
| September | 0.08 | 0.15 | 0.17 | 0.24 | 0.18 | 0.16 | 0.35 | 0.44 |
| October | 0.01 | −0.06 | −0.01 | 0.13 | 0.15 | 0.16 | 0.27 | 0.36 |
| November | 0.46 | 0.43 | 0.36 | 0.63 | 0.62 | 0.59 | 0.83 | 1.21 |
| December | 0.49 | 0.47 | 0.51 | 0.99 | 1.23 | 1.28 | 2.46 | 2.50 |
| Climate Zone 5 | Climate Zone 6 | Climate Zone 7 | Climate Zone 8 | |||||
|---|---|---|---|---|---|---|---|---|
| Windsor (°C) | St. Catharines (°C) | Toronto (°C) | Ottawa (°C) | North Bay (°C) | Sudbury (°C) | Big Trout Lake (°C) | Peawanuck (°C) | |
| 2020–2044 | 1.14 | 1.10 | 1.05 | 1.19 | 1.25 | 1.31 | 1.04 | 1.23 |
| 2045–2069 | 0.42 | 0.48 | 0.39 | 0.70 | 0.84 | 0.86 | 1.32 | 1.71 |
| Climate Zone 5 | |||||
|---|---|---|---|---|---|
| Windsor | |||||
| Prob. of Occurrence (%) | 2020–2044 Avg CDD | Difference (%) | Prob. of Occurrence (%) | 2045–2069 Avg CDD | Difference (%) |
| 94 | 438 (ASHRAE) | 0 | 100 | 438 (ASHARE) | 0 |
| 50 | 543 | 24 | 50 | 628 | 43 |
| 25 | 589 | 34 | 25 | 661 | 51 |
| 10 | 631 | 44 | 10 | 690 | 58 |
| St. Catharines | |||||
| Prob. of Occurrence (%) | 2020–2044 Avg CDD | Difference (%) | Prob. of Occurrence (%) | 2045–2069 Avg CDD | Difference (%) |
| 100 | 323 (ASHRAE) | 0 | 100 | 323 (ASHRAE) | 0 |
| 50 | 488 | 51 | 50 | 576 | 79 |
| 25 | 525 | 63 | 25 | 607 | 88 |
| 10 | 559 | 73 | 10 | 635 | 97 |
| Climate Zone 6 | |||||
| Toronto | |||||
| Prob. of Occurrence (%) | 2020–2044 Avg CDD | Difference (%) | Prob. of Occurrence (%) | 2045–2069 Avg CDD | Difference (%) |
| 95 | 304 (ASHARE) | 0 | 100 | 304 (ASHARE) | 0 |
| 50 | 393 | 29 | 50 | 477 | 57 |
| 25 | 430 | 41 | 25 | 510 | 68 |
| 10 | 462 | 52 | 10 | 539 | 77 |
| Ottawa | |||||
| Prob. of Occurrence (%) | 2020–2044 Avg CDD | Difference (%) | Prob. of Occurrence (%) | 2045–2069 Avg CDD | Difference (%) |
| 60 | 241 (ASHRAE) | 0 | 100 | 241 (ASHRAE) | 0 |
| 50 | 252 | 5 | 50 | 312 | 30 |
| 25 | 280 | 16 | 25 | 335 | 39 |
| 10 | 305 | 27 | 10 | 354 | 47 |
| Climate Zone 7 | |||||
| North Bay | |||||
| Prob. of Occurrence (%) | 2020–2044 Avg CDD | Difference (%) | Prob. of Occurrence (%) | 2045–2069 Avg CDD | Difference (%) |
| 86 | 126 (ASHARE) | 0 | 100 | 126 (ASHARE) | 0 |
| 50 | 166 | 32 | 50 | 215 | 71 |
| 25 | 191 | 52 | 25 | 235 | 86 |
| 10 | 214 | 70 | 10 | 252 | 100 |
| Sudbury | |||||
| Prob. of Occurrence (%) | 2020–2044 Avg CDD | Difference (%) | Prob. of Occurrence (%) | 2045–2069 Avg CDD | Difference (%) |
| 90 | 124 (ASHRAE) | 0 | 100 | 124 (ASHRAE) | 0 |
| 50 | 174 | 40 | 50 | 223 | 80 |
| 25 | 201 | 62 | 25 | 244 | 96 |
| 10 | 226 | 82 | 10 | 263 | 112 |
| Climate Zone 8 | |||||
| Big Trout Lake | |||||
| Prob. of Occurrence (%) | 2020–2044 Avg CDD | Difference (%) | Prob. of Occurrence (%) | 2045–2069 Avg CDD | Difference (%) |
| 97 | 52 (ASHARE) | 0 | 100 | 52 (ASHARE) | 0 |
| 50 | 94 | 80 | 50 | 119 | 129 |
| 25 | 108 | 108 | 25 | 137 | 163 |
| 10 | 121 | 133 | 10 | 153 | 193 |
| Peawanuck | |||||
| Prob. of Occurrence (%) | 2020–2044 Avg CDD | Difference (%) | Prob. of Occurrence (%) | 2045–2069 Avg CDD | Difference (%) |
| 75 | 36 (ASHRAE) | 0 | 100 | 36 (ASHRAE) | 0 |
| 50 | 44 | 21 | 50 | 56 | 57 |
| 25 | 51 | 43 | 25 | 65 | 80 |
| 10 | 58 | 62 | 10 | 72 | 101 |
| Probability Range | Descriptive Term |
|---|---|
| <1% | Extremely unlikely |
| 1–10% | Very unlikely |
| 10–33% | Unlikely |
| 33–66% | Medium likelihood |
| 66–90% | Likely |
| 90–99% | Very likely |
| >99% | Virtually certain |
Publisher’s Note: MDPI stays neutral with regard to jurisdictional claims in published maps and institutional affiliations. |
© 2022 by the authors. Licensee MDPI, Basel, Switzerland. This article is an open access article distributed under the terms and conditions of the Creative Commons Attribution (CC BY) license (https://creativecommons.org/licenses/by/4.0/).
Share and Cite
Chidiac, S.E.; Yao, L.; Liu, P. Climate Change Effects on Heating and Cooling Demands of Buildings in Canada. CivilEng 2022, 3, 277-295. https://doi.org/10.3390/civileng3020017
Chidiac SE, Yao L, Liu P. Climate Change Effects on Heating and Cooling Demands of Buildings in Canada. CivilEng. 2022; 3(2):277-295. https://doi.org/10.3390/civileng3020017
Chicago/Turabian StyleChidiac, Samir E., Lan Yao, and Paris Liu. 2022. "Climate Change Effects on Heating and Cooling Demands of Buildings in Canada" CivilEng 3, no. 2: 277-295. https://doi.org/10.3390/civileng3020017
APA StyleChidiac, S. E., Yao, L., & Liu, P. (2022). Climate Change Effects on Heating and Cooling Demands of Buildings in Canada. CivilEng, 3(2), 277-295. https://doi.org/10.3390/civileng3020017