Article

Size Effect in FRP Shear-Strengthened RC Beams: Design Models versus Experimental Data

Department of Construction Engineering, École de Technologie Supérieure, University of Quebec, Montreal, QC H3C 1K3, Canada
*
Author to whom correspondence should be addressed.
CivilEng 2021, 2(4), 874-894; https://doi.org/10.3390/civileng2040047
Submission received: 26 August 2021 / Revised: 30 September 2021 / Accepted: 2 October 2021 / Published: 6 October 2021
(This article belongs to the Special Issue Advances in Civil Engineering)

Abstract

:
Numerous studies on the size effect have been devoted to reinforced concrete (RC) beams. They have shown that increasing the beam size leads to a decrease in ultimate shear strength (stress) at failure. This is reflected in the design model of most current international codes and guidelines, where the size effect is taken into consideration by reducing concrete contribution to the shear resistance (force). In contrast, the size effect of RC beams strengthened with externally bonded (EB) fibre-reinforced polymer (FRP) is not fully documented, and very few experimental studies have been devoted to the phenomenon. The objective of this study was to evaluate the accuracy of the current code and guideline models in terms of the size effect on the EB-FRP contribution to shear resistance. To this end, a database of experimental findings on the size effect in EB-FRP-strengthened beams was built based on the reported literature, as well as our own experimental tests. The data were analysed and compared with the predictions of six current codes and design guidelines to assess their accuracy. Experimental results clearly revealed the presence of a size effect related to EB-FRP as well as the existence of interaction between internal stirrups and EB-CFRP. Based on analysis of the collected experimental test results, the study clearly revealed that the predictions of current codes and guidelines overestimate the contribution of EB-FRP systems to shear resistance. The size effect tends to exacerbate this overestimation as the effective depth (d) of the beams increases. Therefore, until the size effect for RC beams strengthened in shear with EB-FRP is captured by the prediction models, current codes and design guidelines are to be used with caution.

1. Introduction

The size effect on the shear behaviour of conventional RC beams is well established. There is a size effect when there is a difference in shear strength at failure between beams of different sizes, but with similar geometry. The size effect tends to reduce the shear strength at failure as the size of the beam increases, thus linking the geometric properties of the concrete to its mechanical properties. This is important because it can change the ductile behaviour of small RC beams to brittle behaviour for larger ones [1]. In contrast, there is no size effect in the case of geometrically similar beams (same ratio of different material) of different sizes experiencing the same shear strength at failure [2]. Therefore, the use of small-specimen test data to develop empirical or semi-empirical prediction models for designing the shear resistance of large-scale beams without assessing the impact of the size effect mechanism can lead to non-conservative design.
Shear-strengthening of RC beams with EB-FRP composites is an increasingly used technique, particularly in bridge structures. The flexibility of FRP and its ease of installation are advantages that meet the needs of special projects, particularly those requiring short or urgent interventions. Several reliable research studies conducted on the behaviour of RC beams strengthened with EB-FRP over the last two decades have demonstrated the effectiveness of FRP composite materials [3,4,5,6,7,8,9]. However, compared with conventional (unstrengthened) RC beams, studies on the size effect of RC beams strengthened in shear with EB-FRP are very few [3,10,11,12,13,14,15,16,17]. Because of this gap, the influence of the size effect may not be captured by codes and design guidelines. This could mean that the design models for shear-strengthened RC beams may fail to capture the shear strength loss when the beam size is increased. Therefore, shear-strengthening prediction according to current models may result in an overestimation of the shear resistance and thus a non-conservative design.
In addition, the code and design guidelines for strengthened RC beams with EB-FRP have been in existence for about two decades, and their updates have failed to capture the size effect phenomenon in their latest versions. The gap revealed by several experimental investigations is still not accounted for in the prediction models. In fact, this is the case for many major parameters, such as: (1) the interaction between internal transverse steel and external FRP, which reduces the performance of EB-FRP as reported by [18]; (2) shear strength decrease with increasing beam height, as reported by [11]; and (3) modification of the web cracking pattern by a shear-strengthening system that modifies the anchorage conditions of EB-FRP, as reported by [19]. These gaps are still a topic of discussion and recommendations in the literature. Therefore, consideration of the influence of these phenomena in the prediction models used by codes and design guidelines is essential.
The present study aims to examine the size effect in RC beams strengthened in shear with EB-FRP and to assess the accuracy of the design models of some leading codes and design guidelines as well as the influence of size effect to the contribution to shear resistance attributed to EB-FRP of these models. To this end, a database of experimental findings on the size effect in EB-FRP-strengthened beams was built based on the reported literature as well as selected partial results from the two original studies already published by the authors [3,11]. The data were analysed and compared with the models of six current codes and design guidelines to assess their accuracy in predicting the FRP contribution to shear resistance. The database encompassed a total of 50 specimens, shear-strengthened with EB-FRP, with a beam height ranging from 180 to 750 mm, among which 16 T-beam specimens strengthened with EB-FRP fabric sheets and an L-shaped laminate were tested by the authors. The six codes and design guidelines used in this study for the design of shear-strengthened RC beams with EB-FRP were: ACI-440.2R-17 2017 [20]; CSA-S6-19 2019 [21]; CSA-S806-12 2012 [22]; fib-TG5.1-19 2019 [23]; fib-TG9.3-01 2001 [24]; JSCE 2001 [25].

2. Research Significance
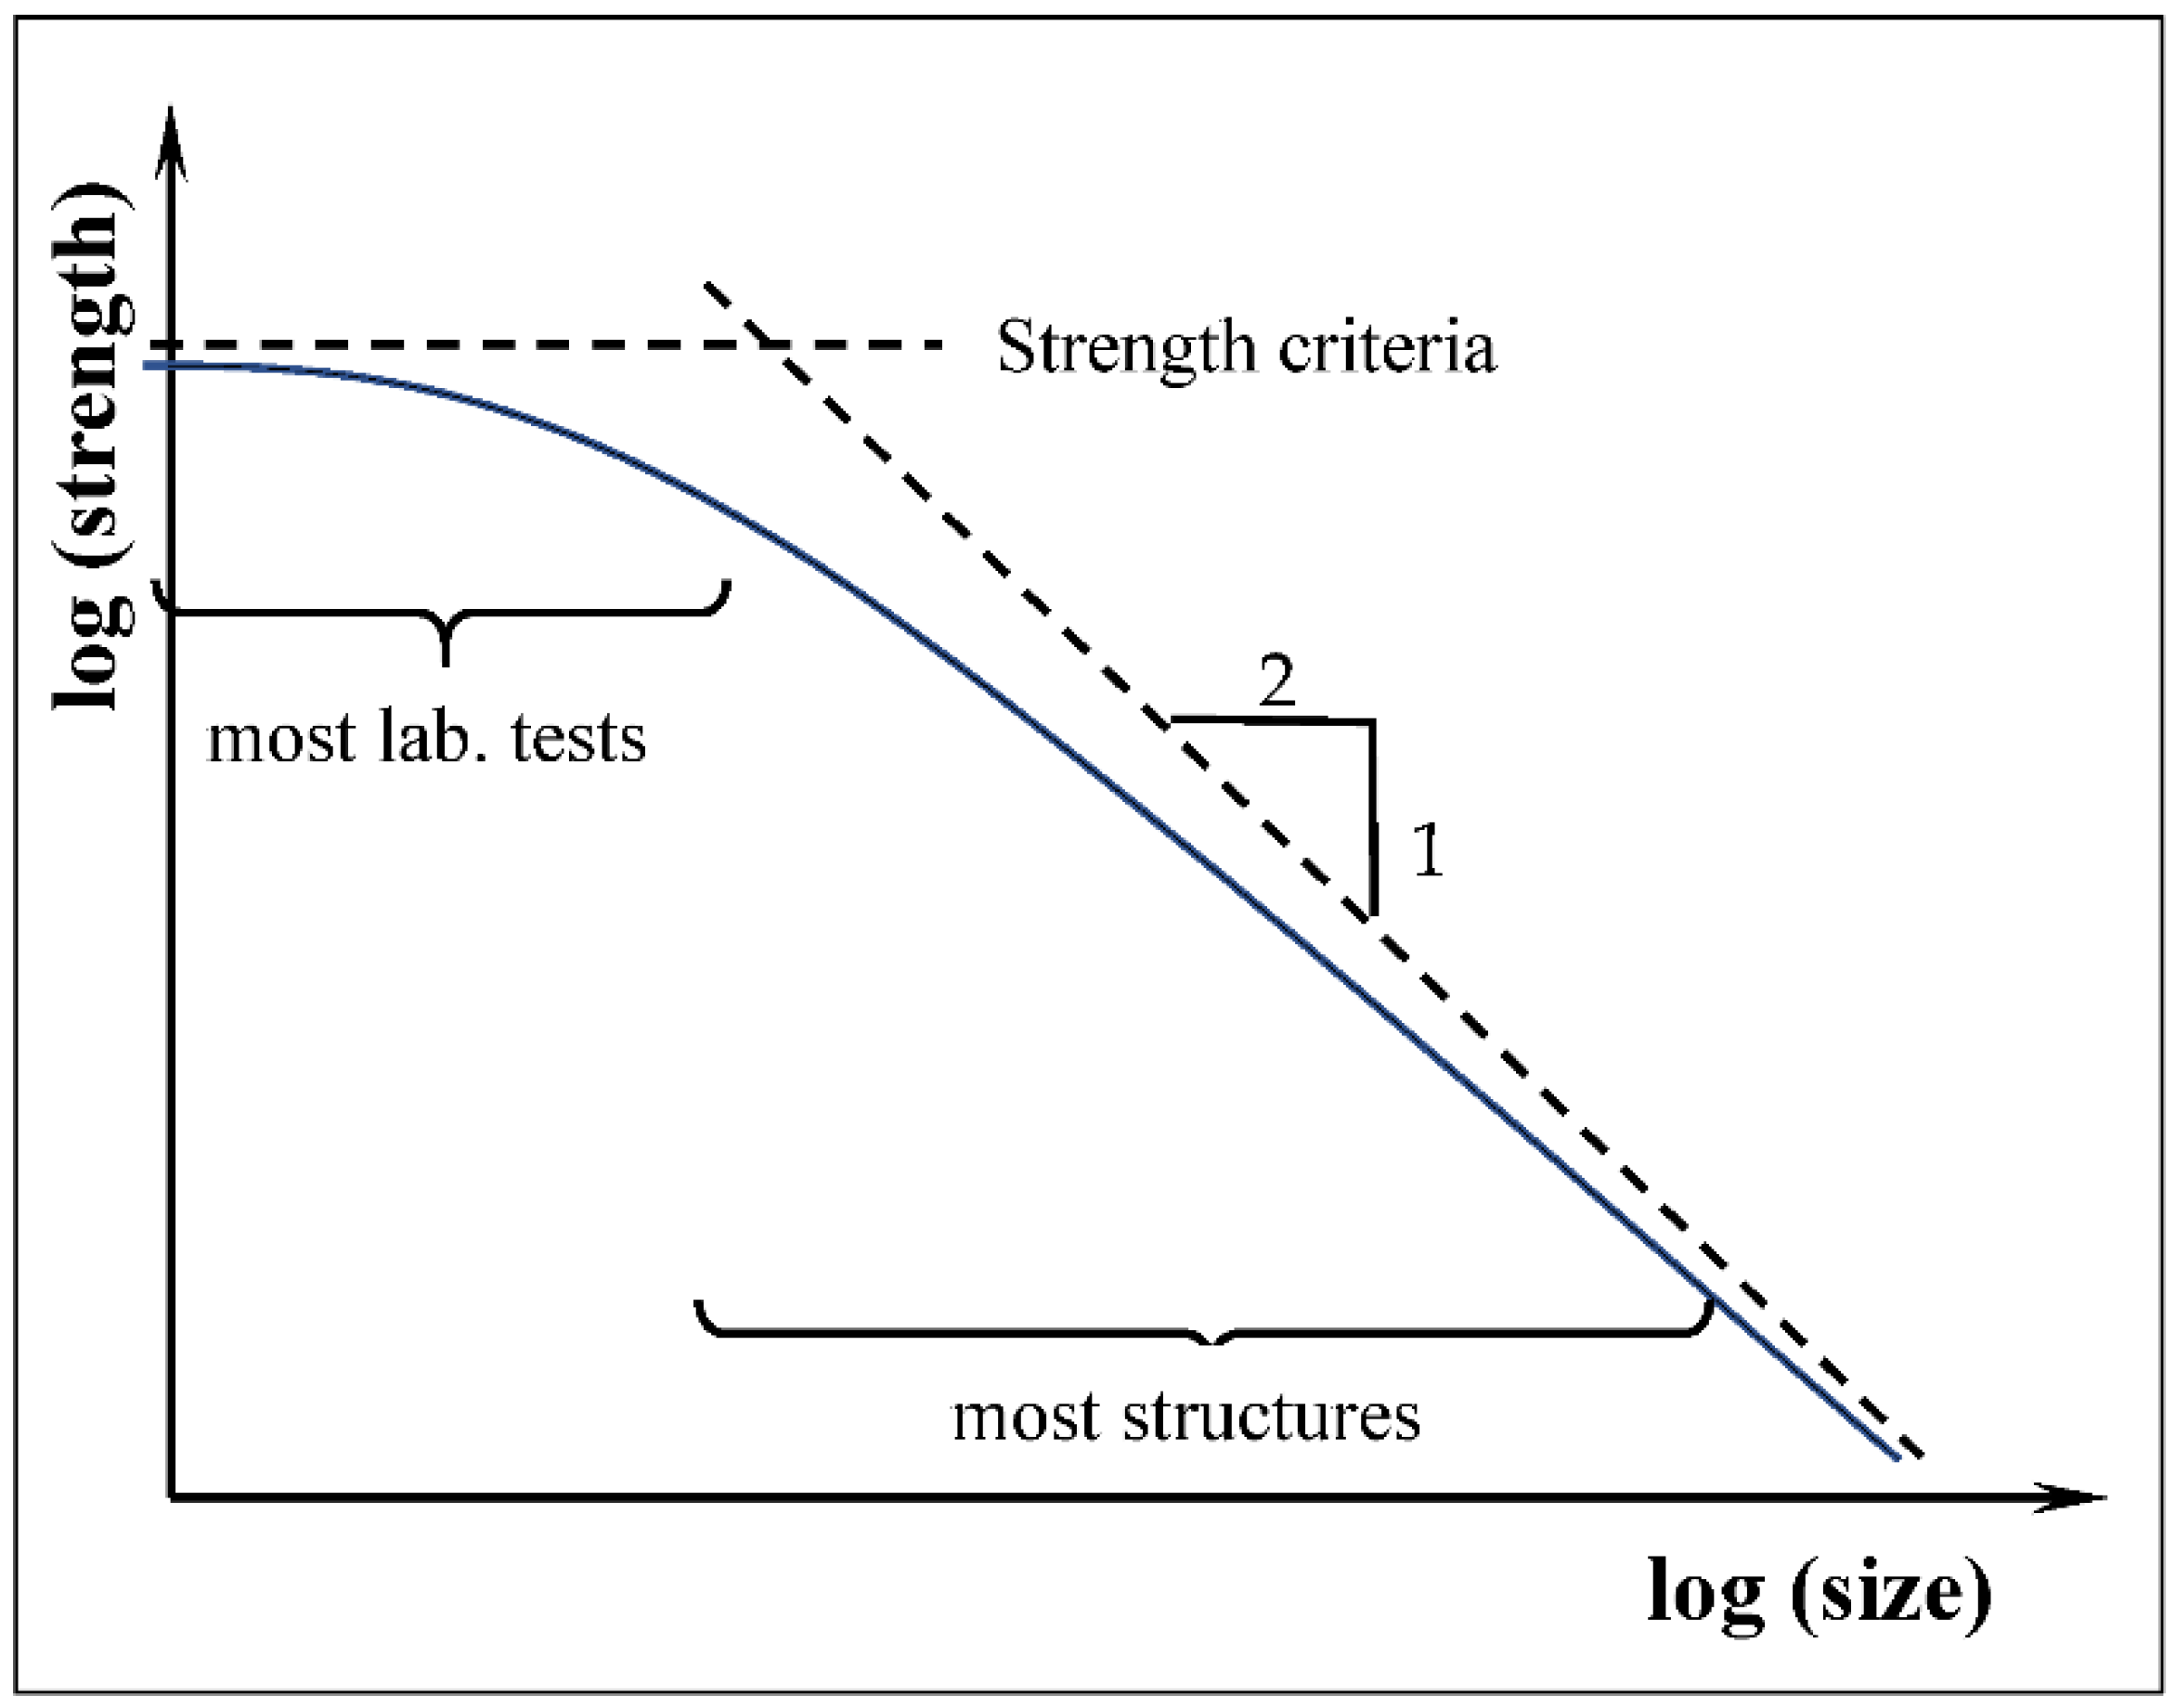
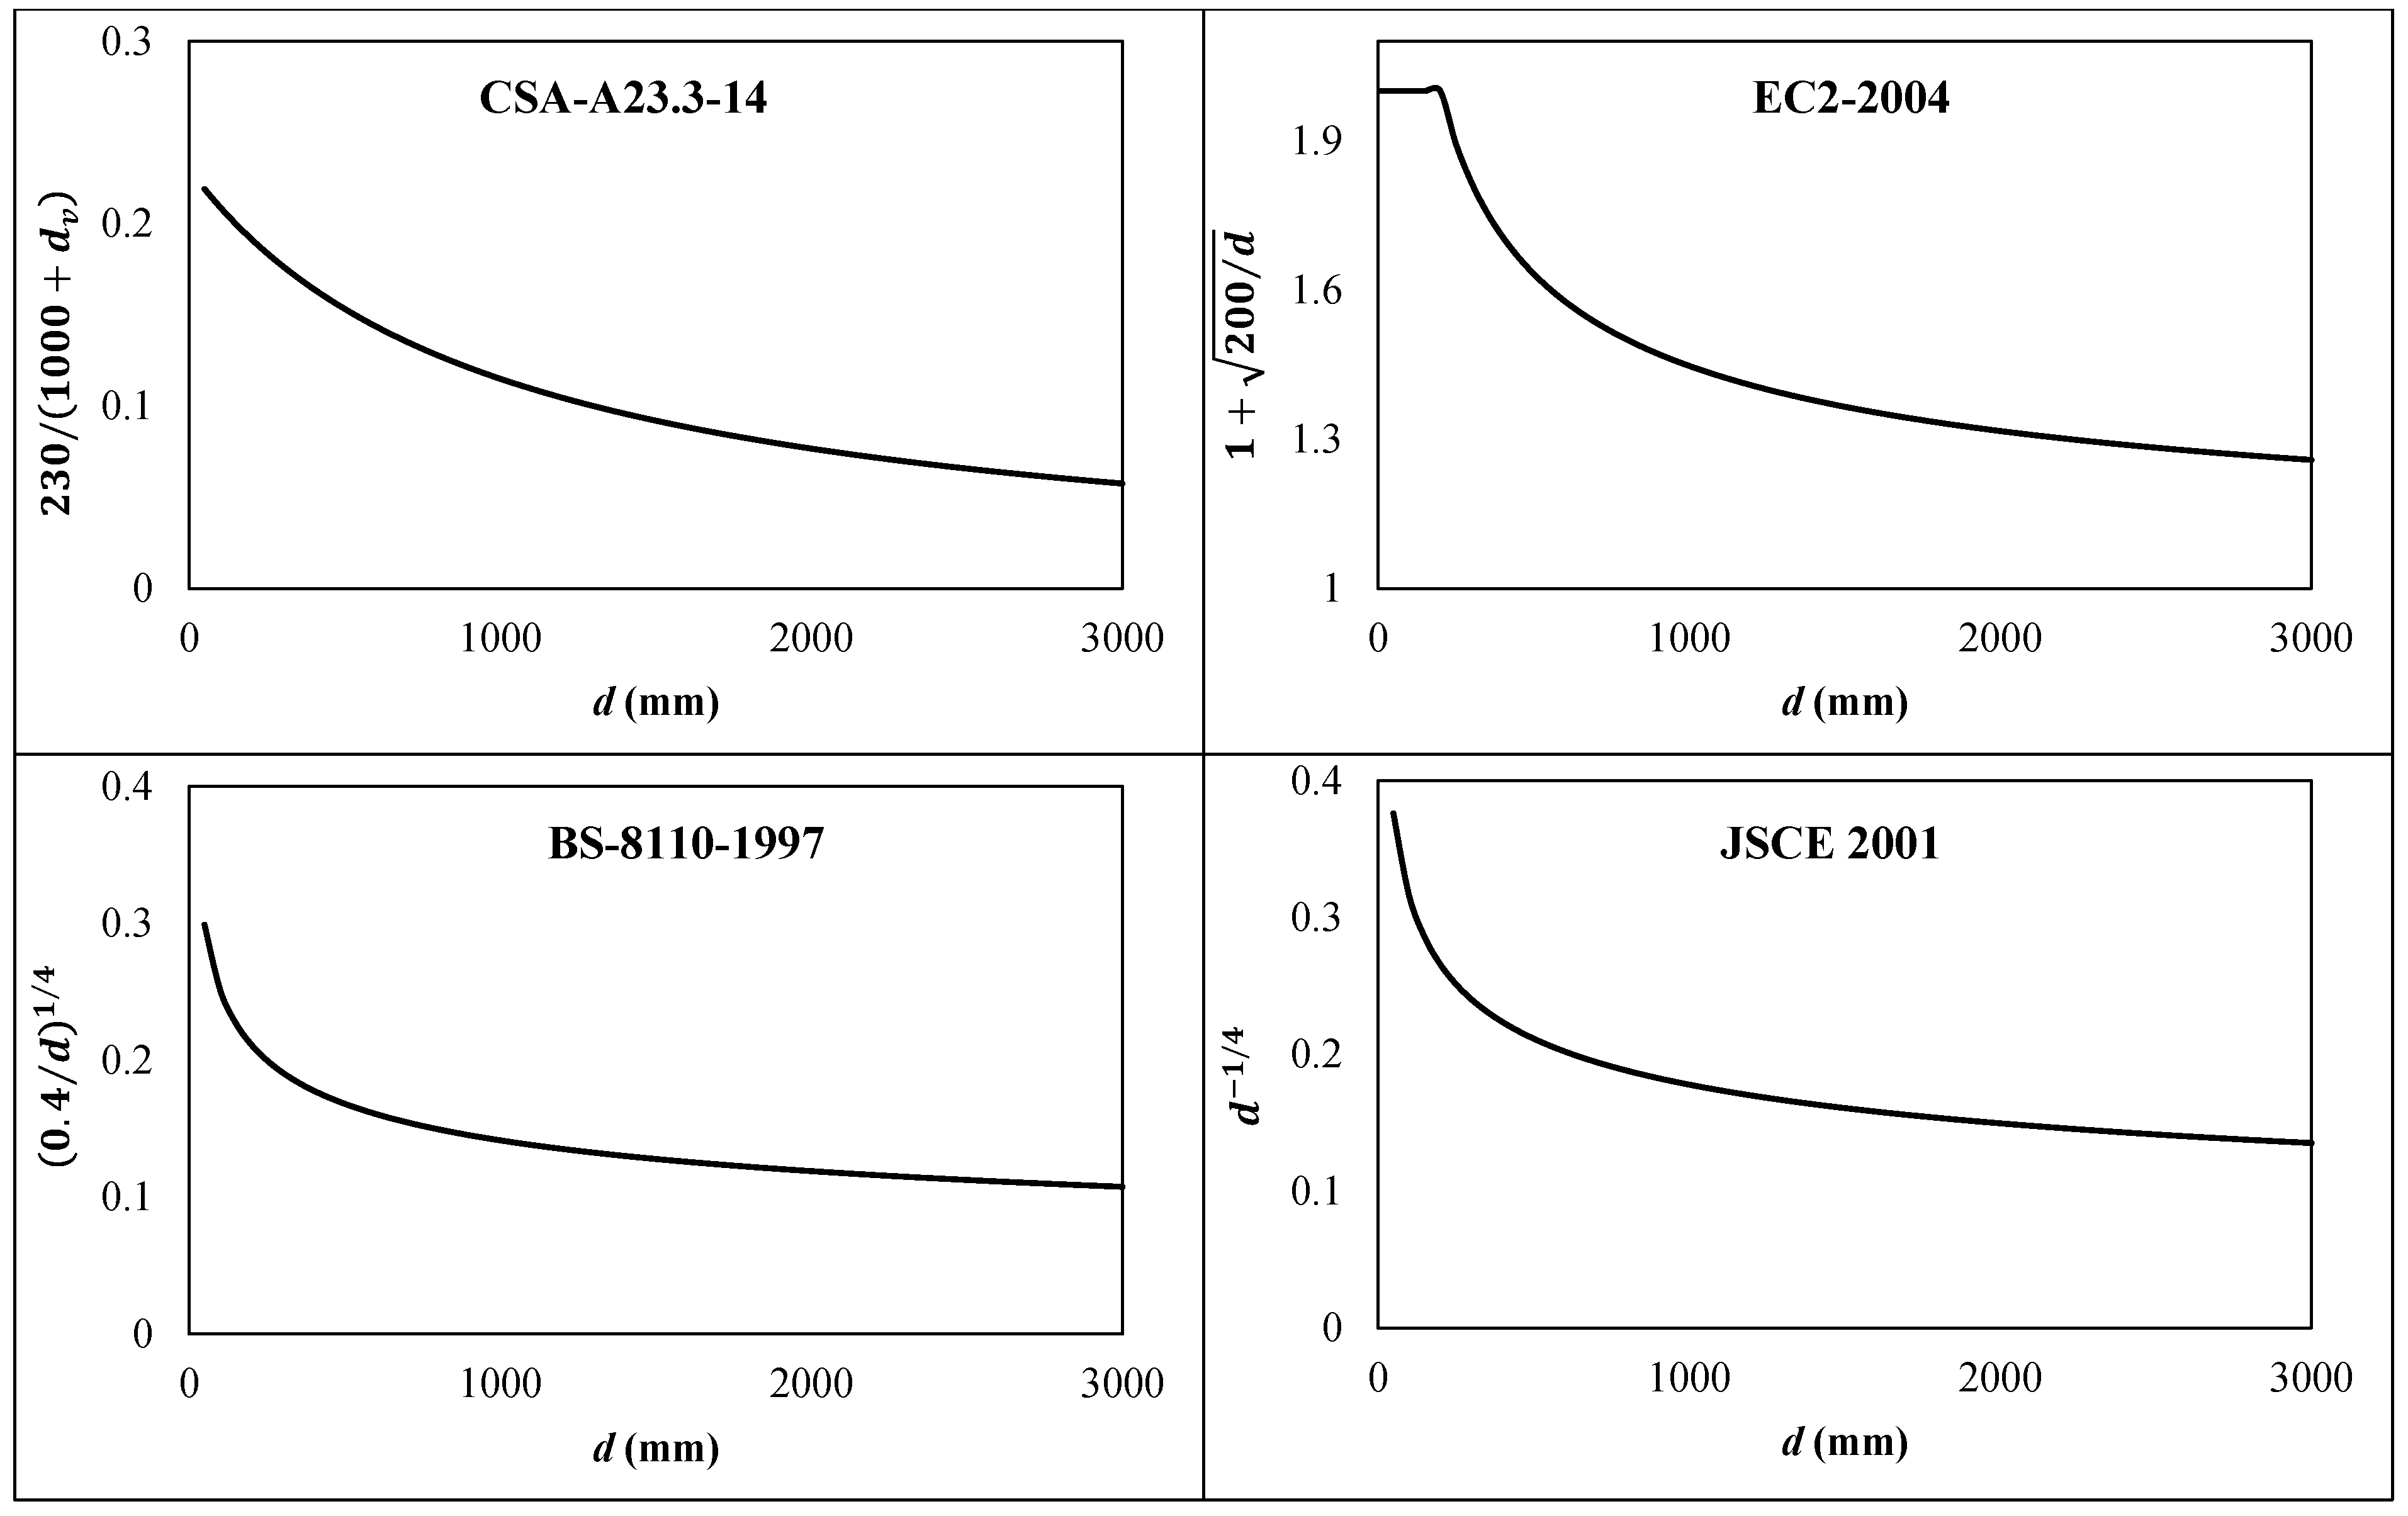
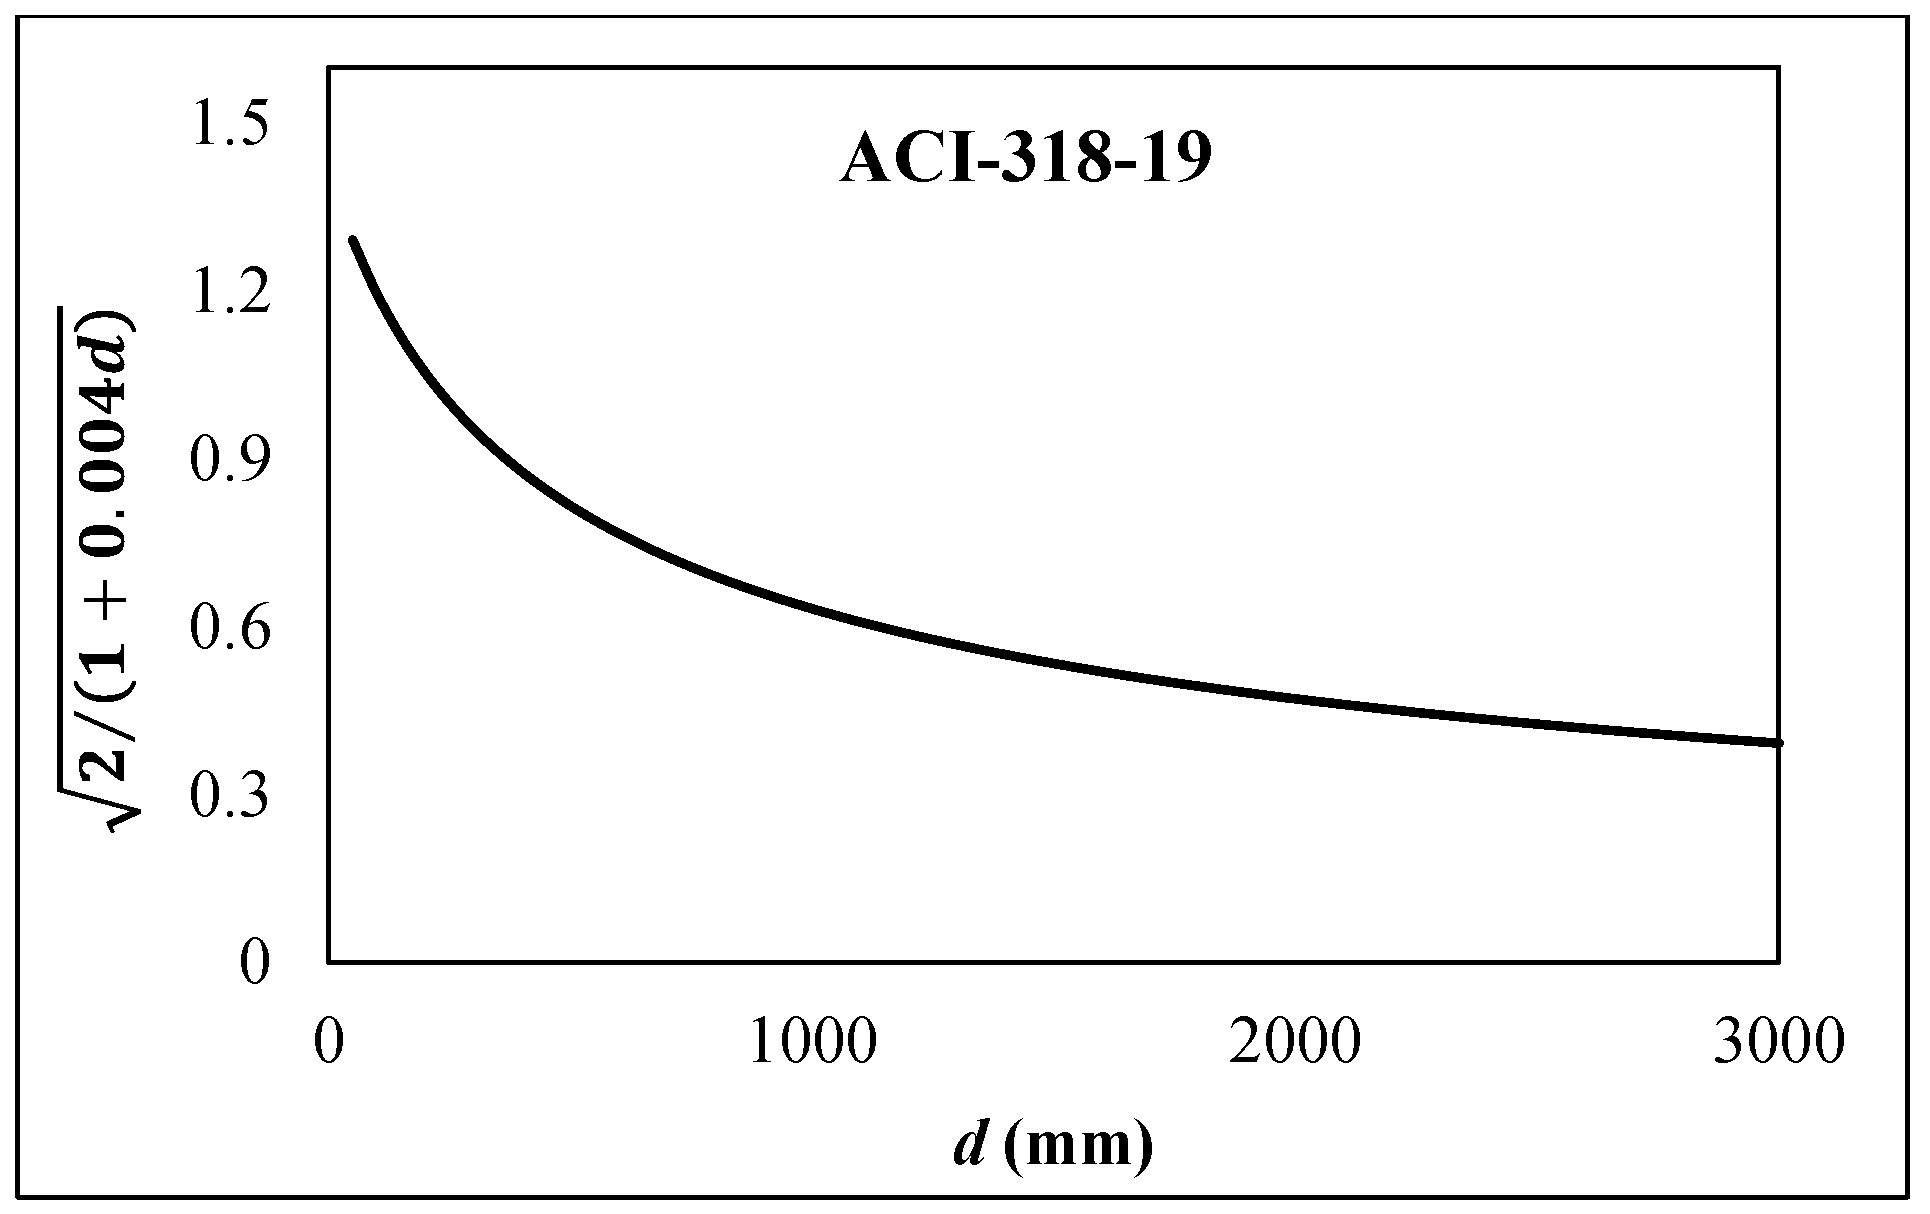
Most studies carried out on the size effect of RC beams shear-strengthened with EB-FRP have been focussed on the addition of FRP as the main study parameter. Prediction models of the contribution of FRP to shear resistance in EB-FRP-strengthened beams have not been updated to capture the major parameters that have been established and well documented in the literature. The main impetus to carry out the present study was to evaluate the prediction models used by the codes and design guidelines that are related to the size effect on the contribution of FRP in EB-FRP shear-strengthened RC beams.

3. Size Effect

The size effect tends to reduce the shear strength at failure as beam size increases. Leonardo da Vinci was the first to mention the size effect in the 1500s when he proposed a first law on this phenomenon, which conveyed an inversely proportional relationship between the strength of a rope and its length [26]. In fact, a long rope carries the same weight as a short rope. However, compared with a short rope, a long rope is more likely to feature defective areas that can lead to premature failure. This is the principle of inequality in a material, where the resistance can differ from one part to another [26].
The size effect is a complex phenomenon that was ignored before the 1960s. It has been recognized as a causal factor of many structural engineering disasters leading to collapses, among them the St. Francis Dam (Los Angeles, CA, USA) in 1928; the Malpasset Dam (the Alps, France) in 1954; the Wilkins aeronautical warehouse (Shelby, USA) in 1955; the Cypress viaduct (Oakland, CA, USA) in 1989; the Sleipner oil platform (Norway) in 1991; and the Han-Shin Viaduct (Kobe, Japan) in 1995 [27]. The size effect was not associated with the size (height) of beams until the tragic event at the Wilkins aeronautical warehouse (Shelby, USA) in 1955, where the shear failure of an RC beam (d = 1000 mm) without internal steel stirrups occurred. It is interesting to observe that until 1966, most specimens tested in laboratories and on which shear resistance prediction models have been based had a maximum effective depth d = 380 mm [28].
The size effect is not of a statistical nature but is rather associated with fracture mechanics processes [27]. This theory states that shear failure of quasi-brittle structures, such as concrete, occurs after stable evolution of cracks. Therefore, the size effect appears through a failure process phase [29]. This process results in progressive damage, stress redistribution, and energy release. This mechanism is also known as fracture energy release theory.
Figure 1 shows various theories of the evolution of shear strength with increasing structure size [30]. In the figure, elastic analysis, which is a classical failure theory independent of structure size (no size effect), is represented by the straight discontinuous asymptote (strength criteria). The theory of linear fracture mechanics, which depends on the size of a structure, is represented by the inclined discontinuous asymptote with a slope of −1/2. Nonlinear fracture mechanics theory, which is intermediate between the two previous theories, is illustrated by the continuous curve in the figure [2]. This curve is close to the horizontal line, where the structure size is small and approaches the −1/2 slope as the size increases.
Shear resistance prediction models in codes and design guidelines are based on the truss analogy theory of Morsh and Ritter, that is, on the force balance of the various truss elements involved in resistance in RC elements (also called the resistance mechanism) [31]. However, shear failure of RC elements is governed by the process of crack development (failure mechanism), confirming thereby that the truss analogy cannot capture the size effect on shear strength. Therefore, prediction models must account for the size effect by empirical provisions or using a specific law.
In the following, examples of size effect consideration by some codes for the design of conventional RC structures are presented. Note that the size effect influences only the concrete contribution to shear resistance. Therefore, the size effect correction (reduction) factor is applied directly to the concrete contribution. Table 1 shows reducing terms from some shear resistance prediction models for conventional RC beams ([25,32,33,34,35]). All these terms are inversely proportional to effective beam depth with the aim of correcting the shear resistance to account for the size effect.
Figure 2 illustrates the behaviour of the reducing terms from Table 1 as a function of beam size. It shows that the curves decrease as the beam size increases. This is important because it clearly indicates that the size effect is accounted for in these models. The curves start with a very sharp decrease up to a beam height of about 1000 mm. For effective depths greater than 1000 mm, the curves flatten out, and their slopes gradually decrease. Based on these curves, it can also be concluded that RC beams exhibit a significant size effect when d < 1000 mm. In contrast, the size effect loses much of its impact when d > 1000 mm.

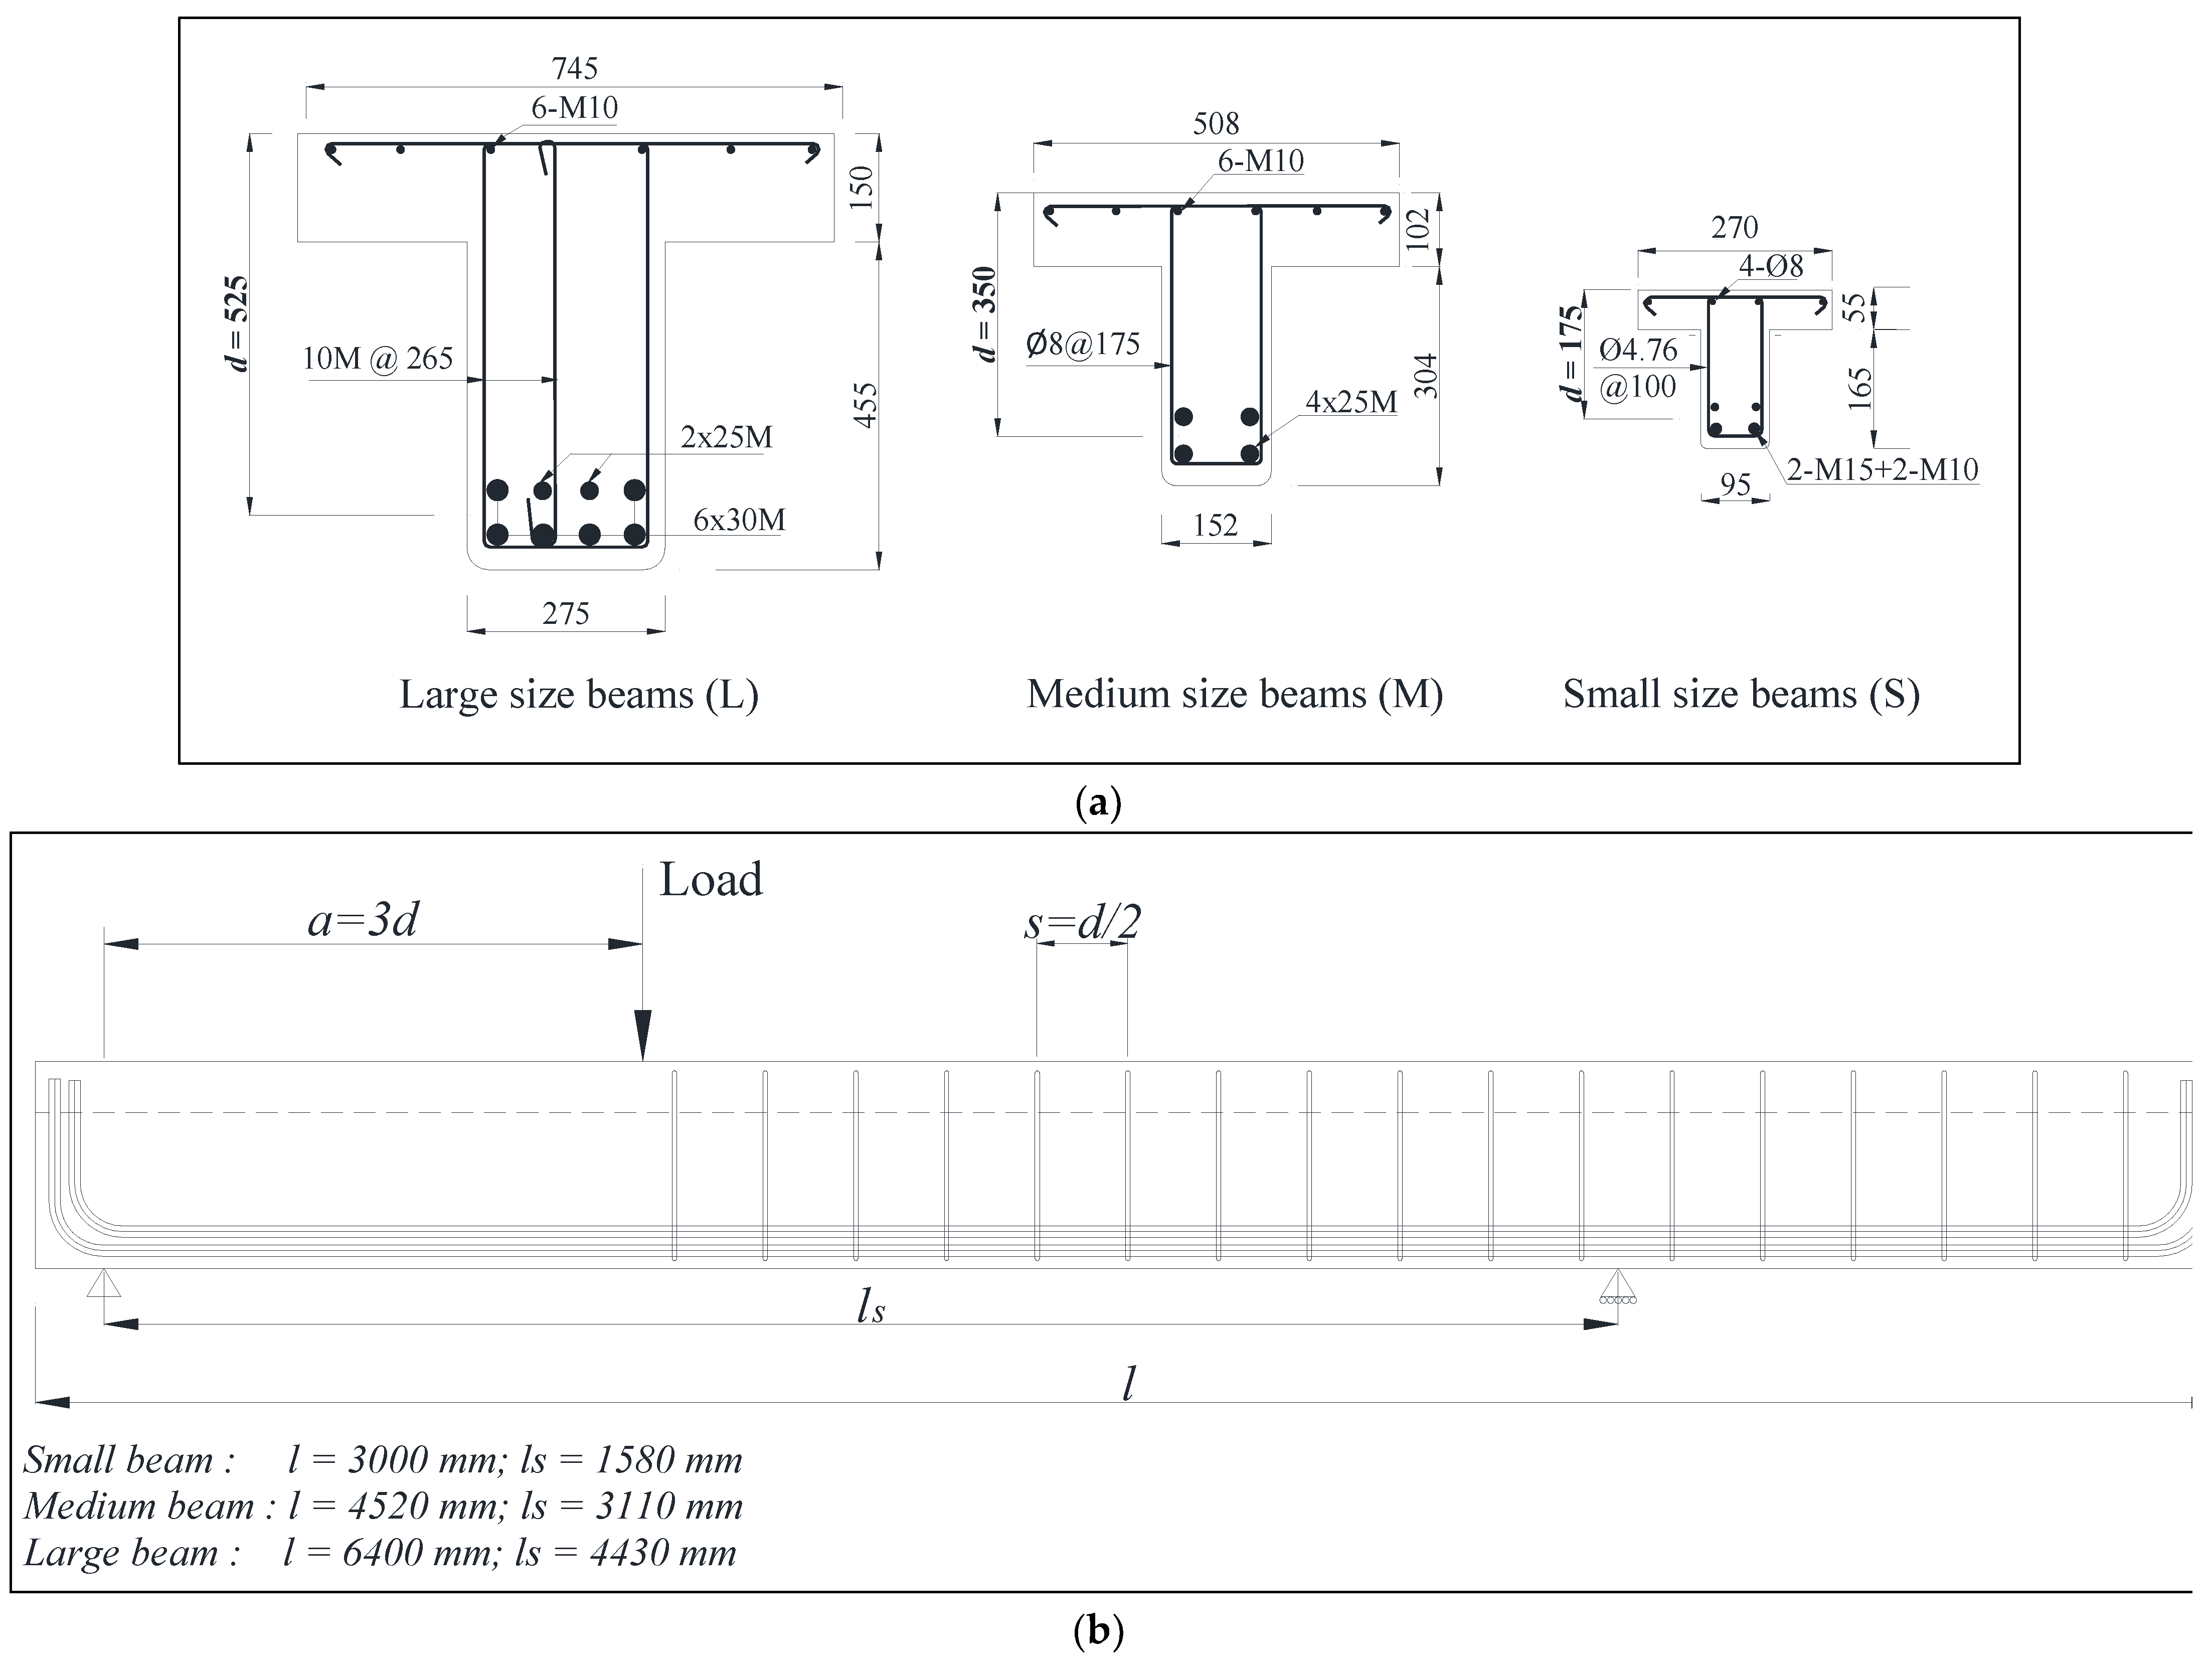
4. Experimental Tests

The experimental program involved six series of geometrically similar RC T-beams shear-strengthened with EB carbon FRP (EB-CFRP) divided into two groups to assess the size effect (Table 2). Study parameters in the first group (strengthened with continuous CFRP sheet) were the influence of the steel stirrups and the increase in the CFRP rigidity, whereas in the second group (strengthened with CFRP laminates strips), the study parameters were the influence of the use of the CFRP L-shaped laminate and the use of a proven anchorage system. Note that the experimental specimens described in this section were selected partial results from the two original studies by the authors [3,11]. The first group contained four series of specimens that were shear-strengthened with CFRP fabric sheets, and the second group included two series of specimens that were shear-strengthened with CFRP L-shaped laminate, for a total of 16 specimens (Table 2). Three sizes of specimens were considered: (1) small, labelled S, 220 mm in height and with 3000 mm total length; (2) medium, labelled M, 406 mm in height and with 4520 mm total length; and (3) large, labelled L, 605 mm in height and with 6400 mm total length (Figure 3). All beams were tested in three-point bending. The load was applied at a shear span distance of a/d = 3 from the nearest support to ensure a slender beam type of behaviour, as shown in Figure 3b. Specimens without transverse steel were labelled S0 and those with steel stirrups S1, corresponding to a spacing of s = d/2, where d is the effective depth. Specimens of the first group were strengthened with CFRP fabric; two series with a single layer, labelled 1L, and the other two series with two layers of CFRP, labelled 2L. In the second group, the specimens were shear-strengthened with a CFRP L-shaped laminate. The laminate was not anchored in the first series, labelled Str, whereas in the second series, labelled Str-Anc, the long legs of the laminate were anchored into the compression zone of the specimen (the flange). For instance, specimen M.S0.2L designates a medium-sized beam without steel stirrups, shear-strengthened with two plies of CFRP sheet, whereas specimen L.S1.Str-Anc designates a large-sized beam with steel stirrups spaced at s = d/2 = 265 mm and strengthened in shear with a CFRP L-shaped laminate embedded into the flange.
To examine the size effect, the present study considered the same ratio of all materials (ρw, ρs, ρFRP) when increasing the specimen size in each geometrically similar beam series (Table 3). Table 4 summarizes the mechanical properties of the unidirectional carbon fibres for the CFRP sheet and the L-shaped laminate used, as provided by the manufacturer (Sika Canada, Inc., Pointe-Claire, QC, Canada). The scope of the present study was to assess the accuracy of the prediction models. Therefore, only the results related to the shear resistance reached were reported as experimental results. All the details of other material properties (concrete, longitudinal, and transverse steel), strengthening procedure, test setup, and instrumentation, as well as analyses and discussions of the behaviour of all specimens regarding the size effect, can be found elsewhere [3,11].

5. Experimental Test Results

Table 3 contains the experimental information and specimen test results associated with groups 1 and 2. It includes specimen geometry (d and b), materials ratio (ρw and ρs), strengthening configuration and material properties (wFRP, tFRP, ρFRP, EFRP, εFRPu), contribution of CFRP (sheet or L-shaped laminate) to shear resistance (VFRP), total nominal shear resistance (Vn), normalized nominal shear strength at failure ( v n = V n / b d f c ), and the loss in shear strength with respect to the smallest beams (loss in v n ). Note that the width of the cross-section has no influence on the size effect as it has been shown by [28]. Therefore, the width of the specimens is not considered in the discussion of the experimental results.
The failure mode of all tested specimens was in shear, with diagonal tensile fracture of concrete. The crack pattern of specimens without transverse steel showed a single crack, as illustrated in Figure 4a, whereas several cracks accompanying the main central crack characterized the specimens with internal steel stirrups (Figure 4b) regardless of the CFRP strengthening material (sheet or L-shaped laminate). Table 3 shows a maximum shear gain due to EB-CFRP sheet in a specimen without internal steel stirrups (S.S0.2L) of 84%, compared with 13% in a specimen with internal steel stirrups (S.S1.2L). Because these two specimens were of the same size (small), this result reveals a significant decrease in EB-CFRP shear gain due to the presence of steel stirrups. Similar results were observed in a study carried out on strengthened RC beams with EB-CFRP by [7]. In specimens with EB-CFRP L-shaped laminate, the maximum shear gain was 16% in (M.S1.Str), but this increased to 41% for anchored laminate (M.S1.Str-Anc).
The test results confirm the existence of an interaction between internal steel stirrups and EB-CFRP strengthening, as already established in other research studies [18]. In the presence of transverse steel, this interaction tended to reduce and even negate the gain in shear resistance due to EB-CFRP, depending on the steel stirrup ratio. This held true even with the use of an anchorage system to the CFRP laminate, which increased considerably the gain in shear capacity by preventing premature debonding of the laminate. For instance, the gain due to the CFRP sheet in a strengthened specimen without steel stirrups (L.S0.1L) was 83%, but this gain substantially decreased to 15% in the same size specimen with internal steel but strengthened with the CFRP L-shaped laminate with an anchorage system (L.S1.Str-Anc).
Figure 5 presents the influence of beam size on the normalized shear strength at failure for all experimental specimens to examine the behaviour of the size effect in EB-CFRP shear-strengthened beams in different series. Comparing specimens of the same size in all series, Figure 5 shows an increase in normalized shear strength at failure: (1) with an increase in CFRP sheet rigidity by adding a second ply and (2) when the L-shaped CFRP laminate was anchored in the compression zone. However, comparison of each series revealed a decrease in normalized shear strength at failure with increasing specimen size. This result clearly confirmed the existence of a size effect in EB-CFRP-strengthened beams. This may be true for specimens with or without internal steel stirrups and with or without an anchorage system. Furthermore, an addition of a second layer of EB-CFRP, that is, an increase in the rigidity of the strengthening system, led to an amplification of the size effect in specimens without transverse steel. This may have been due to the increased shear strength gain related to the second layer of CFRP.
In the series of specimens without internal transverse steel, Table 3 shows that the loss in shear strength at failure was always greater than that of the corresponding specimens containing transverse steel stirrups. This may have occurred because the contribution of concrete was lower than that of steel [36]. Table 3 also shows that the size effect increased significantly in strengthened specimens with the CFRP L-shaped laminate after the addition of an anchorage system. It can be concluded that the anchorage system may amplify the size effect, revealing thereby a direct relation between the size effect and the gain in shear resistance attributed to EB-FRP.

6. Database and Size Effect in EB-FRP-Strengthened RC Beams

The determining element in shear strengthening with EB-FRP is the anchorage length (hFRP), also called bond length, which obviously depends on the overall height of the beam. In shear, this length is generally insufficient to transfer the shear stresses to the concrete substrate, in contrast to flexural strengthening in which the length of the beam provides an anchorage length, in most practical cases, significantly greater than the required anchorage length. The lack of anchorage length represents an important issue for shear strengthening with EB-FRP. It can lead to premature FRP debonding failure, as mostly observed in U-shaped or lateral side FRP configurations. Although limited in practice, the use of a proven anchorage system is a potential solution to avoid such a premature brittle failure mode. The question that can be raised is: If increasing the overall height of the beams increases the anchorage length hFRP, will this attenuate the size effect?
According to an experimental investigation by [37], increasing hFRP increases the shear resistance, but not proportionally. This increase improves the shear stress (τ) distribution along the FRP (Figure 6). According to [9], the behaviour of the size effect in EB-FRP shear-strengthened beams may be positive, compared with unstrengthened beams. However, according to [38], increasing EB-FRP bond length does not necessarily imply an increase in FRP gain. This is the case because there is an effective anchorage length (Le) of FRP beyond which the gain due to FRP is capped, even if hFRP increases.
Few studies have been dedicated to the size effect in EB-FRP shear-strengthened beams [3,10,11,12,13,14,15,16,17]. Different strengthening configurations were used in these studies with different material ratios on RC rectangular as well as T-section beams. However, as can be seen in Table 5, the only studied parameter in these investigations was the addition of the FRP strengthening system, except for the studies carried out by [3,11,13], where many parameters were considered.
Table 5 presents some of the influencing parameters that govern the EB-FRP contribution level, as well as the status of their consideration in all the experimental size effect studies cited above. According to the analysis of experimental studies by [39], the parameters of major influence on shear resistance may mitigate or amplify the size effect. Table 5 clearly shows that the influencing parameters are rarely included in experimental research. Indeed, the only studies that include all the parameters in Table 5 are those of [3,11], including the use of a prefabricated L-shaped laminate that was specially designed for shear strengthening in a U-shaped configuration and was tested in [40].
Table 6 presents a database containing specimens strengthened in shear with EB-FRP from various studies in the literature. It includes the most relevant data specimen with a different size from experimental studies on the size effect for the purpose of analysis and comparison. Several experimental studies on strengthened RC beams with an EB-FRP U-jacket, such as recent works (e.g., [41,42]), although relevant, do not consider the size effect as a study parameter; therefore, they are not part of the database in Table 6, which contains only the geometrically similar specimens with different sizes. Table 6 presents the geometry of the specimens, the material properties, and the results, similarly to Table 3. To achieve a sufficiently accurate comparison, the results in this table were normalized according to the geometrical properties of the beams.
The results in Table 6 clearly show an increase in loss of shear strength as the specimen size increased. This confirms the existence of a size effect in most specimens strengthened in shear with EB-FRP. However, to study the size effect behaviour with EB-FRP, only the contribution of EB-FRP to the shear strength at failure was estimated from the data in Table 6 and was identified by v f (in MPa). Figure 7 illustrates the shear strength at failure due to FRP ( v f ) with increasing beam size (d) for strengthened specimens with U-wrap Figure 7a and full-wrap Figure 7b configurations. Figure 7 clearly shows a difference between U-wrap and full-wrap configurations. The trend in Figure 7a shows that the shear strength at failure decreased as the effective depth increased. This trend changed in the full-wrap configuration, where no reduction in shear strength with increasing size was observed, as shown in Figure 7b. This clearly reveals that the full-wrap configuration can mitigate the size effect for EB-FRP shear-strengthened specimens. The disappearance of the size effect in fully wrapped strengthened specimens can be attributed to the FRP fracture failure mode [3]. Fracture of FRP generally occurs when FRP reaches its ultimate strain (εFRPu). The ultimate tensile strength of FRP is significantly greater than that of both steel and concrete, which means that the shear failure mechanism is mainly governed by the FRP system.

7. Current Codes and Design Guidelines

This section presents the design models for RC beams strengthened in shear with EB-FRP (ACI-440.2R-17 2017 [20]; CSA-S6-19 2019 [21]; CSA-S806-12 2012 [22]; fib-TG5.1-19 2019 [23]; fib-TG9.3-01 2001 [24]; JSCE 2001 [25]). Note that in all the prediction models, the approach adopted to calculate the total shear resistance of EB-FRP-strengthened beams was to add the resistance contribution of each material: concrete (Vc), internal transverse steel (Vs), and external FRP (VFRP). It follows that the shear resistance attributed to each material was independent according to the design models. This assumption adopted by the codes and design guidelines models did not consider any interaction between these three materials. Therefore, the size effect related to EB-FRP had to be considered in the VFRP prediction model.

7.1. CSA-S806-12 and CSA-S6-19

Canadian standards CSA-S806-12 (2012) [22] and CSA-S6-19 (2019) [21] govern the design and construction of building structures with fibre-reinforced polymers and the Canadian Highway Bridge design code, respectively. The first versions of these standards were published in 2002 and 2000, respectively. The contribution to nominal shear resistance attributed to EB-FRP according to these two standards is given by the same model, as follows:
V F R P = E F R P ε F R P e A F R P d F R P ( c o t   θ + c o t   α F R P ) s i n   α F R P S F R P
ε F R P e = 0.006 0.75 ε F R P u   CSA - S 806 - 12   full - wrap   configuration
ε F R P e = 0.004 0.75 ε F R P u   CSA - S 6 - 19   full - wrap   configuration
ε F R P e = 0.005 0.75 ε F R P u   CSA - S 806 - 12   U - wrap   configuration   with   anchorage
ε F R P e = k v ε F R P u 0.004   U - wrap   and   lateral   side   configuration
k v = k 1 k 2 L e 11900 ε F R P u 0.75 ;   k 1 = ( f c 27 ) 2 / 3 ;   k 2 = { d F R P L e d F R P   U - wrap d F R P 2 L e d F R P   lateral   side ; L e = 23300 ( n t F R P E F R P ) 0.58

7.2. ACI-440.2R-17

ACI-440.2R-17 (2017) [20] is the American guide for design and construction with EB-FRP systems for strengthening concrete structures. The first version of this guide was published in 1996 and has undergone several updates since then. The contribution to the nominal shear resistance attributed to EB-FRP by this guide is much like that in the model adopted by Canadian standards. It is expressed by the following equation:
V F R P = A F R P E F R P ε F R P e ( s i n   α + c o s   α ) d F R P s F R P
Calculation of the effective strain ( ε F R P e ) follows the same equations as those of the CSA-S6-19 (2019) [21] standard mentioned above.

7.3. JSCE 2001

JSCE (2001) [25] is the Japanese code giving recommendations for upgrading of concrete structures with the use of continuous fibre sheets. The contribution to the nominal shear resistance due to EB-FRP is given by the following equations:
V F R P = k [ A F R P f F R P u ( s i n   α F R P + c o s   α F R P ) S F R P ] d v
K = 1.68 0.67 R for   0.4 k 0.8
k = ( ρ F R P E F R P ) 1 / 4 ( f F R P u E F R P ) 2 / 3 ( 1 f c ) 1 / 3   for   0.5 R 2.0 .

7.4. fib-TG9.3 (2001) and fib-TG5.1 (2019)

fib-TG9.3-01 (2001) [24] is the European code for strengthening concrete structures with EB-FRP. The contribution to the nominal shear resistance due to EB-FRP is given by the following formulas:
V F R P = 0.9 ε f , e E F R P ρ F R P b w d ( c o t   θ + c o t   α ) s i n   α
ε f , e = 0.17 ( f c m 2 / 3 E f u ρ f ) 0.30 ε F R P u   full - wrap   and   U wrap   with   anchorage   system  
ε f , e = min [ 0.65 ( f c m 2 / 3 E f u ρ f ) 0.56 · 10 3   ;   0.17 ( f c m 2 / 3 E f u ρ f ) 0.30 ε f u   ]   U wrap   on   lateral   sides .
fib-TG5.1-19 (2019) [23] is the updated version of the European code. The contribution to the nominal shear resistance due to EB-FRP is given by the following formula:
V R F R P = A F R P S F R P   h F R P   .   f f w d ( c o t   θ + c o t   α ) s i n   α .
In the new prediction model,   f f w d represents the effective tensile strength in EB-FRP intercepted by the shear crack and depends on the strengthening configuration as follows.
1. Full-wrap configuration
f f w d = f f w d , c = k R   ·   a t   ·   f F R P u
k R = { 0.5 R 50 ( 2 R 50 )   R < 50   mm 0.5   R 50   mm
where f f w d , c = FRP tensile strength for full-wrap configuration, at = 0.8, and R = chamfer radius.
2. U-wrap configuration with anchorage system
f f w d = k a   ·     f f w d , c .  
3. U-wrap configuration
f f w d = min ( f f b w d , f f w d , c ) .

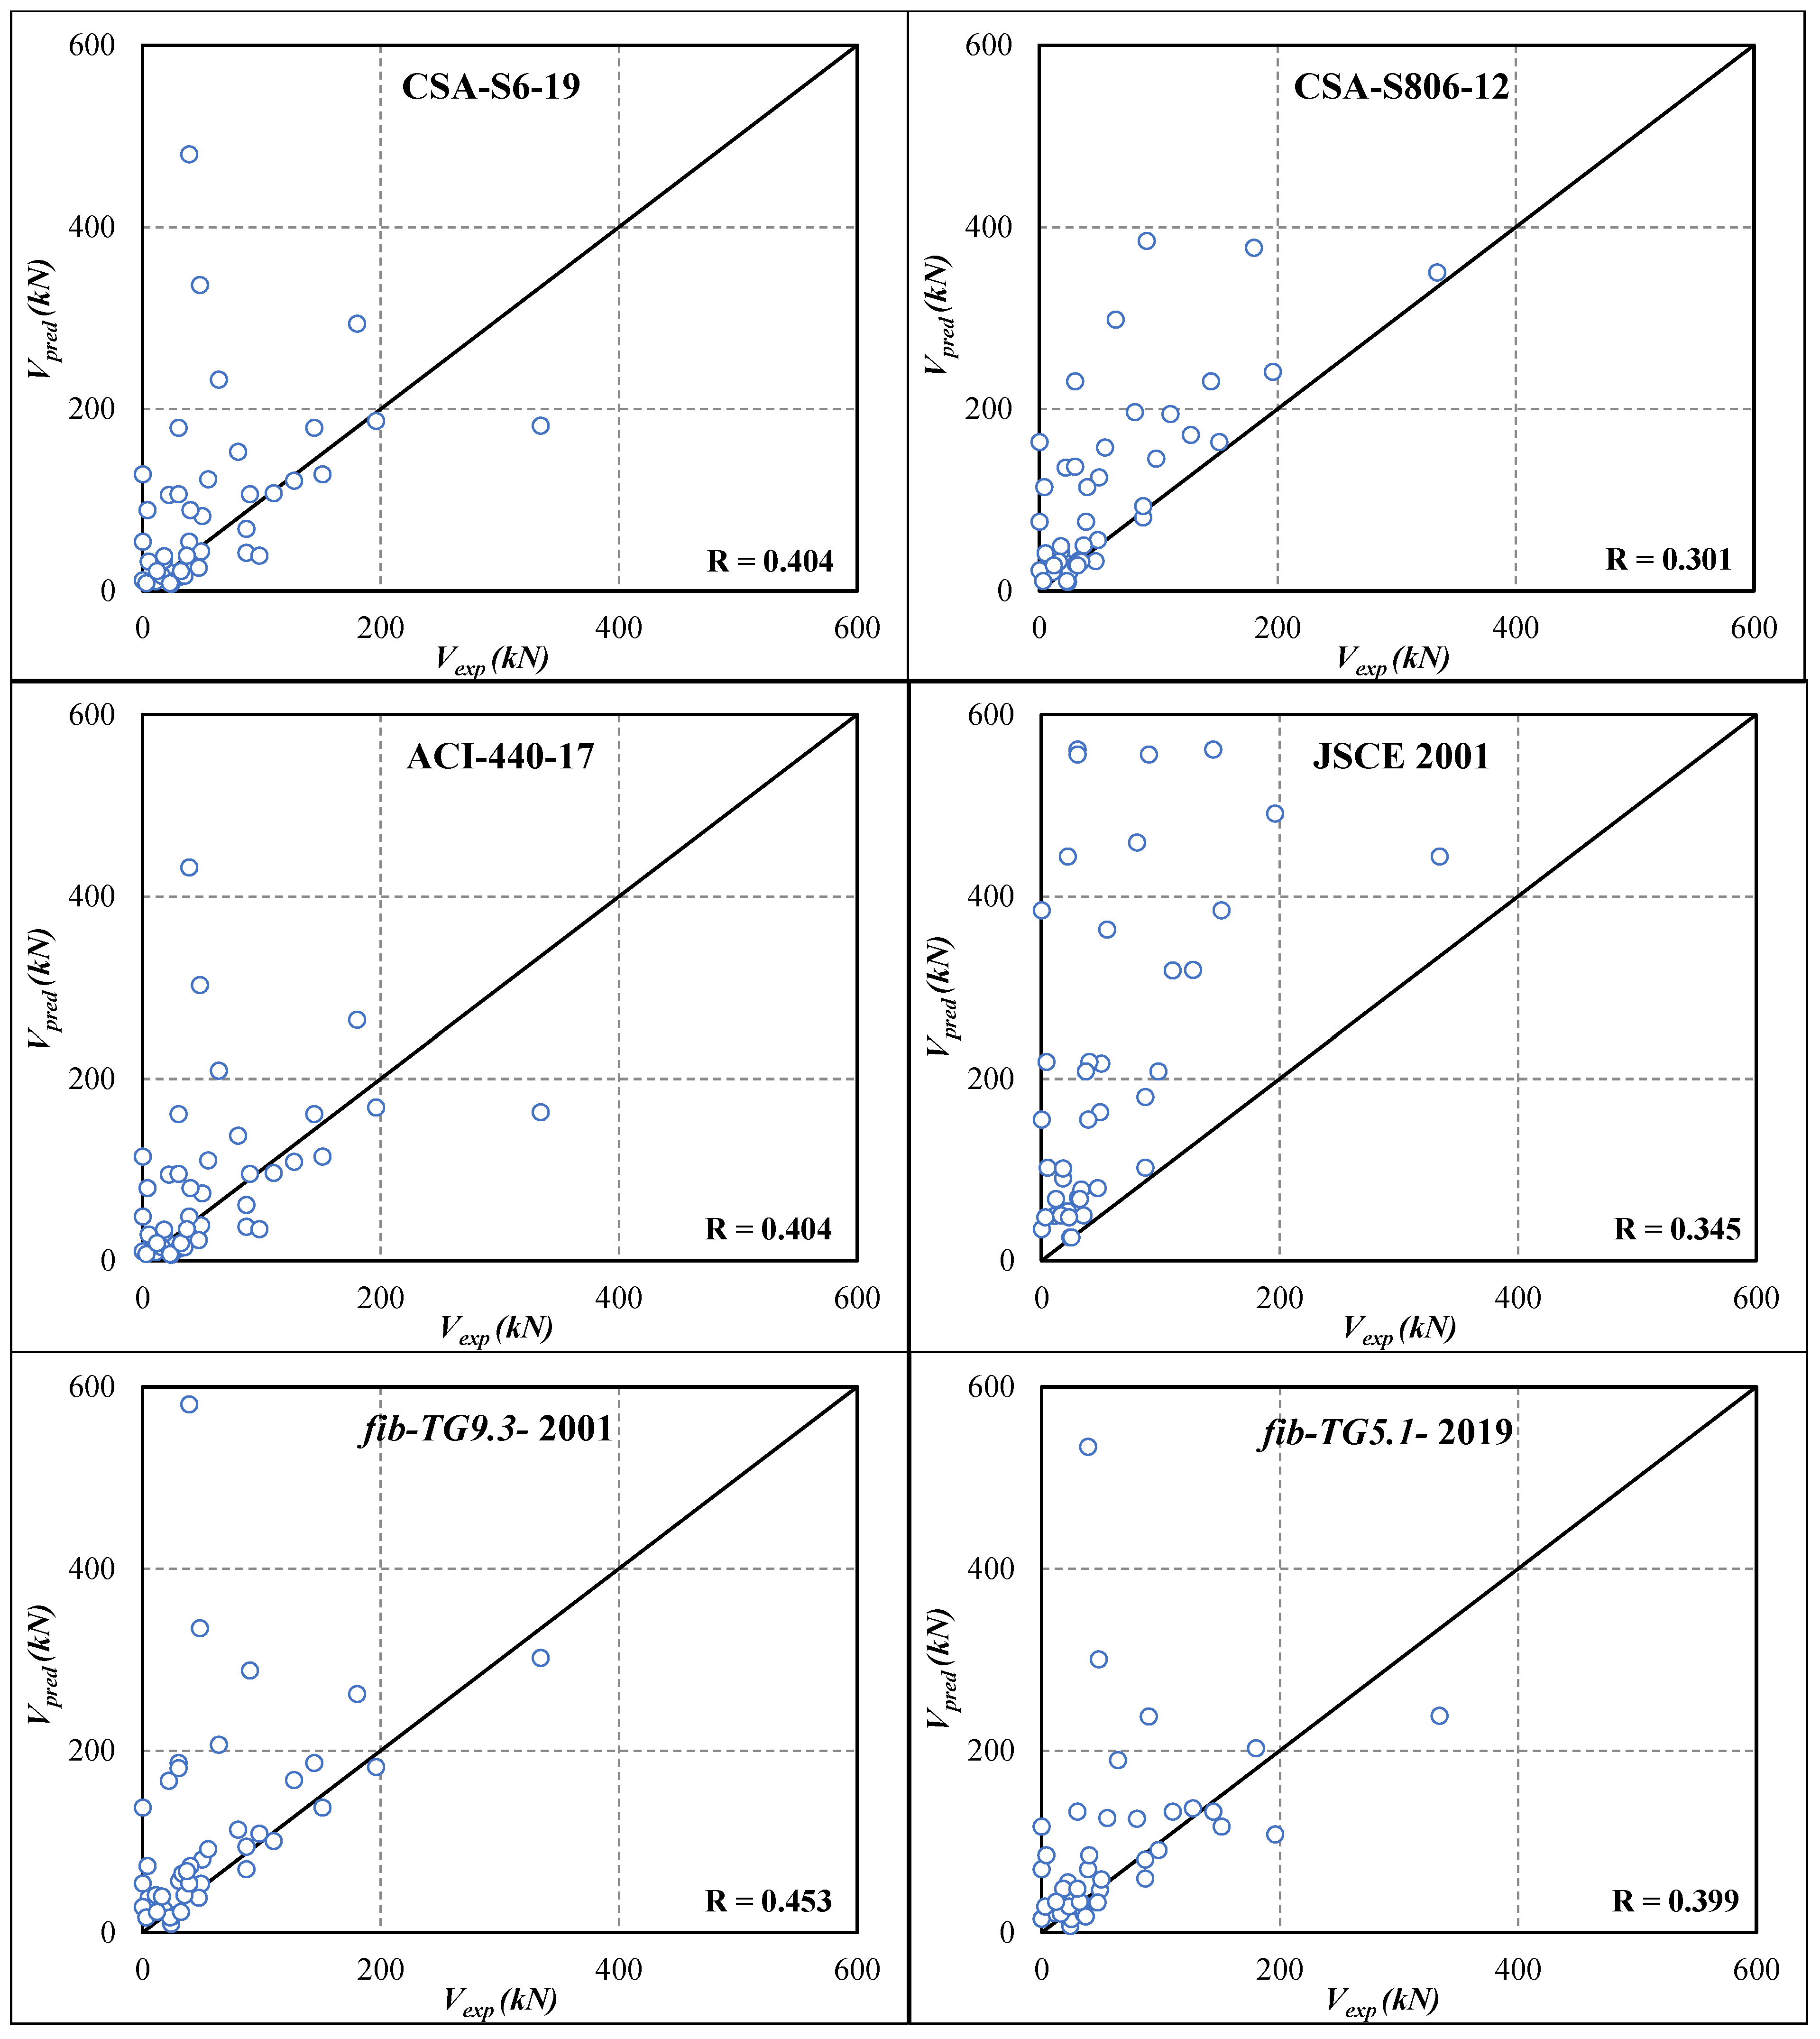
8. Comparison of Experimental Results with Prediction Models of Codes and Design Guidelines

Table 7 presents a comparison between experimental EB-FRP contributions to nominal shear resistance Vexp and the prediction models Vpred of the considered design guidelines. Note that the details of the specimens, including geometry, strengthening configuration, material properties, and some results, have already been displayed in Table 3 and Table 6 for the experimental studies carried out by the authors and those from the literature, respectively.
Figure 8 examines the accuracy of the prediction models by comparing the FRP contribution as predicted (Vpred) with the corresponding experimental value (Vexp). The diagonal in the figure designates the 0% tolerance line, indicating a perfect prediction (Vpred = Vexp). The points above the line are overestimated predictions (Vpred > Vexp), i.e., on the non-conservative (unsafe) side, whereas those in the lower part are on the conservative (safe) side (Vpred < Vexp).
To achieve an objective comparison, some results in Table 7 were not considered in Figure 8. The reason for this exclusion is that the specimens involved did not show any gain due to FRP strengthening (Vexp = 0), which is unrealistic. Therefore, including them could distort the overall results, particularly from a statistical analysis point of view, where they could generate misleading deviations in the correlation.
Table 7 reveals that the predictions of FRP contribution to shear resistance of the Canadian standard CSA-S6-19 (2019) [21] were very close to those of the American guide ACI-440.2R-17 (2017) [20]. This can be observed by comparing the Vpred/Vexp ratios corresponding to both models.
The correlation coefficients in Figure 8 show that the best correlation with experimental results was that of fib-TG9.3-01 (2001) (R = 0.453), followed by those of CSA-S6-19 (2019) and ACI-440.2R-17 (2017) (R = 0.404). Although both Canadian standards use the same prediction model, the difference between the correlation coefficient for CSA-S6-19 (2019) (R = 0.404) and that for CSA-S806-12 (2012) (R = 0.301) is due to the FRP effective strain limitation εFRPe and the diagonal cracking angle (θ). In fact, the cracking angle was estimated to be θ = 35° by the simplified method, and the effective strain of FRP was limited to εFRPe ≤ 0.006 in CSA-S806-12 (2012), compared with θ = 42° and εFRPe ≤ 0.004 in CSA-S6-19 (2019).
Figure 8 clearly shows that a considerable number of points were on the non-conservative side, which means that the prediction model overestimated the FRP contribution to shear resistance. For example, the ACI-440.2R-17 (2017) and CSA-S6-19 (2019) models overestimated approximately 60% of the specimens (see also Table 7). The (fib-TG5.1-19 2019) model overestimated about 70% of the specimens, and the (CSA-S806-12 2012 [22]; fib-TG9.3-01 2001 [24]) models overestimated about 80% of the specimens. As for the JSCE (2001) model, it overestimated almost 100% of the specimens. Comparing the new version of the European code (fib-TG5.1-19 2019), there was a modest improvement (10%) over the old 2001 version regarding the number of overestimated specimens.
According to these results, the prediction models used by the codes and design guidelines clearly fail to account for all the major parameters that influence the EB-FRP contribution to the shear performance of strengthened RC beams. Therefore, until these important parameters are captured, these models should be used with caution.
To underscore the size effect on behaviour, Figure 9 presents the ratio Vpred/Vexp as a function of specimen effective depth. In this figure, the arrow represents the trend of the curves, highlighting the direction of evolution of the ratio (Vpred/Vexp) as the beam size increases. It is apparent that the ratio Vpred/Vexp was scattered on either side of the reference line corresponding to Vpred/Vexp = 1 in almost all codes except for the JSCE (2001) model, where practically all the points were above the reference line.
The curve trends clearly reveal that the influence of the size effect was moderate for fib-TG5.1-19 2019 [23], CSA-S6-19 (2019) [21], and ACI-440.2R-17 (2017) [20] compared with CSA-S806-12 (2012) [22] and fib-TG9.3-01 (2001) [24]. In contrast, according to the JSCE (2001) [25] predictions, the shape of the curve trend was sharply ascending, which confirmed that the influence of the size effect is very pronounced. Note that there has been a significant improvement in the influence of the size effect in the updated version of the European code (fib-TG5.1-19 2019). Indeed, from the curve trend of the new version of the fib-TG5.1-19 (2019) code, which is associated with the best curve shown in Figure 9, it can be observed that the size effect has significantly less influence on the Vpred/Vexp ratio as beam size increases.
It can therefore be concluded from the review of current codes and design guidelines that the size effect is unfortunately not taken into consideration in currently used prediction models. Given the significant impact that the size effect can have on the performance of EB-FRP-strengthened beams, it is recommended that the codes and design guidelines consider its comprehensive inclusion into their prediction models. Indeed, in some cases, the size effect can considerably reduce the gain in shear resistance attributed to EB-FRP.

9. Conclusions

This study evaluated the accuracy of the prediction models in terms of the size effect in shear-strengthened RC beams with EB-FRP based on a database built from experimental studies carried out by the authors and reported in the literature. Based on the comparison of experimental test results and predictions of EB-FRP contribution to shear resistance by various leading codes and guidelines (ACI-440.2R-17 2017; CSA-S6-19 2019; CSA-S806-12 2012; fib-TG5.1-19 2019; fib-TG9.3-01 2001; JSCE 2001), the following conclusions can be drawn:
(1)
The prediction models of EB-FRP contribution to shear resistance do not contain any reducing term to count for size effect, unlike the models of concrete contribution in conventional RC beams, in which a reduction coefficient depending on beam height is provided.
(2)
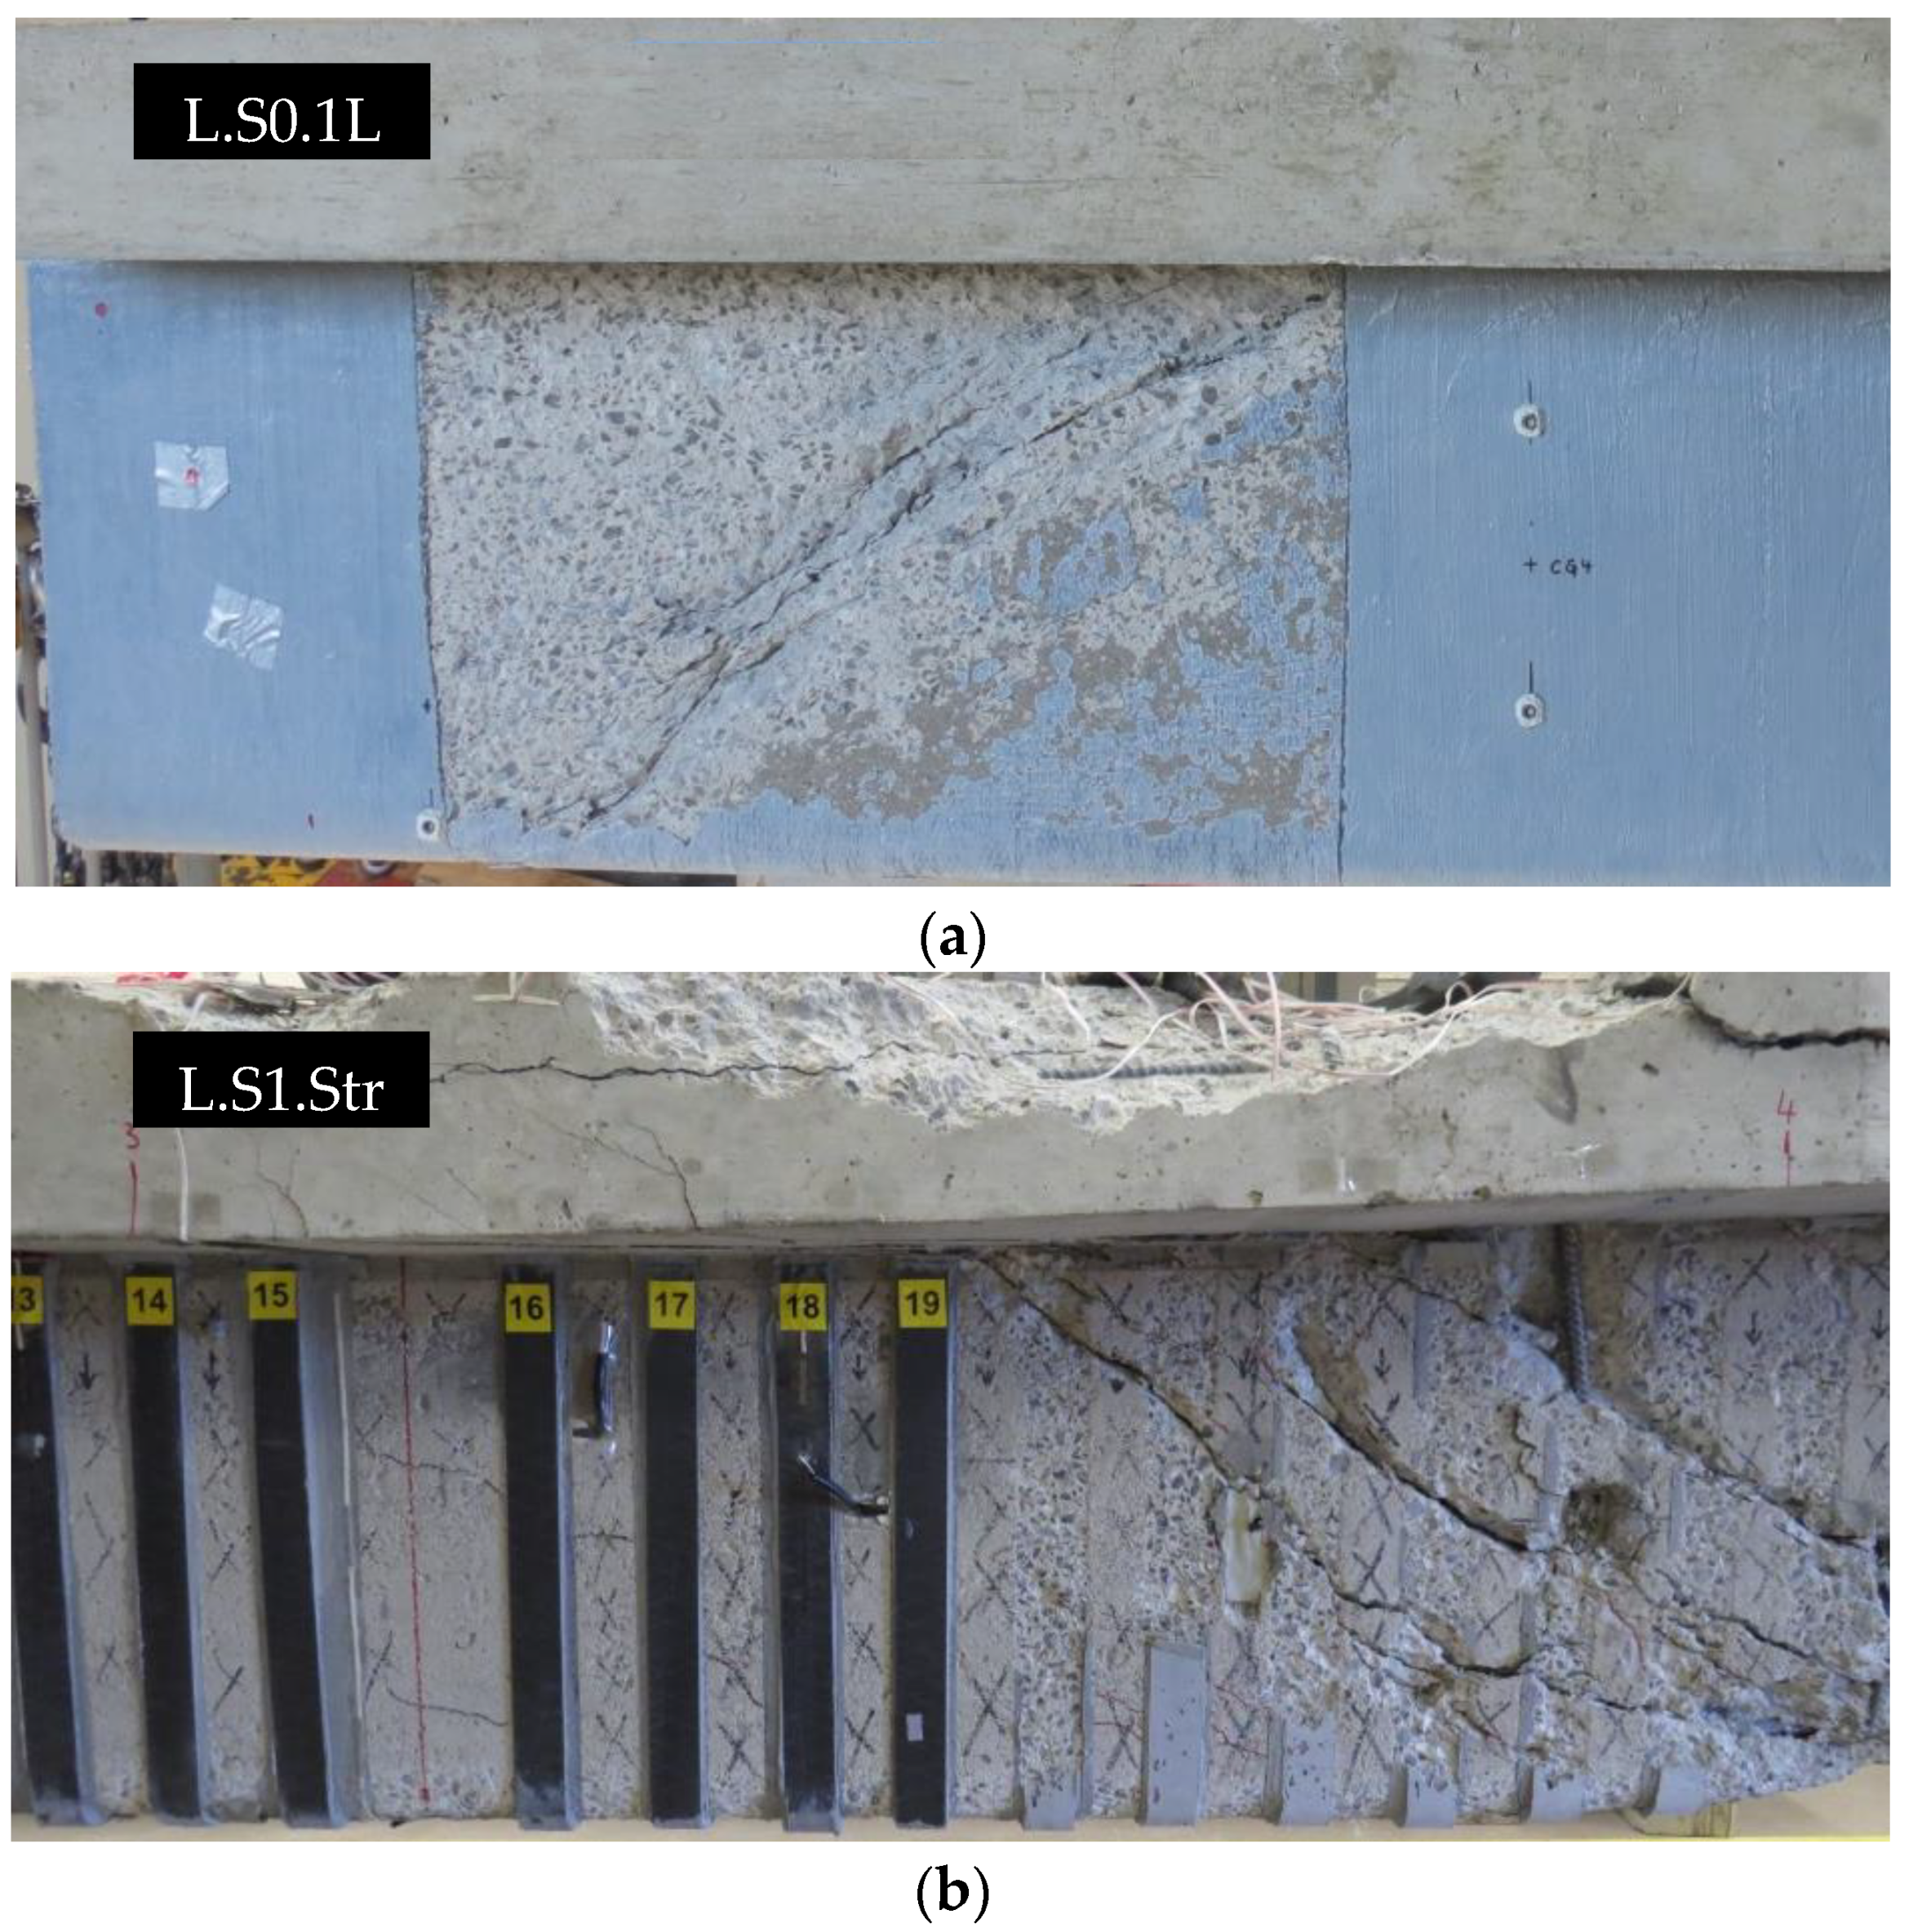
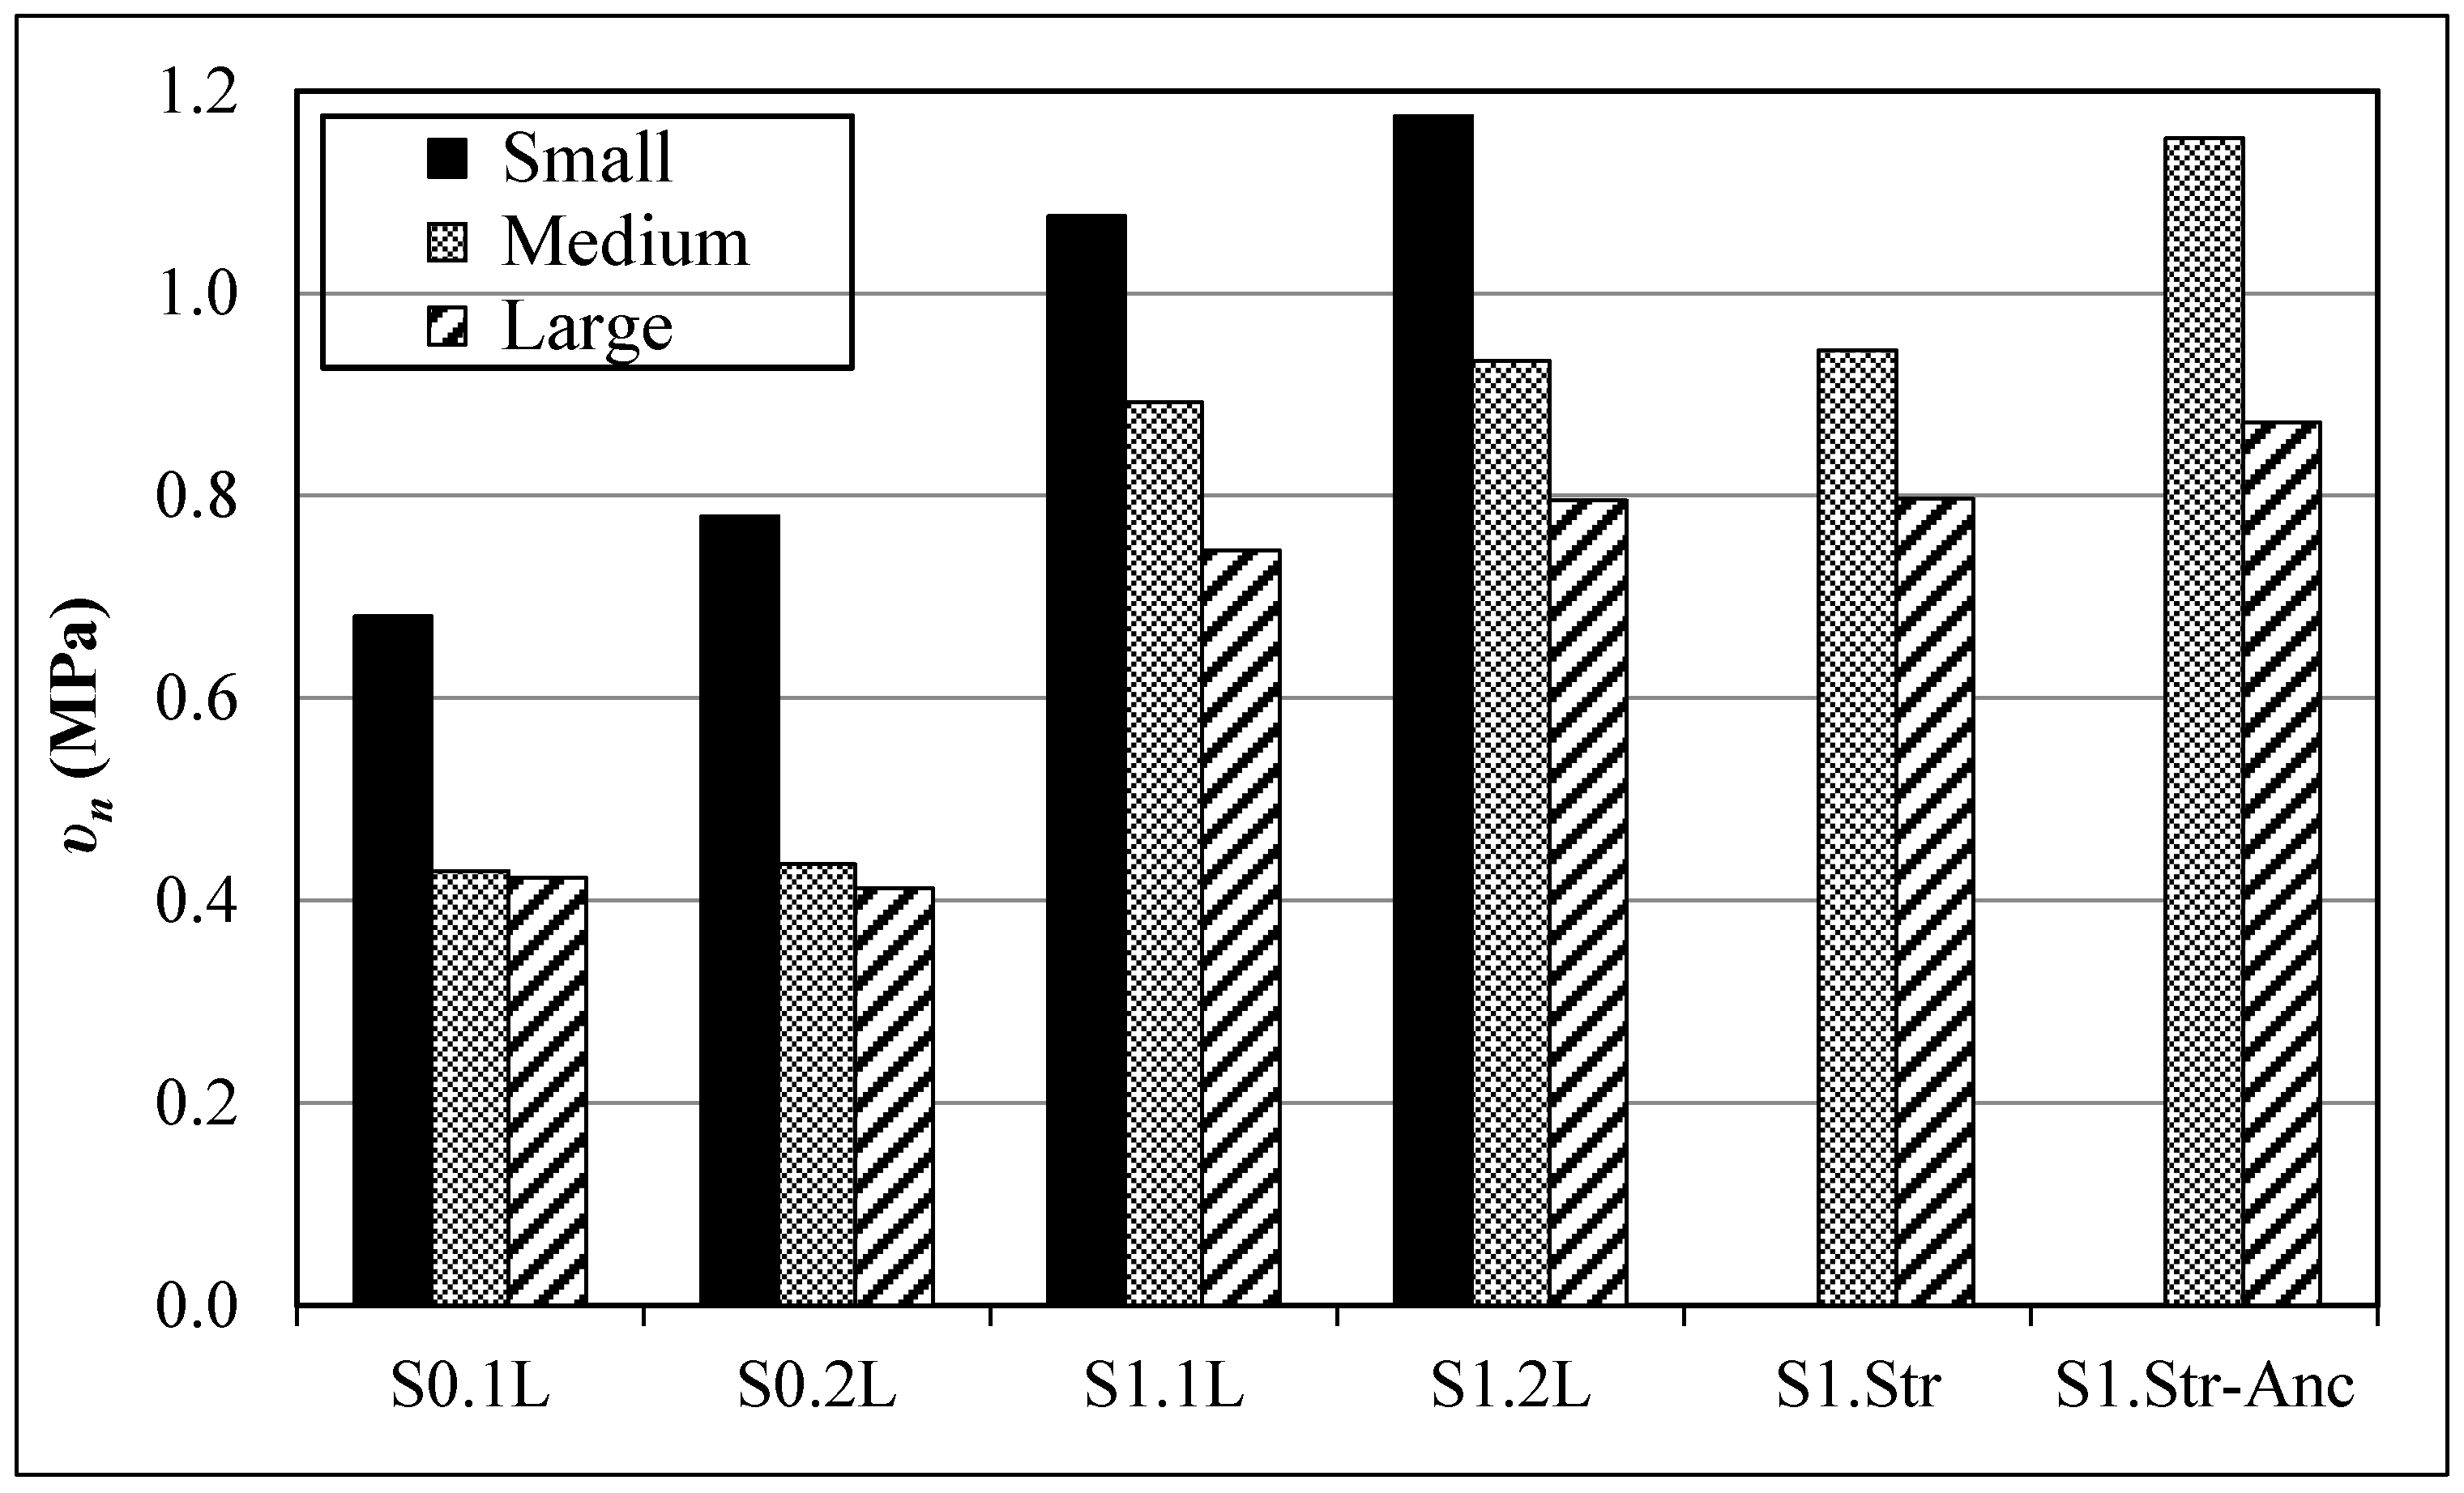
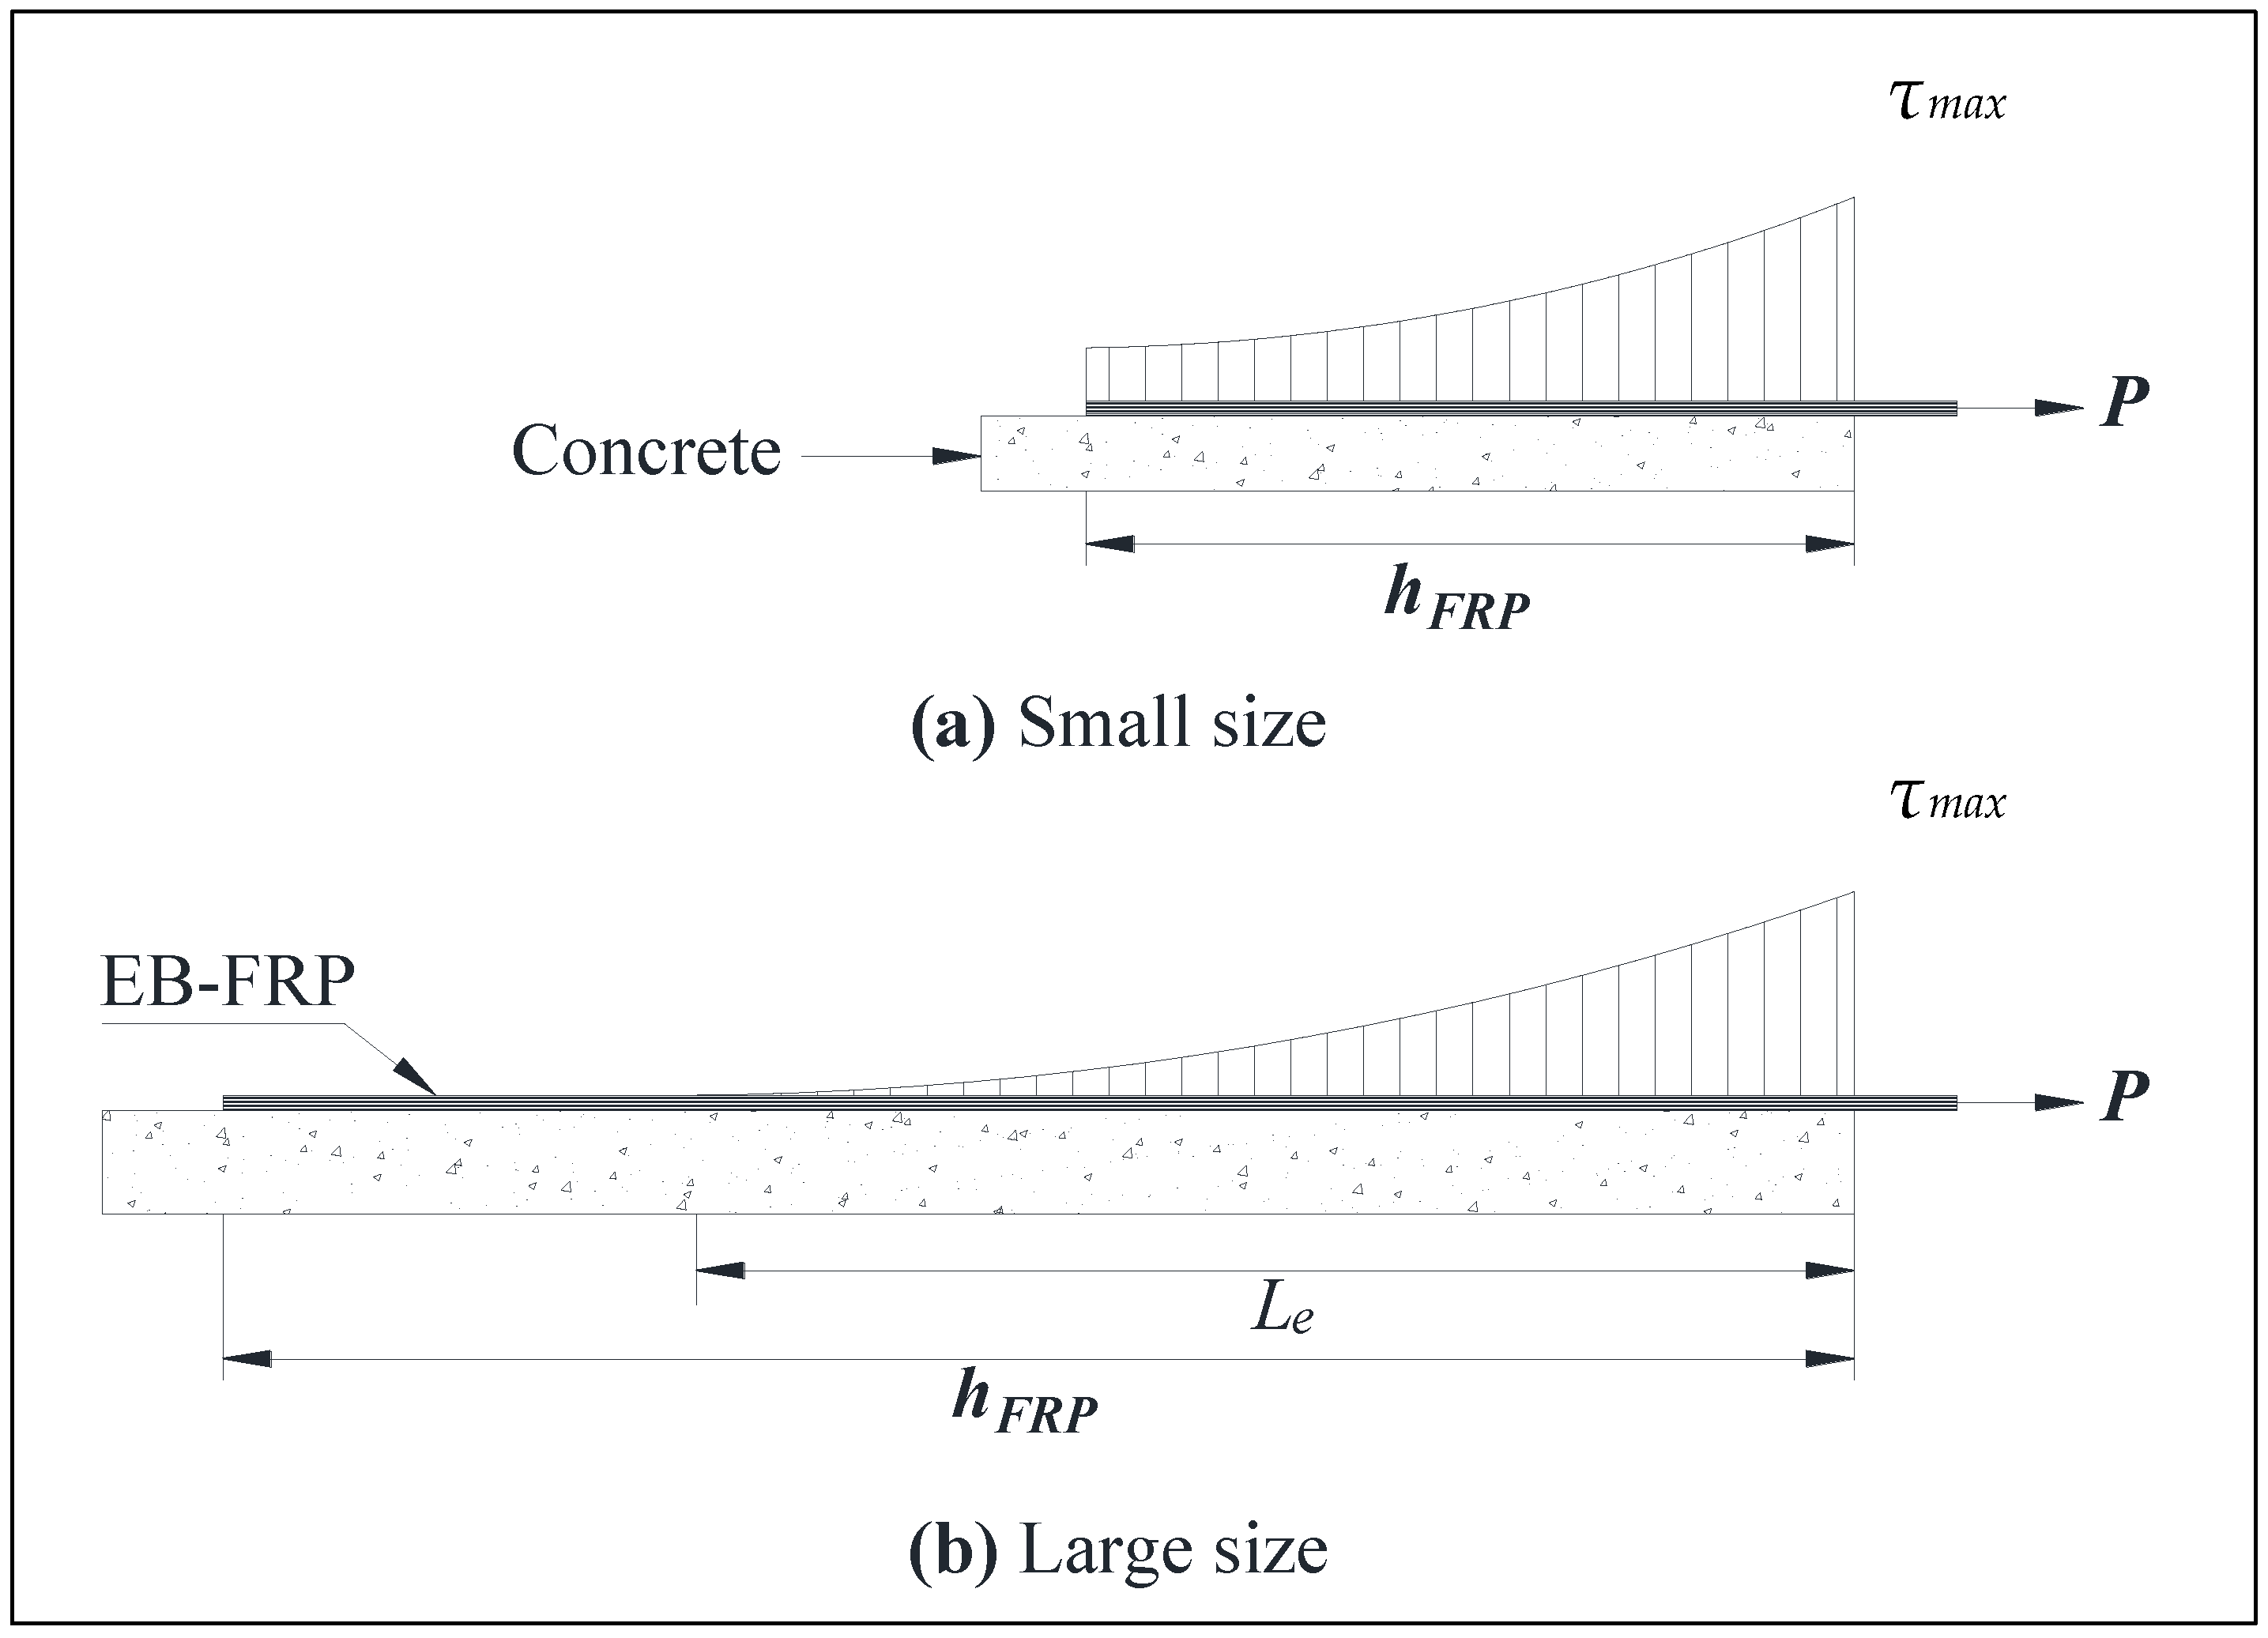
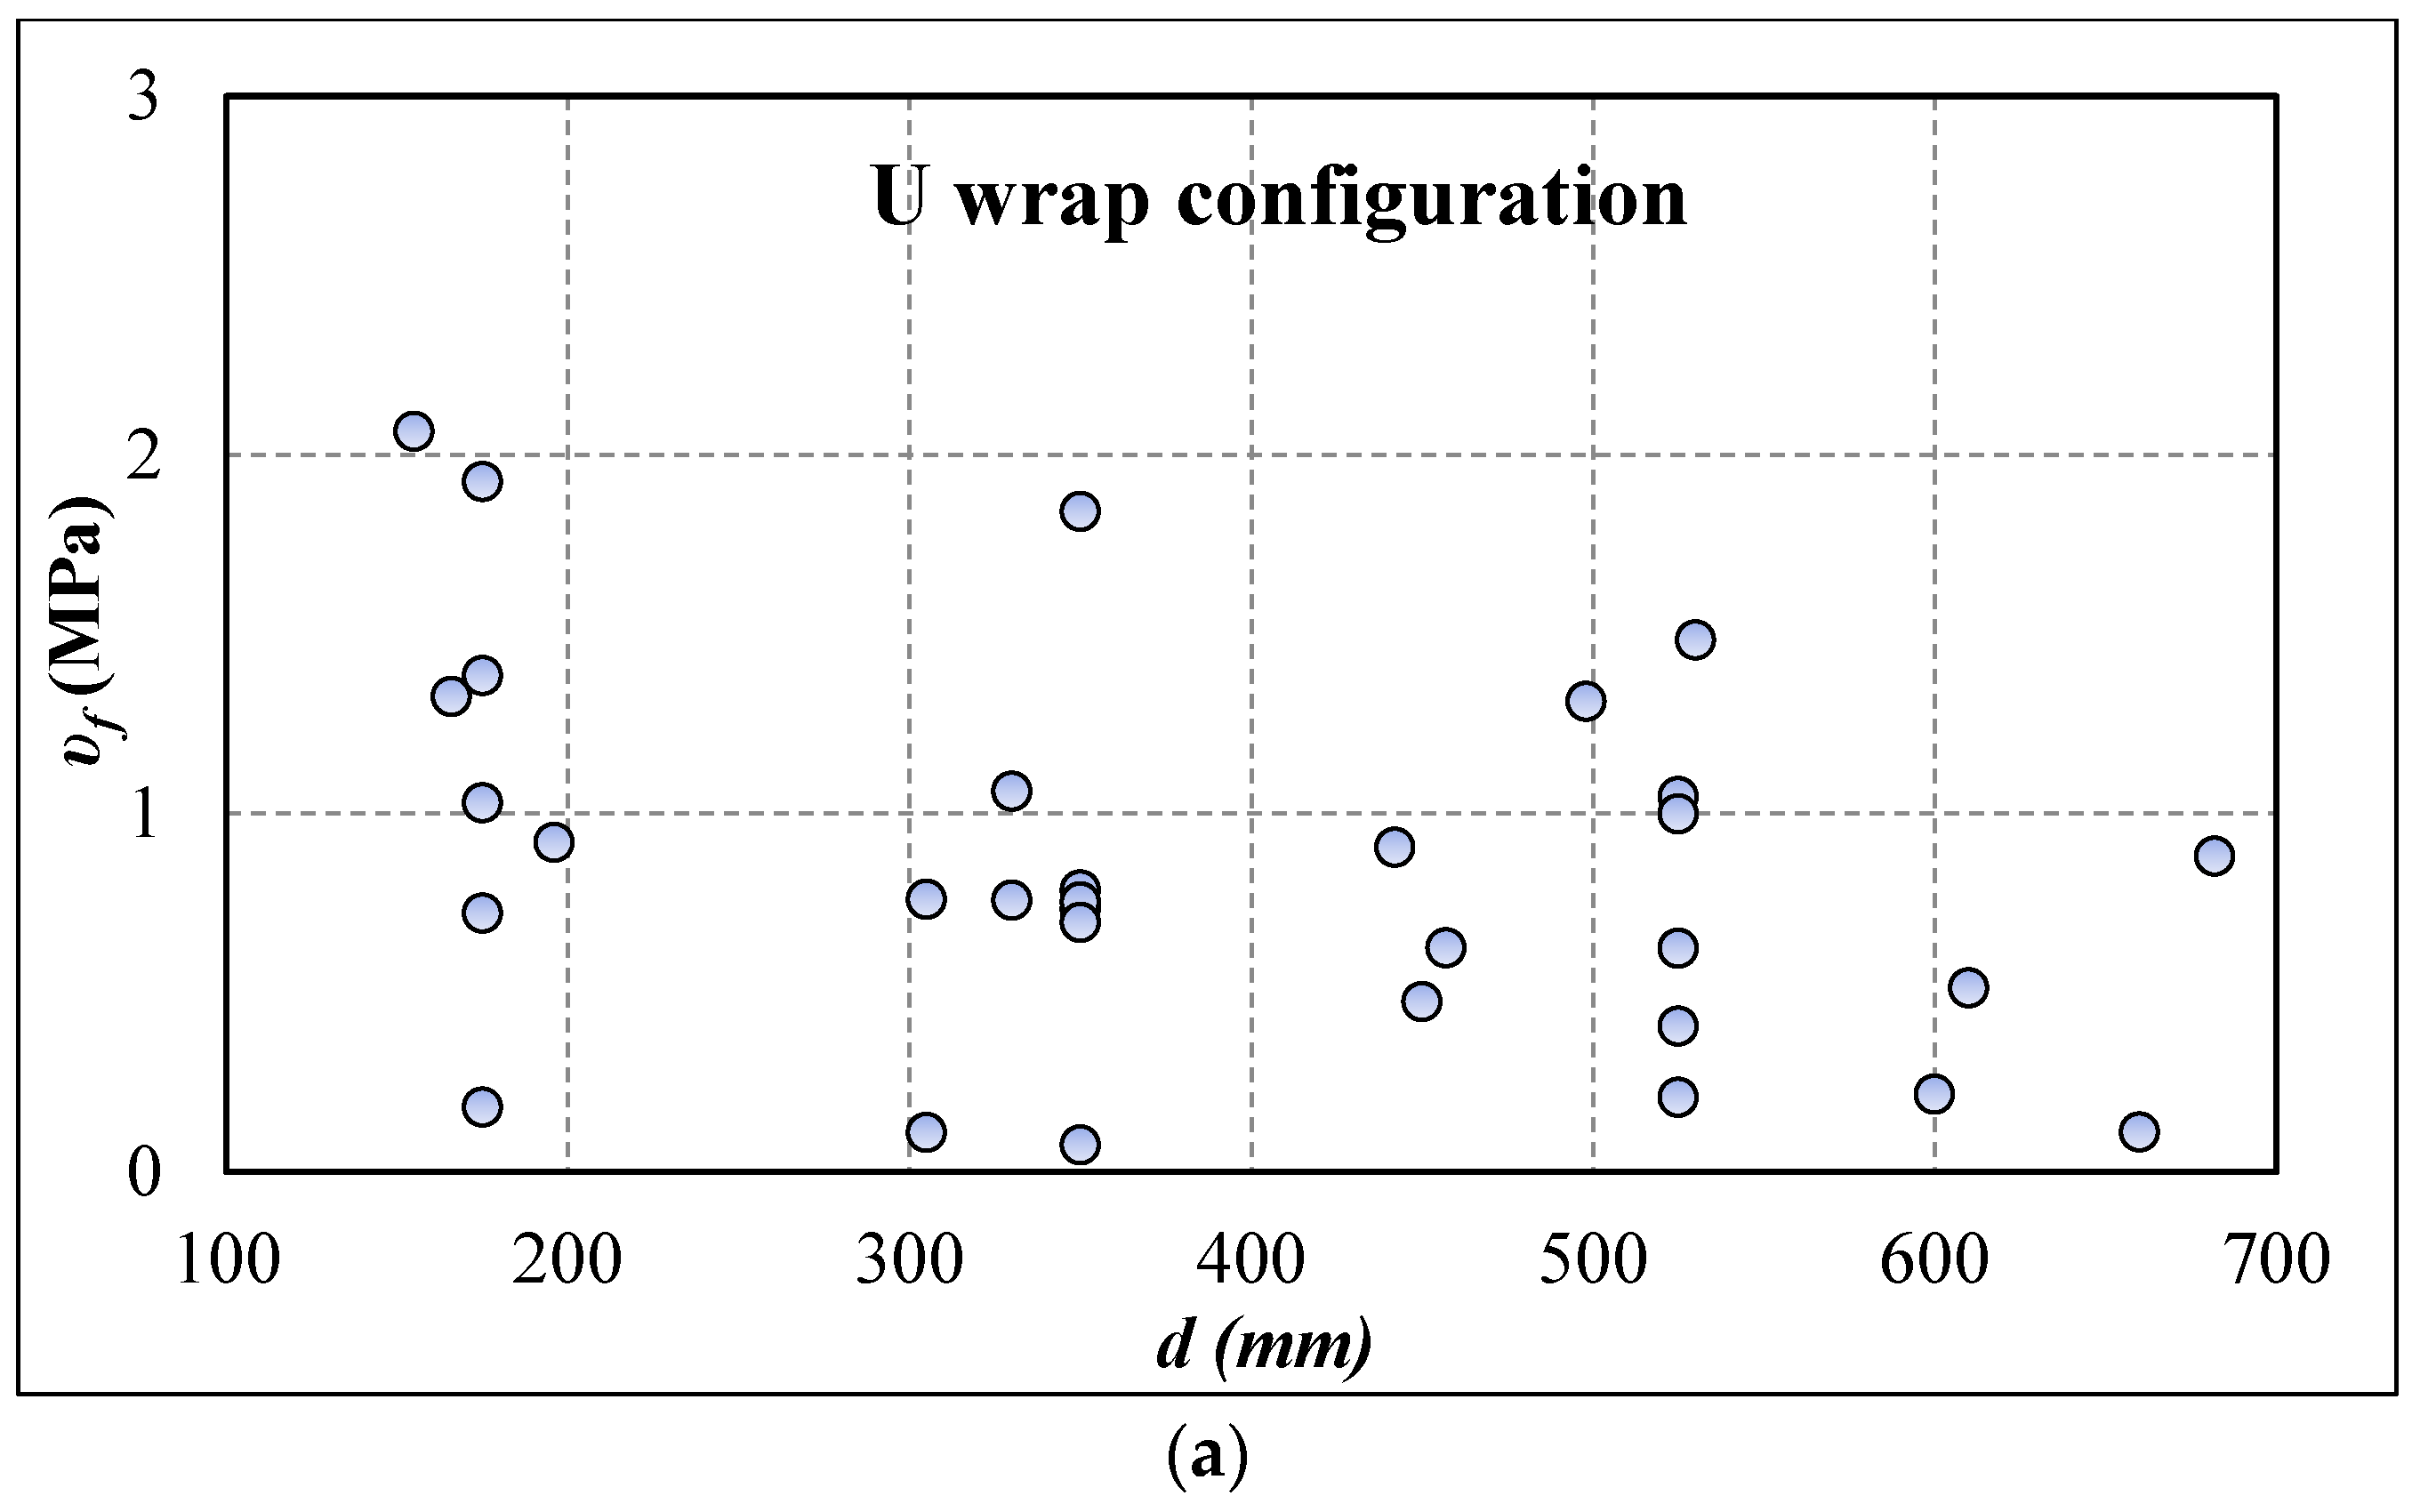
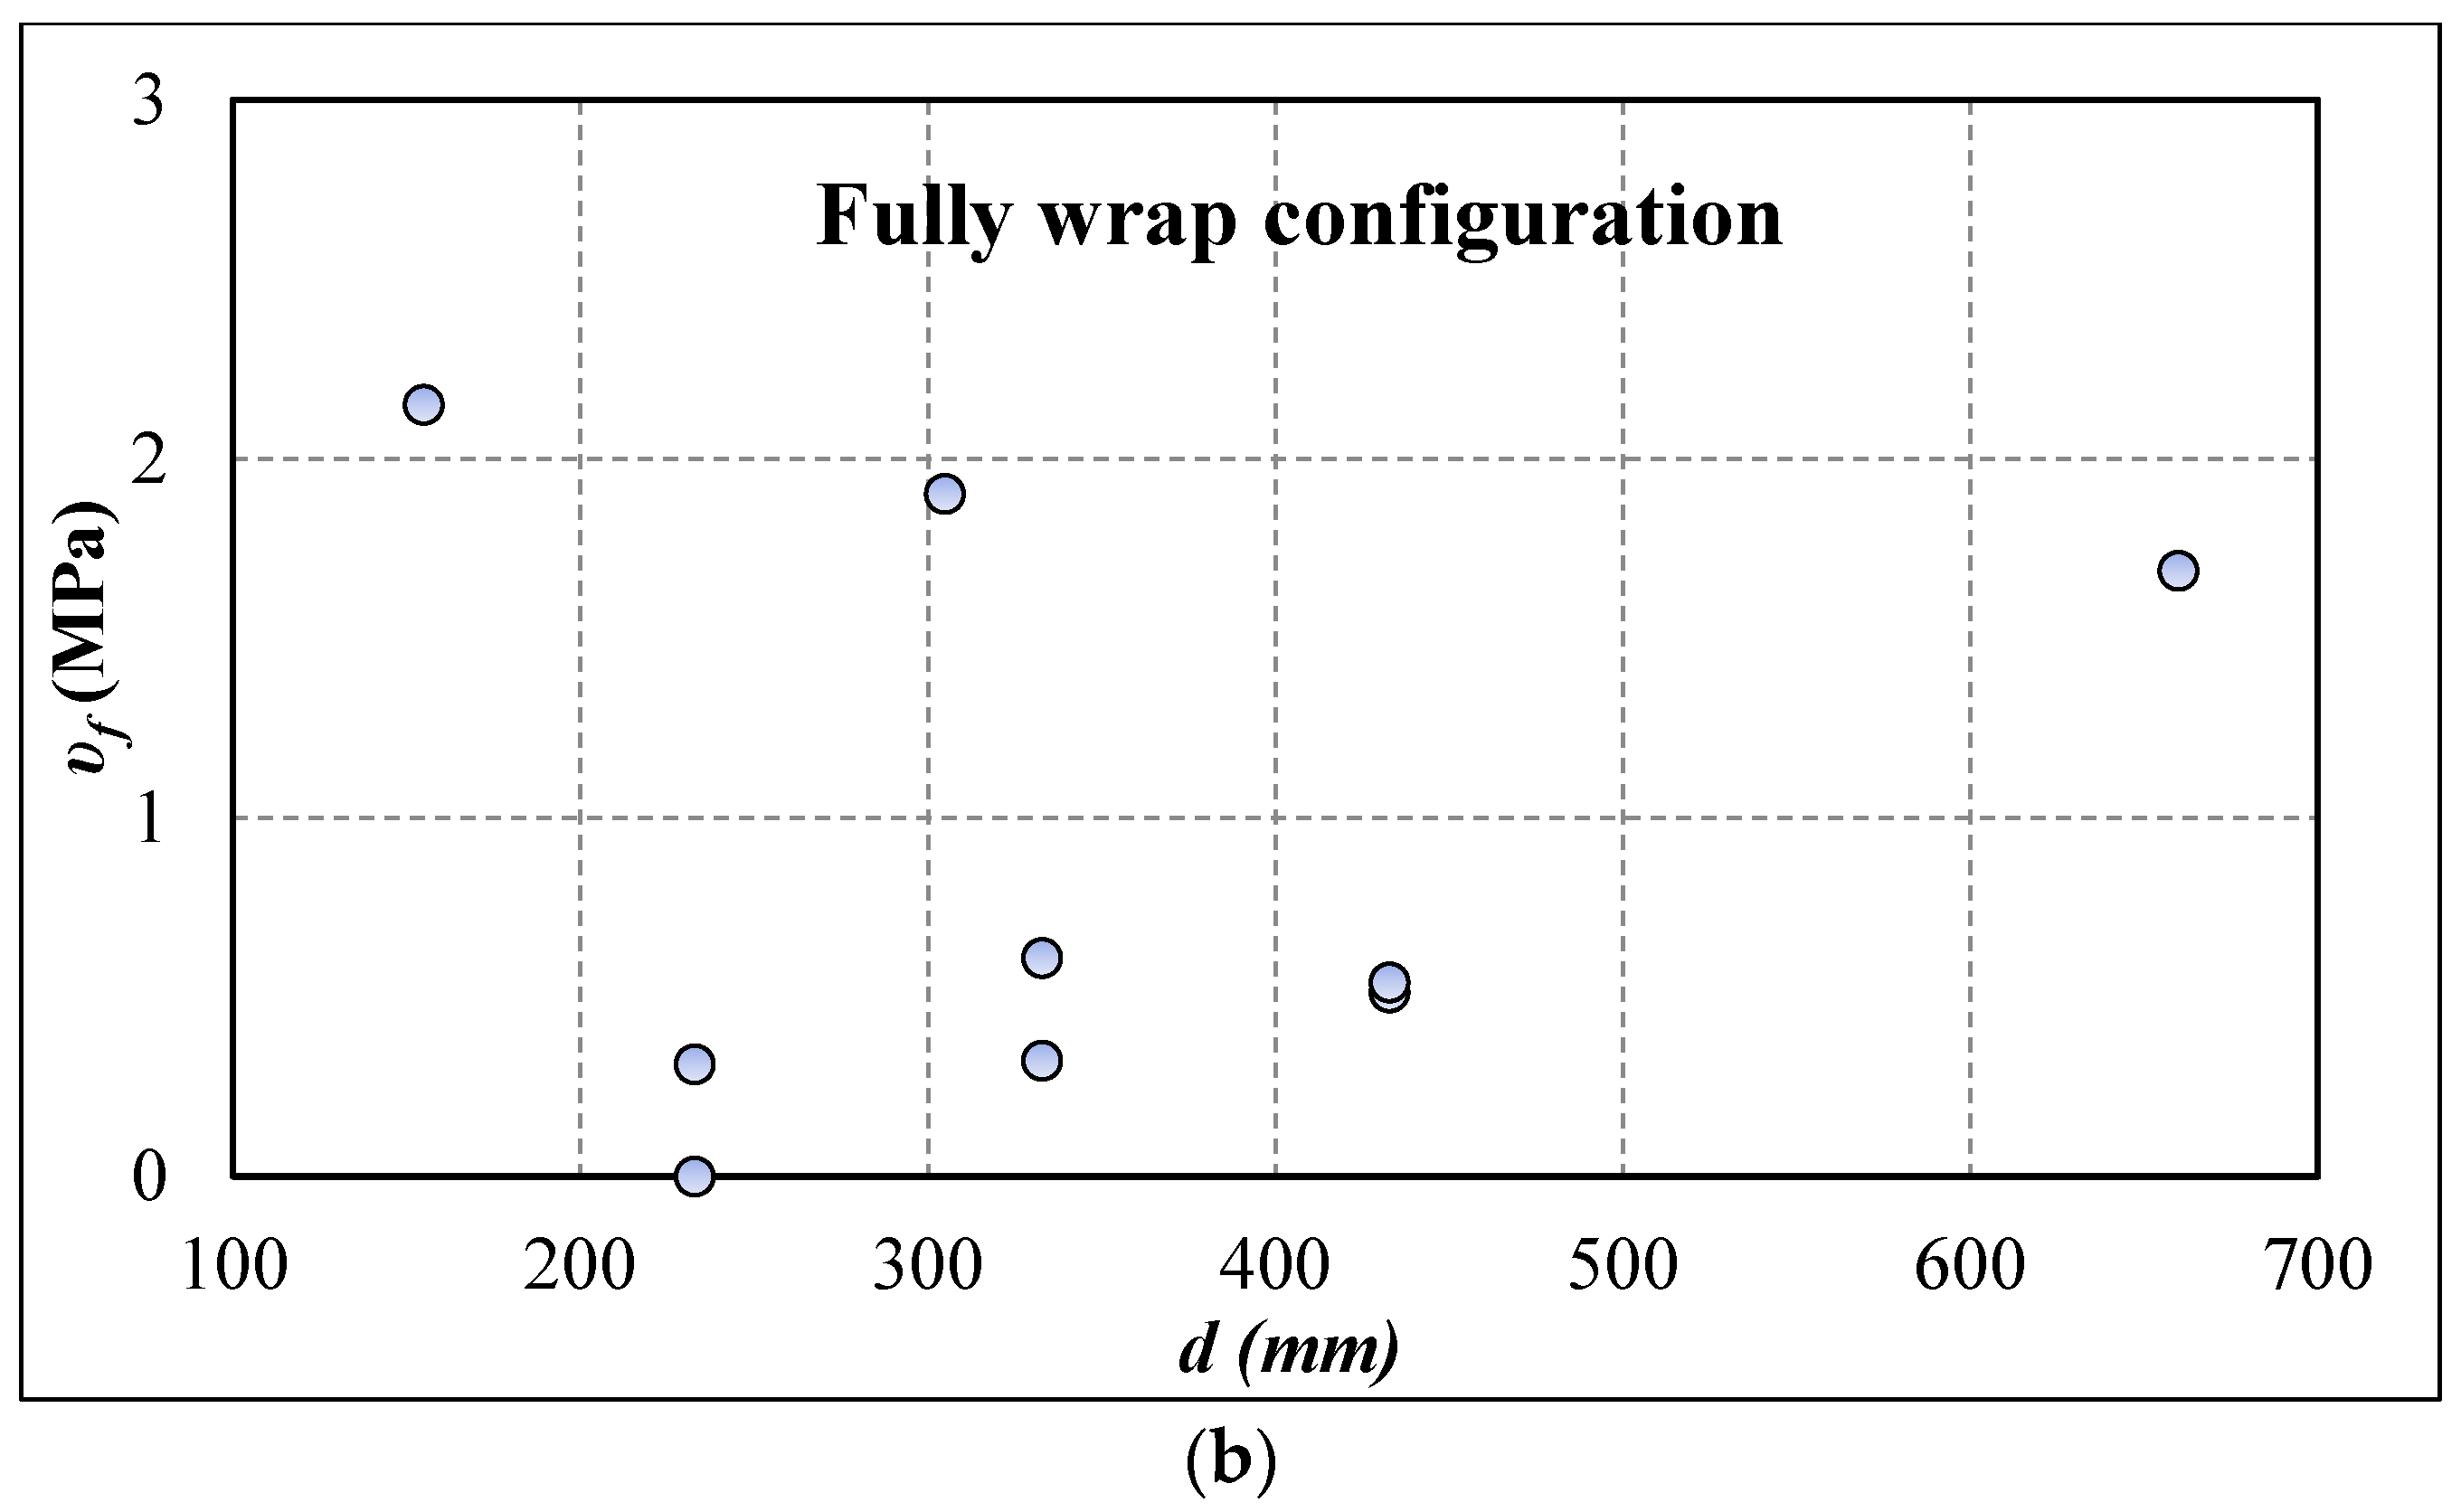
Experimental results on the size effect revealed a presence of an additional size effect related to EB-FRP strengthening that tended to lower the shear strength at failure as specimen size increased.
(3)
The EB-FRP contribution to shear resistance predicted by the models considered in the present research study was overestimated in more than 50% of the specimens, particularly when using the JSCE (2001) code, which overestimated almost all specimens in the database.
(4)
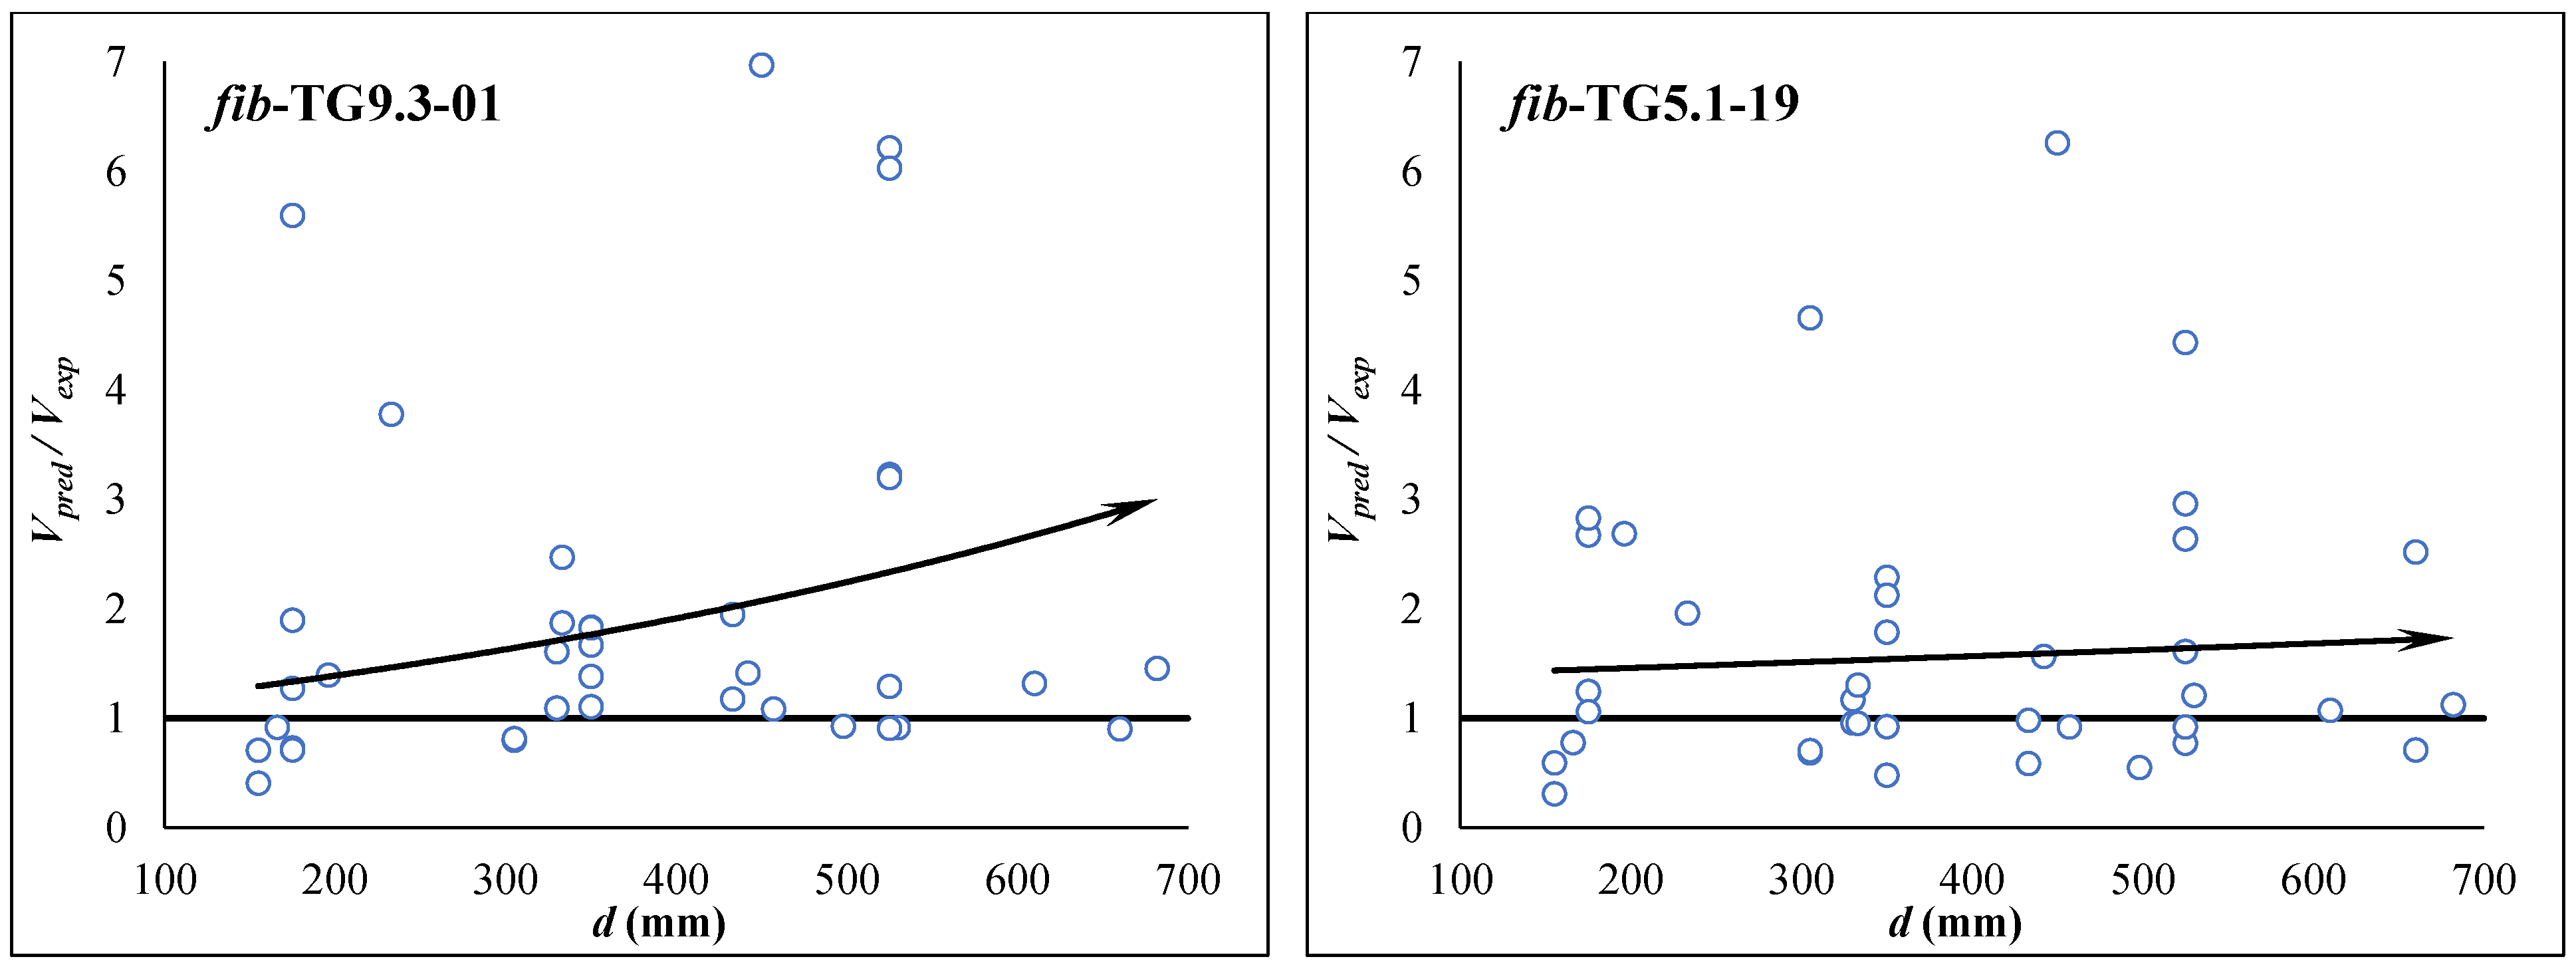
The influence of the size effect was moderate in the fib-TG5.1-19 (2019), ACI-440.2R-17 (2017), and CSA-S6-19 (2019) prediction models and even more so in the CSA-S806-12 (2012) and fib-TG9.3-01 (2001) models. In contrast, it was very significant in the predictions made using the Japanese code (JSCE (2001).
(5)
Compared with the old version of the fib-TG9.3-01 (2001) European code, a clear improvement was observed in the updates in the new version (fib-TG5.1-19 2019) regarding the capture of the influence of the size effect with increasing specimen size.
As mentioned above, many large-scale RC projects have collapsed due to lack of knowledge on the size effect. Strengthening, repairing, and retrofitting existing RC structures with EB-FRP represent a cost-effective solution for deficient structures, especially those designed according to older versions of building and bridge codes. However, the size effect can significantly reduce the shear resistance gain attributed to EB-FRP strengthening of RC beams. Therefore, the prediction models considered in this research should be used with caution. The authors recommend that the structural integrity verification requirement be adopted by all codes and design guidelines. This recommendation specifies that the strengthened structure should at least resist service loads in the case where the EB-FRP is no longer effective. This may be an interim solution until the size effect is appropriately captured by the prediction models.

Author Contributions

Conceptualization, Z.E.A.B. and O.C.; methodology, Z.E.A.B. and O.C.; validation, Z.E.A.B. and O.C.; formal analysis, Z.E.A.B.; instigation, Z.E.A.B.; Ressources, O.C.; writing-original draft preparation, Z.E.A.B.; writing-review and editing, O.C.; supervision, O.C.; project administration, O.C.; funding acquisition, O.C. All authors have read and agreed to the published version of the manuscript.

Funding

O.C. is funded by the National Science and Engineering Research Council (NSERC) of Canada and by the Fonds de Recherche du Québec–Nature & Technologie (FRQ-NT).

Institutional Review Board Statement

Not applicable.

Informed Consent Statement

Not applicable.

Data Availability Statement

The data supporting the findings of this study are available within the article.

Acknowledgments

The financial support of the Natural Sciences and Engineering Research Council of Canada (NSERC) and the Fonds de recherche du Québec—Nature et technologie (FRQNT) through operating grants is gratefully acknowledged. The authors thank Sika-Canada, Inc. (Pointe Claire, Quebec) for contributing to the cost of materials. The efficient collaboration of John Lescelleur (senior technician) and Andrés Barco (technician) at École de technologie supérieure (ÉTS) in conducting the tests is acknowledged.

Conflicts of Interest

The authors declare no conflict of interest.

List of Symbols

AFRPArea of FRP for shear strengthening
bBeam width
dEffective depth of concrete
dFRPEffective shear depth of EB-FRP
EFRPFRP elastic modulus
f c , f c m Concrete compressive strength
fFRPFRP tensile strength
hFRPFRP bond length
LeEffective anchorage length of EB-FRP
SFRPSpacing of FRP strips
SSpacing of steel stirrups
tFRPFRP ply thickness
Vc; Vs; VFRPContribution to shear resistance of concrete, steel stirrups, and EB-FRP
VnTotal nominal shear resistance of the beam
wFRPWidth of FRP strips
αFRPInclination angle of FRP fibre
ε F R P FRP strain
ε F R P u ; ε F R P e FRP ultimate and effective strain
ρ F R P FRP strengthening material ratio
ρ s Transverse steel reinforcement ratio
ρ w Longitudinal steel reinforcement ratio
v n Normalized shear strength at failure
F R P Resistance factor for FRP material

References

  1. Syroka-Korol, E.; Tejchman, J. Experimental investigations of size effect in reinforced concrete beams failing by shear. Eng. Struct. 2014, 58, 63–78. [Google Scholar] [CrossRef]
  2. ACI-446.1R-99. Fracture Mechanics of Concrete: Concepts Models and Determination of Material Properties; American Concrete Institute: Farmington Hills, MI, USA, 1999. [Google Scholar]
  3. Benzeguir, Z.E.A.; El-Saikaly, G.; Chaallal, O. Size Effect of RC T-Beams Strengthened in Shear with Externally Bonded CFRP L-Shaped Laminates. J. Compos. Constr. 2020, 24, 04020031. [Google Scholar] [CrossRef]
  4. Berset, J.-D. Strengthening of Reinforced Concrete Beams for Shear Using FRP Composites. Master’s Thesis, Massachusetts Institute of Technology, Cambridge, MA, USA, 1992. [Google Scholar]
  5. El-Saikaly, G.; Godat, A.; Chaallal, O. New anchorage technique for FRP shear-strengthened RC T-beams using CFRP rope. J. Compos. Constr. 2015, 19, 04014064. [Google Scholar] [CrossRef]
  6. Khalifa, A.; Nanni, A. Improving shear capacity of existing RC T-section beams using CFRP composites. Cem. Concr. Compos. 2000, 22, 165–174. [Google Scholar] [CrossRef]
  7. Mofidi, A.; Chaallal, O. Tests and design provisions for reinforced-concrete beams strengthened in shear using FRP sheets and strips. Int. J. Concr. Struct. Mater. 2014, 8, 117–128. [Google Scholar] [CrossRef] [Green Version]
  8. Mofidi, A.; Thivierge, S.; Chaallal, O.; Shao, Y. Behavior of reinforced concrete beams strengthened in shear using L-shaped CFRP plates: Experimental investigation. J. Compos. Constr. 2014, 18, 04013033. [Google Scholar] [CrossRef]
  9. Triantafillou, T.C. Shear strengthening of reinforced concrete beams using epoxy-bonded FRP composites. ACI Struct. J. 1998, 95, 107–115. [Google Scholar]
  10. Bae, S.-W.; Tann, B.D.; Belarbi, A. Size effect of reinforced concrete beams strengthened in shear with externally bonded CFRP sheets. In Proceedings of the 6 th International Conference on FRP Composites in Civil Engineering (CICE 2012), Roma, Italy, 13–15 June 2012; pp. 1–8. [Google Scholar]
  11. Benzeguir, Z.E.A.; El-Saikaly, G.; Chaallal, O. Size Effect in RC T-Beams Strengthened in Shear with Externally Bonded CFRP Sheets: Experimental Study. J. Compos. Constr. 2019, 23, 4019048. [Google Scholar] [CrossRef]
  12. Deniaud, C.; Cheng, J.R. Review of shear design methods for reinforced concrete beams strengthened with fibre reinforced polymer sheets. Can. J. Civ. Eng. 2001, 28, 271–281. [Google Scholar] [CrossRef]
  13. Foster, R.M.; Brindley, M.; Lees, J.M.; Ibell, T.J.; Morley, C.T.; Darby, A.P.; Evernden, M.C. Experimental investigation of reinforced concrete T-beams strengthened in shear with externally bonded CFRP sheets. J. Compos. Constr. 2017, 21, 4016086. [Google Scholar] [CrossRef] [Green Version]
  14. Leung, C.K.; Chen, Z.; Lee, S.; Ng, M.; Xu, M.; Tang, J. Effect of size on the failure of geometrically similar concrete beams strengthened in shear with FRP strips. J. Compos. Constr. 2007, 11, 487–496. [Google Scholar] [CrossRef]
  15. Nguyen-Minh, L.; Rovňák, M. Size effect in uncracked and pre-cracked reinforced concrete beams shear-strengthened with composite jackets. Compos. Part B Eng. 2015, 78, 361–376. [Google Scholar] [CrossRef]
  16. Qu, Z.; Lu, X.; Ye, L. Size effect of shear contribution of externally bonded FRP U-jackets for RC beams. In Proceedings of the International Symposium on Bond Behaviour of FRP in Structures (BBFS 2005), Hong Kong, China, 7–9 December 2005; pp. 371–380. [Google Scholar]
  17. Szymon, C.; Matteo, D.B.; Maurizio, G.; Emanuele, Z. Size Effect in FRP RC Beams with and without Shear Reinforcement. ACI Symp. Publ. 2018, 327, 27.1–27.20. [Google Scholar]
  18. Chaallal, O.; Shahawy, M.; Hassan, M. Performance of reinforced concrete T-girders strengthened in shear with carbon fiber-reinforced polymer fabric. ACI Struct. J. 2002, 99, 335–343. [Google Scholar]
  19. Pellegrino, C.; Modena, C. Fiber reinforced polymer shear strengthening of reinforced concrete beams with transverse steel reinforcement. J. Compos. Constr. 2002, 6, 104–111. [Google Scholar] [CrossRef]
  20. ACI-440.2R-17. Guide for the Design and Construction of Externally Bonded FRP Systems for Strengthening Concrete Structures; American Concrete Institute: Farmington Hills, MI, USA, 2017. [Google Scholar]
  21. CSA-S6-19. Canadian Highway Bridge Design Code. In Canadian Standards Association; Canadian Standards Association: Mississauga, ON, Canada, 2019. [Google Scholar]
  22. CSA-S806-12. Règles de calcul et de construction des structures de bâtiment contenant des polymères renforcés de fibres. In Canadian Standards Association; Canadian Standards Association: Mississauga, ON, Canada, 2012. [Google Scholar]
  23. fib-TG5.1-19. Externally applied FRP reinforcement for concrete structures. In Fédération Internationale du Béton; Fédération Internationale du Béton: Lausane, Switzerland, 2019.
  24. fib-TG9.3-01. Externally bonded FRP reinforcement for RC structures. In Fédération Internationale du Béton; Fédération Internationale du Béton: Lausane, Switzerland, 2001.
  25. JSCE Recommendations for upgrading of concrete structures with use of continuous fiber sheets. In Japan Society of Civil Engineers; Japan Society of Civil Engineers: Tokyo, Japan, 2001.
  26. Bažant, Z.P. Size effect. Int. J. Solids Struct. 2000, 37, 69–80. [Google Scholar] [CrossRef]
  27. Bažant, Z.P.; Rajapakse, Y. Fracture Scaling; Springer Science & Business Media: Berlin, Germany, 2012. [Google Scholar]
  28. Kani, G.N.J. How safe are our large reinforced concrete beams? Proc. ACI J. 1967, 64, 128–141. [Google Scholar]
  29. Bažant, Z.P.; Ozbolt, J.; Eligehausen, R. Fracture size effect: Review of evidence for concrete structures. J. Struct. Eng. 1994, 120, 2377–2398. [Google Scholar] [CrossRef] [Green Version]
  30. Bažant, Z.P.; Planas, J. Fracture and Size Effect in Concrete and Other Quasibrittle Materials; CRC Press: Boca Raton, FL, USA, 1998. [Google Scholar]
  31. Bousselham, A. Comportement des Poutres en Béton Armé Renforcées en Cisaillement à L’aide de Matériaux Composites Avancés. Ph.D. Thesis, École de Technologie Supérieure, Montréal, QC, Canada, 2005. [Google Scholar]
  32. ACI-318-19. Building Code Requirements for Structural Concrete and Commentary on Building Code Requirements for Structural Concrete; American Concrete Institute: Farmington Hills, MI, USA, 2019. [Google Scholar]
  33. BS-8110. Code of Practice for Design and Construction. In British Standards Institution; British Standards Institution: London, UK, 1997. [Google Scholar]
  34. CSA-A23. 3-14. Calcul des ouvrages en béton. In Canadian Standards Association; Canadian Standards Association: Mississauga, ON, Canada, 2014. [Google Scholar]
  35. Eurocode2. Calcul des Structures en Béton: Partie 1-1. In Comité Européen de Normalisation; Comité Européen de Normalisation: Brussels, Belgium, 2004. [Google Scholar]
  36. Bousselham, A.; Chaallal, O. Experimental investigations on the influence of size on the performance of RC T-beams retrofitted in shear with CFRP fabrics. Eng. Struct. 2013, 56, 1070–1079. [Google Scholar] [CrossRef]
  37. Li, W.; Li, J.; Ren, X.; Leung, C.K.; Xing, F. Coupling effect of concrete strength and bonding length on bond behaviors of fiber reinforced polymer–concrete interface. J. Reinf. Plast. Compos. 2015, 34, 421–432. [Google Scholar] [CrossRef]
  38. Lu, X.; Teng, J.; Ye, L.; Jiang, J. Bond–slip models for FRP sheets/plates bonded to concrete. Eng. Struct. 2005, 27, 920–937. [Google Scholar] [CrossRef]
  39. Benzeguir, Z.E.A.; El-Saikaly, G.; Chaallal, O. Size effect in shear of conventional and shear-strengthened RC beams with EB-FRP: State of knowledge and research needs. Glob. J. Adv. Eng. Technol. Sci. 2017, 4, 1–23. [Google Scholar]
  40. EMPA. Shear Strengthening with Prefabricated L-Shaped Plates: Test Beams S1 to S6; EMPA, Eidgenössische Materialprüfungs-und Forschungsanstalt: Dübendorf, Switzerland, 2002. [Google Scholar]
  41. Chalioris, C.E.; Zapris, A.G.; Karayannis, C.G. U-jacketing applications of fiber-reinforced polymers in reinforced concrete T-beams against shear—Tests and design. Fibers 2020, 8, 13. [Google Scholar] [CrossRef] [Green Version]
  42. Li, W.; Hu, C.; Pan, Z.; Peng, W.; Yang, Y.; Xing, F. A proposed strengthening model considering interaction of concrete-stirrup-FRP system for RC beams shear-strengthened with EB-FRP sheets. J. Reinf. Plast. Compos. 2018, 37, 685–700. [Google Scholar] [CrossRef]
Figure 1. Shear strength with increasing size. Adapted from [30].
Civileng 02 00047 g001
Figure 2. Reducing terms evolution according to increasing beam size.
Civileng 02 00047 g002aCivileng 02 00047 g002b
Figure 3. Details of tested beams: (a) cross sections of geometrically similar T-beams (mm) and (b) typical elevation.
Civileng 02 00047 g003
Figure 4. Cracks pattern: (a) specimens without stirrups L.S0.1L and (b) specimens with stirrups L.S1.Str.
Civileng 02 00047 g004
Figure 5. Influence of beam size on the normalized shear strength.
Civileng 02 00047 g005
Figure 6. Shear strength distributions along the EB-FRP: (a) small size hFRP < Le and (b) large size hFRP > Le.
Civileng 02 00047 g006
Figure 7. Size effect influences of shear-strengthened RC beams: (a) U-wrap configuration; (b) full-wrap configuration.
Civileng 02 00047 g007aCivileng 02 00047 g007b
Figure 8. Comparison between predicted and experimental values.
Civileng 02 00047 g008
Figure 9. Influence of size effect on V pred/Vexp ratio.
Civileng 02 00047 g009aCivileng 02 00047 g009b
Table 1. Size effect reducing terms from prediction models.
CSA-A23.3-14 (2014) [18]EC2-2004 [24]BS-8110 (1997) [15]JSCE (2001) [28]ACI-318-19 (2019) [1]
Reducing terms 230 / ( 1000 + d v ) 1 + 200 / d ( 0.4 d ) 1 / 4 d 1 / 4 2 1 + 0.004 . d
Table 2. Experimental program matrix.
GroupSeriesSpecimen Size d (mm)
Small (S)
175
Medium (M)
350
Large (L)
525
CFRP fabric sheetsWithout stirrupsS.S0.1LM.S0.1LL.S0.1L
S.S0.2LM.S0.2LL.S0.2L
With stirrupsS.S1.1LM.S1.1LL.S1.1L
S.S1.2LM.S1.2LL.S1.2L
CFRP L-shape laminatesWithout anchorage-M.S1.StrL.S1. Str
With anchorage-M.S1.Str-AncL.S1. Str-Anc
Table 3. Experimental program and test results.
Specimend
(mm)
b
(mm)
fc
(MPa)
ρw
(%)
ρs
(%)
Strengthening
Configuration
LayerswFRP
(mm)
tFRP
(mm)
ρFRP
(%)
EFRP
(MPa)
εFRPu
%
VFRP
(kN)
Vr
(kN)
νn
(MPa)
Loss
%
Group 1—Shear-Strengthened with CFRP Fabric
S.S0.1L17595303.60ContU-wrap10.0660.14231,0001.423620.68
M.S0.1L350152303.70ContU-wrap10.1070.14231,0001.4391250.4337
L.S0.1L525275303.60ContU-wrap10.1670.12231,0001.41513340.4238
S.S0.2L17595303.60ContU-wrap20.1320.28231,0001.432710.78
M.S0.2L350152303.70ContU-wrap20.2140.28231,0001.4401270.4444
L.S0.2L525275303.60ContU-wrap20.3340.24231,0001.41443260.4147
S.S1.1L17595303.60.37ContU-wrap10.0660.14231,0001.43981.08
M.S1.1L350152303.70.38ContU-wrap10.1070.14231,0001.402600.8917
L.S1.1L525275303.60.41ContU-wrap10.1670.12231,0001.405900.7531
S.S1.2L17595303.60.37ContU-wrap20.1320.28231,0001.4121071.18
M.S1.2L350152303.70.38ContU-wrap20.2140.28231,0001.442720.9321
L.S1.2L525275303.60.41ContU-wrap20.3340.24231,0001.4306290.8032
Group 2—Shear-Strengthened with CFRP L-Shape Laminates
M.S1.Str350152303.70.38LaminateU-wrap14020.690,0001.3372750.94
L.S1.Str525275303.60.41LaminateU-wrap14020.690,0001.3306300.8016
M.S1. Str-Anc350152303.70.38LaminateU + A14020.690,0001.3983361.15
L.S1. Str-Anc525275303.60.41LaminateU + A14020.690,0001.3906900.8724
Note: Cont = continuous CFRP sheet configuration, Laminate = precured CFRP laminate, U + A = U-wrap configuration with anchorage system in compression zone (flange).
Table 4. Properties of the CFRP material used.
PropertyValue
CFRP Sheet for Group 1
Tensile strength, fFRPu (MPa)3650
Modulus of elasticity, EFRP (GPa)231
Elongation at break, εFRPu (%)1.4
CFRP L-shape Laminates for Group 2
Tensile strength, fFRPu (MPa)1350
Modulus of elasticity, EFRP (GPa)90
Elongation at break, εFRPu (%)1.3
Table 5. Status of the consideration of some shear strength influencing parameters.
StudiesYearFRP PropertiesAnchorageTransverse Steel
FabricLaminateRigidity
Deniaud [12]2001
Qu [16]2005
Leung [14]2007
Bae [10]2012
Nguyen-Minh [15]2015
Foster [13]2017
Szymon [17]2018
Benzeguir [3,11]2019 and 2020
Table 6. Details of shear-strengthened specimens from literature.
SpecimenSectiond
(mm)
b
(mm)
fc
(MPa)
ρw
(%)
ρs
(%)
Strengthening
Configuration
LayerswFRP
(mm)
tFRP
(mm)
ρFRP
(%)
EFRP
(MPa)
εFRP
%
VFRP
(kN)
Vr
(kN)
νn
(MPa)
Loss
% *
Deniaud (2001) [12]
T4S4-G90T33014029.02.300.20ContU-wrap11.802.6017,7001.5492060.83
T6S4-G90T53014044.02.700.20ContU-wrap11.802.6017,7001.51102970.6027
Qu et al. (2005) [16]
U4Rect16610051.24.100.00StripsU-wrap1300.110.13235,0001.5221010.85
U5Rect33020051.24.500.00StripsU-wrap2600.220.13235,0001.5504050.86−1
U6Rect49830051.04.200.00StripsU-wrap3900.330.13235,0001.519610090.95−11
Leung et al. (2007) [14]
SB-U1Rect1557527.45.400.28StripsU-wrap1200.110.10235,0001.824651.07
MB-U1Rect30515027.44.400.28StripsU-wrap2400.220.10235,0001.851550.6539
LB-U2Rect66030027.44.100.28StripsU-wrap4800.440.10235,0001.8225600.5449
SB-F1Rect1557527.45.400.28StripsF-wrap1200.110.10235,0001.825661.08
MB-F1Rect30515027.44.400.28StripsF-wrap2400.220.10235,0001.8872360.999
LB-F1Rect66030027.44.100.28StripsF-wrap4800.440.10235,0001.83348720.8422
Bae et al. (2012) [10]
S-StrRect30520325.20.160.00StripsU-wrap1760.1650.05228,0001.5471130.36
M-StrRect45730532.00.160.00StripsU-wrap11520.1650.05228,0001.5872460.3114
L-StrRect61040632.00.180.00StripsU-wrap12520.1650.05228,0001.51273710.2627
Nguyen-Minh and Rovňák (2015) [15]
G1-GFRP-1BRect17510025.01.800.19ContU-wrap11.32.6026,1002.218560.64
G1-GFRP-2ARect35020025.01.800.19ContU-wrap22.62.6026,1002.2552250.640
G1-GFRP-3ARect52530025.01.800.19ContU-wrap33.92.6026,1002.2644590.589
G2-GFRP-1ARect19610023.52.400.16ContU-wrap11.32.6026,1002.218630.66
G2-GFRP-2ARect44220023.52.400.16ContU-wrap22.62.6026,1002.2803050.71−7
G2-GFRP-3ARect68230023.52.400.16ContU-wrap33.92.6026,1002.21806500.661
Foster et al. (2017) [13]
SC0.7UT30015062.54.200.10ContU-wrap10.50.710,5001.001660.47
MC0.9UT45022561.72.900.10ContU-wrap11.00.995,8001.002990.3819
LB0.7UT60030060.32.700.10ContU-wrap11.00.7105,4001.004580.3330
SC1.3UT30015063.24.200.10ContU-wrap11.01.3105,4001.001530.43
MB1.3UT45022564.12.900.10ContU-wrap11.51.395,8001.003060.3812
LB1.3UT60030062.02.700.10ContU-wrap12.01.395,8001.004370.3128
MB1.3UAT45022561.12.900.10ContU + A11.51.395,8001.0483700.47
LB1.3UAT60030054.12.700.10ContU + A12.01.395,8001.0395110.3917
Cholostiakow Szymon et al. (2018) [17]
GB62Rect23315052.700.820.00StripsF-wrap10.1265,0002.610.948.20.19
GB64Rect33315047.540.860.00StripsF-wrap10.1265,0002.630.461.70.186
GB60Rect43315038.400.880.00StripsF-wrap10.1065,0002.633.377.20.19−1
GB63Rect23315050.910.820.00StripsF-wrap10.04241,0001.7054.20.22
GB65Rect33315047.540.860.00StripsF-wrap10.04241,0001.716.163.40.1815
GB61Rect43315038.400.880.00StripsF-wrap10.03241,0001.735.185.40.212
Note: T = T-beams, Rect = rectangular, Cont = continue FRP sheet, Strips = spaced sheet bands, F-wrap = full-wrap, U + A = U-wrap configuration with anchorage system in compression zone, * = a negative number in this column means that there was no loss in shear strength; rather, there was a gain.
Table 7. Comparison of experimental results versus prediction models of codes and guidelines.
SpecimensVexpS6-19Vpred/VexpS806-12Vpred/VexpAC-I440Vpred/VexpJSCE 2001Vpred/Vexpfib 2001Vpred/Vexpfib 2019Vpred/Vexp
Deniaud (2001) [12]
T4S4-G904943.70.956.11.139.40.8163.63.353.81.147.11.0
T6S4-G90110107.61.0194.51.896.90.9319.02.9100.90.9133.21.2
Qu et al. (2005) [16]
U42220.80.931.41.418.70.954.62.520.30.917.10.8
U55082.61.7125.02.574.41.5217.14.380.51.658.61.2
U6196187.01.0240.91.2169.00.9491.42.5182.00.9108.10.6
Leung et al. (2007) [14]
SB-U1247.90.310.10.47.10.326.11.19.80.47.50.3
MB-U1532.36.541.58.329.15.8102.620.538.67.723.34.7
LB-U222105.64.8135.66.295.14.3444.220.2167.07.655.52.5
SB-F12510.70.420.60.89.60.426.11.017.70.714.90.6
MB-F18742.00.580.90.937.80.4102.61.269.80.859.60.7
LB-F1334181.90.5350.31.0163.80.5444.21.3302.10.9238.40.7
Bae et al. (2012) [10]
S-Str4725.60.532.90.723.10.580.21.738.40.833.30.7
M-Str8768.50.893.61.161.70.7180.42.194.61.180.40.9
L-Str127121.41.0171.81.4109.30.9319.52.5167.81.3136.71.1
Nguyen-Minh and Rovňák (2015) [15]
G1-GFRP-1B1833.91.943.52.430.51.791.05.123.01.348.22.7
G1-GFRP-2A551232.2157.92.9110.72.03646.691.91.71262.3
G1-GFRP-3A64232.43.6298.44.7209.23.3819.012.8206.73.2189.73.0
G2-GFRP-1A1838.52.149.42.734.71.9101.95.725.11.448.42.7
G2-GFRP-2A80153.11.9196.62.5137.91.7459.75.7113.41.4125.41.6
G2-GFRP-3A180294.01.6377.62.1264.81.51063.95.9262.41.5202.81.1
Foster et al. (2017) [13]
SC0.7U0103.0166.892.8205.884.491.1
MC0.9U0279.8359.3251.9617.3205.7195.0
LB0.7U0393.6505.4354.4823.1333.2306.1
SC1.3U0189.0242.7170.2411.5115.0100.4
MB1.3U0347.5446.1312.9926.0249.4212.0
LB1.3U0525.8675.1473.41646.2438.0350.7
MB1.3UA48336.57.0676.214.1303.06.3926.019.3334.87.0300.66.3
LB1.3UA39480.112.31202.230.8432.311.11623.441.6580.914.9534.313.7
Cholostiakow Szymon et al. (2018) [27]
GB6210.910.91.021.01.99.80.949.64.641.23.821.42.0
GB6430.415.30.529.51.013.80.569.72.357.01.929.11.0
GB6033.317.50.533.81.015.80.578.62.465.02.032.71.0
GB63011.822.710.635.228.315.2
GB6516.116.81.032.42.015.20.950.33.139.92.521.01.3
GB6135.116.80.532.50.915.20.450.41.441.31.220.70.6
Benzeguir et al. (2019) [11]
S.S0.1L238.70.411.20.57.80.348.22.116.80.728.71.2
M.S0.1L3954.51.476.32.049.01.3155.64.054.11.469.81.8
L.S0.1L151128.50.9163.81.1114.90.8385.02.5137.50.9116.70.8
S.S0.2L3222.00.728.20.919.80.668.12.122.80.734.01.1
M.S0.2L4089.12.2114.42.980.22.0219.05.573.41.885.12.1
L.S0.2L144179.61.2230.61.6161.71.1562.03.9186.51.3133.10.9
S.S1.1L38.72.911.23.77.82.648.216.116.85.628.79.6
M.S1.1L054.576.349.0155.654.169.8
L.S1.1L0128.5163.8114.9385.0137.5116.7
S.S1.2L1222.01.828.22.419.81.668.15.722.81.934.02.8
M.S1.2L489.122.3114.428.680.220.0219.054.873.418.385.121.3
L.S1.2L30179.66.0230.67.7161.75.4562.018.7186.56.2133.14.4
Benzeguir et al. (2020) [3]
M.S1.Str3739.01.150.11.435.10.9208.55.667.71.817.90.5
L.S1.Str30106.53.6136.74.695.93.2556.518.6181.06.048.41.6
M.S1.Str.Anc9839.00.4145.51.535.10.4208.52.1108.81.190.80.9
L.S1.Str.Anc90106.51.2385.04.395.91.1556.56.2288.43.2237.82.6
Note: – = results excluded as not representative since no gain due to FRP (Vexp = 0).
Publisher’s Note: MDPI stays neutral with regard to jurisdictional claims in published maps and institutional affiliations.

