
Numerical Investigations on Non-Rectangular Anchor Groups under Shear Loads Applied Perpendicular or Parallel to an Edge


Abstract
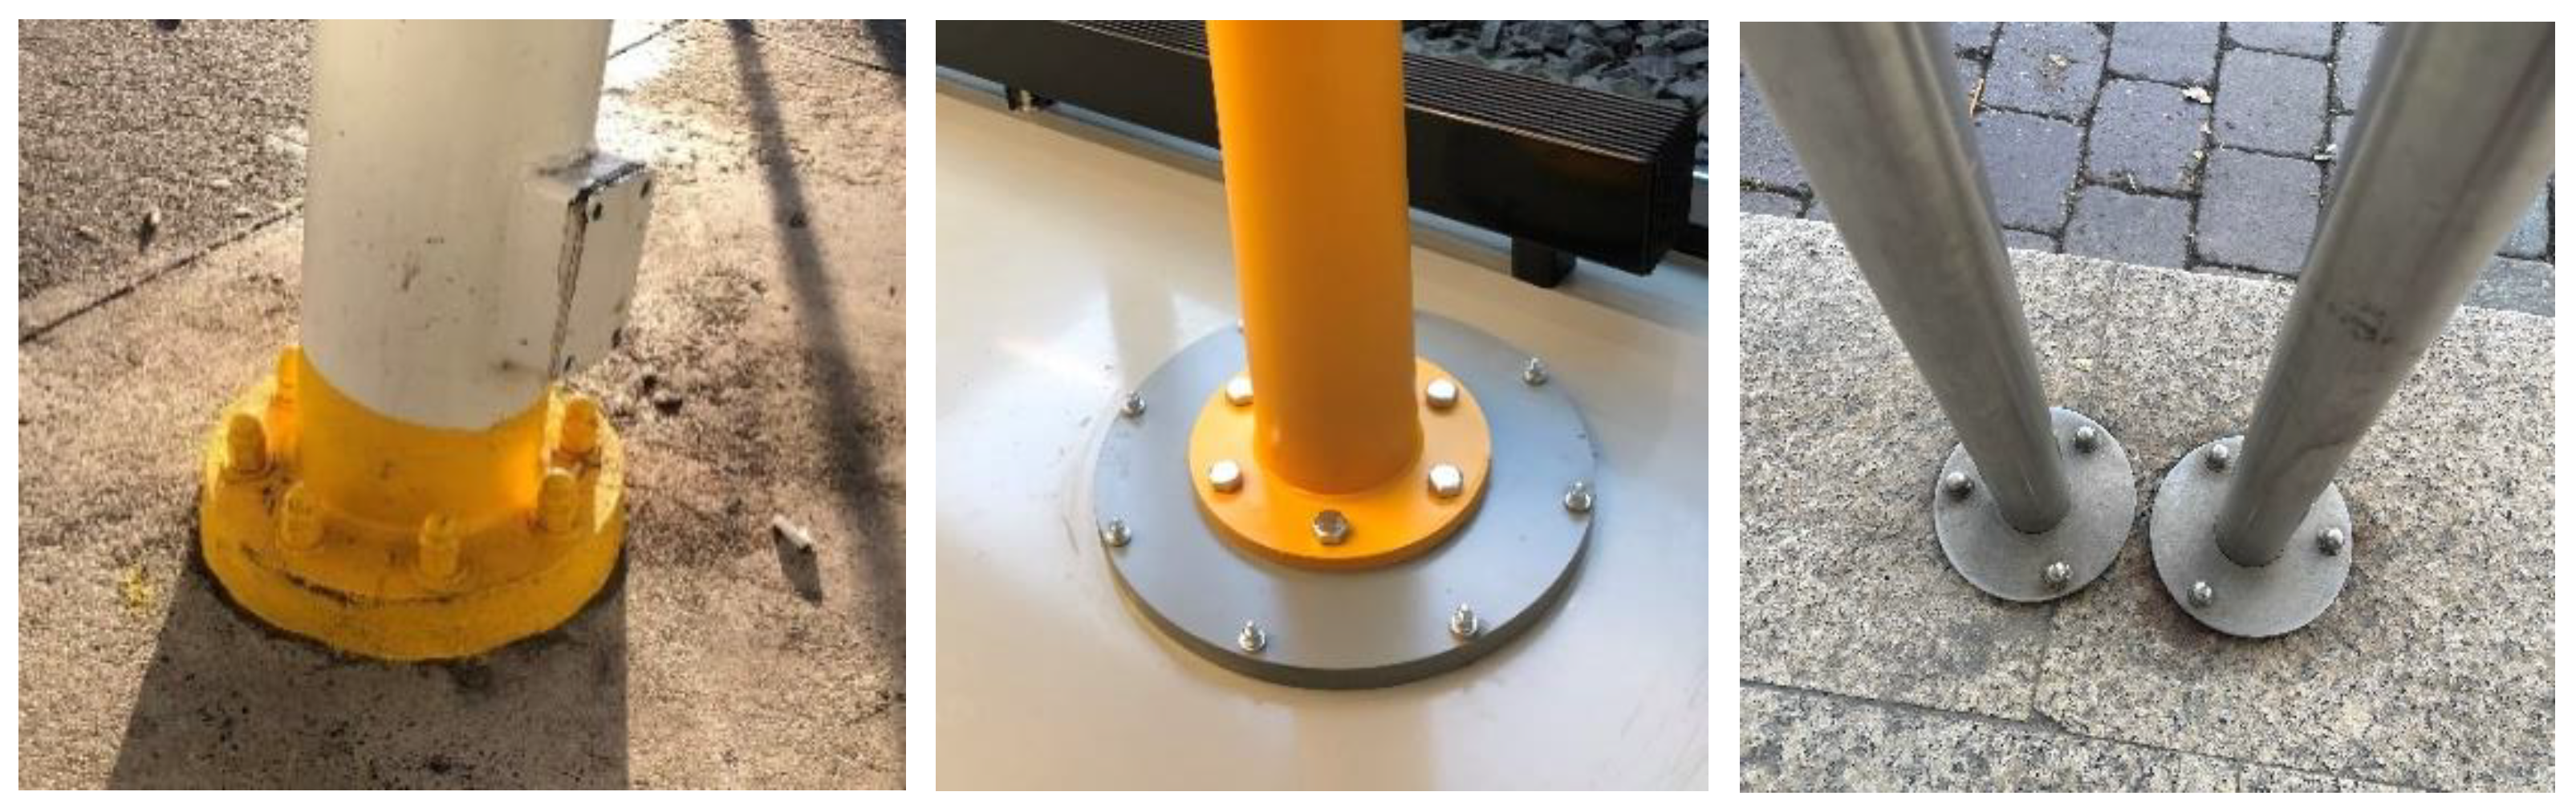
:1. Introduction
2. Numerical Investigation
2.1. Description of Cases Analyzed
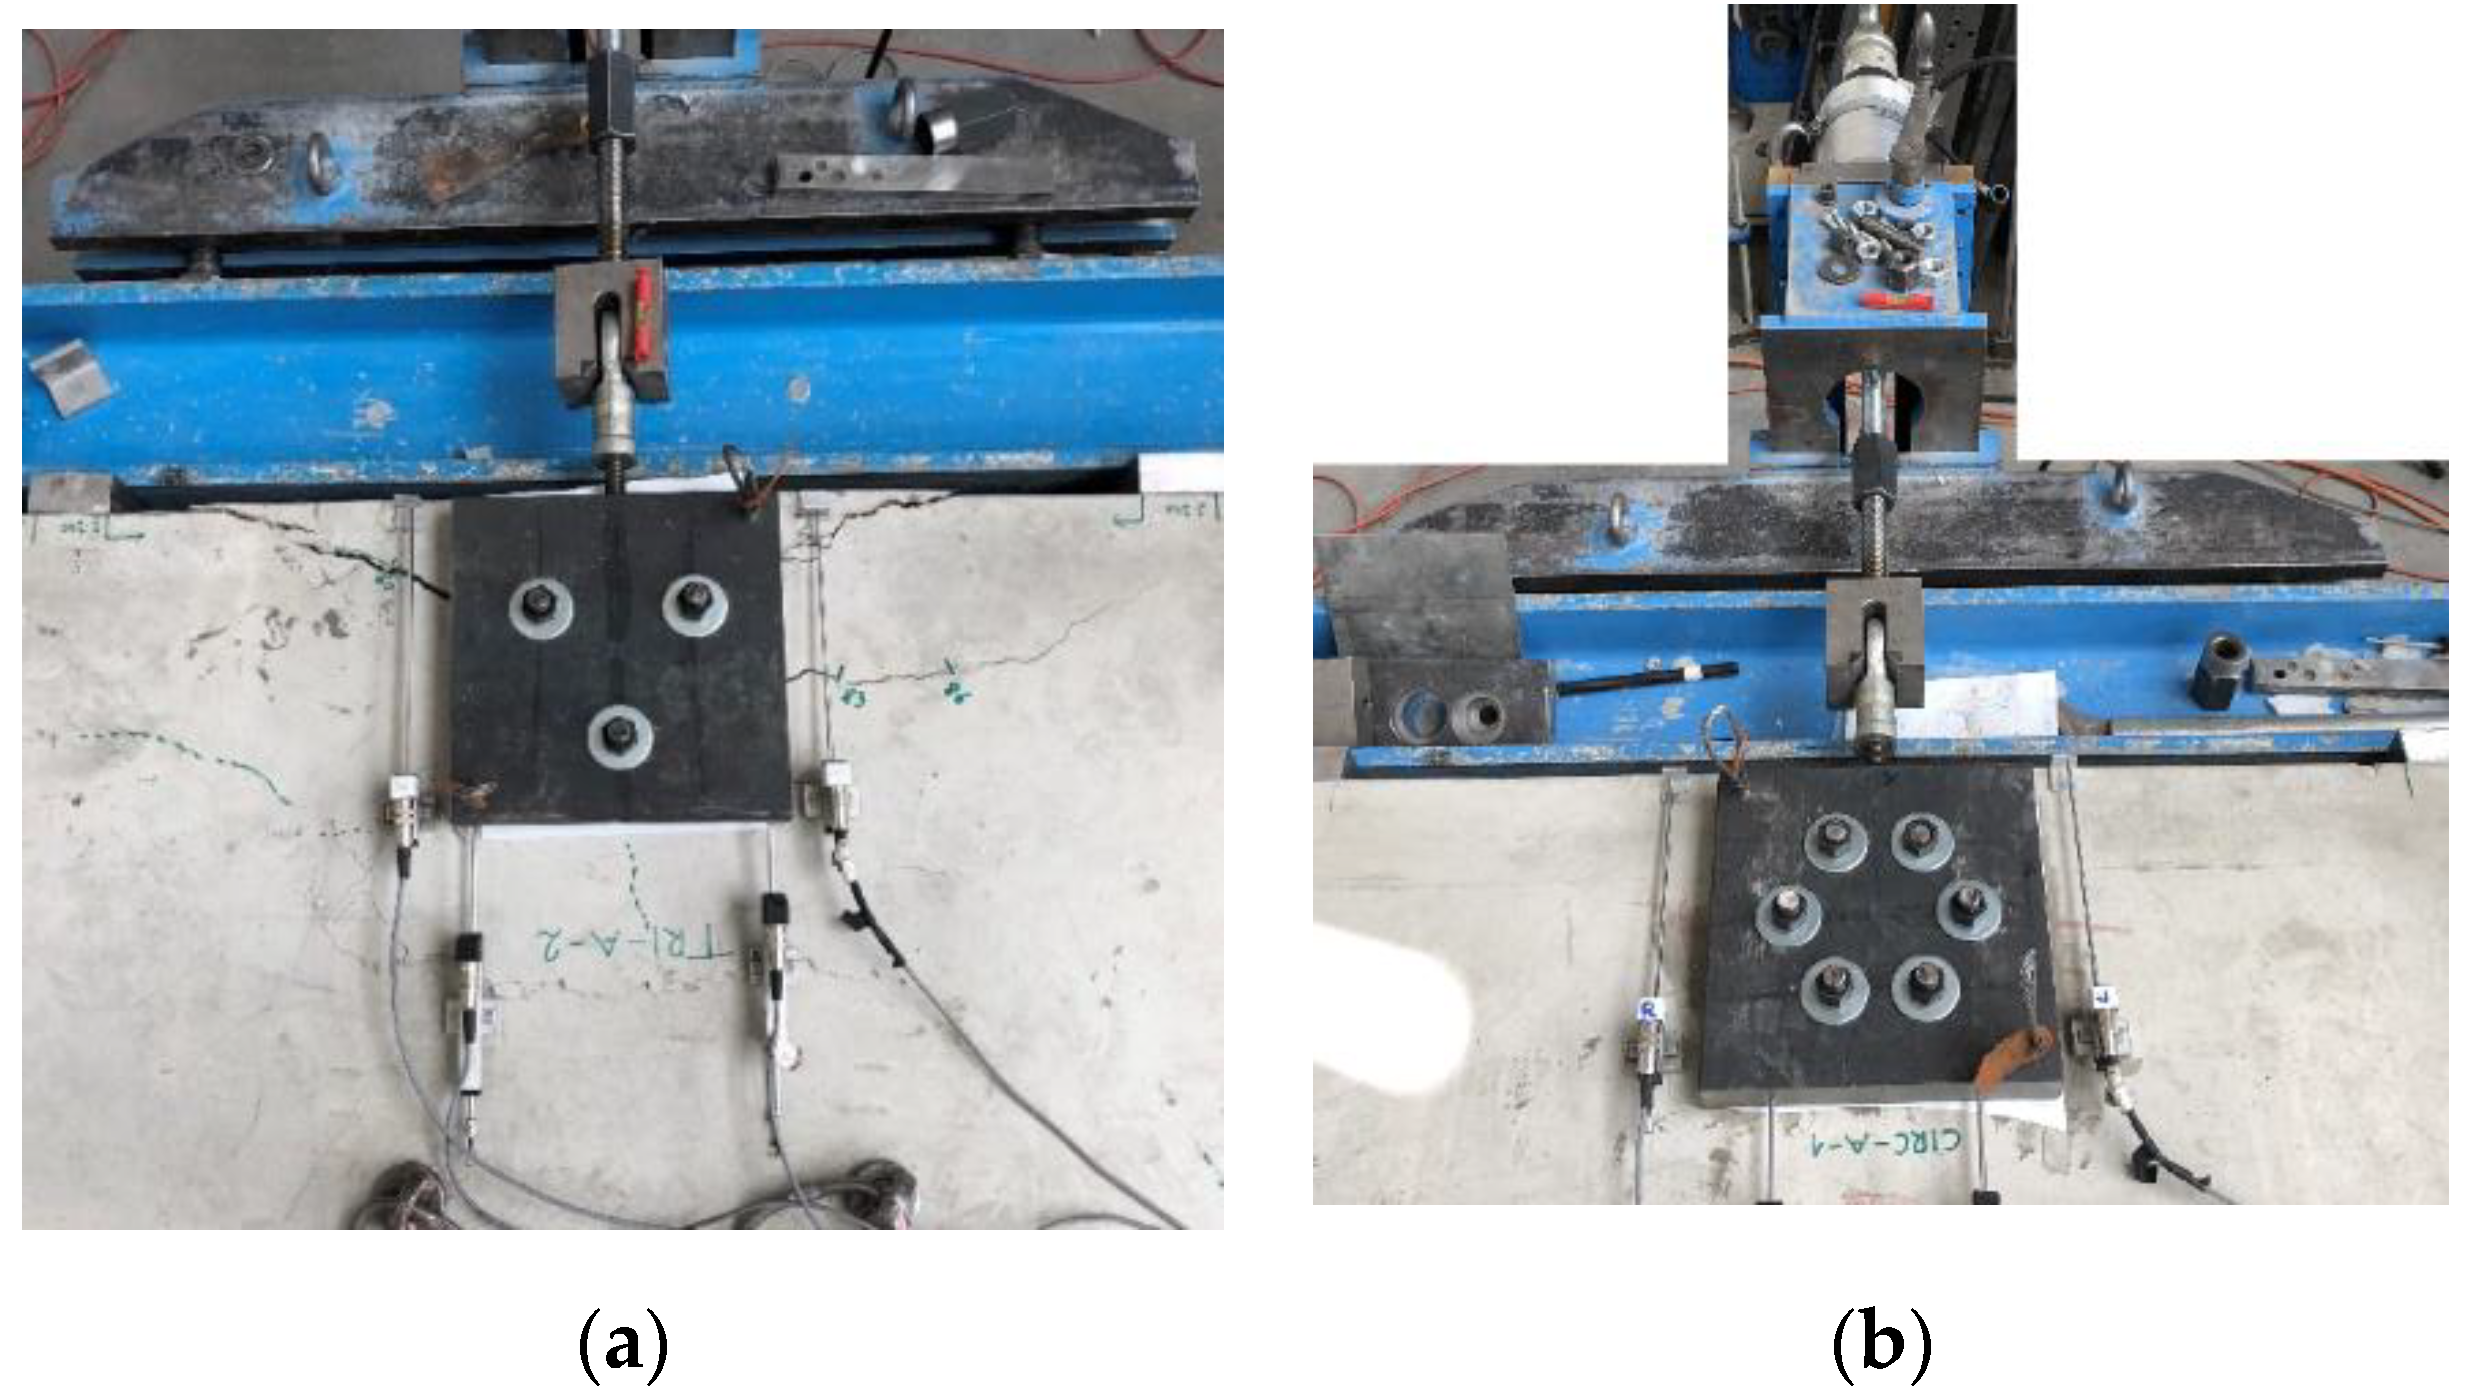
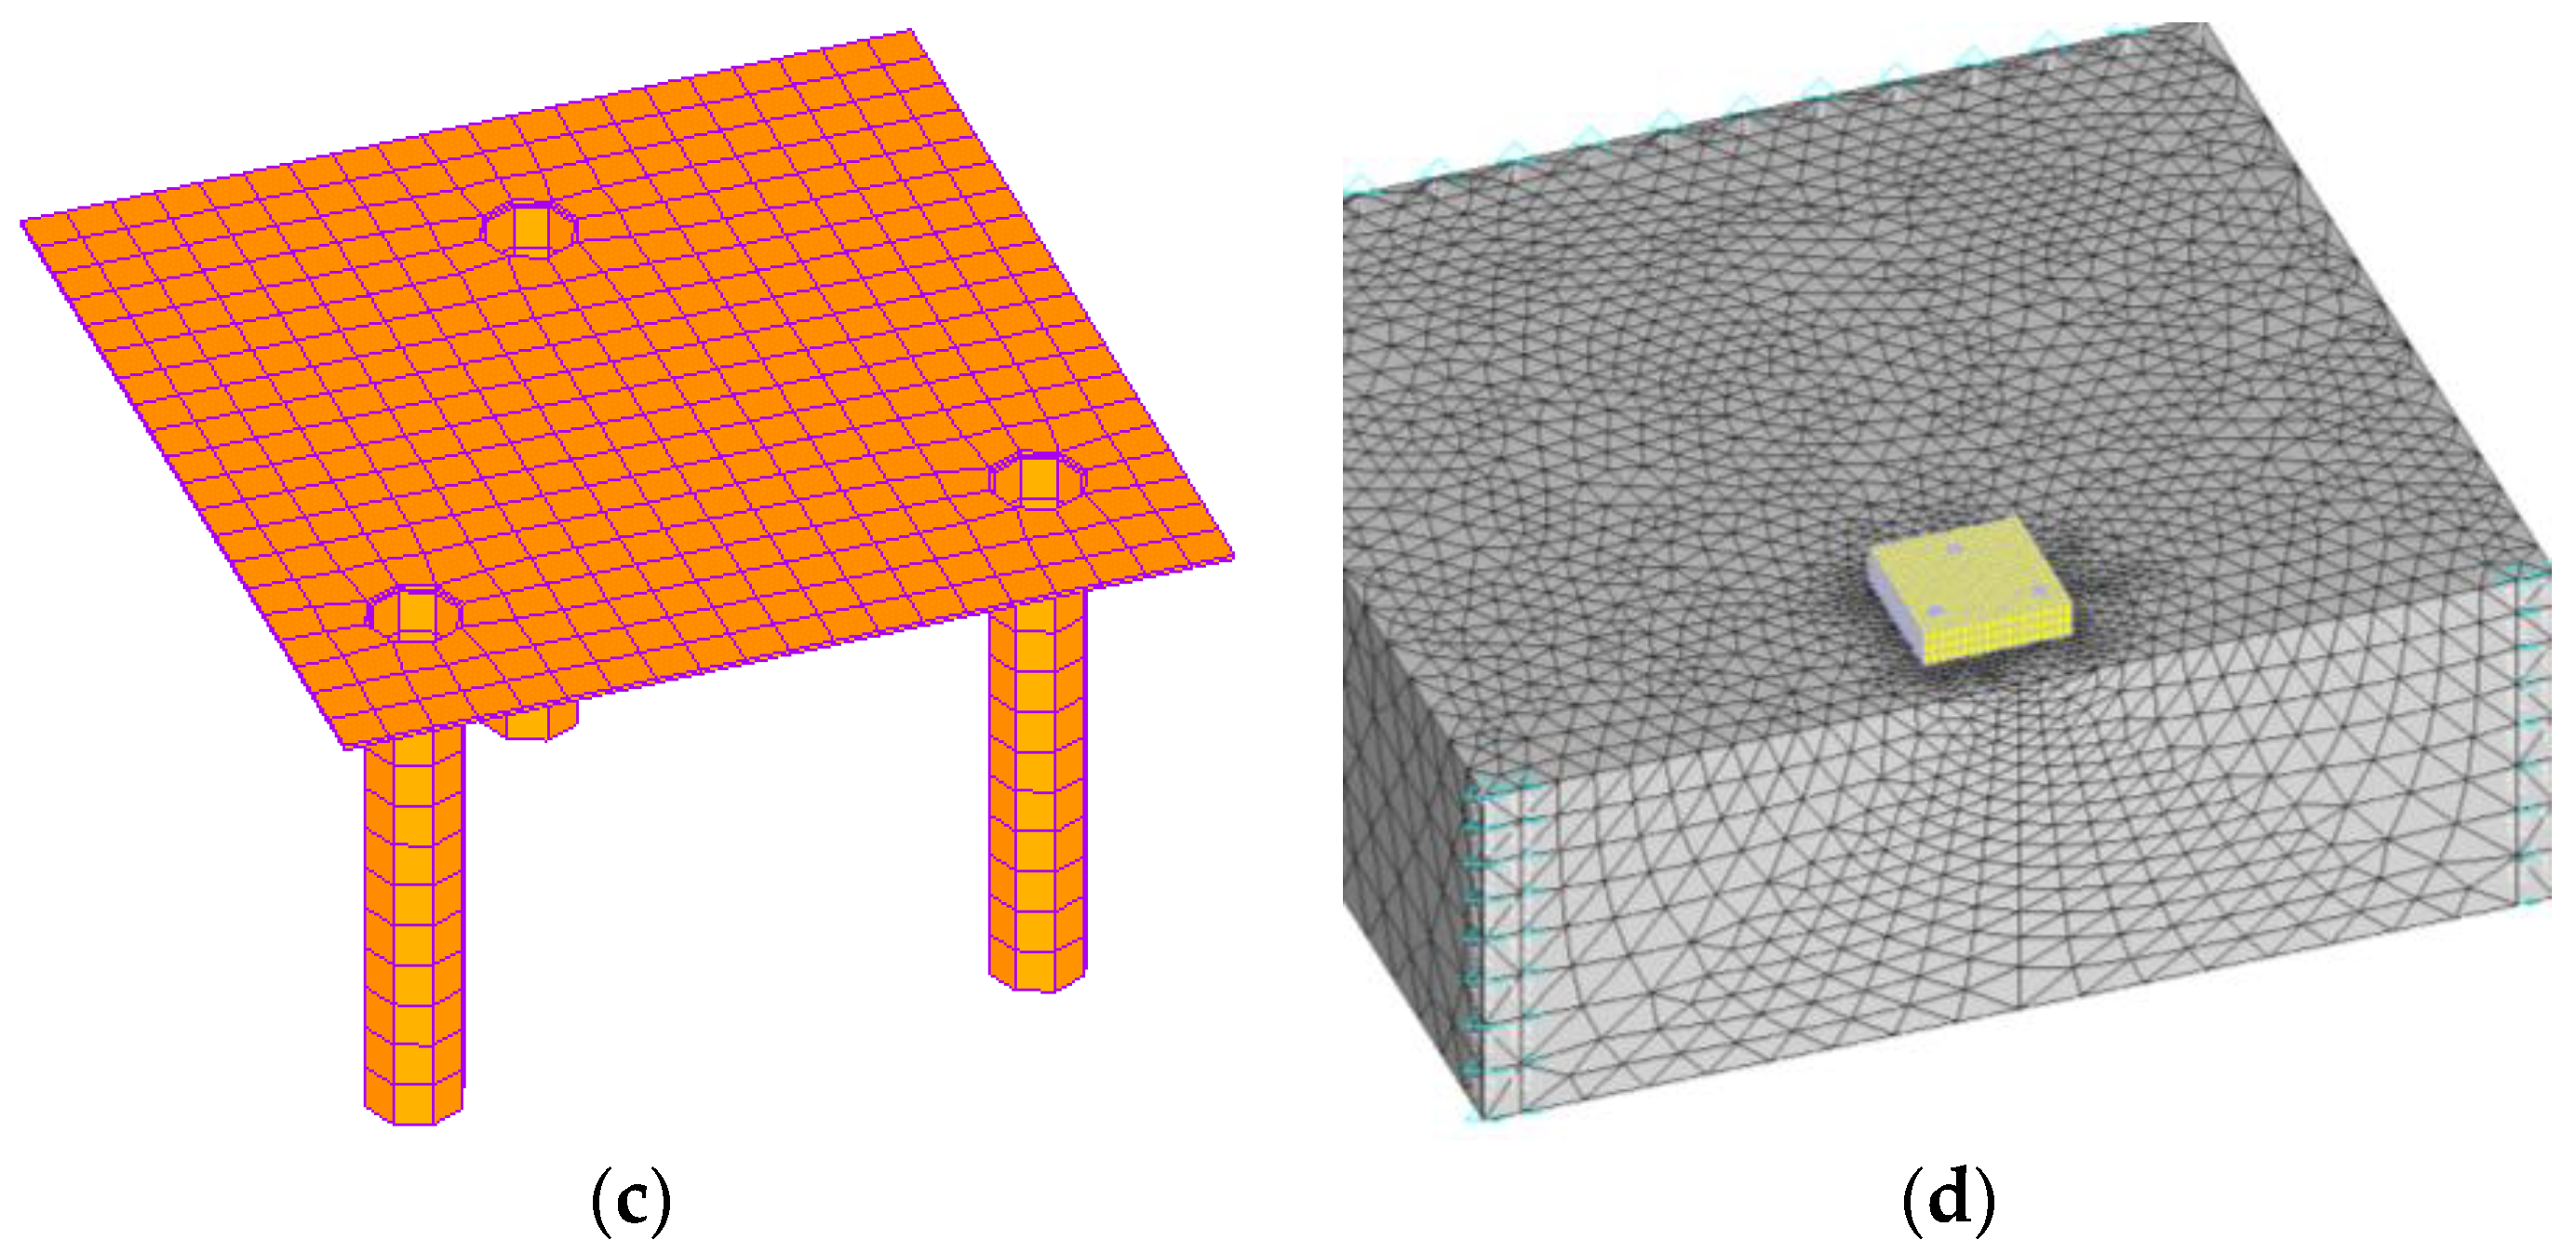
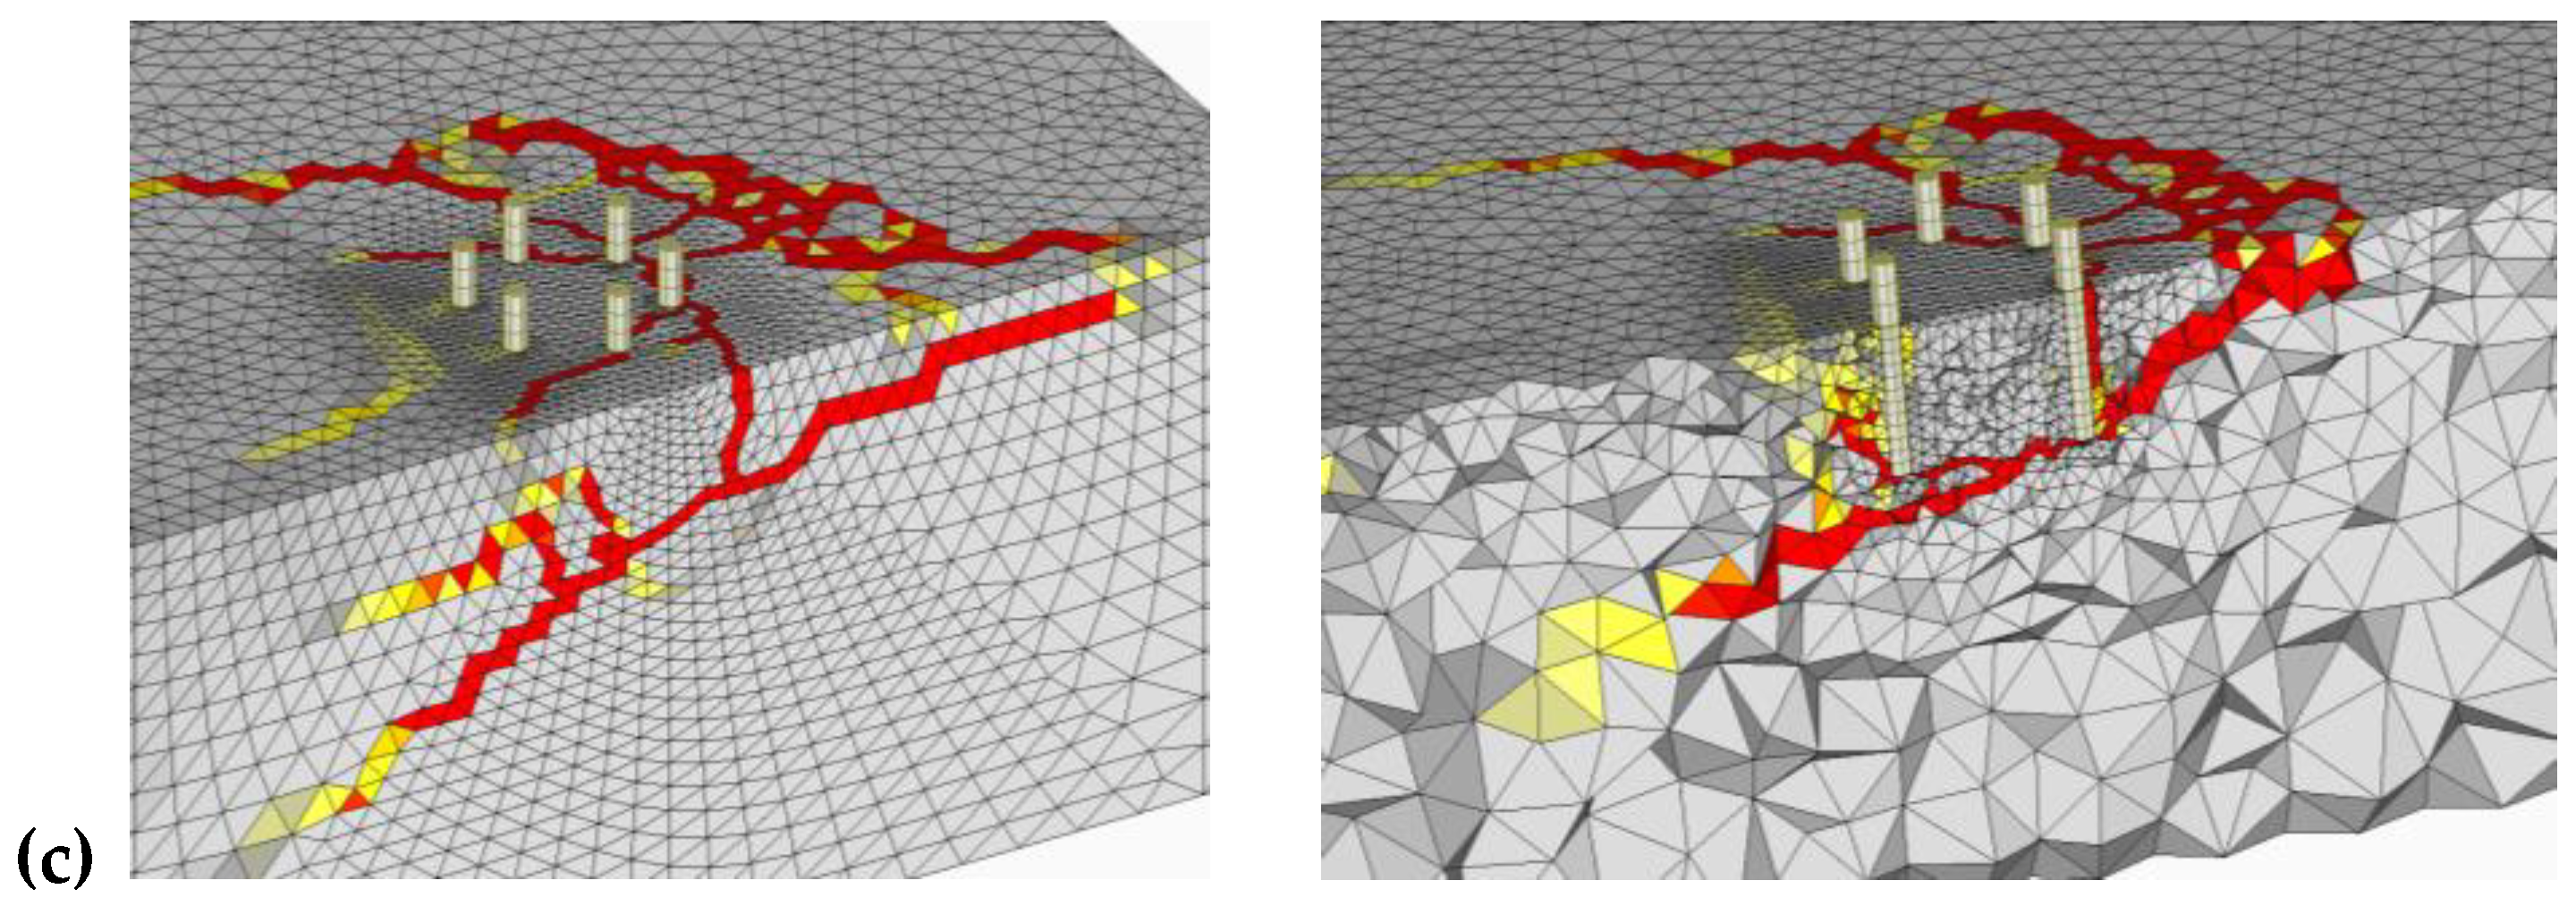
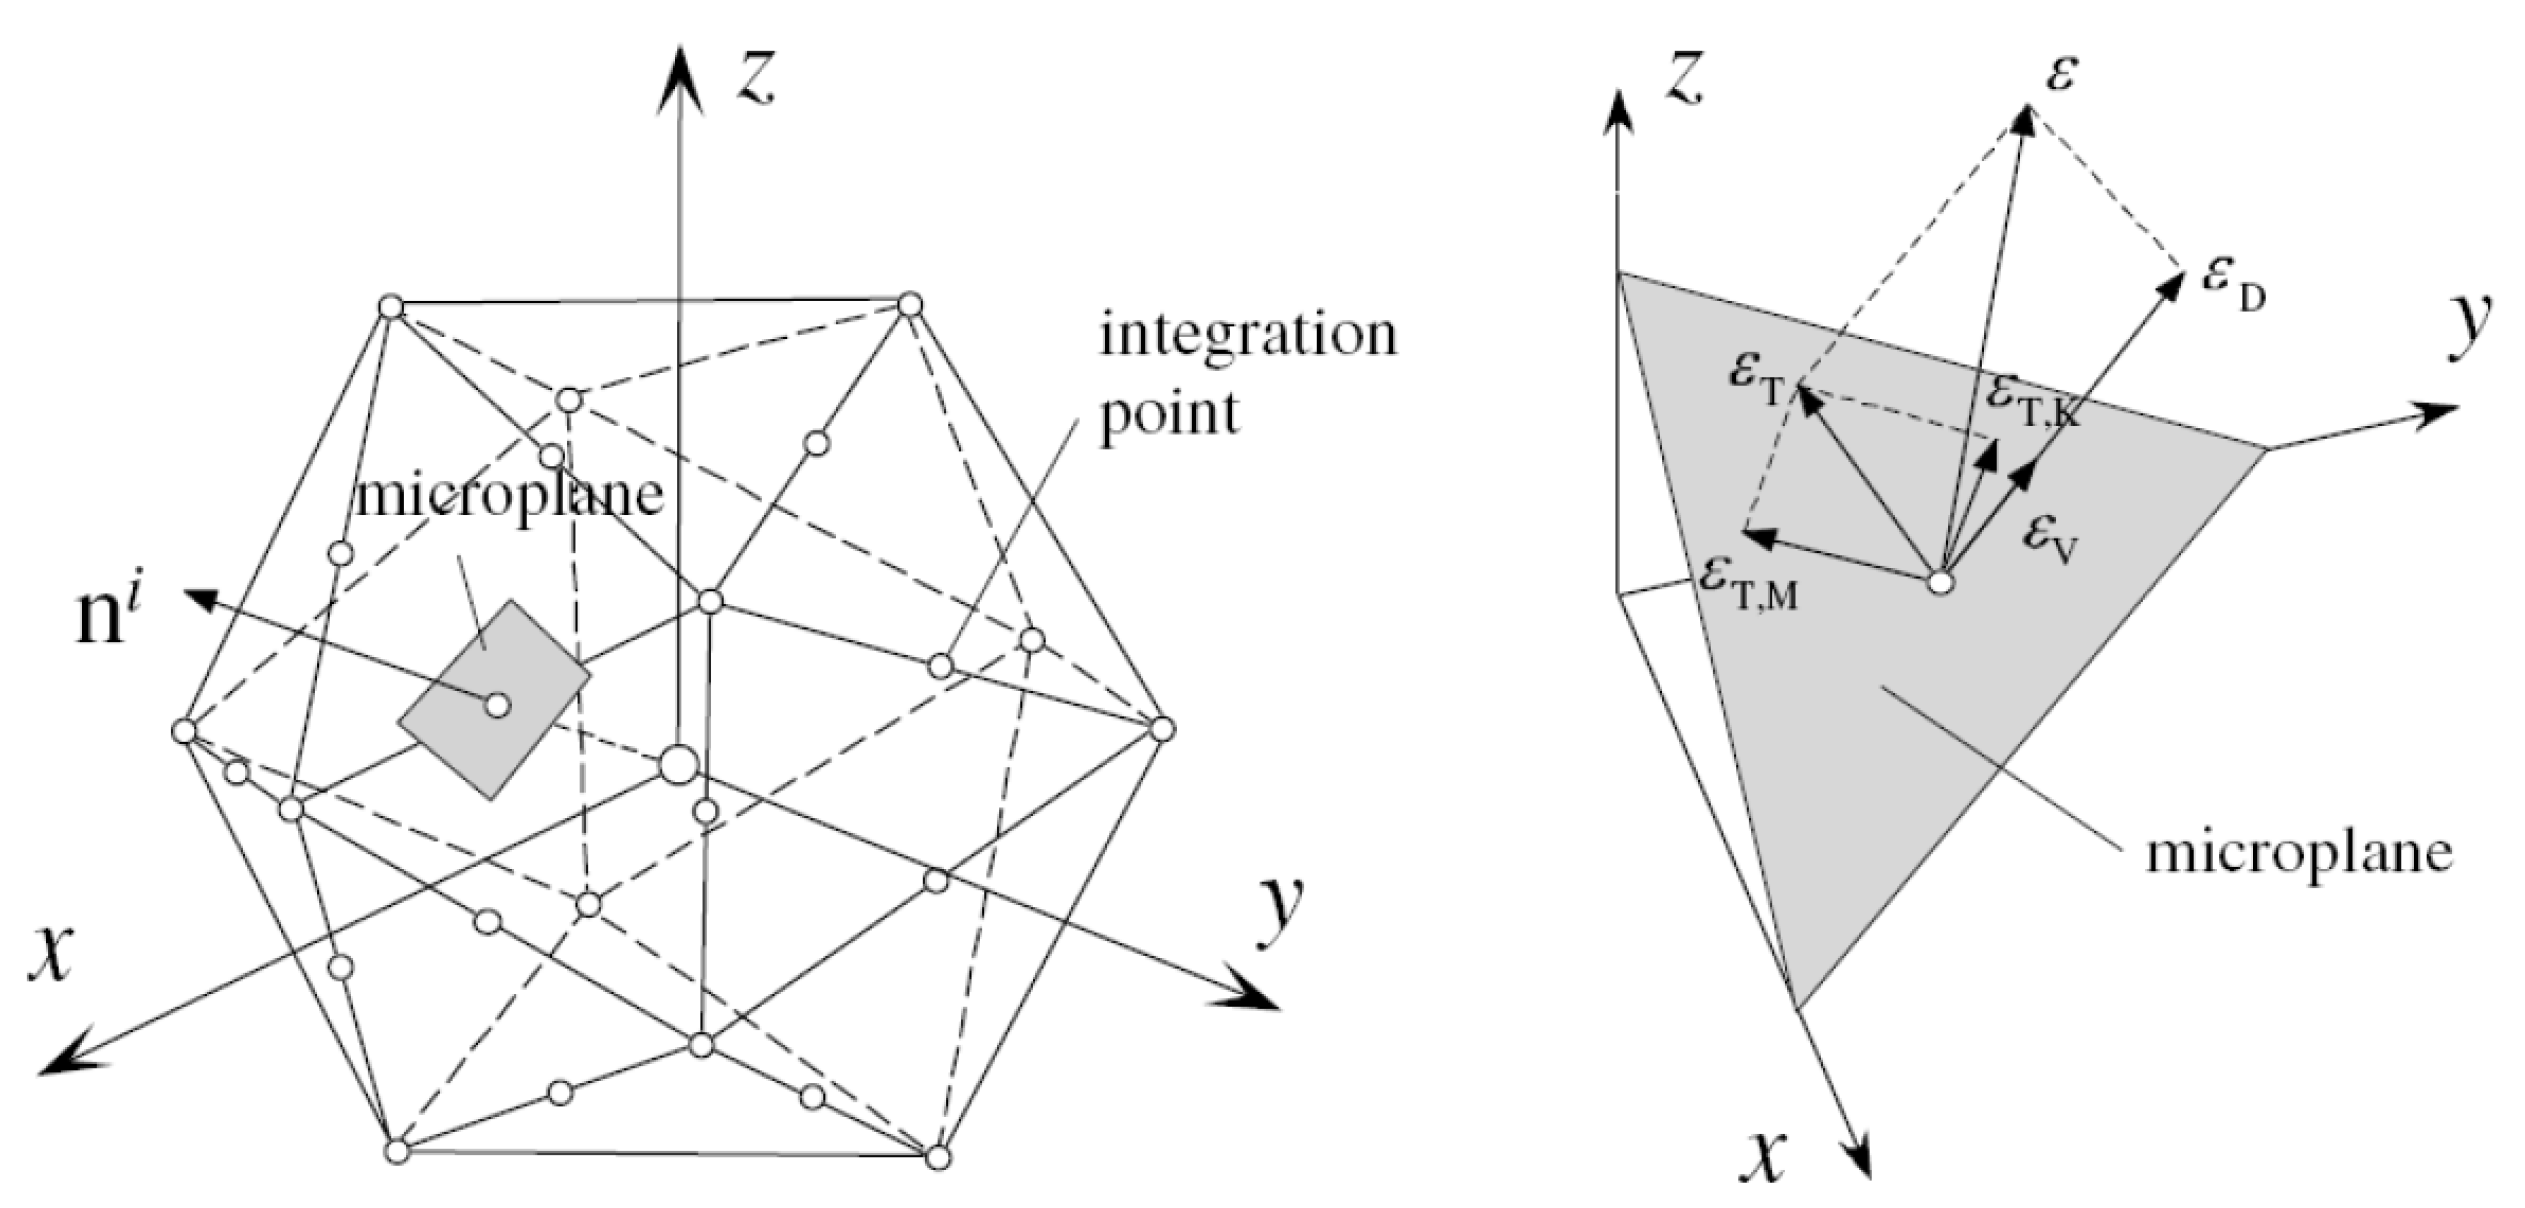
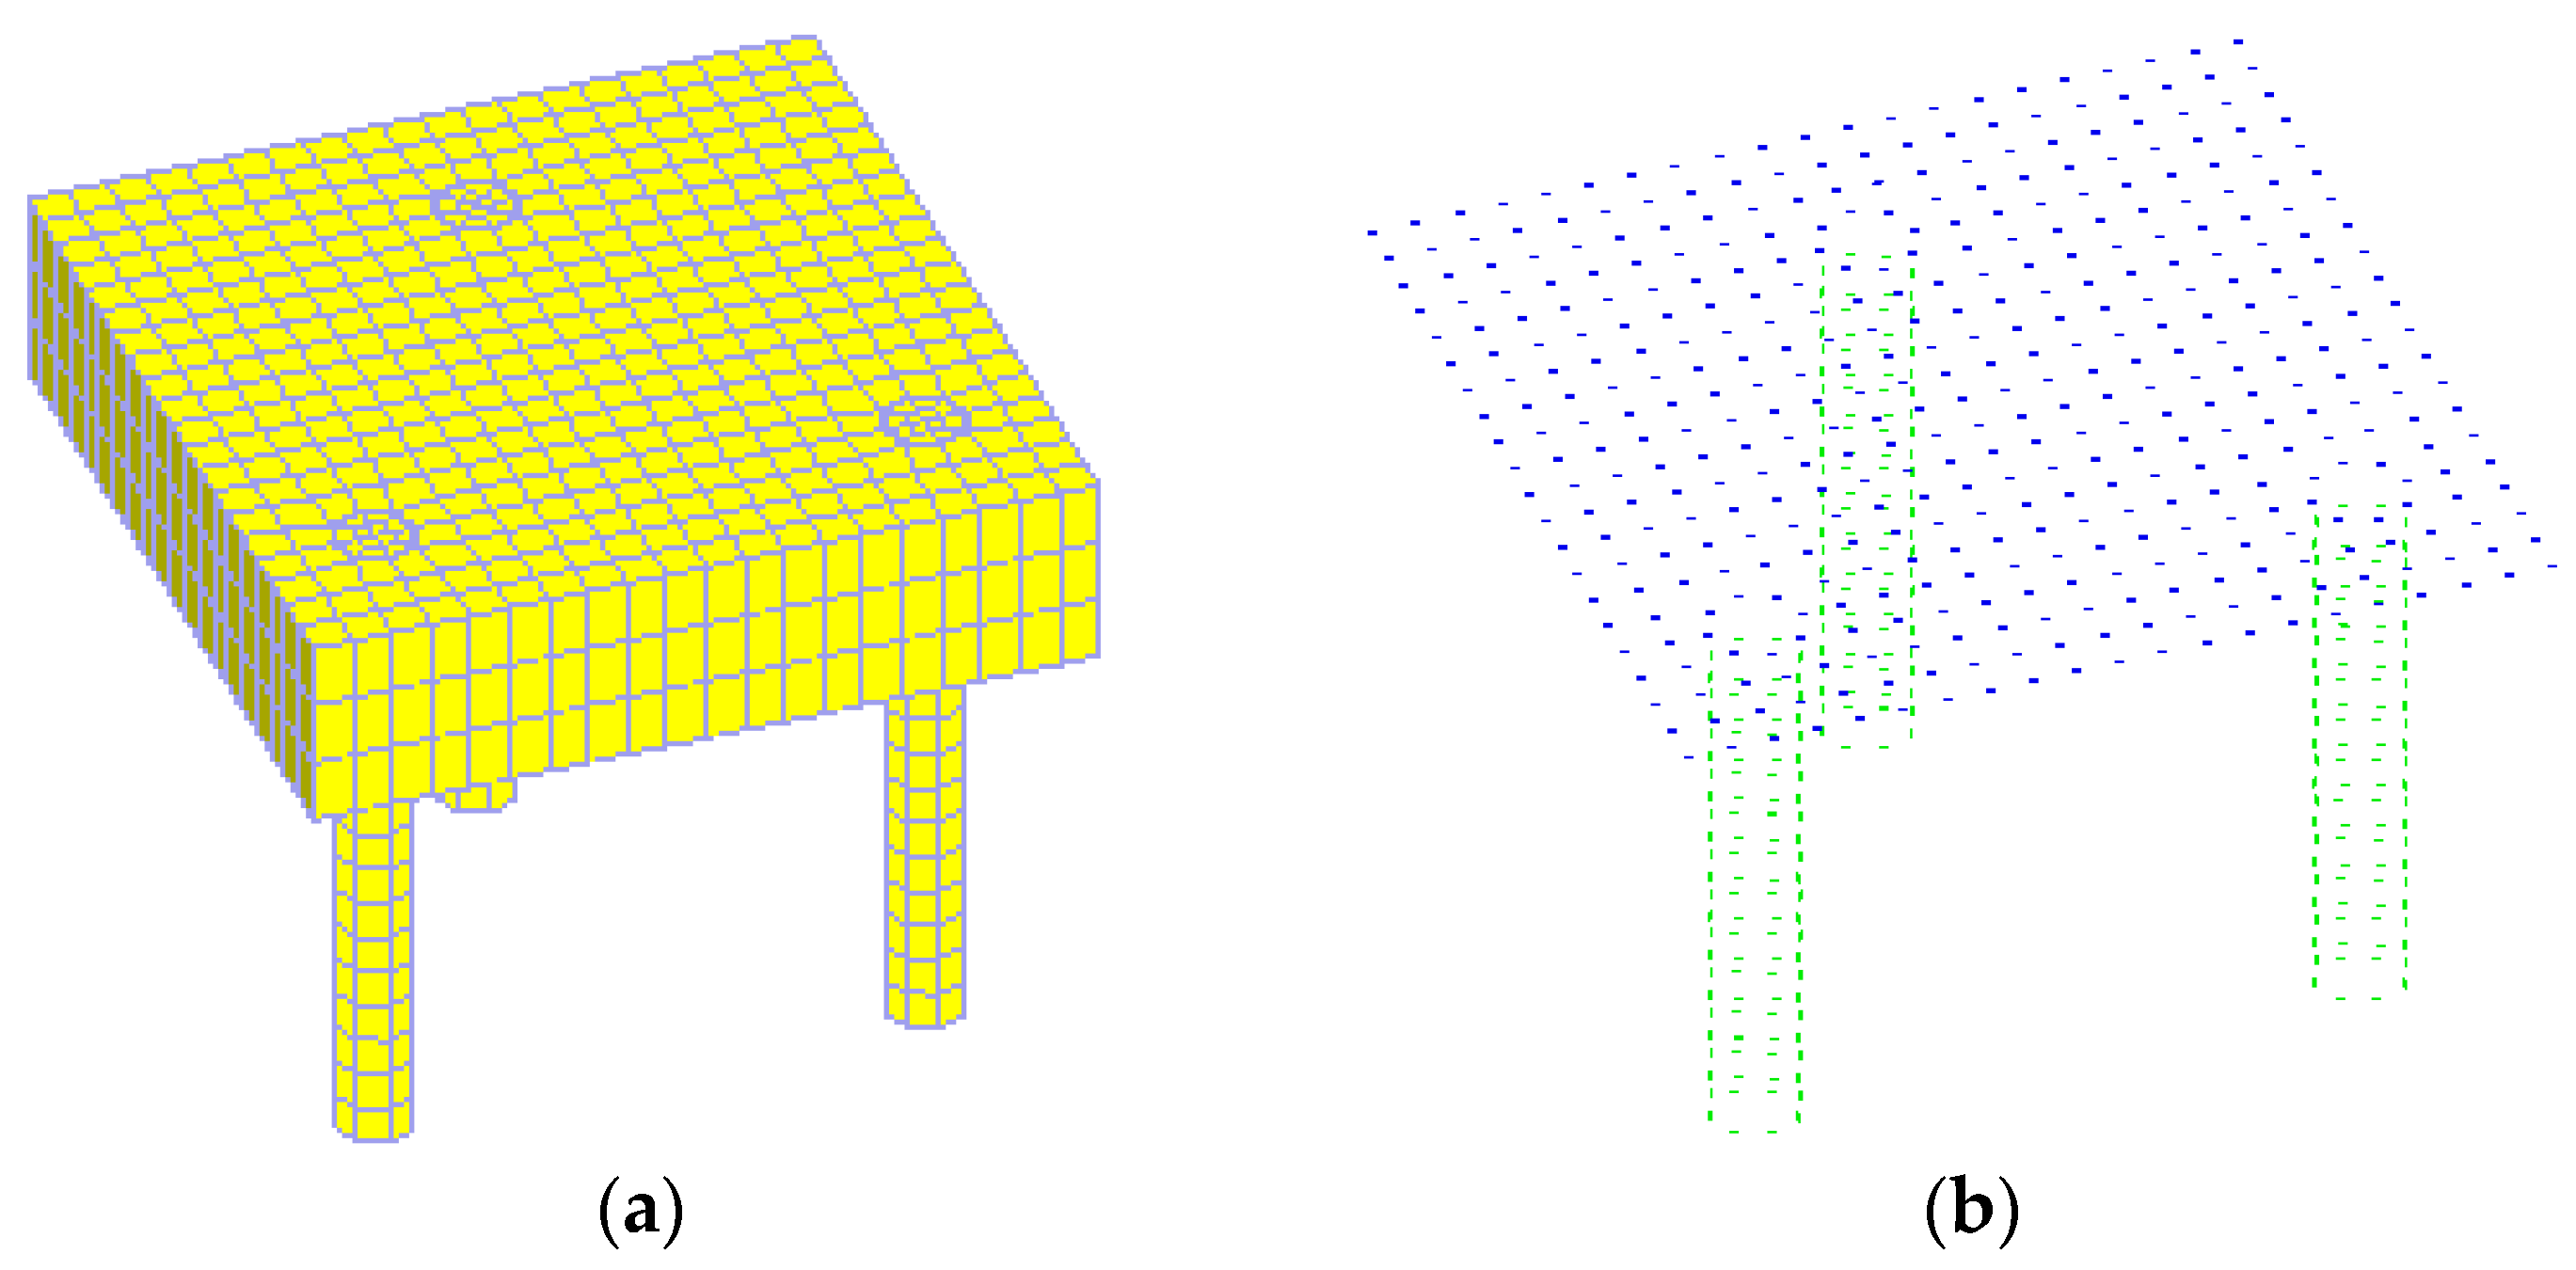
2.2. Numerical Modeling
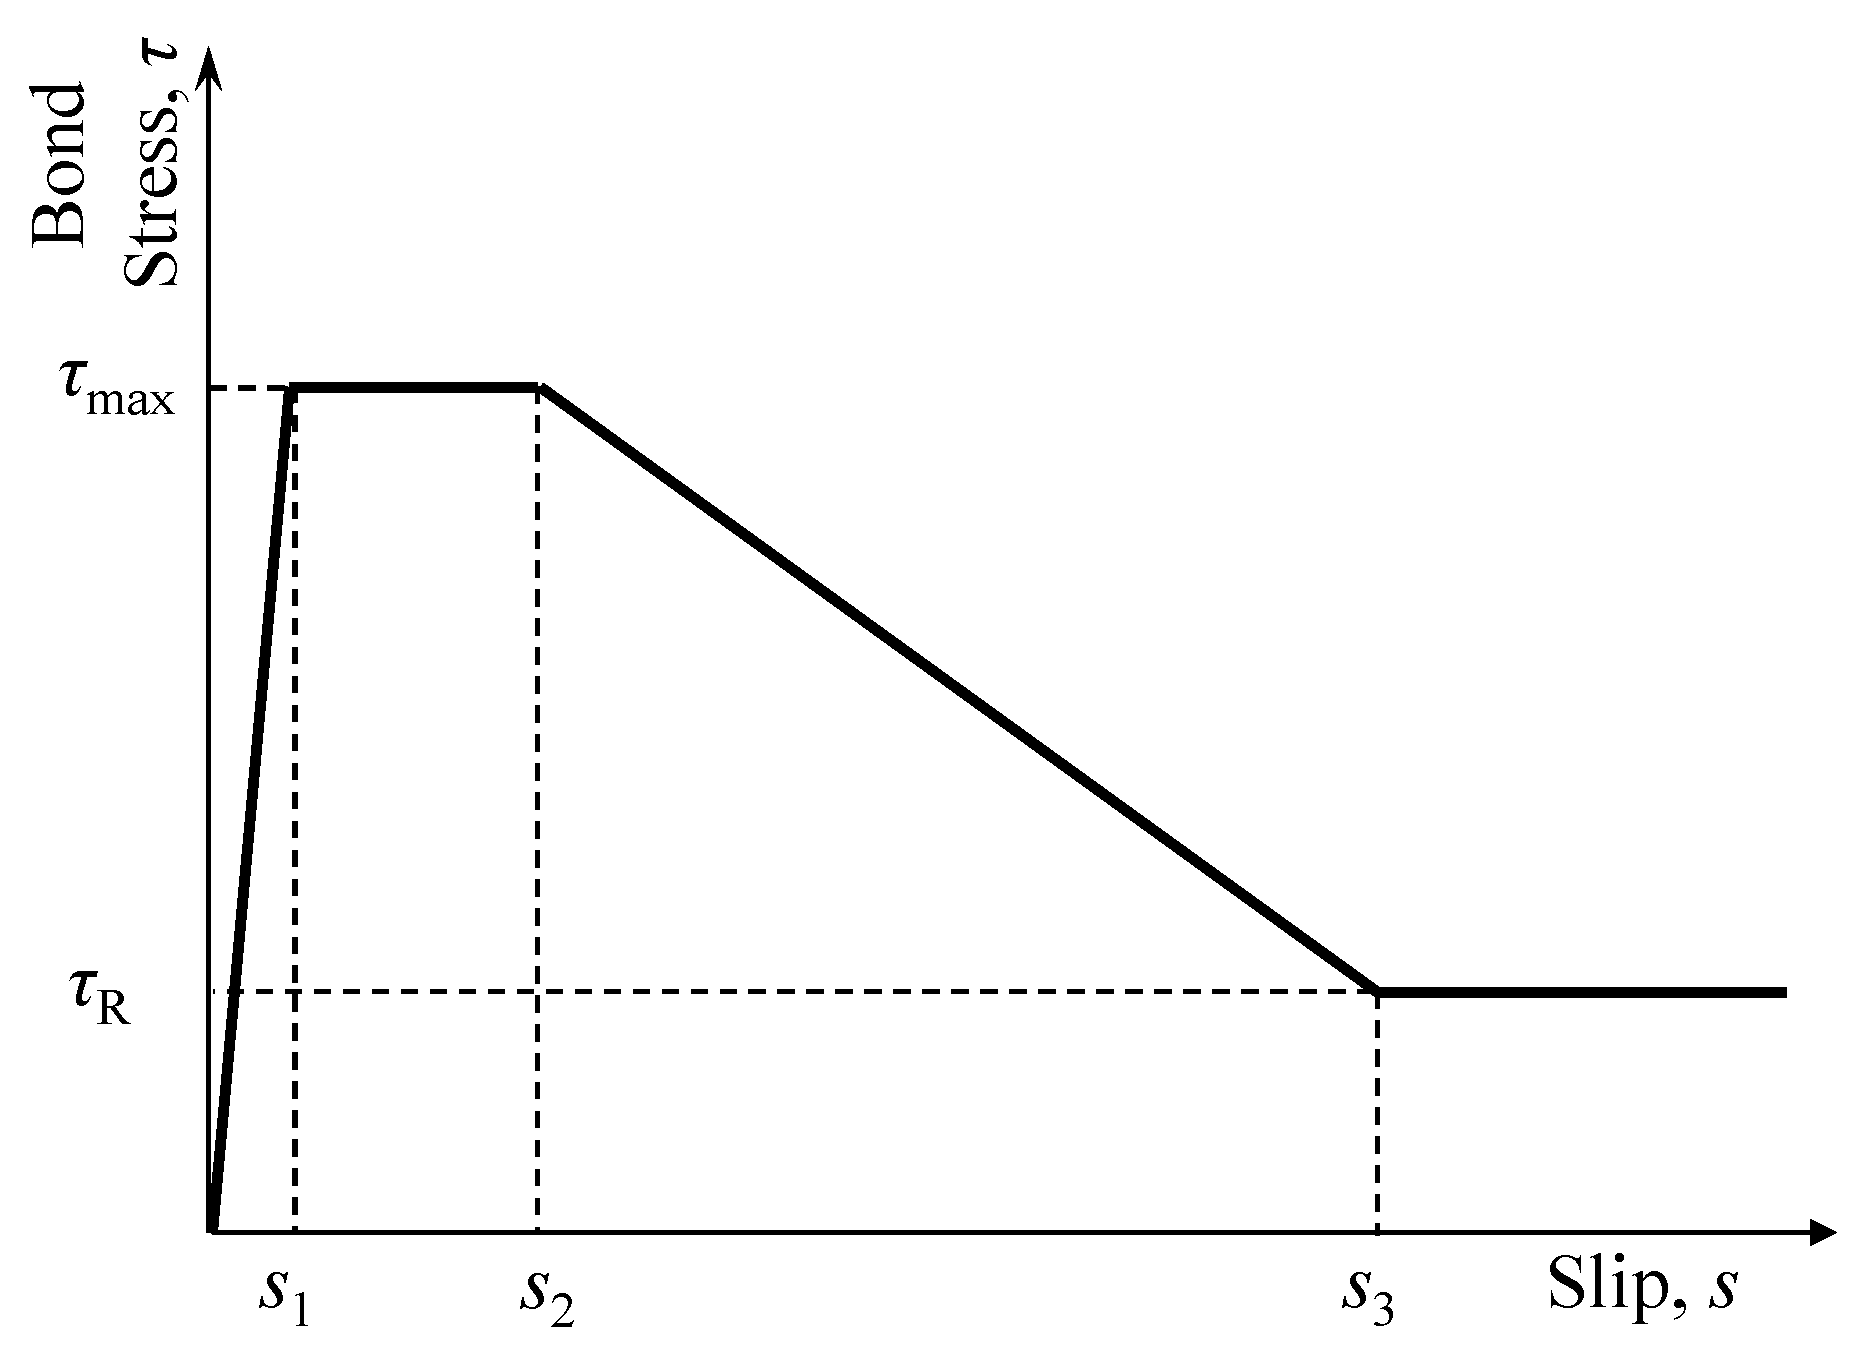
2.3. Material Parameters
3. Results and Discussion
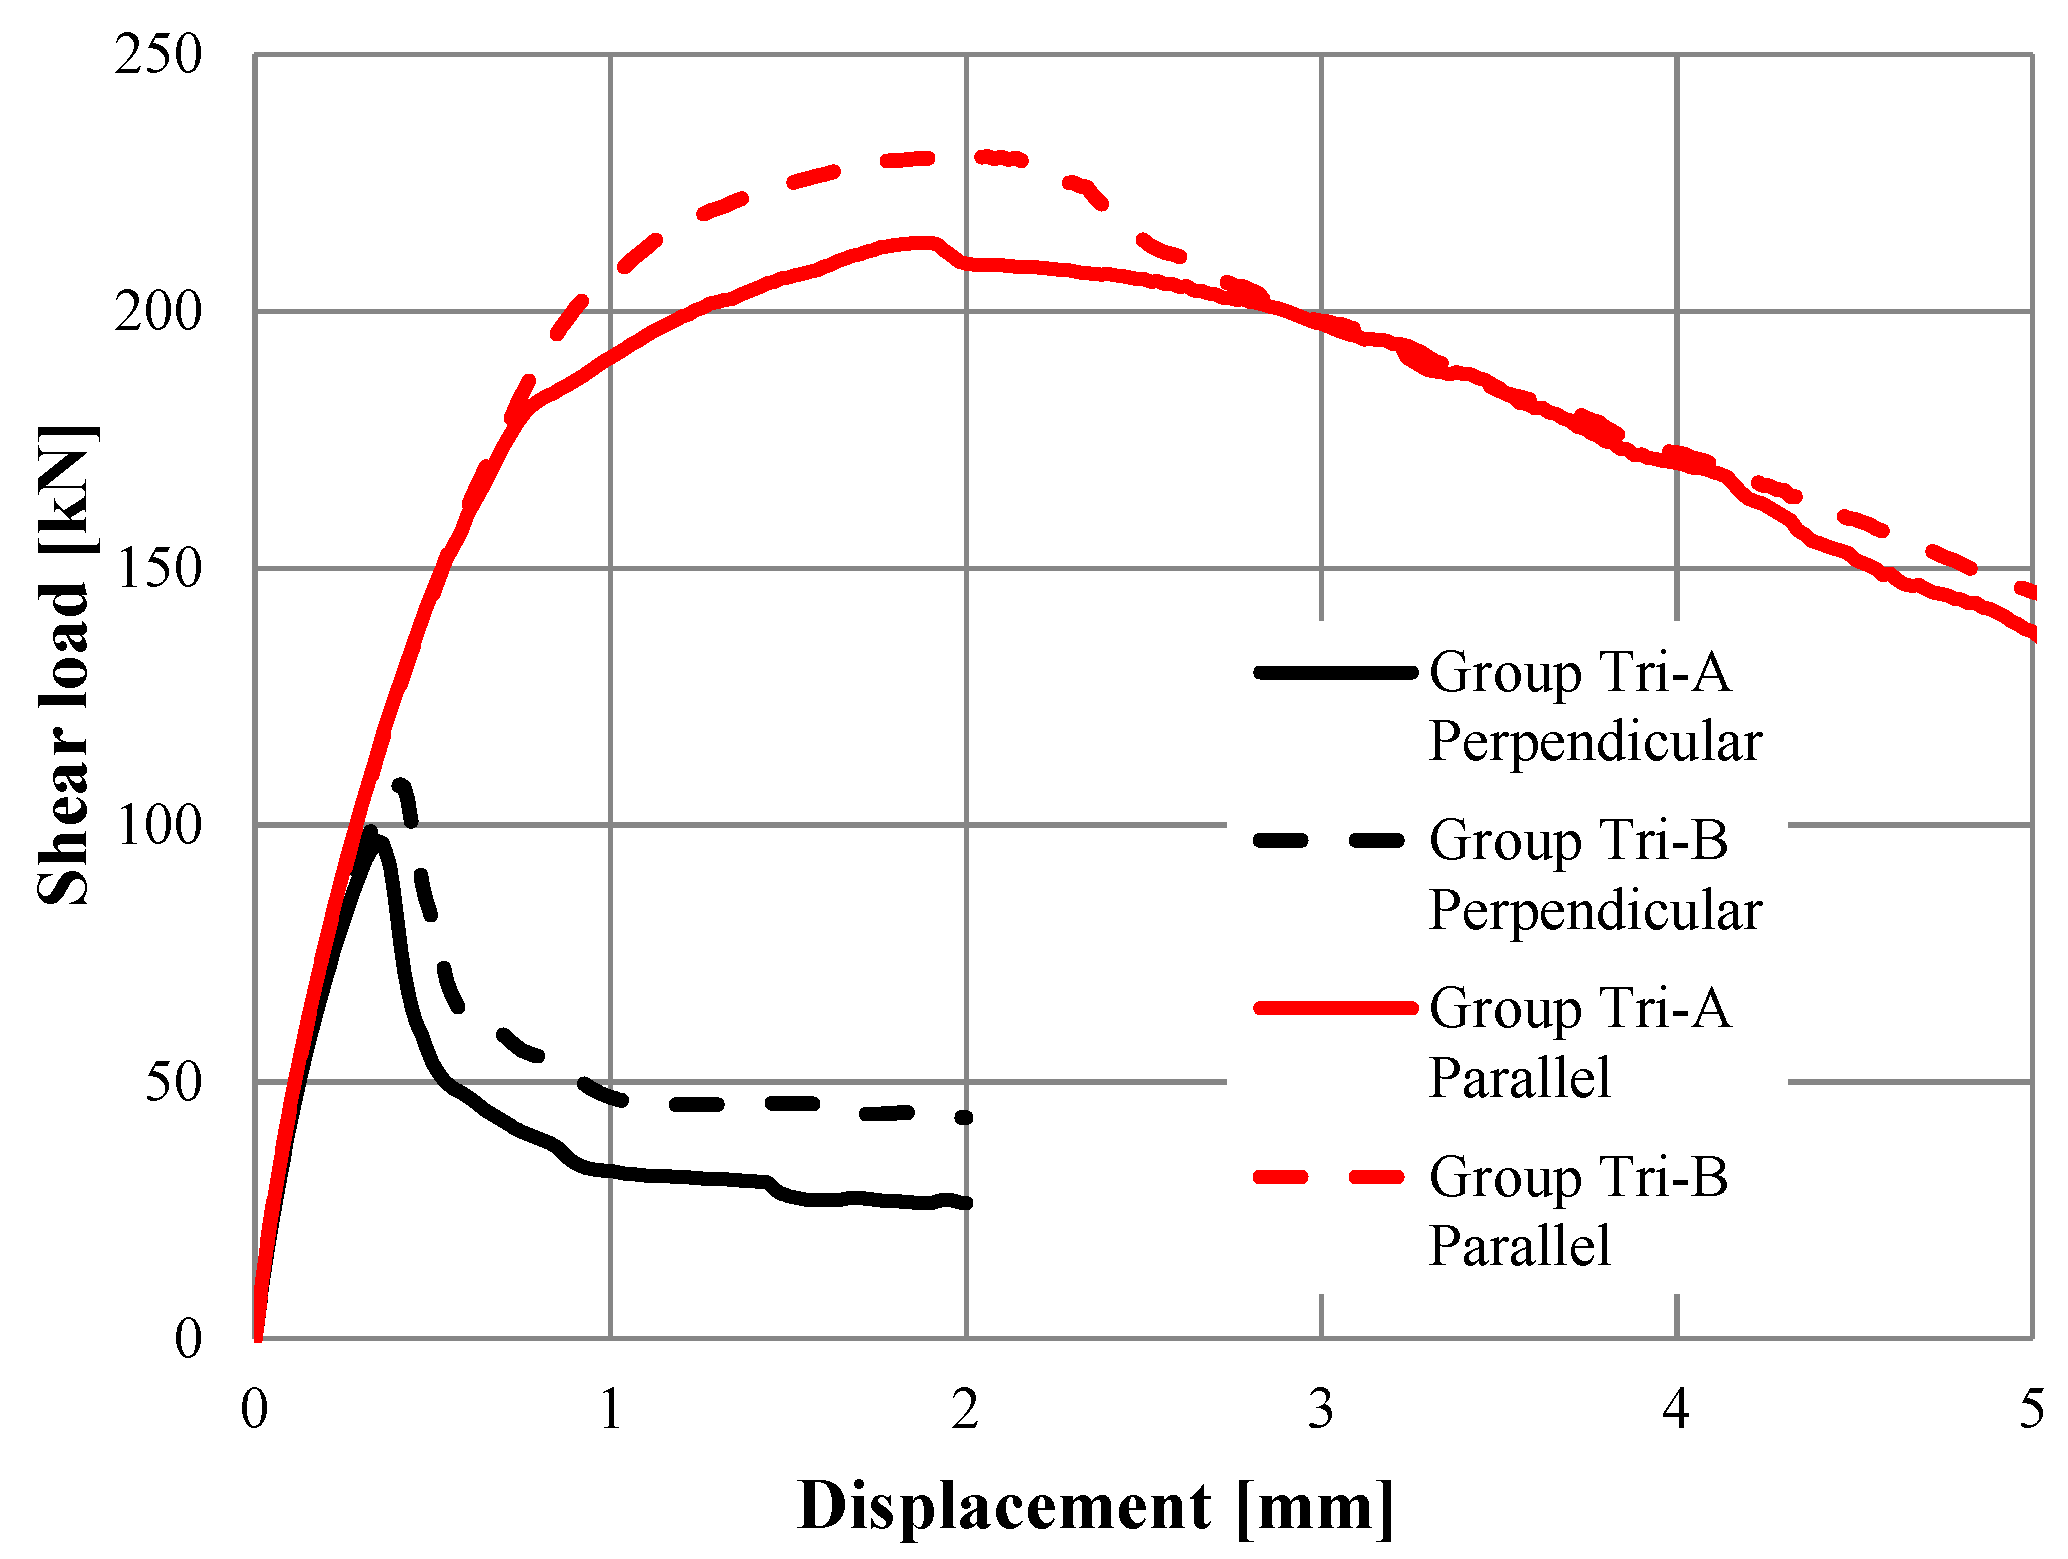
3.1. Triangular Anchor Groups
3.1.1. Group Tri-A
3.1.2. Group Tri-B
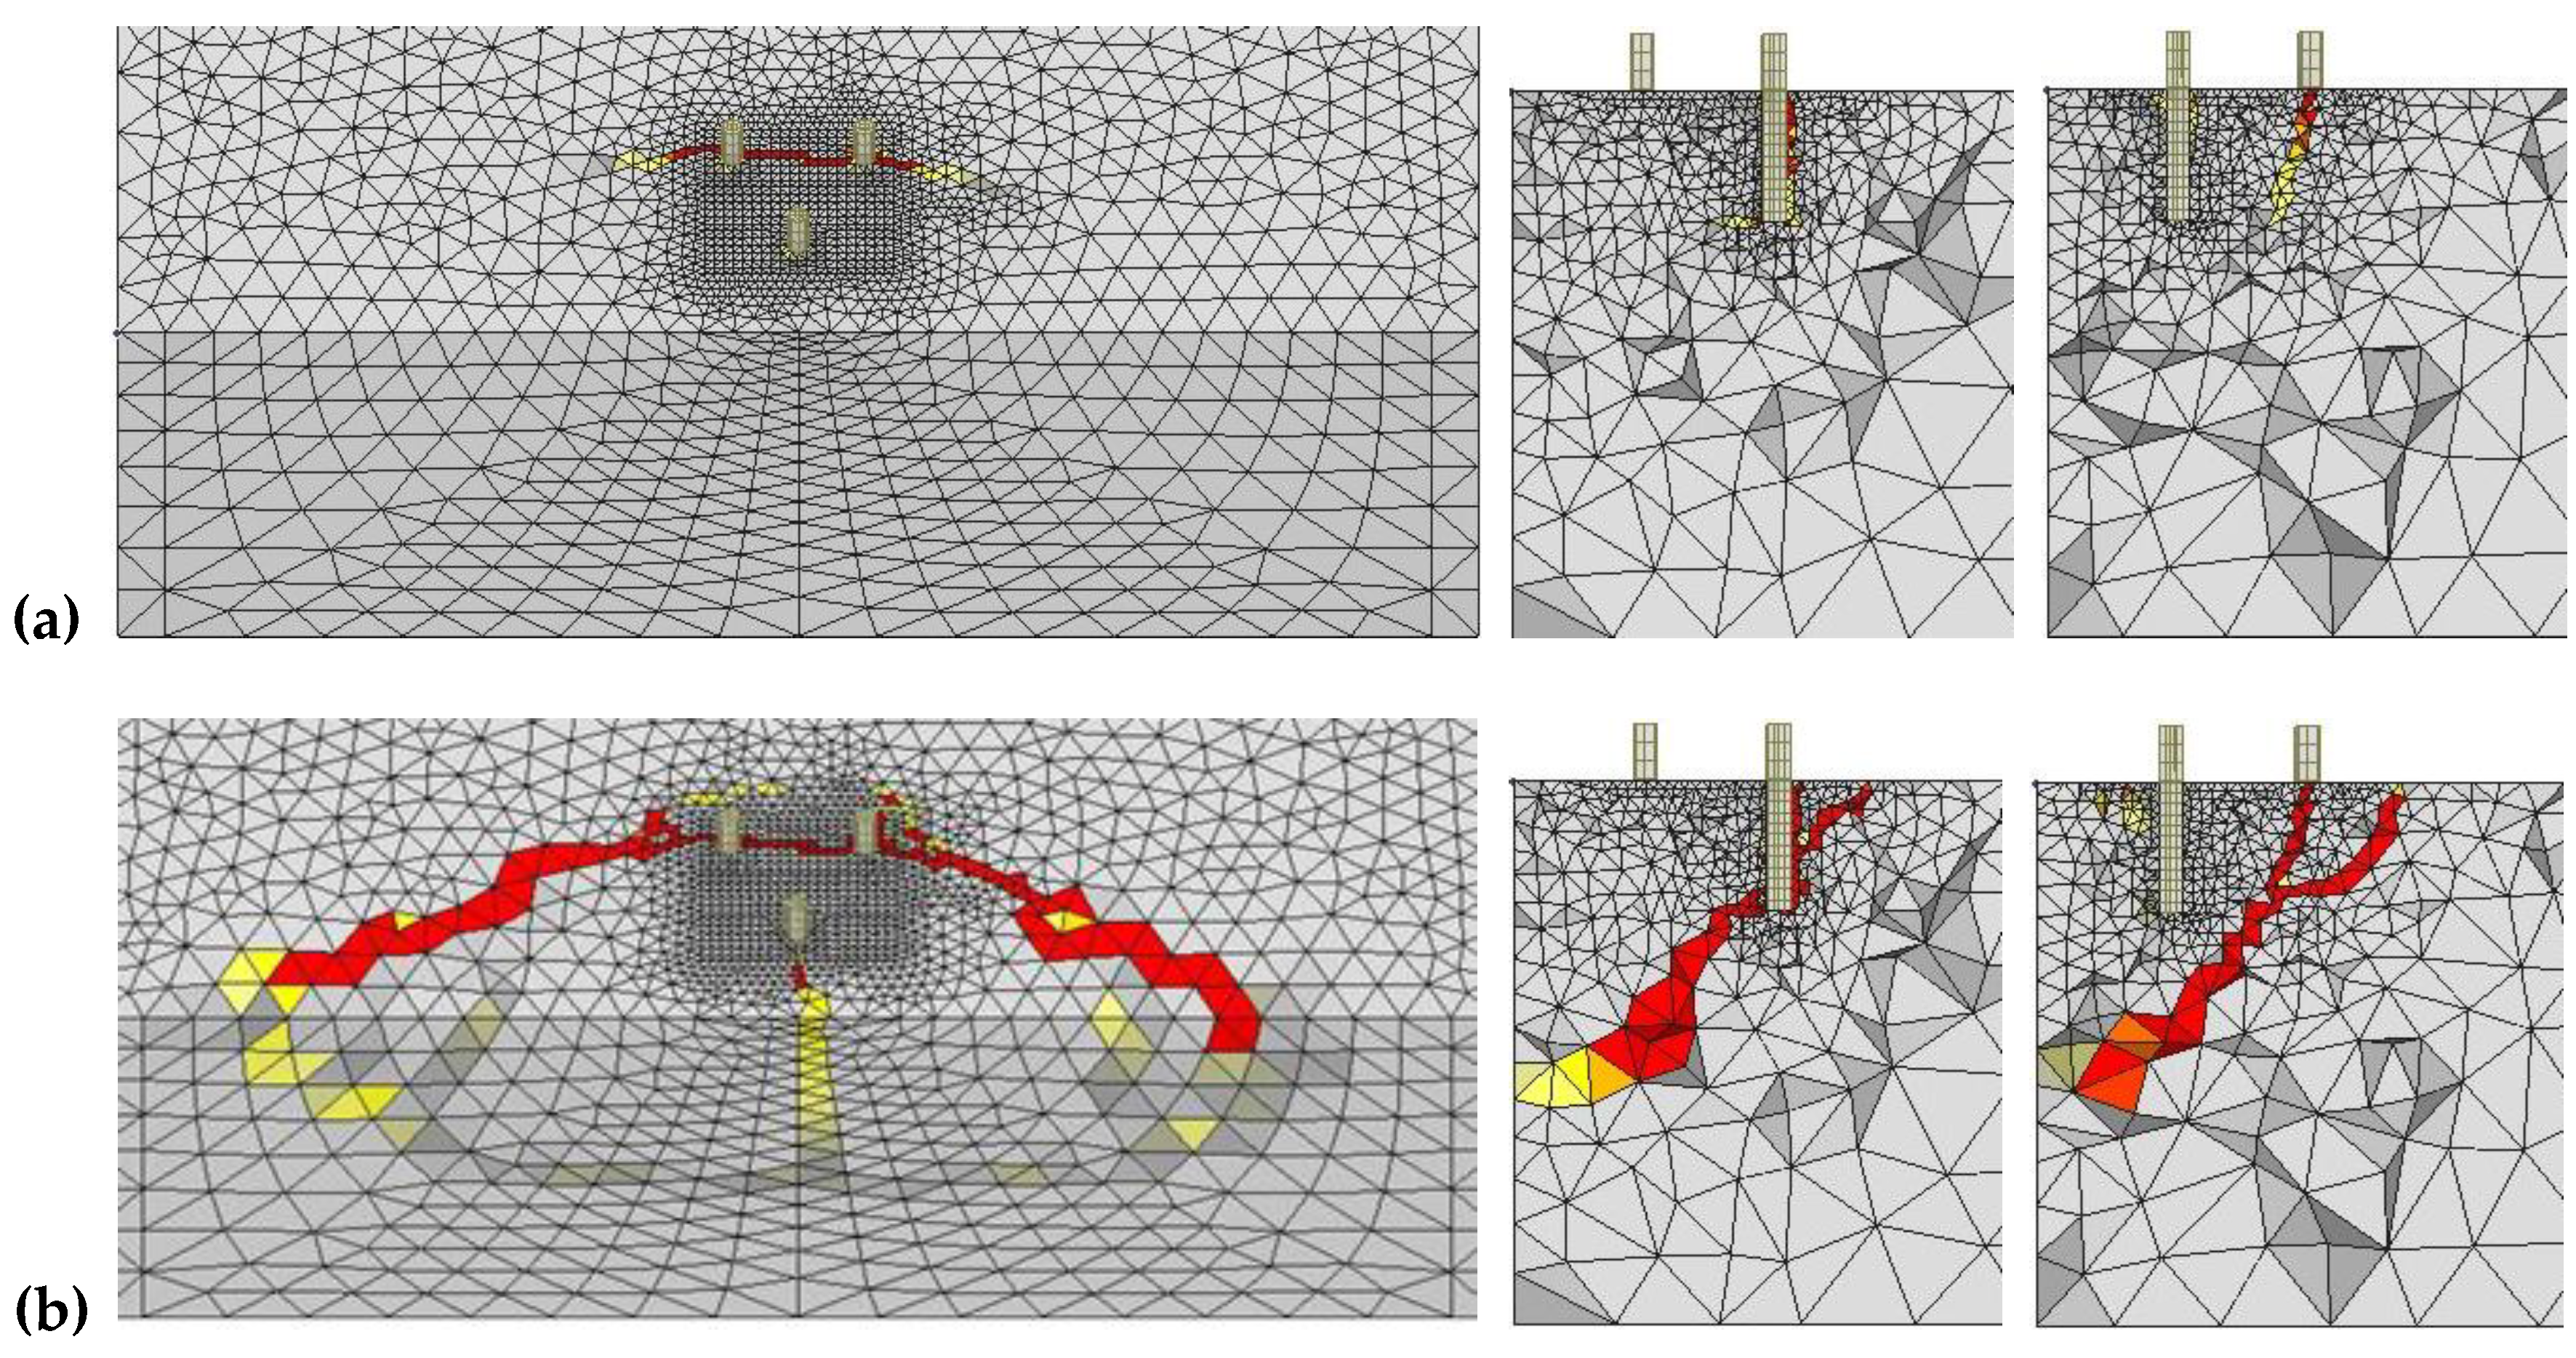
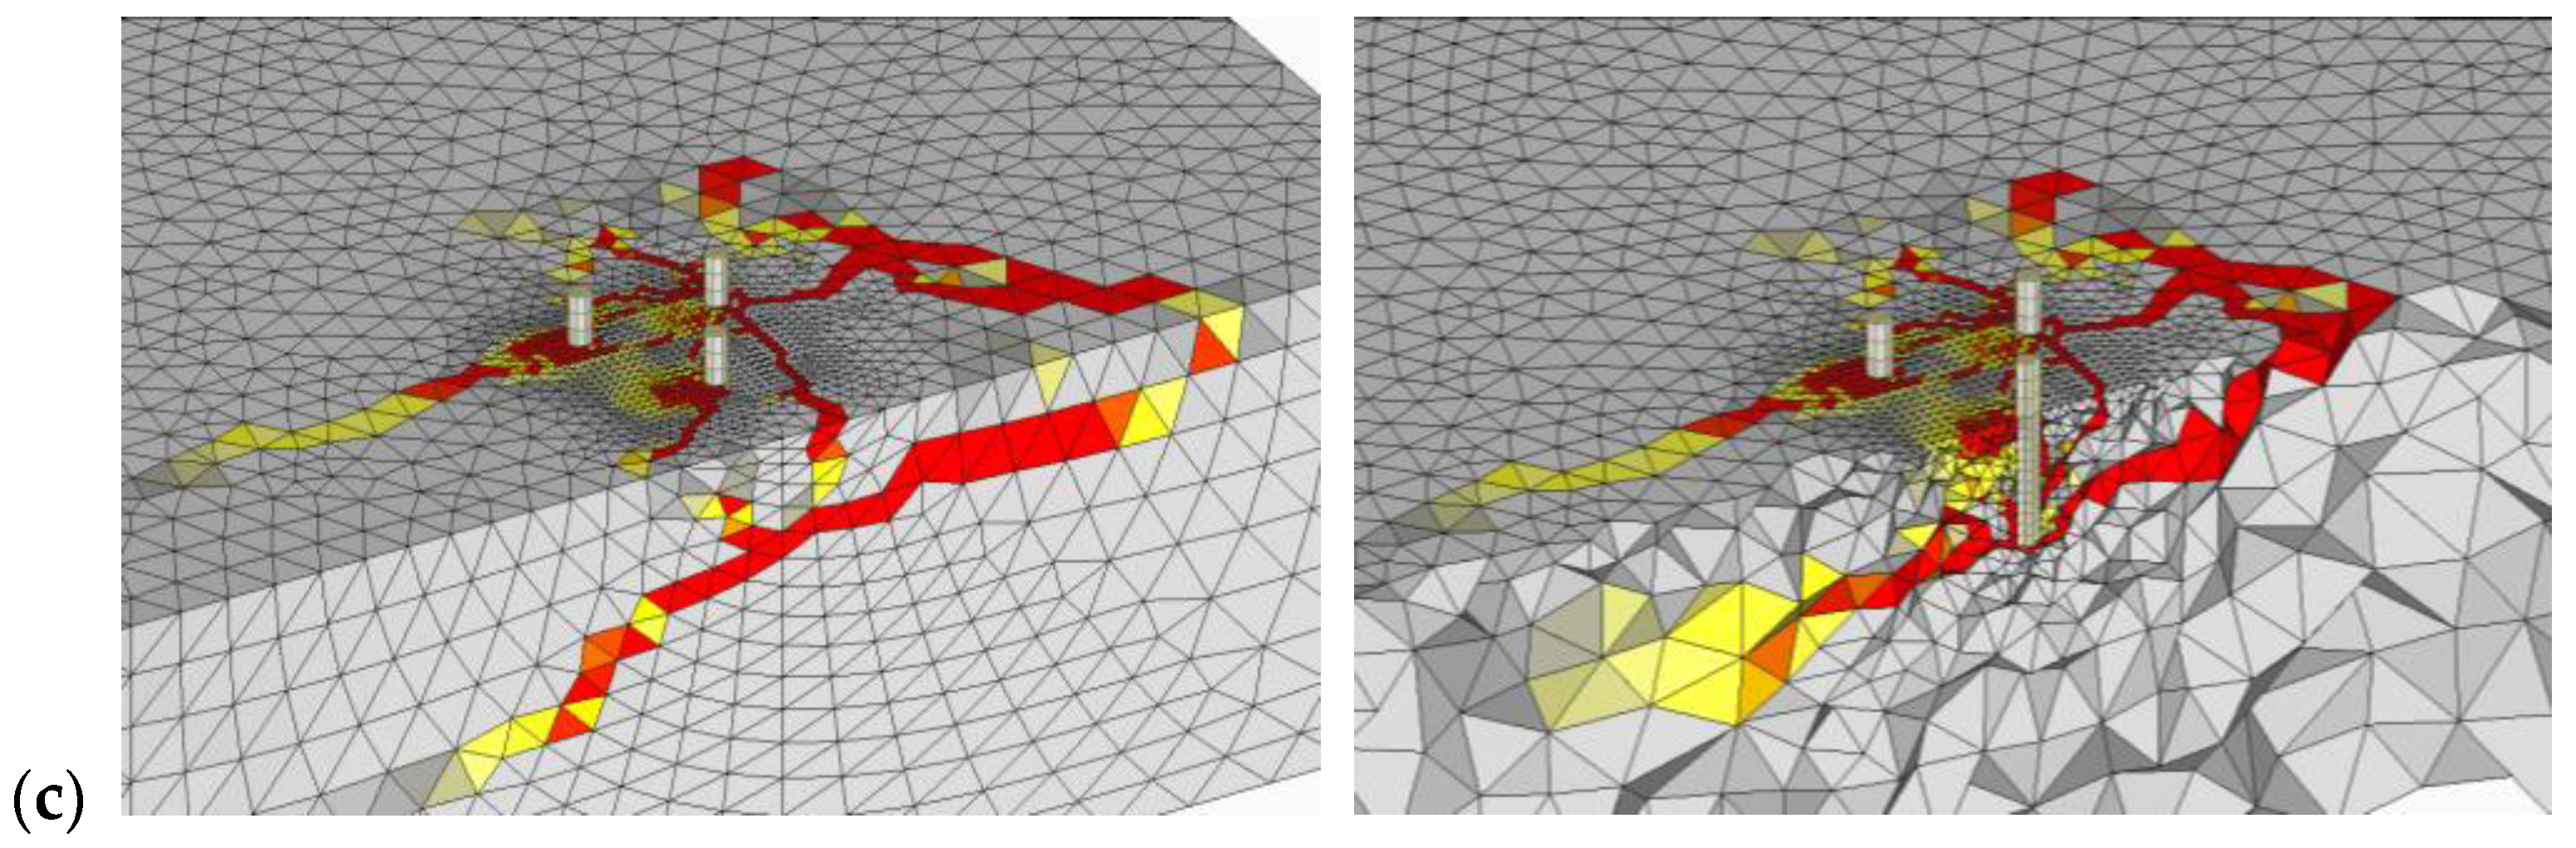
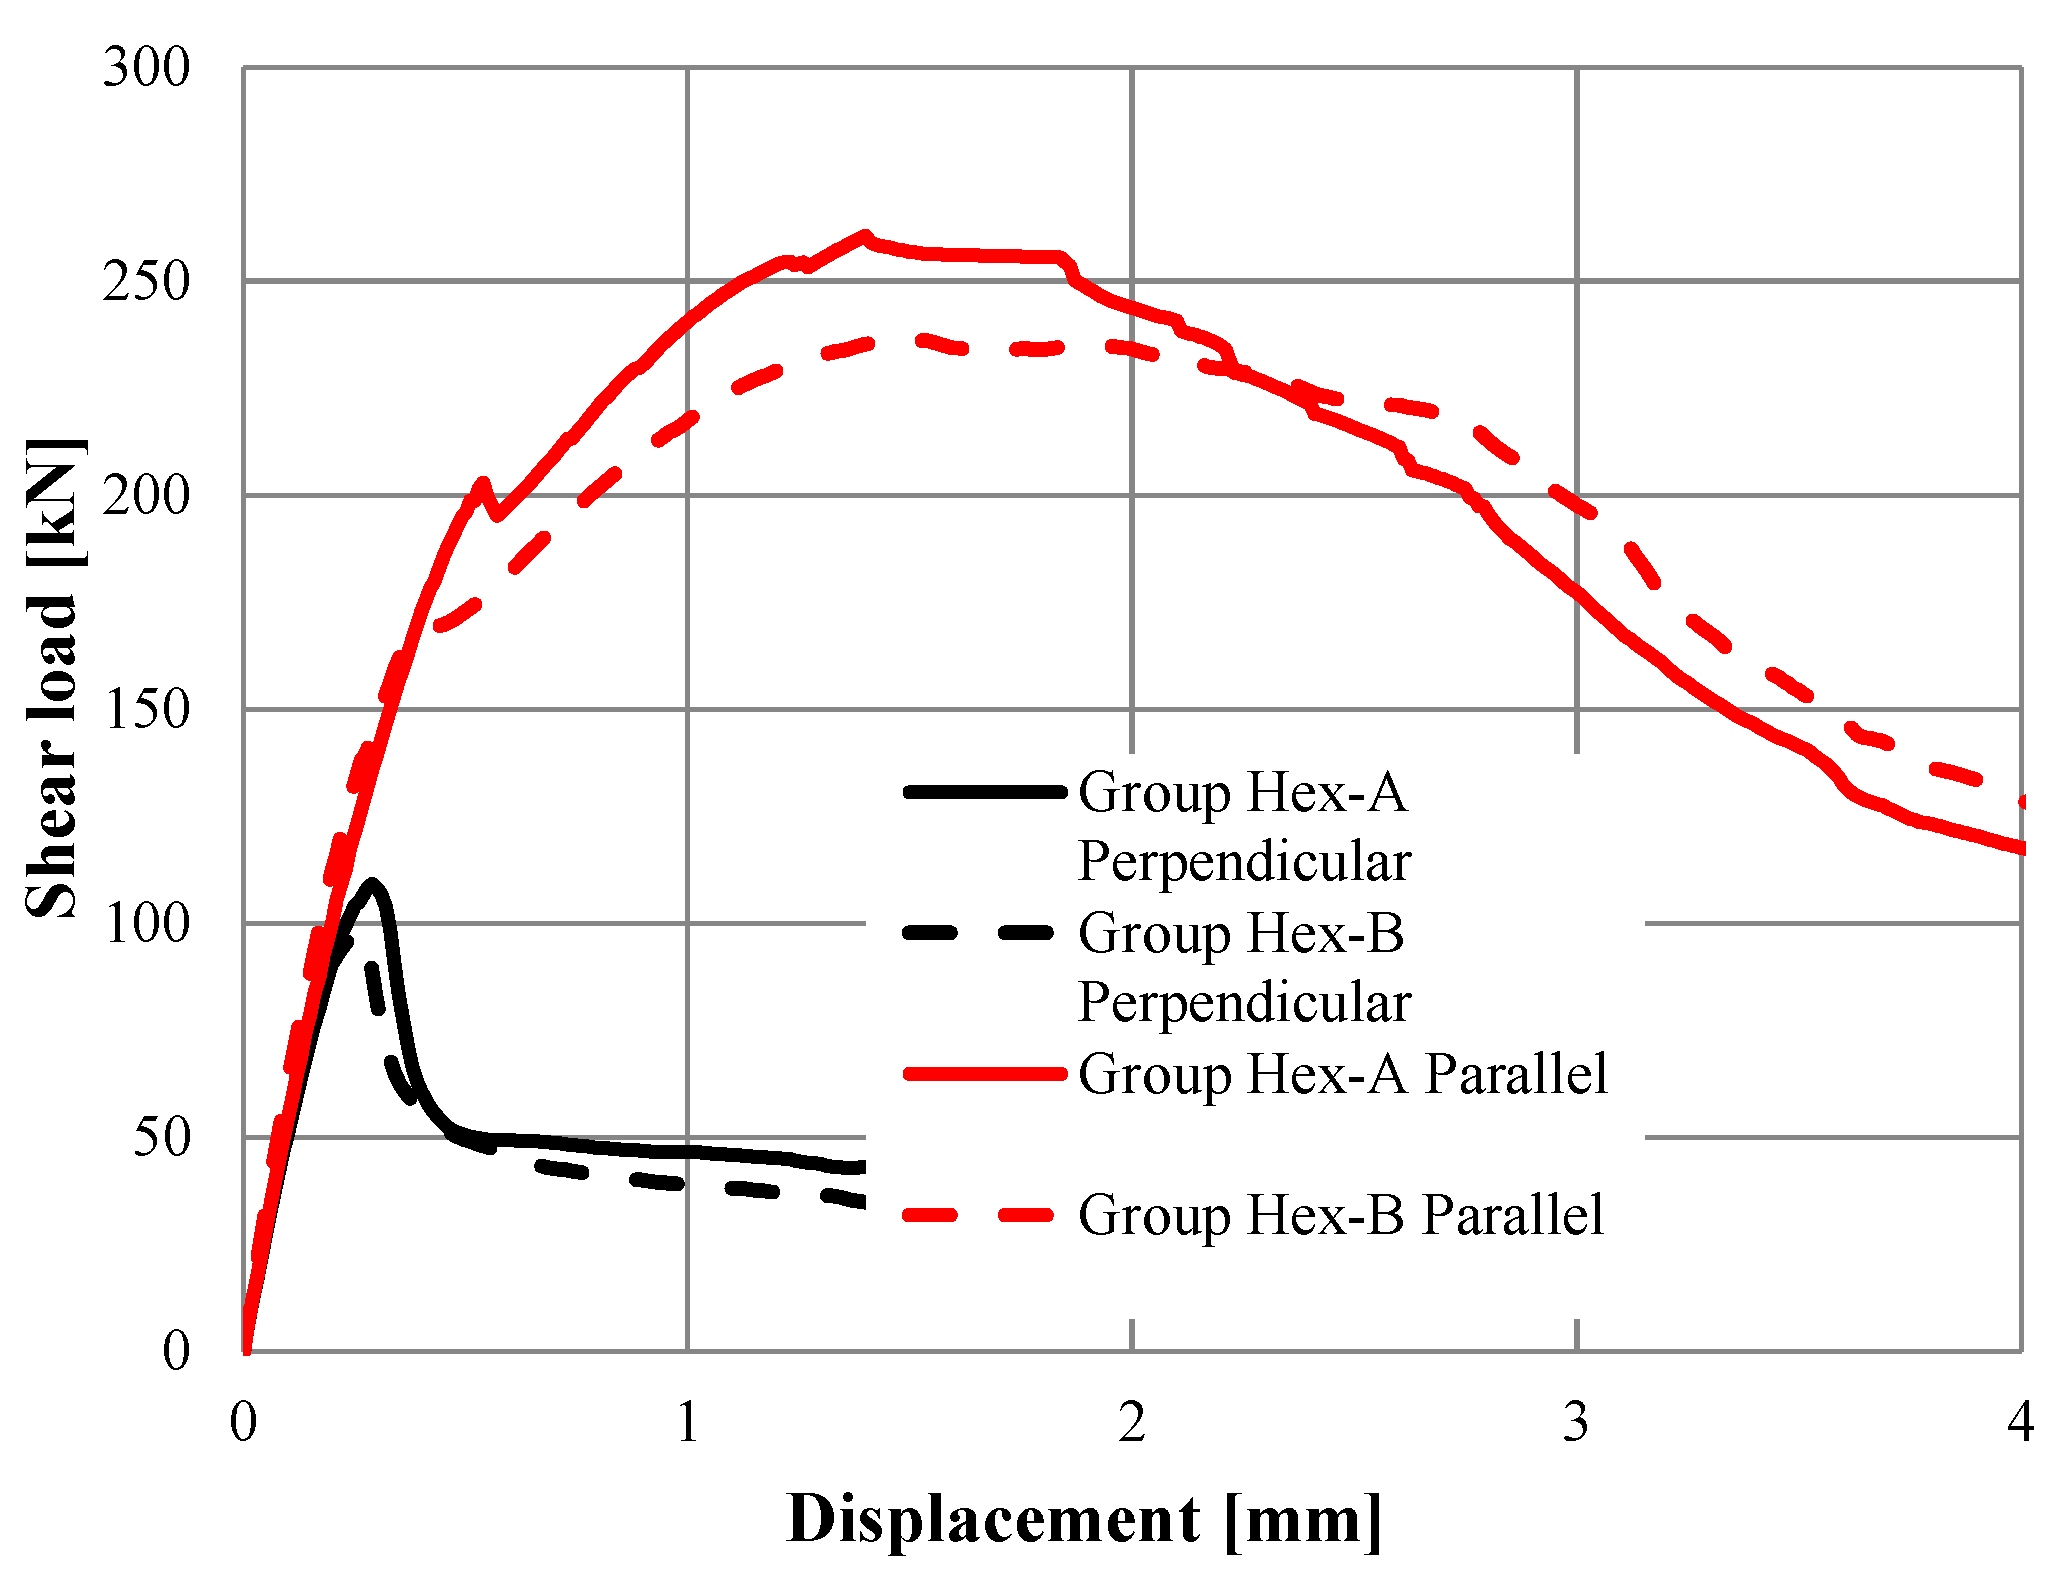
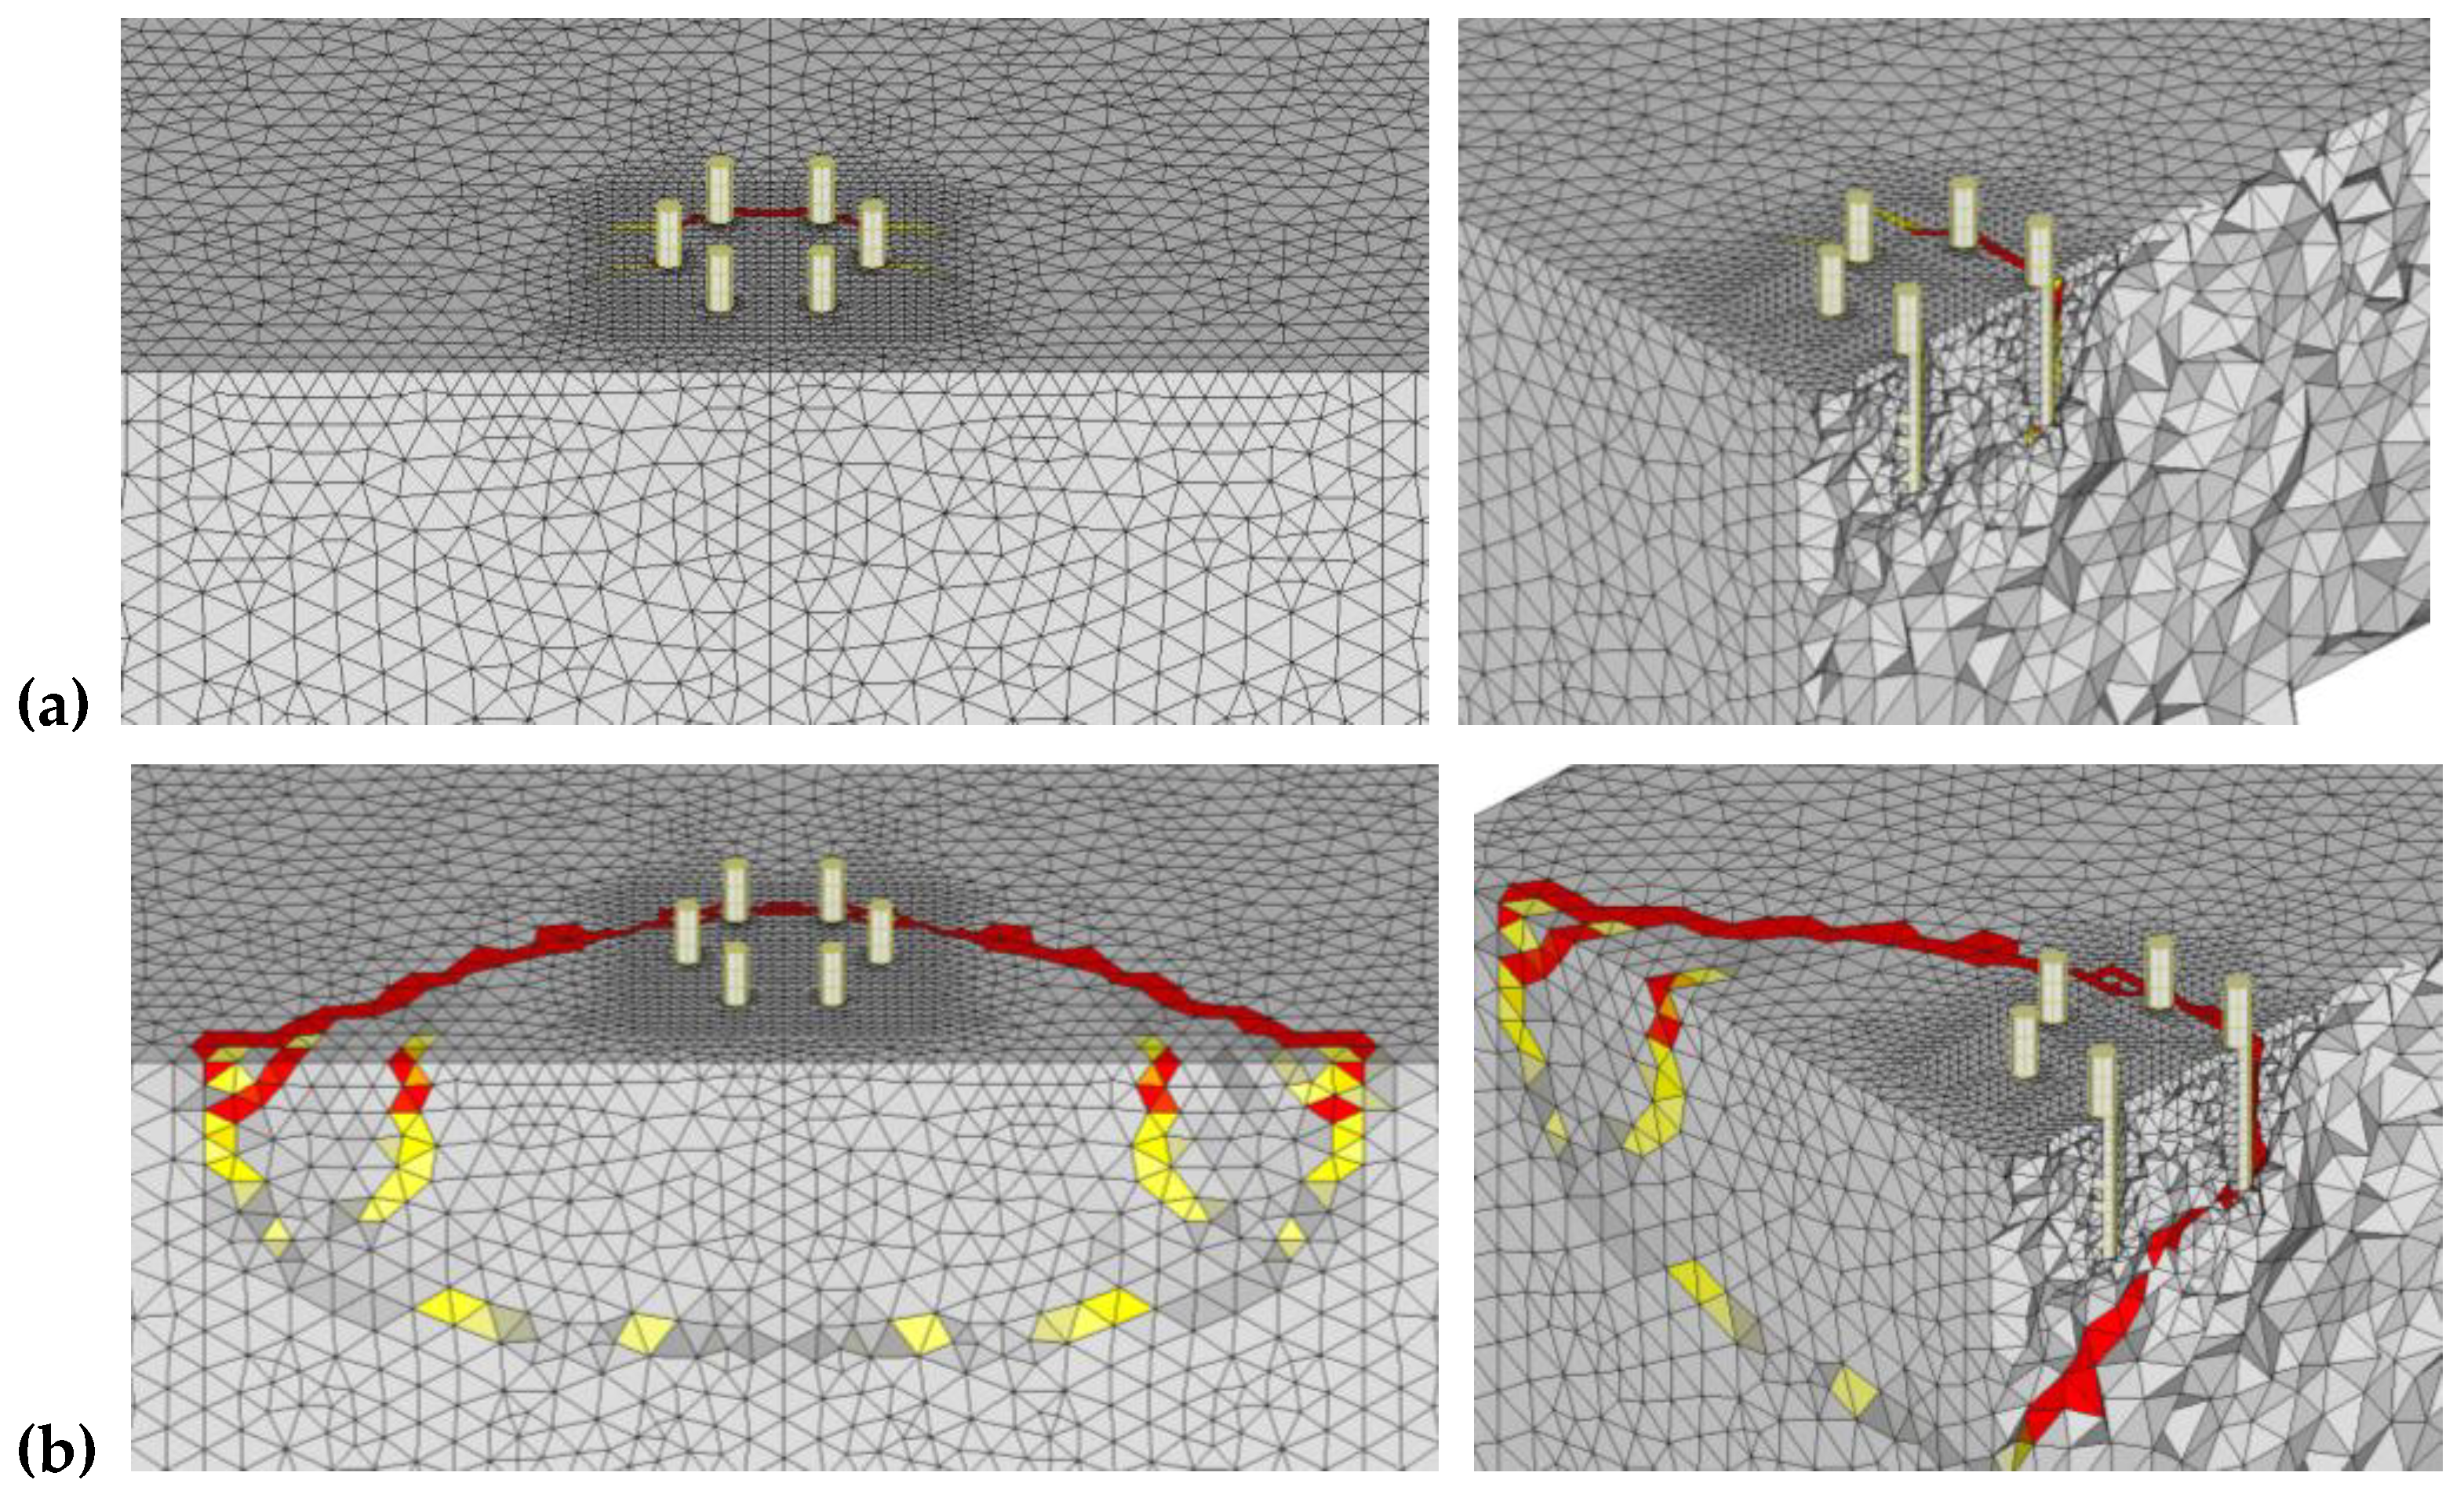
3.2. Hexagonal Anchor Groups
3.2.1. Group Hex-A
3.2.2. Group Hex-B
4. Comparison with Analytical Models
5. Summary and Conclusions
Author Contributions
Funding
Institutional Review Board Statement
Informed Consent Statement
Data Availability Statement
Conflicts of Interest
References
- EN 1992-4. Eurocode 2: Design of Concrete Structures—Part 4: Design of Fastenings for Use in Concrete; European Committee for Standardization (CEN): Brussels, Belgium, 2018. [Google Scholar]
- ACI 318. Building Code Requirements for Structural Concrete (ACI 318-19) and Commentary (ACI 318R-19); American Concrete Institute: Farmington Hills, MI, USA, 2019. [Google Scholar]
- Fédération Internationale du Béton: Design of Anchorages in Concrete: Part I-V; International Federation for Structural Concrete: Lausanne, Switzerland, 2011.
- Eligehausen, R.; Mallée, R.; Silva, J.F. Anchorage in Concrete Construction; Ernst & Sohn: Berlin, Germany, 2006. [Google Scholar]
- Fuchs, W.; Eligehausen, R.; Breen, J.E. Concrete Capacity Design (CCD) Approach for Fastening to Concrete. ACI Struct. J. 1995, 92, 73–94. [Google Scholar]
- Hofmann, J. Tragverhalten und Bemessung von Befestigungen unter Beliebiger Quer-Belastung in Ungerissenem Beton. Ph.D. Thesis, Institute of Construction Materials, University of Stuttgart, Stuttgart, Germany, January 2005. [Google Scholar]
- Sharma, A.; Eligehausen, R.; Asmus, J. Experimental investigations on concrete edge failure of multiple row anchorages with supplementary reinforcement. Struct. Concr. 2017, 18, 153–163. [Google Scholar] [CrossRef]
- Sharma, A.; Eligehausen, R.; Asmus, J. Comprehensive experimental investigations on anchorages with supplementary reinforcement. In Proceedings of the 3rd International Symposium on Connections between Steel and Concrete, Stuttgart, Germany, 27–29 September 2017. [Google Scholar]
- Grosser, P. Load-Bearing Behavior and Design of Anchorages Subjected to Shear and Torsion Loading in Uncracked Concrete. Ph.D. Thesis, Institute of Construction Materials, University of Stuttgart, Stuttgart, Germany, January 2012. [Google Scholar]
- Cook, R.A.; Halcovage, K.M.; Ansley, M.H. Anchor Embedment Requirement for Signal/Sign Structures. Ph.D. Thesis, University of Florida, Gainesville, FL, USA, July 2007. [Google Scholar]
- Bokor, B.; Sharma, A.; Hofmann, J. Experimental investigations on concrete cone failure of rectangular and nonrectangular anchor groups. Eng. Struct. 2019, 188, 202–217. [Google Scholar] [CrossRef]
- Bokor, B.; Sharma, A.; Hofmann, J. Spring modeling approach for evaluation and design of tension loaded anchor groups in case of concrete cone failure. Eng. Struct. 2019, 197, 109414. [Google Scholar] [CrossRef]
- Bokor, B.; Sharma, A.; Hofmann, J. Experimental investigations on the concrete edge failure of shear loaded anchor groups of rectangular and non-rectangular configurations. Eng. Struct. 2020, 222, 111153. [Google Scholar] [CrossRef]
- Bokor, B. Nonlinear Spring Modeling Approach for the Evaluation of Anchor Groups. Ph.D. Thesis, Institute of Construction Materials, University of Stuttgart, Stuttgart, Germany, 2021. [Google Scholar]
- Unterweger, A.; Spyridis, P.; Mihala, R.; Bergmeister, K. Shear Loaded Quadruple Fastenings Close to edge—Experimental and Numerical Analysis. Beton Stahlbetonbau 2008, 1013, 741–747. [Google Scholar] [CrossRef]
- Lachinger, S.; Bergmeister, K. Randnahe Mehrfachbefestigungen unter kombinierter Belastung. Beton Stahlbetonbau 2014, 109, 334–343. [Google Scholar] [CrossRef]
- Szeląg, M. Development of Cracking Patterns in Modified Cement Matrix with Microsilica. Materials 2018, 11, 1928. [Google Scholar] [CrossRef] [PubMed] [Green Version]
- Ožbolt, J.; Li, Y.; Kožar, I. Microplane model for concrete with relaxed kinematic constraint. Int. J. Solids Struct. 2001, 38, 2683–2711. [Google Scholar] [CrossRef]
- Bažant, Z.P.; Oh, B.H. Efficient numerical integration on the surface of a sphere. Z. Angewandete Math. Mech. 1986, 66, 37–49. [Google Scholar] [CrossRef]
- Bažant, Z.P.; Oh, B.H. Crack band theory for fracture of concrete. Matériaux Constr. 1983, 16, 155–177. [Google Scholar] [CrossRef] [Green Version]
- Schmid, K. Tragverhalten und Bemessung von Befestigungen am Bauteilrand mit Rückhängebewehrung unter Querlasten Rechtwenklig zum Rand (Behavior and Design of Anchorages on the Edge with Supplementary Reinforcement under Shear Loads Perpendicular to the Edge). Ph.D. Thesis, Institute of Construction Materials, University of Stuttgart, Stuttgart, Germany, 2010. [Google Scholar]
- Fichtner, S. Untersuchungen zum Tragverhalten von Gruppenbefestigungen unter Berücksichtigung der Ankerplattendicke und einer Mörtelschicht (Investigation of the Load-Bearing Behavior of Group Fastenings Taking into Account the Anchor Plate Thickness and a Mortar Layer). Ph.D. Thesis, Institute of Construction Materials, University of Stuttgart, Stuttgart, Germany, 2011. [Google Scholar]
- Tóth, M.; Sharma, A.; Hofmann, J. Influence of impact preloading on the residual concrete cone capacity. In Proceedings of the 3rd International Symposium on Connections between Steel and Concrete (ConSC 2017), Stuttgart, Germany, 27–29 September 2017. [Google Scholar]
- Ruta, D. Numerical and Experimental Study of Concrete Structures Exposed to Impact and Fire. Ph.D. Thesis, Institute of Construction Materials, University of Stuttgart, Stuttgart, Germany, 2018. [Google Scholar]
- Jebara, K.; Ožbolt, J.; Sharma, A. Pryout capacity of headed stud anchor groups with stiff base plate: 3D finite element analysis. Struct. Concr. 2020, 21, 905–916. [Google Scholar] [CrossRef]
- Tian, K. Concrete Failure of Headed Stud Fasteners Exposed to Fire and Loaded in Shear: Experimental and Numerical Study. Ph.D. Thesis, Institute of Construction Materials, University of Stuttgart, Stuttgart, Germany, 2019. [Google Scholar]
- Tóth, M.; Bokor, B.; Sharma, A. Numerical study on closely spaced anchor groups of identical configurations under centric tension loading. Eng. Struct. 2020, 224, 111245. [Google Scholar] [CrossRef]
- Karihaloo, B.L. Fracture Mechanics and Structural Concrete; Longman Scientific and Technical Publishers: London, UK; John Wiley: Hoboken, NJ, USA, 1995; ISBN 0-582-21582-X. [Google Scholar]
- Tian, K.; Ožbolt, J.; Sharma, A.; Hofmann, J. Experimental study on concrete edge failure of single headed stud anchors after fire exposure. Fire Saf. J. 2018, 96, 176–188. [Google Scholar] [CrossRef]
- Anderson, N.S.; Meinheit, D.F. A review of headed-stud design criteria in the sixth edition of the PCI design handbook. PCI J. 2007, 52, 2–20. [Google Scholar] [CrossRef] [Green Version]
- Grosser, P.; Cook, R. Load-Bearing Behavior of Anchor Groups Arranged Perpendicular to the Edge and Loaded by Shear Towards the Free Edge. Ph.D. Thesis, Department of Civil and Coastal Engineering, University of Florida, Gainesville, FL, USA, 2009. [Google Scholar]


| Series ID | Anchor Configuration | Edge Distance of the Corresponding Anchor Row [mm] | Anchor Spacing, s [mm] | |||
|---|---|---|---|---|---|---|
| c11 | c12 | c13 | c14 | |||
| Tri-A |  | 120 | 240 | - | - | 139 |
| Tri-B |  | 120 | 240 | - | - | 139 |
| Hex-A |  | 101 | 171 | 240 | - | 80 |
| Hex-B |  | 80 | 120 | 200 | 240 | 80 |
| Series ID | Failure Load from Numerical Analysis, Vu,num [kN] | Analytical Mean Failure Loads, Vu,calc | Ratio Vu,num/Vu,calc | ||
|---|---|---|---|---|---|
| EN1992-4 [1] [kN] | Fib Bull. 58 [3] [kN] | EN1992-4 [1] [-] | Fib Bull. 58 [3] [-] | ||
| Tri-A | 96.8 | 49.5 | 88.4 | 1.96 | 1.10 |
| Tri-B | 107.9 | 35.7 | 105.4 | 3.02 | 1.02 |
| Hex-A | 109.2 | 21.4 | 88.4 | 5.10 | 1.24 |
| Hex-B | 97.8 | 36.3 | 98.2 | 2.69 | 1.00 |
| Series ID | Failure Load From Numerical Analysis, Vu,num [kN] | Analytical Mean Failure Loads, Vu,calc | Ratio Vu,num/Vu,calc | ||
|---|---|---|---|---|---|
| EN1992-4 [1] [kN] | Fib Bull. 58 [3] [kN] | EN1992-4 [1] [-] | Fib Bull. 58 [3] [-] | ||
| Tri-A | 213.4 | 99.0 | 176.8 | 2.16 | 1.21 |
| Tri-B | 230.4 | 71.4 | 210.8 | 3.23 | 1.09 |
| Hex-A | 260.7 | 42.8 | 176.8 | 6.09 | 1.47 |
| Hex-B | 236.2 | 72.6 | 196.4 | 3.25 | 1.20 |
Publisher’s Note: MDPI stays neutral with regard to jurisdictional claims in published maps and institutional affiliations. |
© 2021 by the authors. Licensee MDPI, Basel, Switzerland. This article is an open access article distributed under the terms and conditions of the Creative Commons Attribution (CC BY) license (https://creativecommons.org/licenses/by/4.0/).
Share and Cite
Bokor, B.; Sharma, A. Numerical Investigations on Non-Rectangular Anchor Groups under Shear Loads Applied Perpendicular or Parallel to an Edge. CivilEng 2021, 2, 692-711. https://doi.org/10.3390/civileng2030038
Bokor B, Sharma A. Numerical Investigations on Non-Rectangular Anchor Groups under Shear Loads Applied Perpendicular or Parallel to an Edge. CivilEng. 2021; 2(3):692-711. https://doi.org/10.3390/civileng2030038
Chicago/Turabian StyleBokor, Boglárka, and Akanshu Sharma. 2021. "Numerical Investigations on Non-Rectangular Anchor Groups under Shear Loads Applied Perpendicular or Parallel to an Edge" CivilEng 2, no. 3: 692-711. https://doi.org/10.3390/civileng2030038
APA StyleBokor, B., & Sharma, A. (2021). Numerical Investigations on Non-Rectangular Anchor Groups under Shear Loads Applied Perpendicular or Parallel to an Edge. CivilEng, 2(3), 692-711. https://doi.org/10.3390/civileng2030038