Article

Numerical Investigations on Non-Rectangular Anchor Groups under Shear Loads Applied Perpendicular or Parallel to an Edge

1
Fischerwerke GmbH & Co. KG, Klaus-Fischer-Str. 1, 72178 Waldachtal, Germany
2
Institute of Construction Materials, University of Stuttgart, Pfaffenwaldring 4G, 70569 Stuttgart, Germany
*
Author to whom correspondence should be addressed.
CivilEng 2021, 2(3), 692-711; https://doi.org/10.3390/civileng2030038
Submission received: 5 July 2021 / Revised: 11 August 2021 / Accepted: 24 August 2021 / Published: 28 August 2021
(This article belongs to the Special Issue Connections in Concrete Volume 2)

Abstract

:
Anchorages of non-rectangular configuration, though not covered by current design codes, are often used in practice due to functional or architectural needs. Frequently, such anchor groups are placed close to a concrete edge and are subjected to shear loads. The design of such anchorages requires engineering judgement and no clear rules are given in the codes and standards. In this work, numerical investigations using a nonlinear 3D FE analysis code are carried out on anchor groups with triangular and hexagonal anchor patterns to understand their behavior under shear loads. A microplane model with relaxed kinematic constraint is utilized as the constitutive law for concrete. Two different orientations are considered for both triangular and hexagonal anchor groups while no hole clearance is considered in the analysis. Two loading scenarios are investigated: (i) shear loading applied perpendicular and towards the edge; and (ii) shear loading applied parallel to the edge. The results of the analyses are evaluated in terms of the load-displacement behavior and failure modes. A comparison is made between the results of the numerical simulations and the analytical calculations according to the current approaches. It is found that, similar to the rectangular anchorages, and also for such non-rectangular anchorages without hole clearance, it may be reasonable to calculate the concrete edge breakout capacity by assuming a failure crack from the back anchor row. Furthermore, the failure load of the investigated groups loaded in shear parallel to the edge may be considered as twice the failure load of the corresponding groups loaded in shear perpendicular to the edge.

1. Introduction

The current standards and guidelines for the design of anchorages in concrete construction such as EN1992-4 [1], ACI 318 [2], or fib Bulletin 58 [3] provide direct design guidance only for anchor groups with rectangular anchor pattern and maximum three anchors in a row. This is primarily due to the fact that the current provisions for the design of anchorages are based largely on semi-empirical formulations and therefore, must be limited to the scope of the tests they are calibrated and validated for [4]. Anchorages are designed to transfer tension and shear forces in concrete that result from any combination of applied loads on the component connected by the anchorage. The concrete breakout failure modes often dominate the design of anchorages especially when the anchorage is placed close to an edge. The design of anchorages loaded in shear perpendicular and towards the edge, against concrete edge breakout, is performed following the CCD method [5,6]. For the anchorages where the shear load is applied parallel to the edge or inclined to the edge, a modification factor is used to calculate the resistance [1,6].
Although the design of non-rectangular anchorages is not covered explicitly by the codes and standards, they are rather frequently used in practice due to functional or architectural requirements. In particular, anchorages with six or more anchors arranged in a circular pattern or three anchors in a triangular pattern are commonly used (Figure 1). The design of these anchorages is made based on the engineering judgement in absence of the clear design rules. Often, such anchorages are placed in the vicinity of an edge and therefore the concrete edge breakout failure under shear loads might govern the design capacity. For evaluation of the concrete edge breakout capacity according to the CCD method [5], the pre-judgement for where the failure crack will initiate from must be made. There is no consensus in the fastening community for the location of initiation of the failure crack even for rectangular groups [7,8,9] and no guidance is available for non-rectangular groups.
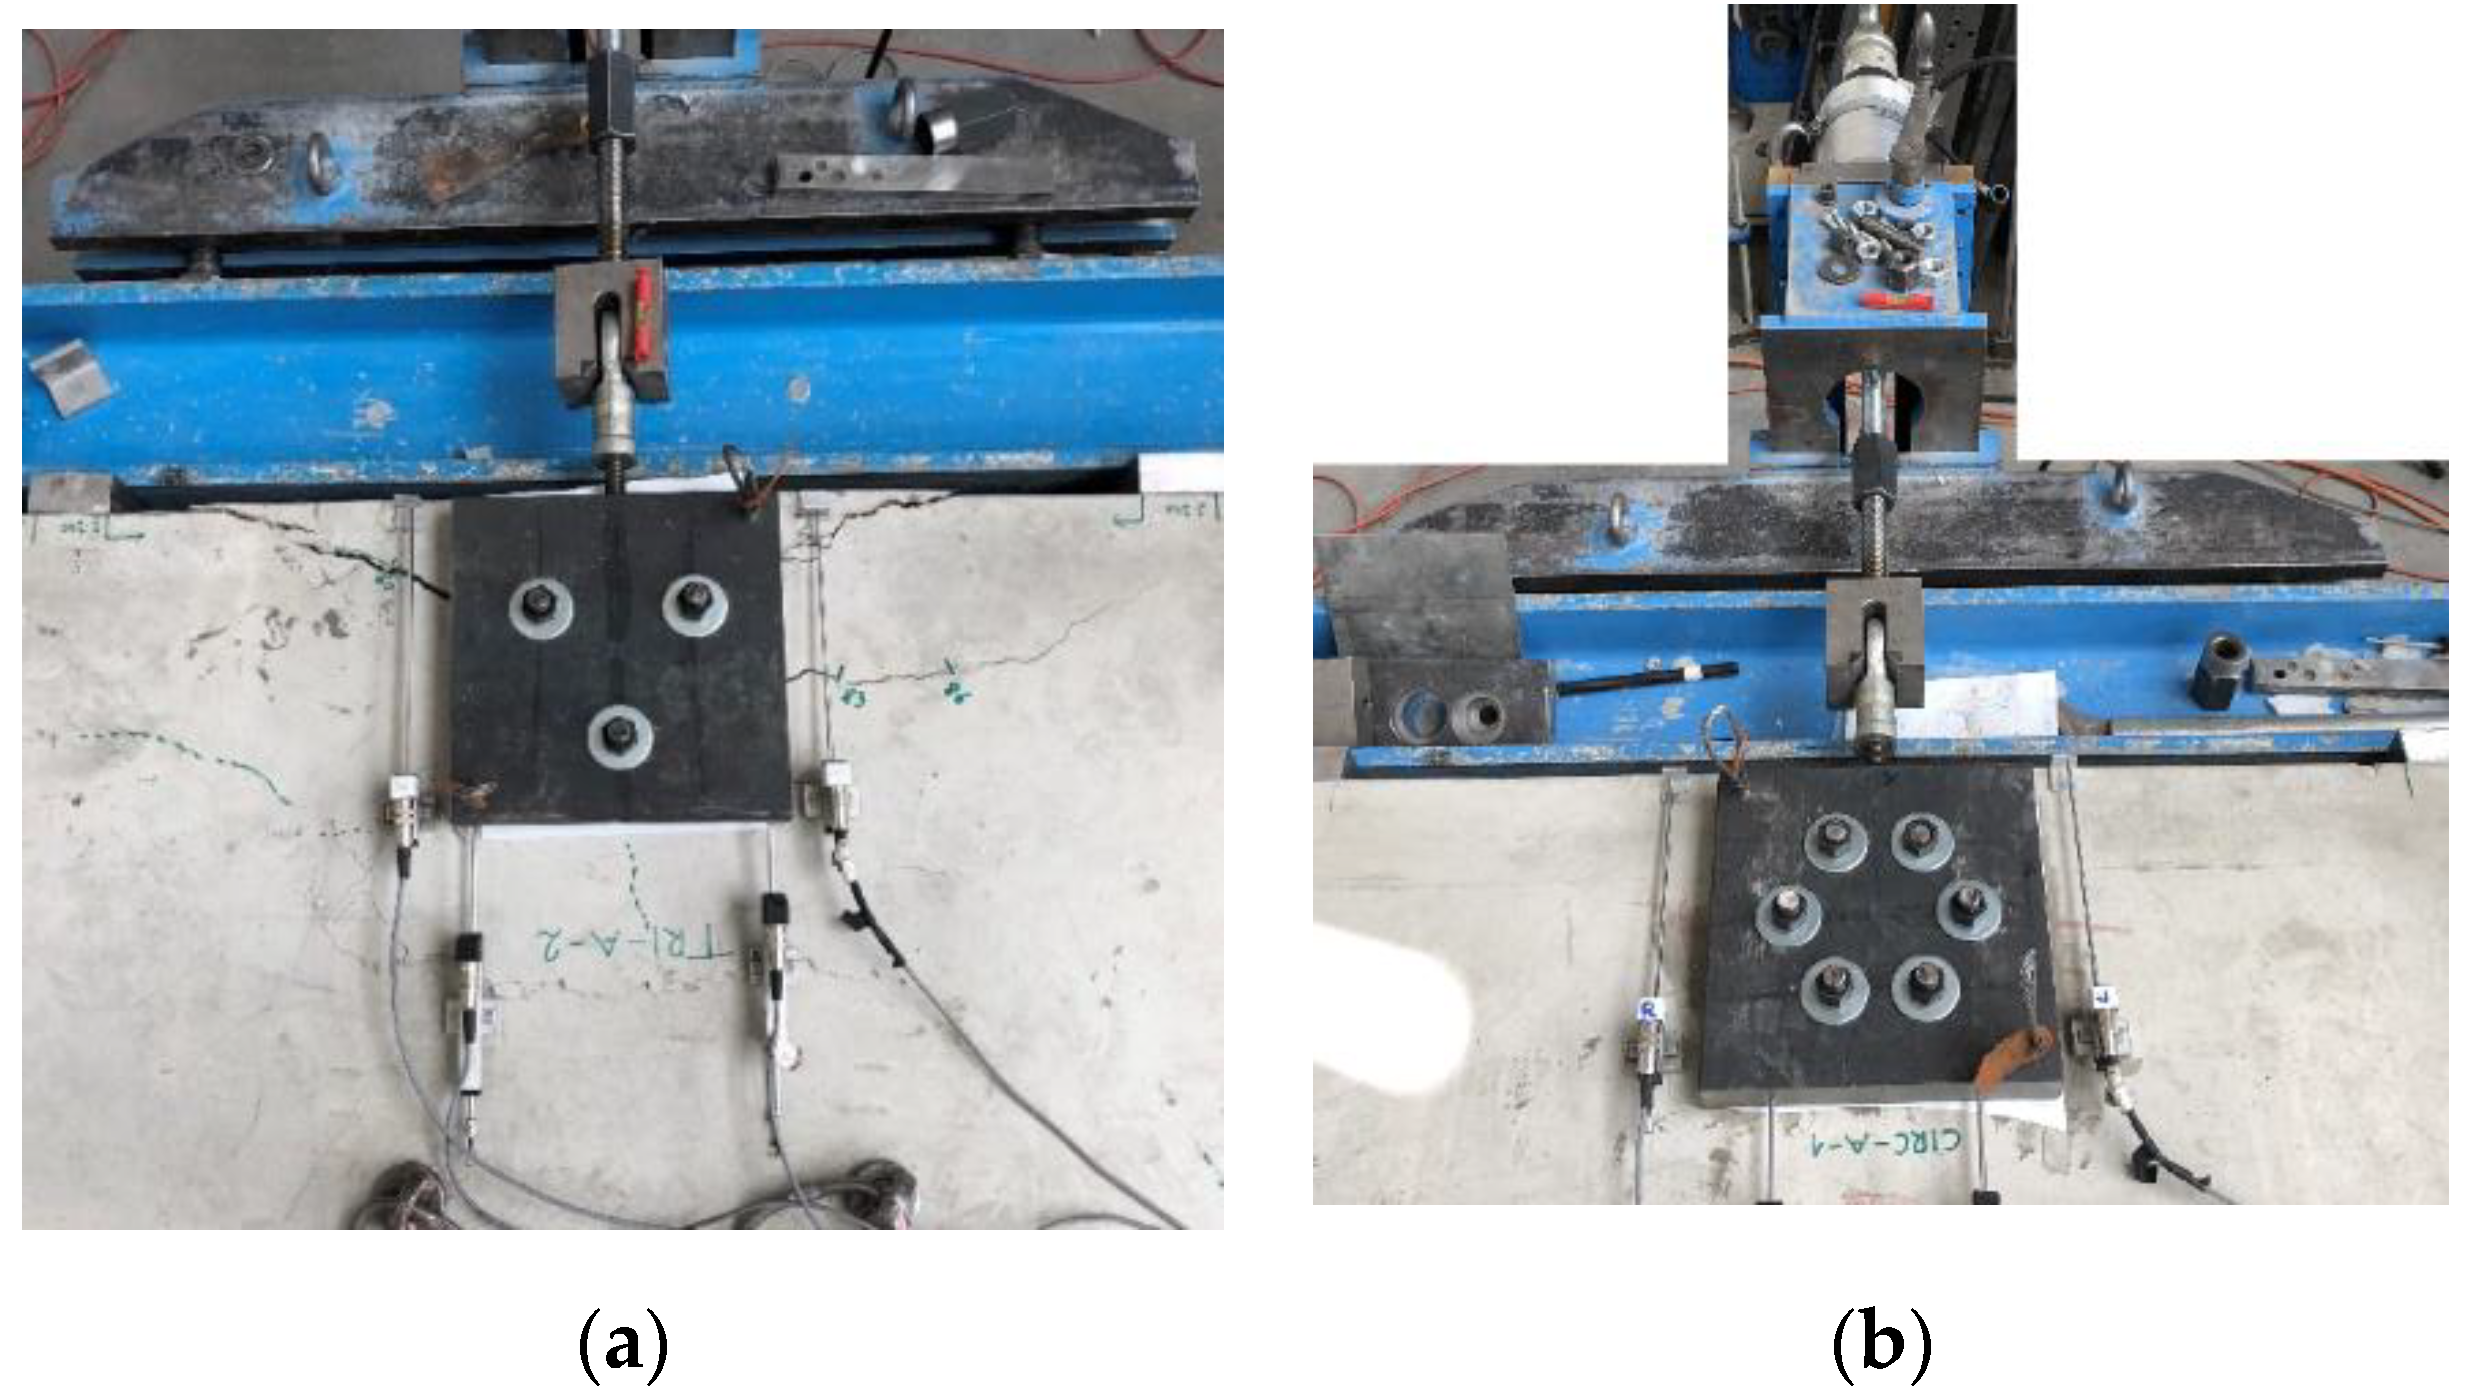
Very limited tests are available on the behavior of anchorages of non-rectangular configurations. Cook et al. [10] tested anchor groups with 12 anchors under torsion loading to simulate the conditions for anchorages of sign (billboard) structures. Bokor et al. [11] tested anchor groups of rectangular and non-rectangular configurations under tension loads based on which they developed a nonlinear spring model for the design of anchorages failing in concrete cone breakout under tension loads [12]. Furthermore, anchorages of triangular and hexagonal configurations under shear loads perpendicular to the edge were tested in [13]. The tests were carried out with bonded anchors and the annular gap between the anchor rods and the hole in the base plate was not filled. The anchorage was thereby tested with random hole clearance pattern. The typical test setup used by Bokor et al [13] is shown in Figure 2. Further details of the tests can be found in Bokor [14].
The tests were carried out for the triangular configuration with the anchor pattern as shown in Figure 2a (Tri-A: two anchors in the front and one in back row) and also turned around by 180 degrees (Tri-B: one anchor in the front and two anchors in back row). Similarly for the hexagonal groups, two configurations were tested, as shown in Figure 2b (Hex-A: two anchors in the front and back row, total three rows) and also turned by 90 degrees (Hex-B: one anchor in front and last row and two anchors in the middle rows, total four rows). It was shown that the behavior of the anchorage is strongly dependent on the anchor configuration as well as the hole clearance pattern (defined by how much annular gap exists between the anchor and the hole in the loading plate for different anchors). The influence of the hole clearance pattern on the shear behavior of anchorages were also shown by Unterweger et al. [15] and Lachinger et al. [16].
Currently, the information on the shear behavior of non-rectangular anchor groups is rather limited and the reported test results are influenced by the hole clearance (in general). The hole clearance pattern does not only govern which anchors take up the forces first but also influences the rotational stiffness of the group. To understand the behavior of the anchorages tested by Bokor et al. [13] in non-cracked concrete without the influence of hole clearance, in this work, 3D finite element numerical simulations are carried out considering a perfect connectivity between the base plate and the anchors. The numerical simulations are carried for anchorages loaded perpendicular and towards the edge as well as loaded parallel to the edge under static loads.
In the paper, the numerical program, numerical modeling procedure, and the material parameters are first described (see Section 2). The numerical modeling procedure has been validated against tests on single anchors at different edge distances by Bokor [14]. The results of the numerical analyses performed on non-rectangular anchor groups are reported and discussed in detail in Section 3. In Section 4, the results of the numerical analyses are compared with the existing analytical methods extended suitably for the anchor configurations analyzed in this work. It is found that similar to the rectangular anchorages, also for such non-rectangular anchorages without hole clearance, it may be reasonable to calculate the concrete edge breakout capacity by assuming a failure crack from the back anchor row. Furthermore, the failure load of the groups loaded in shear parallel to the edge may be considered as twice the failure load of the corresponding groups loaded in shear perpendicular to the edge.
It should be noted that the design of anchorages is generally carried out assuming cracked concrete conditions. This is since, due to the notch effect of the anchor holes, it is very likely that the anchors would be intercepted by a crack when cracks form [4]. Based on the structural and anchor configuration, however, it is very probable that only some of the anchors of a group are intercepted by a crack [13,14]. The crack patterns depend also on environmental (external) influences [17]. However, the main aim of this paper is to investigate the behavior of non-rectangular anchor groups under shear loads in non-cracked concrete and under static loads only. Additionally, it was aimed to investigate whether the current design rules could be extended for application to non-rectangular anchor group configurations as well. Therefore, the numerical investigations are carried out in non-cracked concrete by applying static shear loads without any eccentricity.

2. Numerical Investigation

2.1. Description of Cases Analyzed

The anchor groups of triangular and hexagonal configurations as tested by Bokor et al. [13] were numerically analyzed in this work. Note that in the tests, due to practical reasons, a certain hole clearance (annular gap) was always present between the anchors and the holes of the base plate. However, in the analyses, a perfect connection between the plate and the anchors is considered. The main geometric parameters for each of the four analyzed configurations are summarized in Table 1. For each case, the load was applied perpendicular to and towards the edge (as shown in the second column of Table 1) as well as parallel to the edge. The effective embedment depth of the anchors was hef = 120 mm and their nominal diameter was d = 20 mm. The base plates used for triangular groups were of size 200 mm × 200 mm and the dimensions of the plates used for hexagonal groups were 250 mm × 250 mm. The thickness of the base plate was 50 mm in every case.

2.2. Numerical Modeling

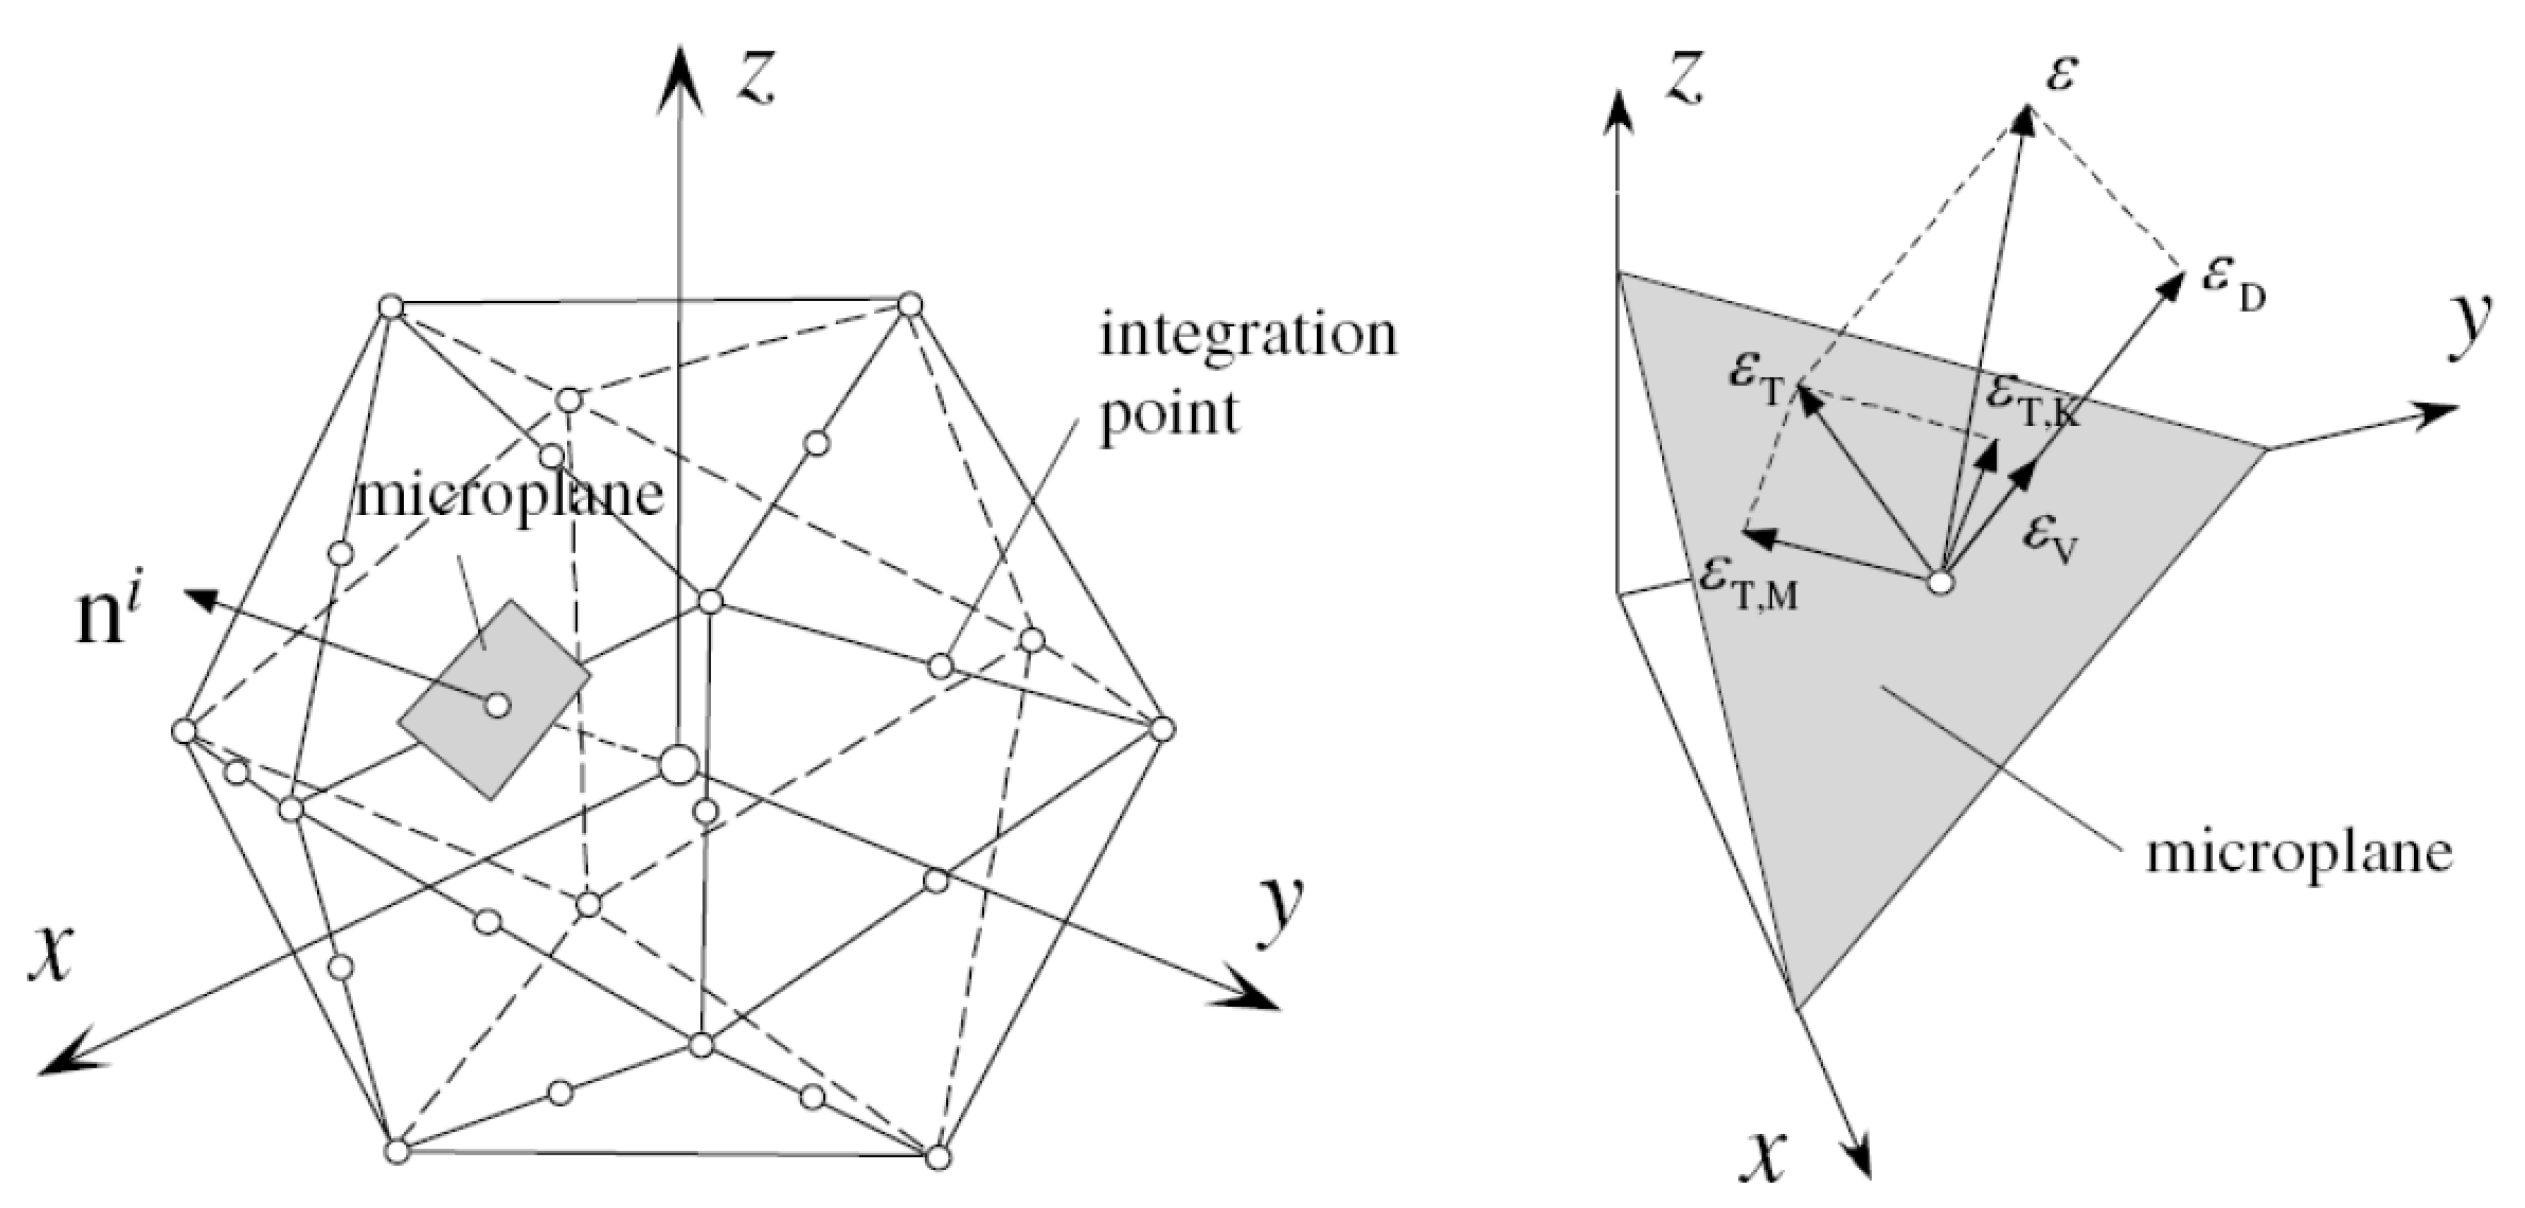
The finite element Code MASA developed at the Institute of Construction Materials, University of Stuttgart, was used to perform the nonlinear 3D numerical analyses. The software is capable of performing 3D nonlinear finite element analysis of structural elements made of quasi-brittle materials such as concrete, using a microplane model with a relaxed kinematic constraint as the constitutive law [18]. The material (concrete) is characterized by the relation between the stress and strain components on planes of various orientations (pre-defined directions) in the microplane model. The microplanes may be imagined to represent the damage or weak planes in the microstructure, such as those that exist at the contact between the aggregate and the cement matrix [18].
The microplane strains are assumed to be the projections of macroscopic strain tensor εij. On the microplane, one normal (σN; εN) and two shear stress-strain components (σK, σM; εK, εM) are considered. The normal microplane stress and strain components are further decomposed into volumetric and deviatoric parts (σN = σV + σD, εN = εV + εD) as shown in Figure 3. The microplane stresses are calculated using uniaxial constitutive laws of each microplane component (volumetric, deviatoric, and shear). In the model, the tensorial invariance restrictions do not need to be directly enforced. By employing virtual work approach, the macroscopic stress tensor is obtained as an integral over all predefined 21 microplane directions (symmetric part of the unit sphere shown in Figure 3 using Equation (1).
σ i j = σ V δ i j + 3 2 π S [ σ D ( n i n j δ i j 3 ) + σ K 2 ( k i n j + k j n i ) + σ M 2 ( m i n j + m j n i ) ] d S
where, S denotes the surface of the unit radius sphere and δij denotes Kronecker delta and ki and mi are directions of shear microplane components. It has been shown that this is an optimal number of integration points that still yields acceptable accuracy [19]. Further details of the model can be found in [18]. Damage and cracking are modeled in the framework of the smeared crack continuum. To assure the objectivity of the analysis with respect to the size of the finite elements, the crack band method is used according to Bažant and Oh [20]. For creating the 3D finite element model and for the evaluation of the numerical results, the commercial pre- and post-processing software FEMAP (Siemens) was used.
The modelling procedure used in this work has been well-proven to realistically simulate the behaviour of anchorages in concrete by various researchers in the past [14,21,22,23,24,25,26,27]. The mesh size, modelling procedure, constitutive law, etc., used in this study corresponds well with those used in the past validated investigations.
The geometry and material properties of the numerical model corresponded to the parameters used in the experiments reported in [13,14]. The length and width of the concrete block as well as the boundary conditions were kept such that full concrete edge breakout body could form in all cases. The height of the concrete block was maintained at 500 mm to allow the formation of the unrestricted concrete edge breakout body for the largest edge distance of the back anchor row (240 mm). The base plate and the anchor were considered to be rigidly connected and no hole clearance was modeled.
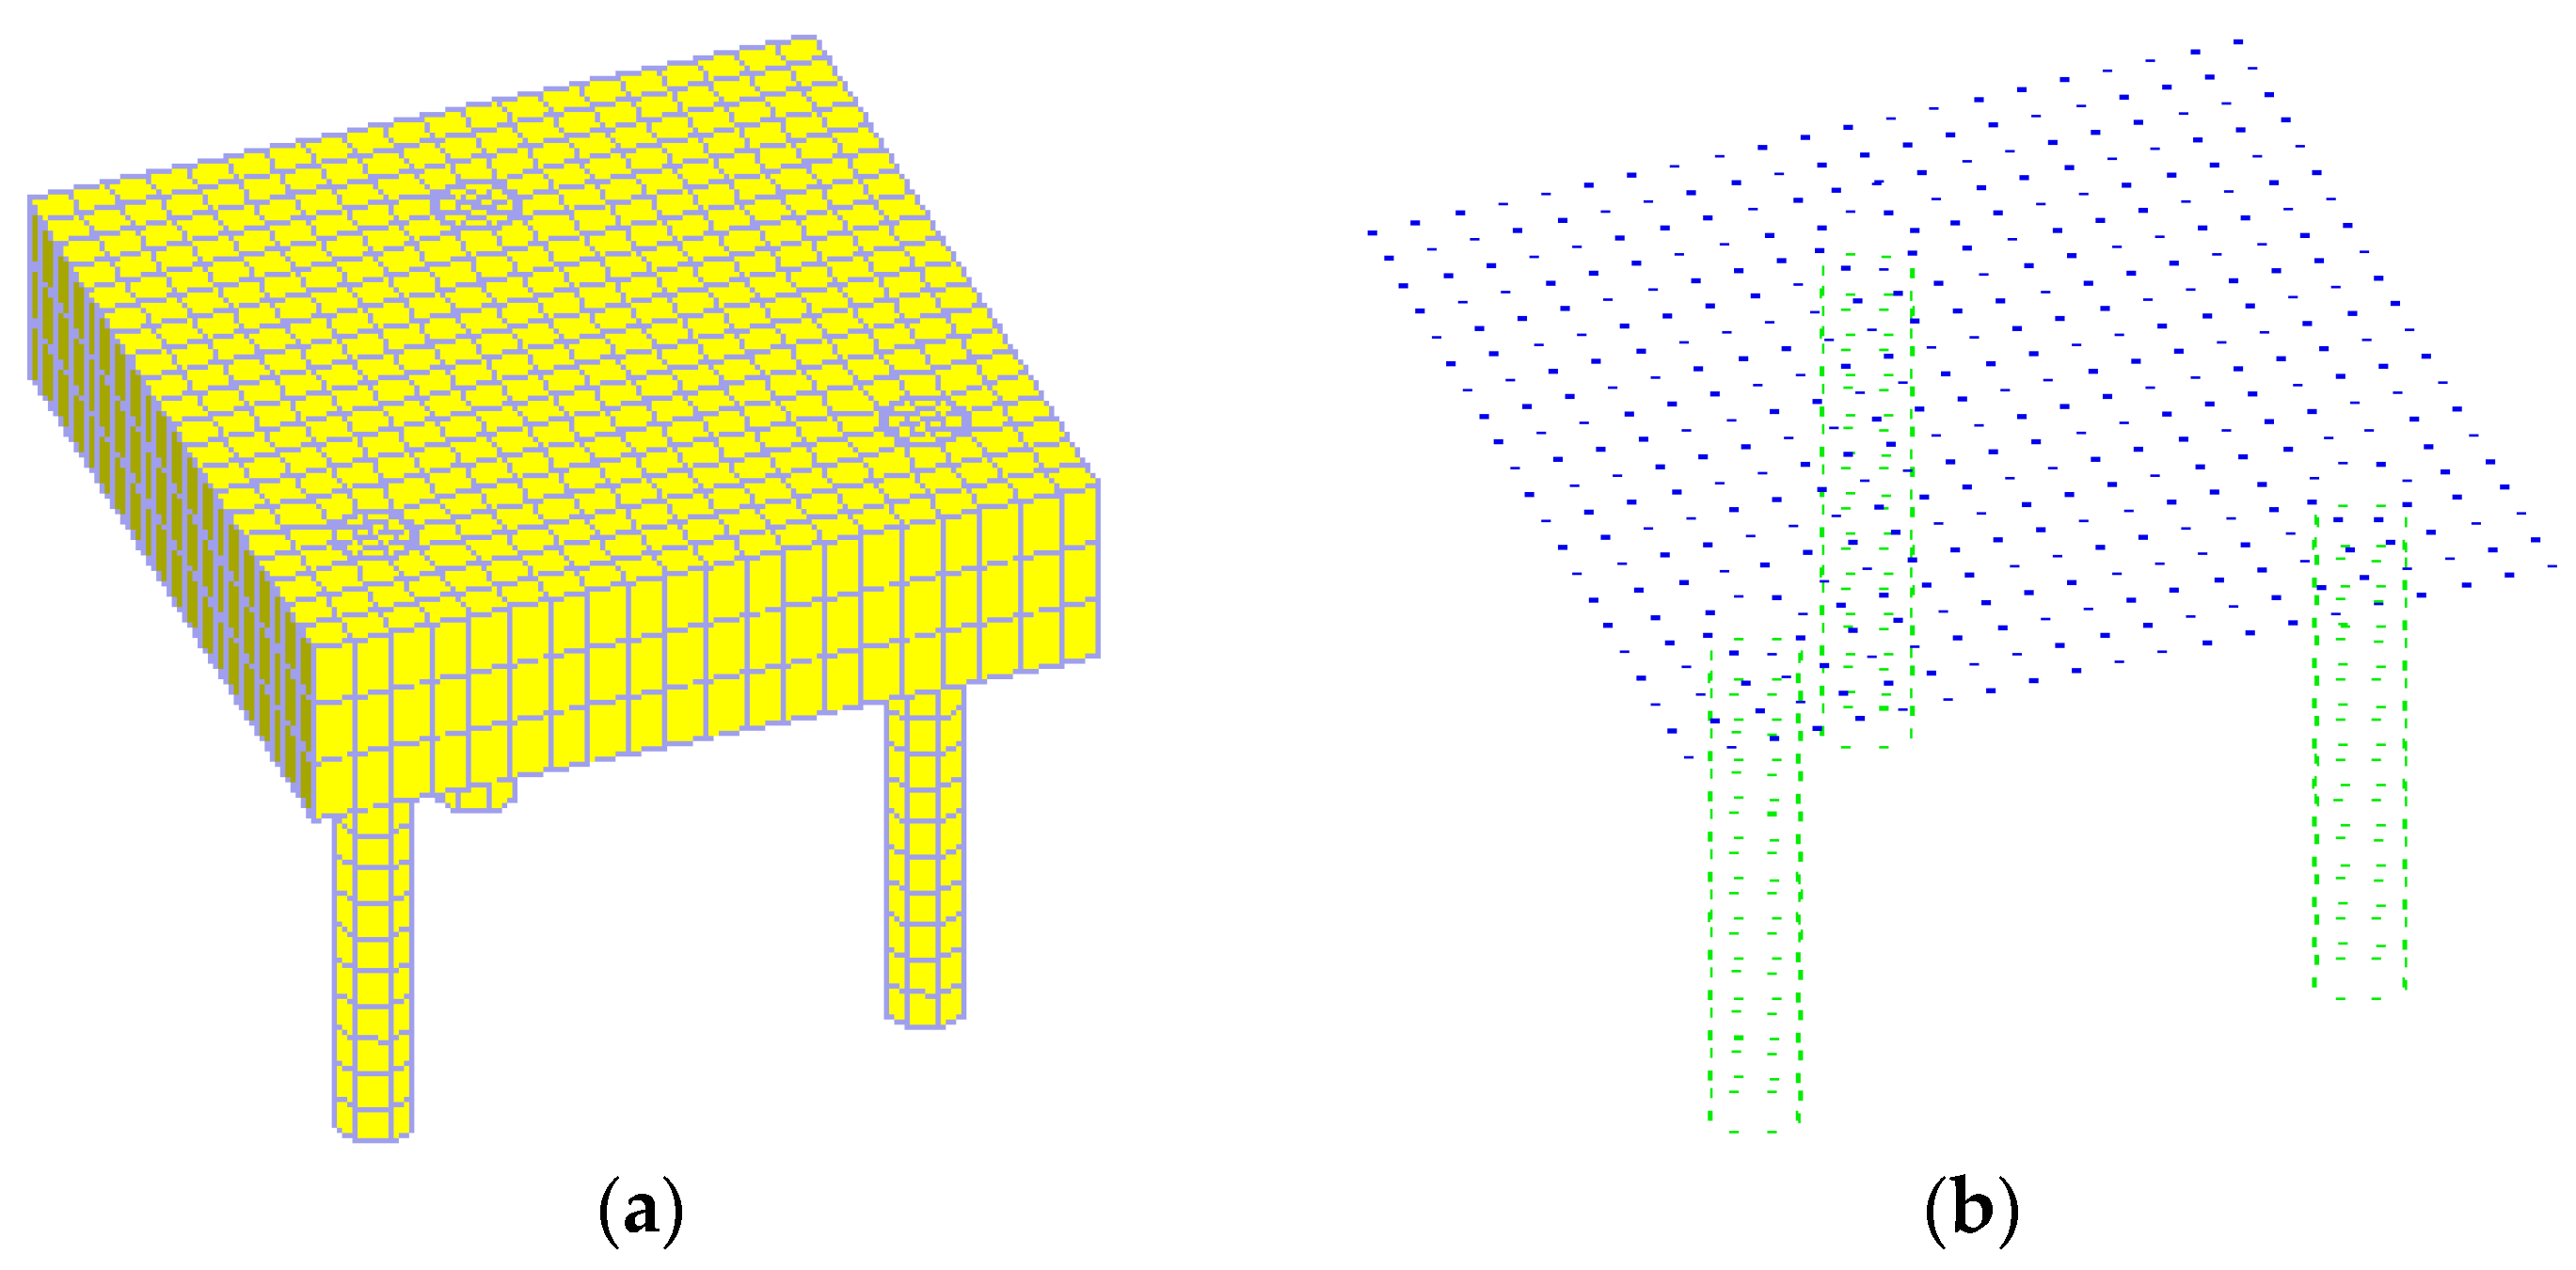
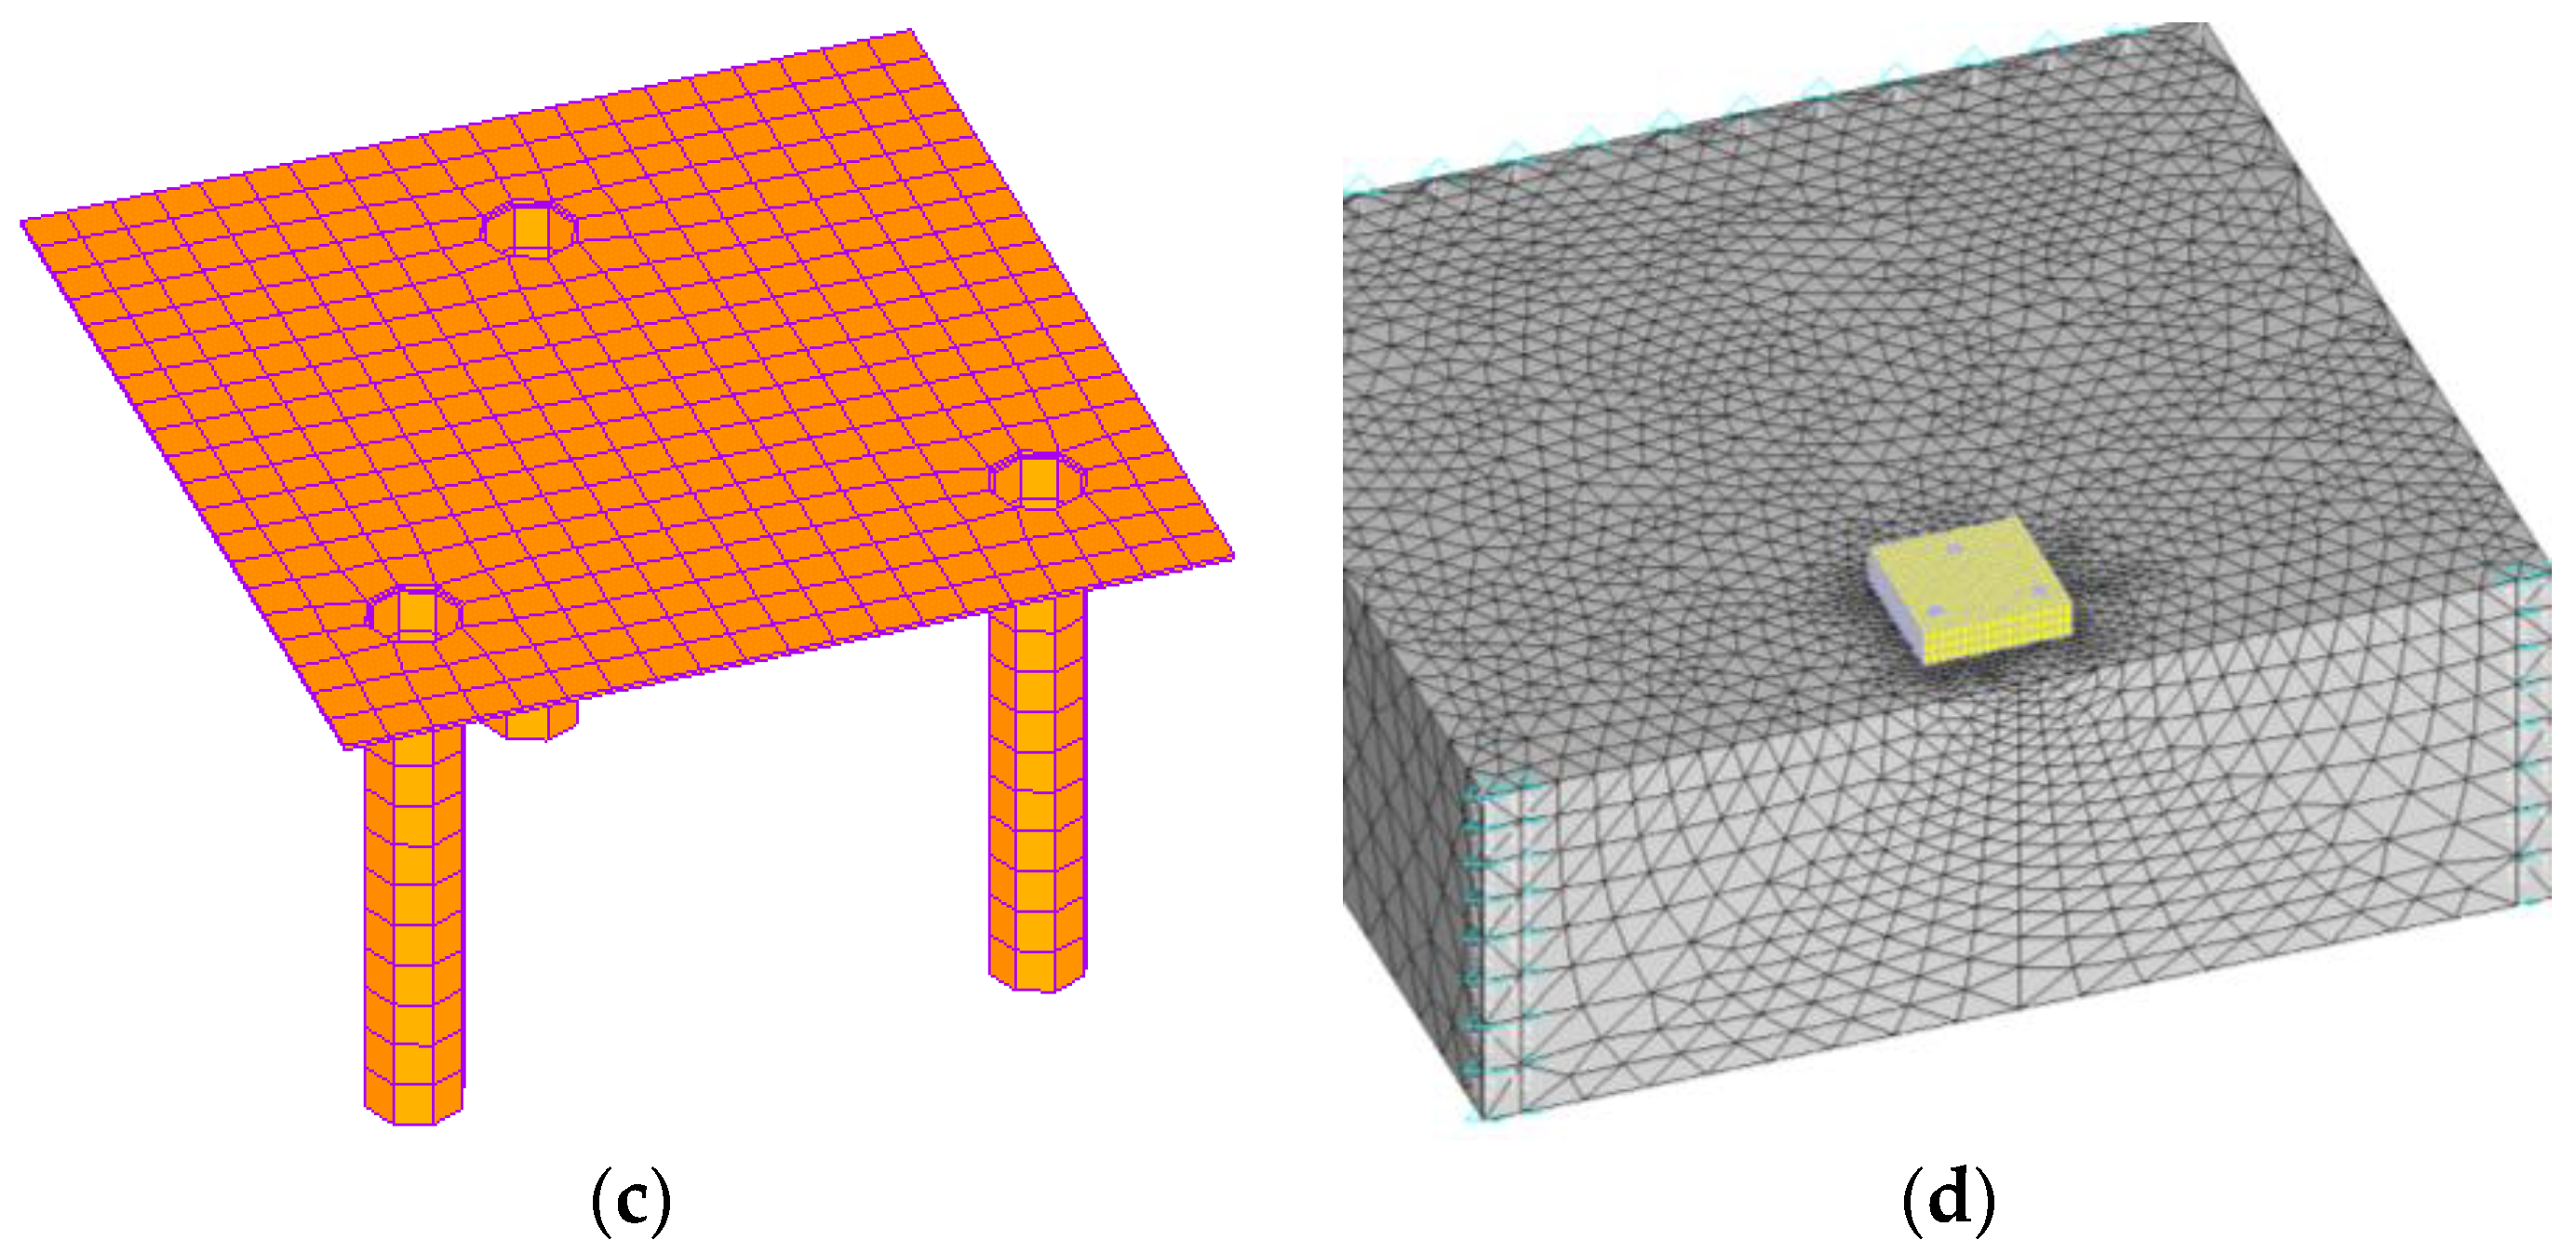
The various components of the numerical model are depicted in Figure 4 for the case of Tri-A (refer to Table 1). The concrete specimen was modeled using solid 4- node tetrahedral elements while the steel base plate and anchors (steel rods) modeled using solid 8-node hexahedral elements, contact layer between anchor and concrete, contact layer between base plate and concrete, and two types of bar elements. One type of bar elements implemented in MASA can take up both compressive and shear stresses and are used to model bond (mortar) between anchors and concrete. The other type of bar elements can transfer only compressive stresses and are used to model contact between base plate and concrete surface. Contact bar elements, which can take up only compressive stresses, were used in the interface between the concrete surface and base plate to simulate a PTFE layer, which was used in the experiments to minimize friction between steel and concrete. For the given problem, an element size of 5–10 mm is considered as optimal for realistic calculation results. To reduce the calculation time of the models, this element size was only generated in the load application areas i.e. in the area of the anchors. A mesh size of 10–30 mm was used in the regions, where no cracking was expected in the concrete.

2.3. Material Parameters

As mentioned above, the nonlinear behaviour of concrete was modelled using the microplane model for relaxed kinematic constraint [18]. The model utilizes a set of so-called microplane parameters that are derived based on the macroscopic material properties. The macroscopic concrete properties used for modelling of concrete behaviour corresponded to a cylinder compressive strength, fc = 20 MPa. The compressive strength of concrete corresponded to standard cubic compressive strength of 25 MPa and the other parameters were derived using the following expressions.
The modulus of elasticity of concrete was calculated according to ACI 318-19 as:
E c = 4730 f c = 4730 20   N mm 2 = 21150   N mm 2
The mean concrete tensile strength was calculated according to Karihaloo [28] as:
f t = 0.3 · f c 0.67 = 0.3 · 20   N mm 2 0.67 = 2.2   N mm 2
The fracture energy of the concrete was calculated according to Karihaloo [28] for a maximum grain size diameter of 16 mm, αF is assumed to be 7.
G f = α F · f c 0.7 = 7 · ( 20   N mm 2 ) 0.7 = 57   N mm 2
The Poisson’s ratio of concrete is assumed to be 0.18.
The behaviour of the base plate and the anchors were assumed to be linear elastic. The modulus of elasticity for steel was 210 GPa and the Poisson’s ratio was taken as 0.33.
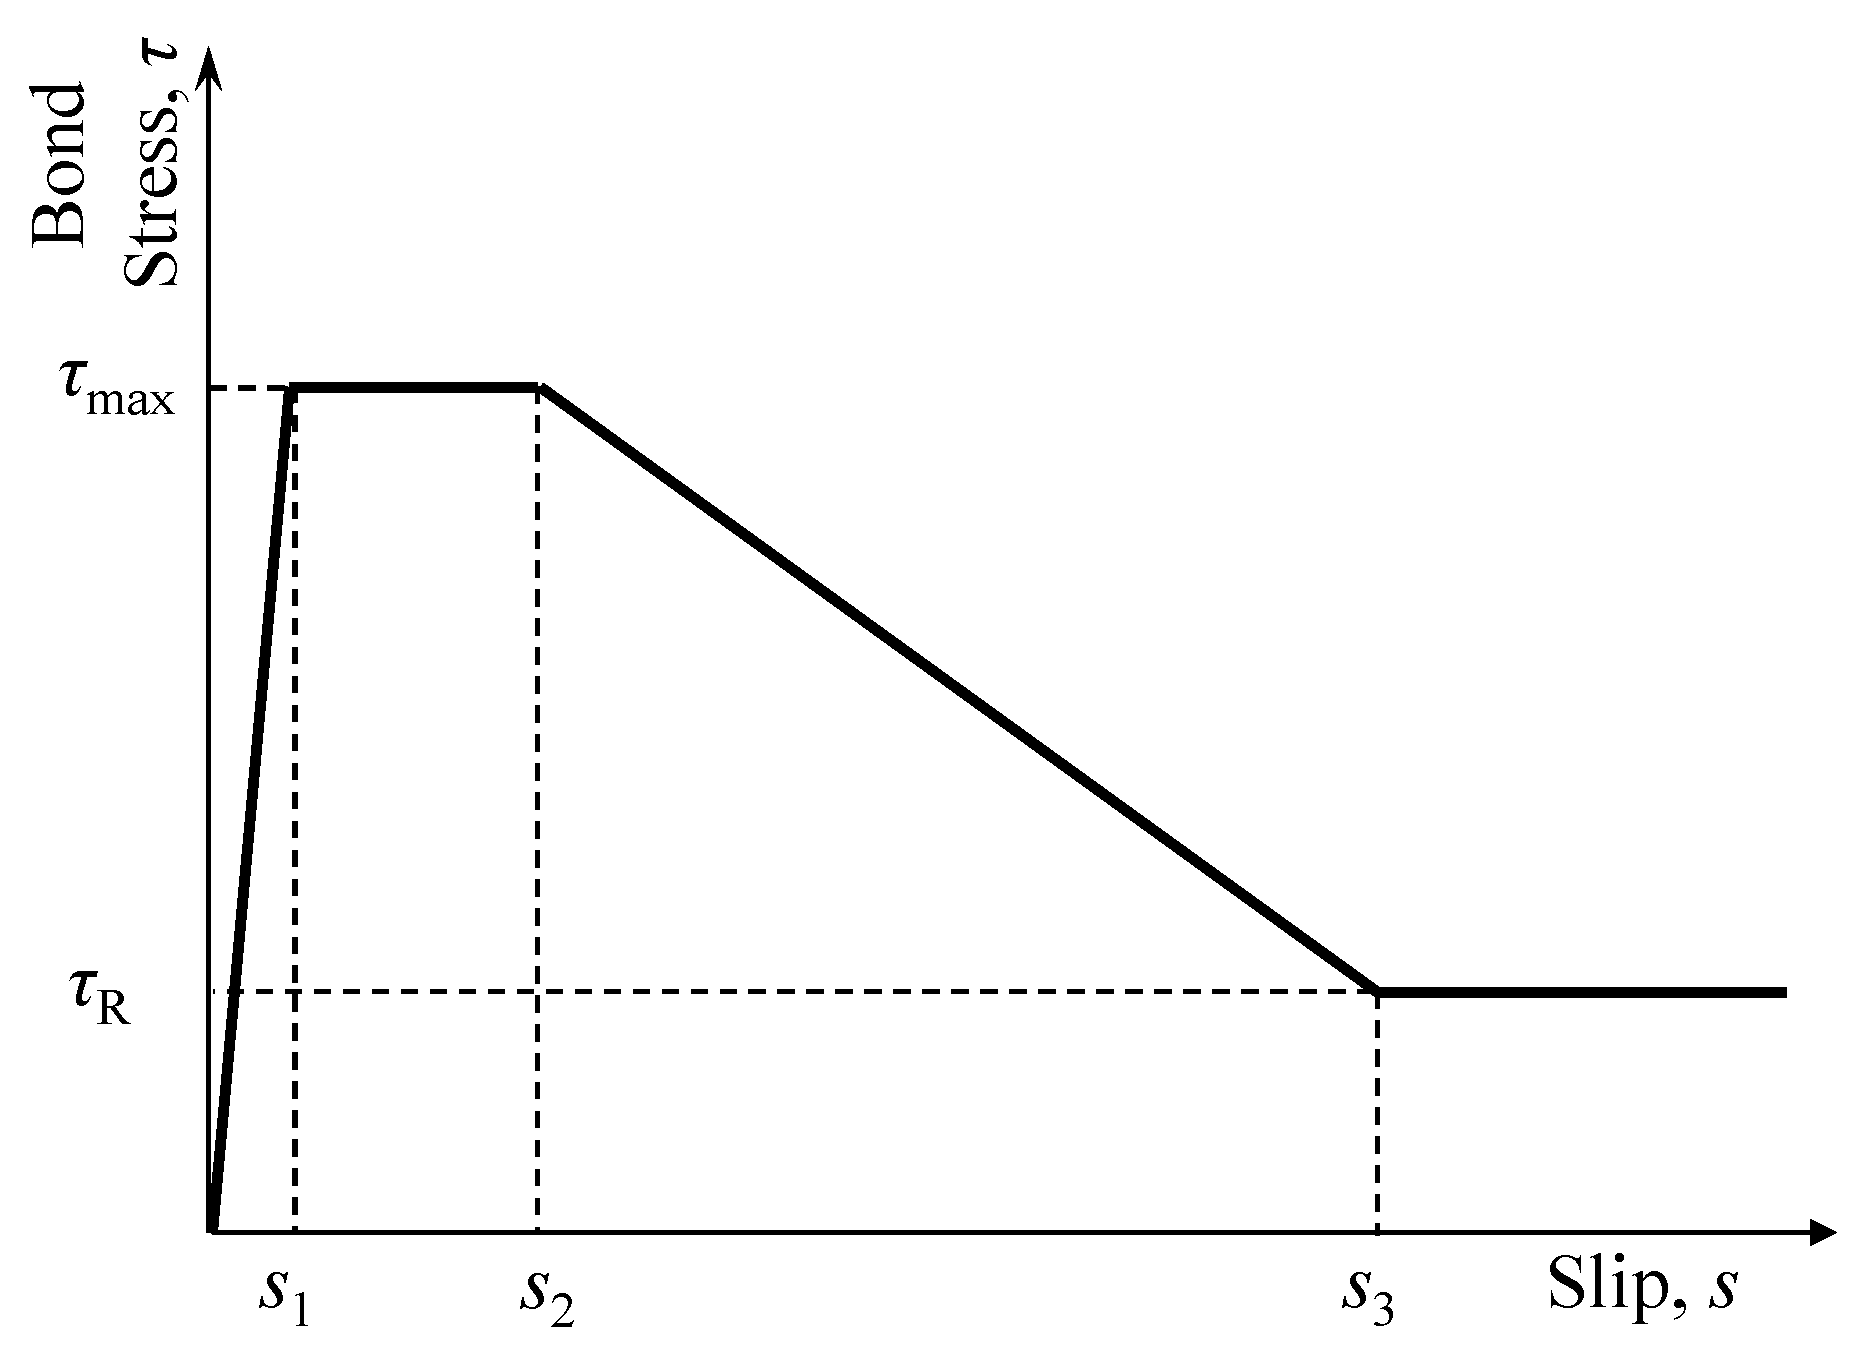
The bar elements used to model bond behaviour of epoxy mortar were assigned a bond stress-slip curve as shown in Figure 5. Based on the results of confined tension tests (pull-out) on single anchors, the following parameters are used: compression modulus = 2500 MPa, peak bond strength τmax = 32.5 MPa, residual bond stress τR = 8 N/mm², values of slip s1 = 0.01 mm, s2 = 0.2 mm, and s3 = 2 mm. Note that the bond stresses remained within the linear range for all the analysis cases.
The dimensions of the concrete block were decided such that a clear concrete edge breakout body can form in each case. The thickness of the concrete block was 500 mm in every case. The horizontal dimensions from the outermost anchors of the last anchor row to the support were kept as twice the edge distance of the last anchor row.
The analysis was carried out in displacement control using secant stiffness matrix approach. The target convergence in the analysis was 1%. The numerical modeling procedure was validated against the tests on single anchors at an edge distance of 80 mm, 160 mm and 20 mm by Bokor [14]. The results displayed an agreement within 5% of the test results for all the cases.

3. Results and Discussion

In this section, the results of numerical analyses performed on triangular and hexagonal anchor groups are presented and discussed in detail.

3.1. Triangular Anchor Groups

3.1.1. Group Tri-A

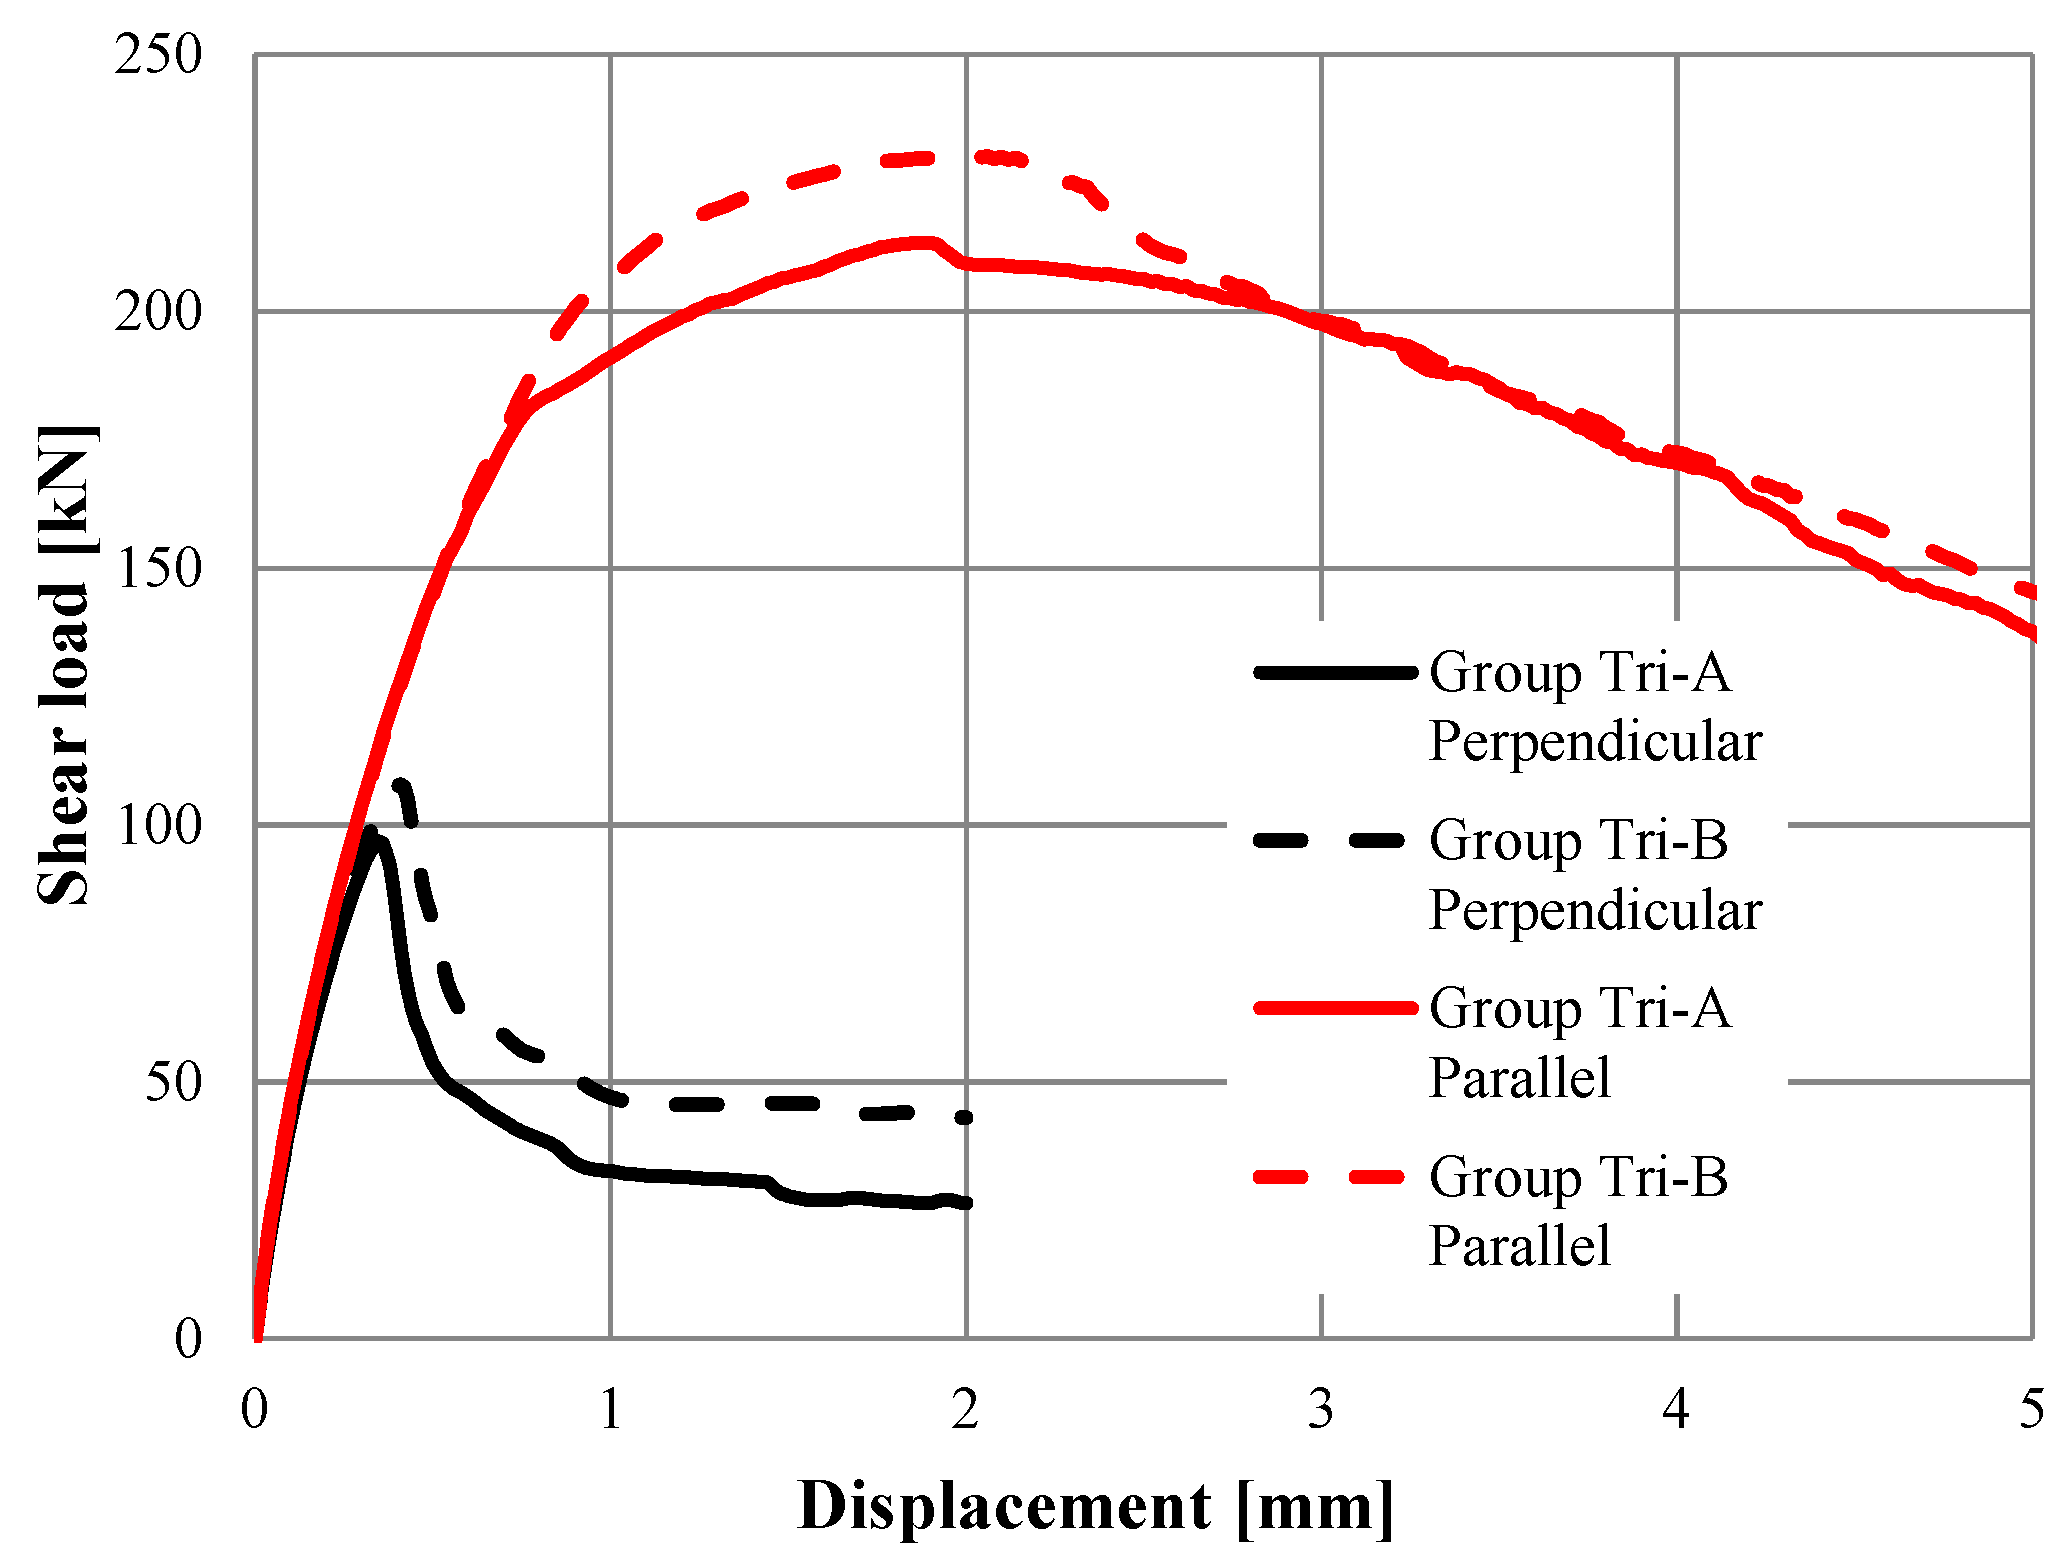
The shear load vs. displacement curve obtained from numerical analysis for Group Tri-A loaded perpendicular and towards the free concrete edge is shown in Figure 6. The curve shows a typical concrete edge breakout dominated load-displacement response characterized by an ascending branch, a relatively sharp peak followed by a gradual descending branch.
The numerically obtained failure load of the group TRI-A was 96.8 kN. In comparison, when the same anchor group is subjected to shear load parallel to the edge, a peak load of 213.4 kN is recorded, which is 2.2 times the failure load of the group loaded perpendicular to the edge. This agrees well with the regulations given in current standards that recommend that the concrete edge resistance of an anchor group loaded parallel to an edge may be considered as twice the concrete edge resistance of the same anchor group loaded perpendicular to the edge. Note, however, that the initial stiffness of the anchor group loaded parallel to the edge is rather similar to the stiffness of the group loaded perpendicular to the edge. This agrees well with the observations from the literature that showed that the shear stiffness of the anchor is independent of the edge distance provided that all other installation parameters are the same [9,13,14,29].
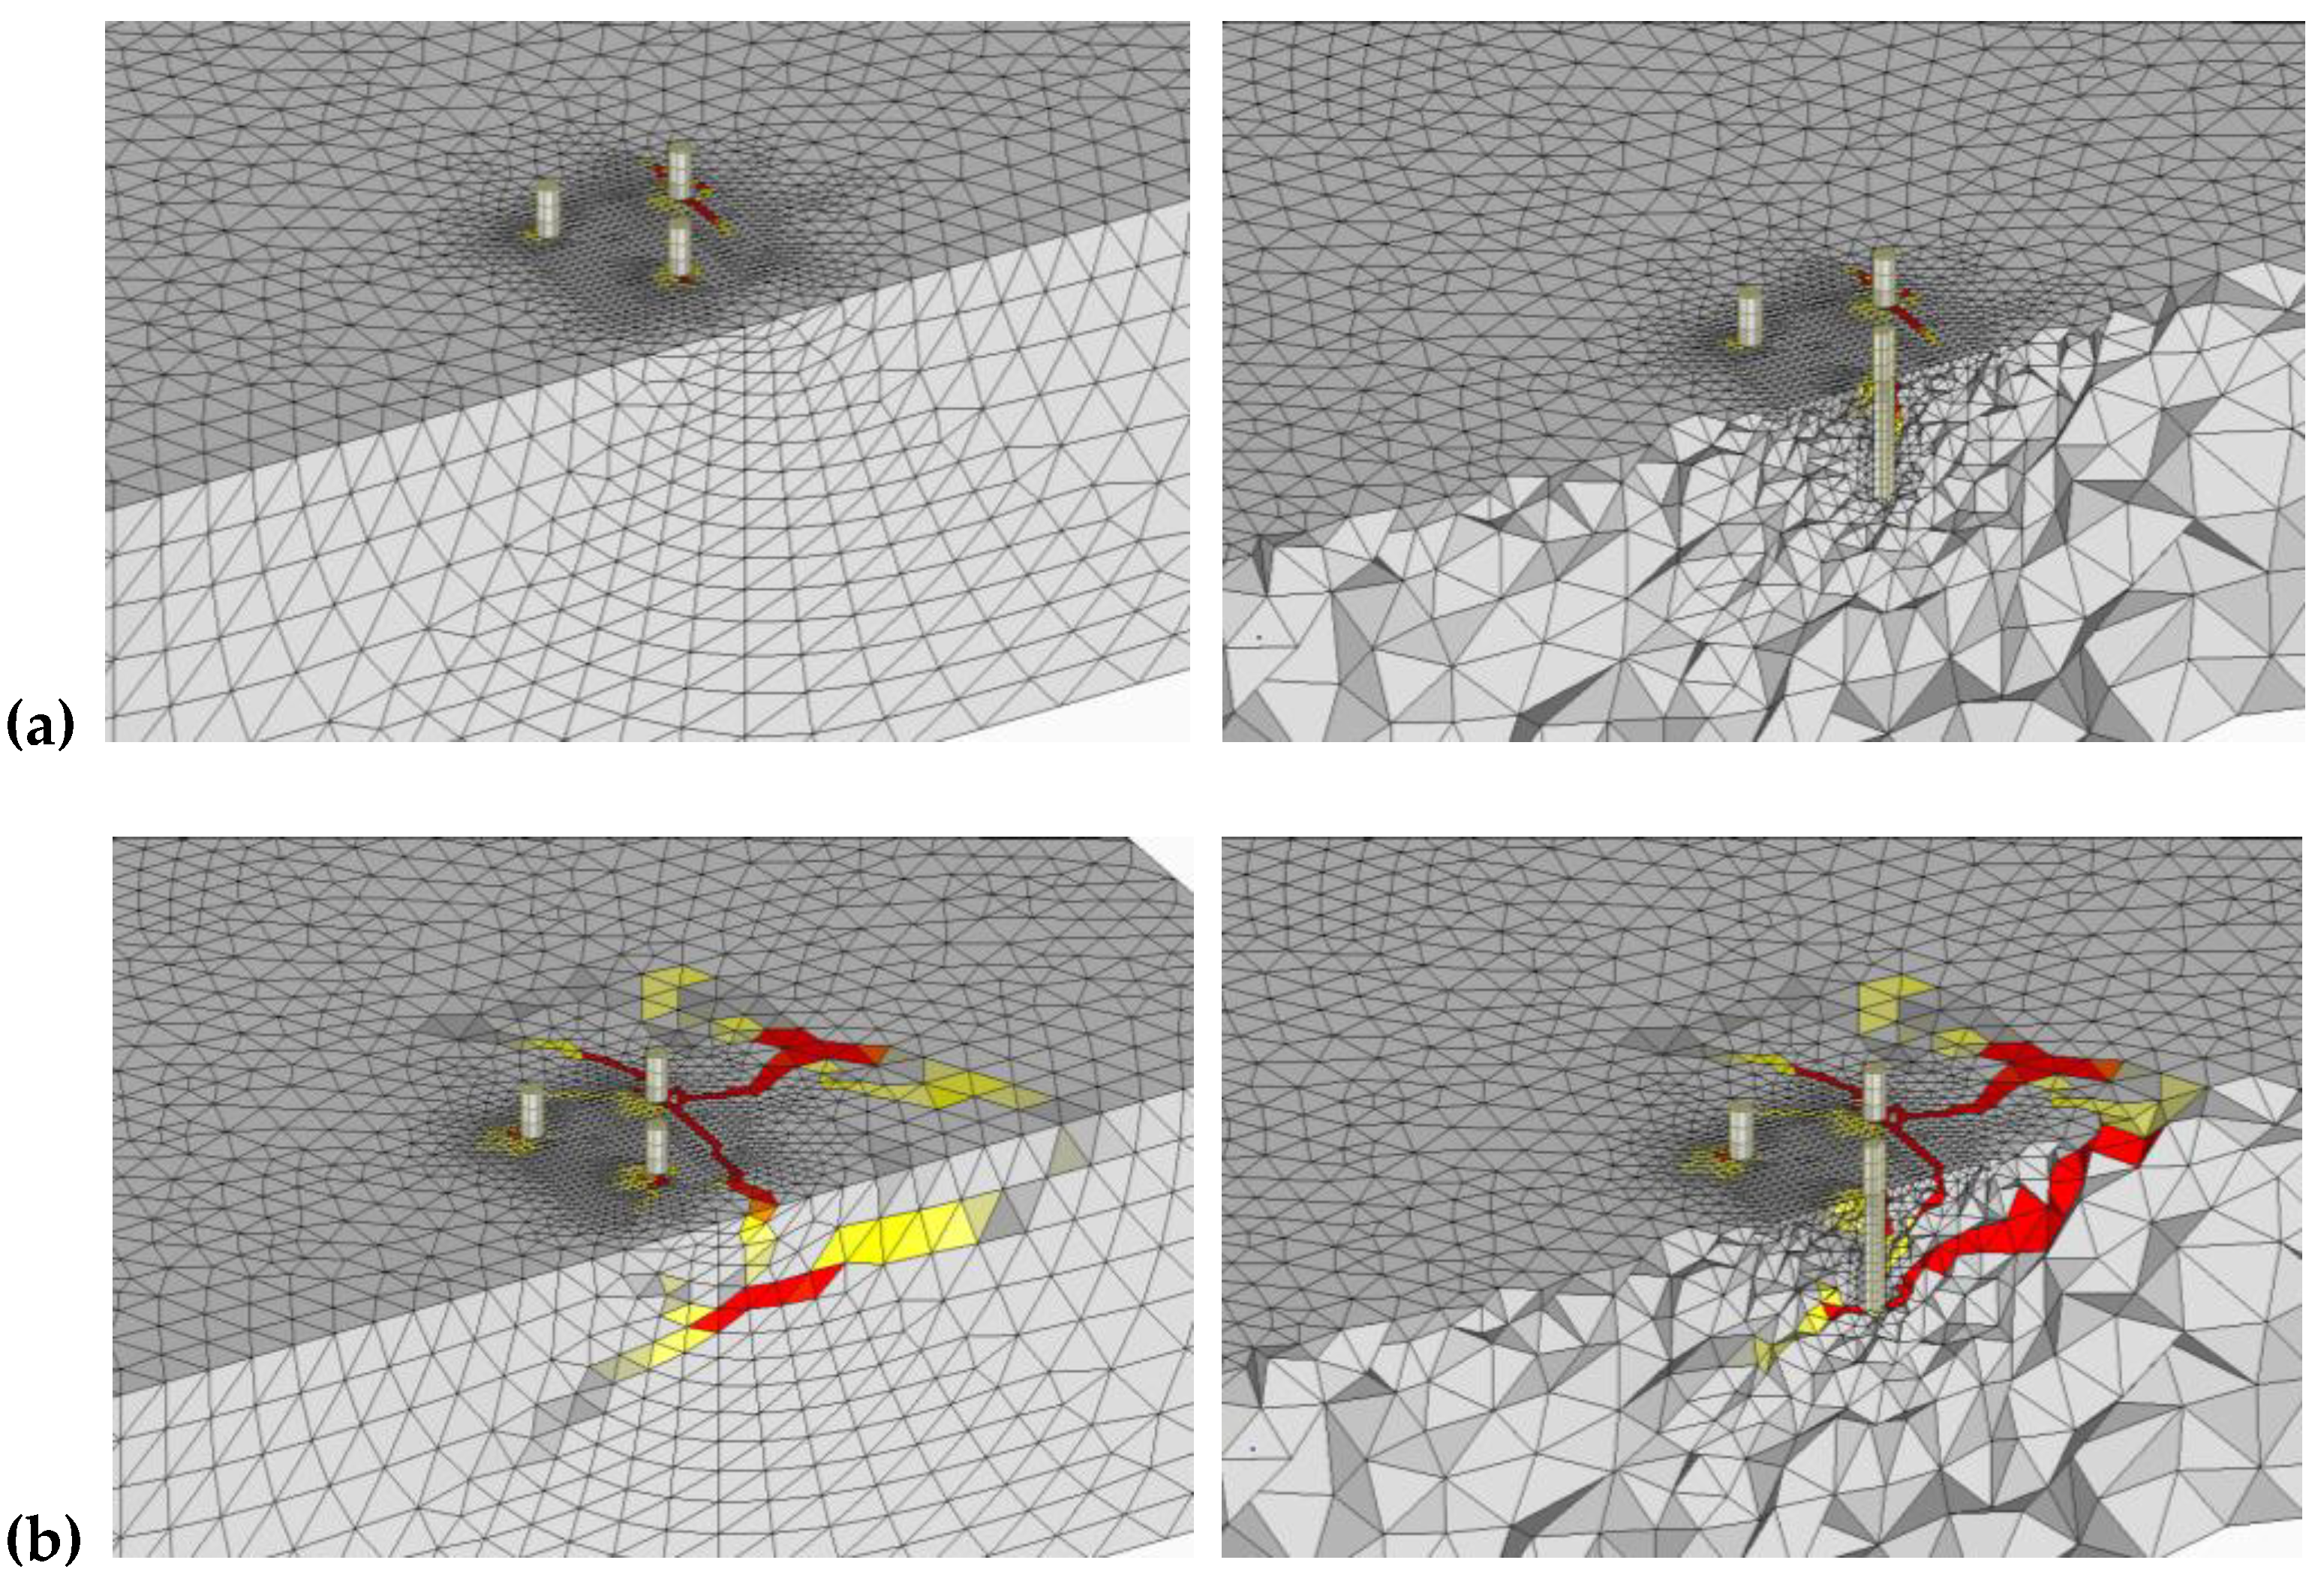
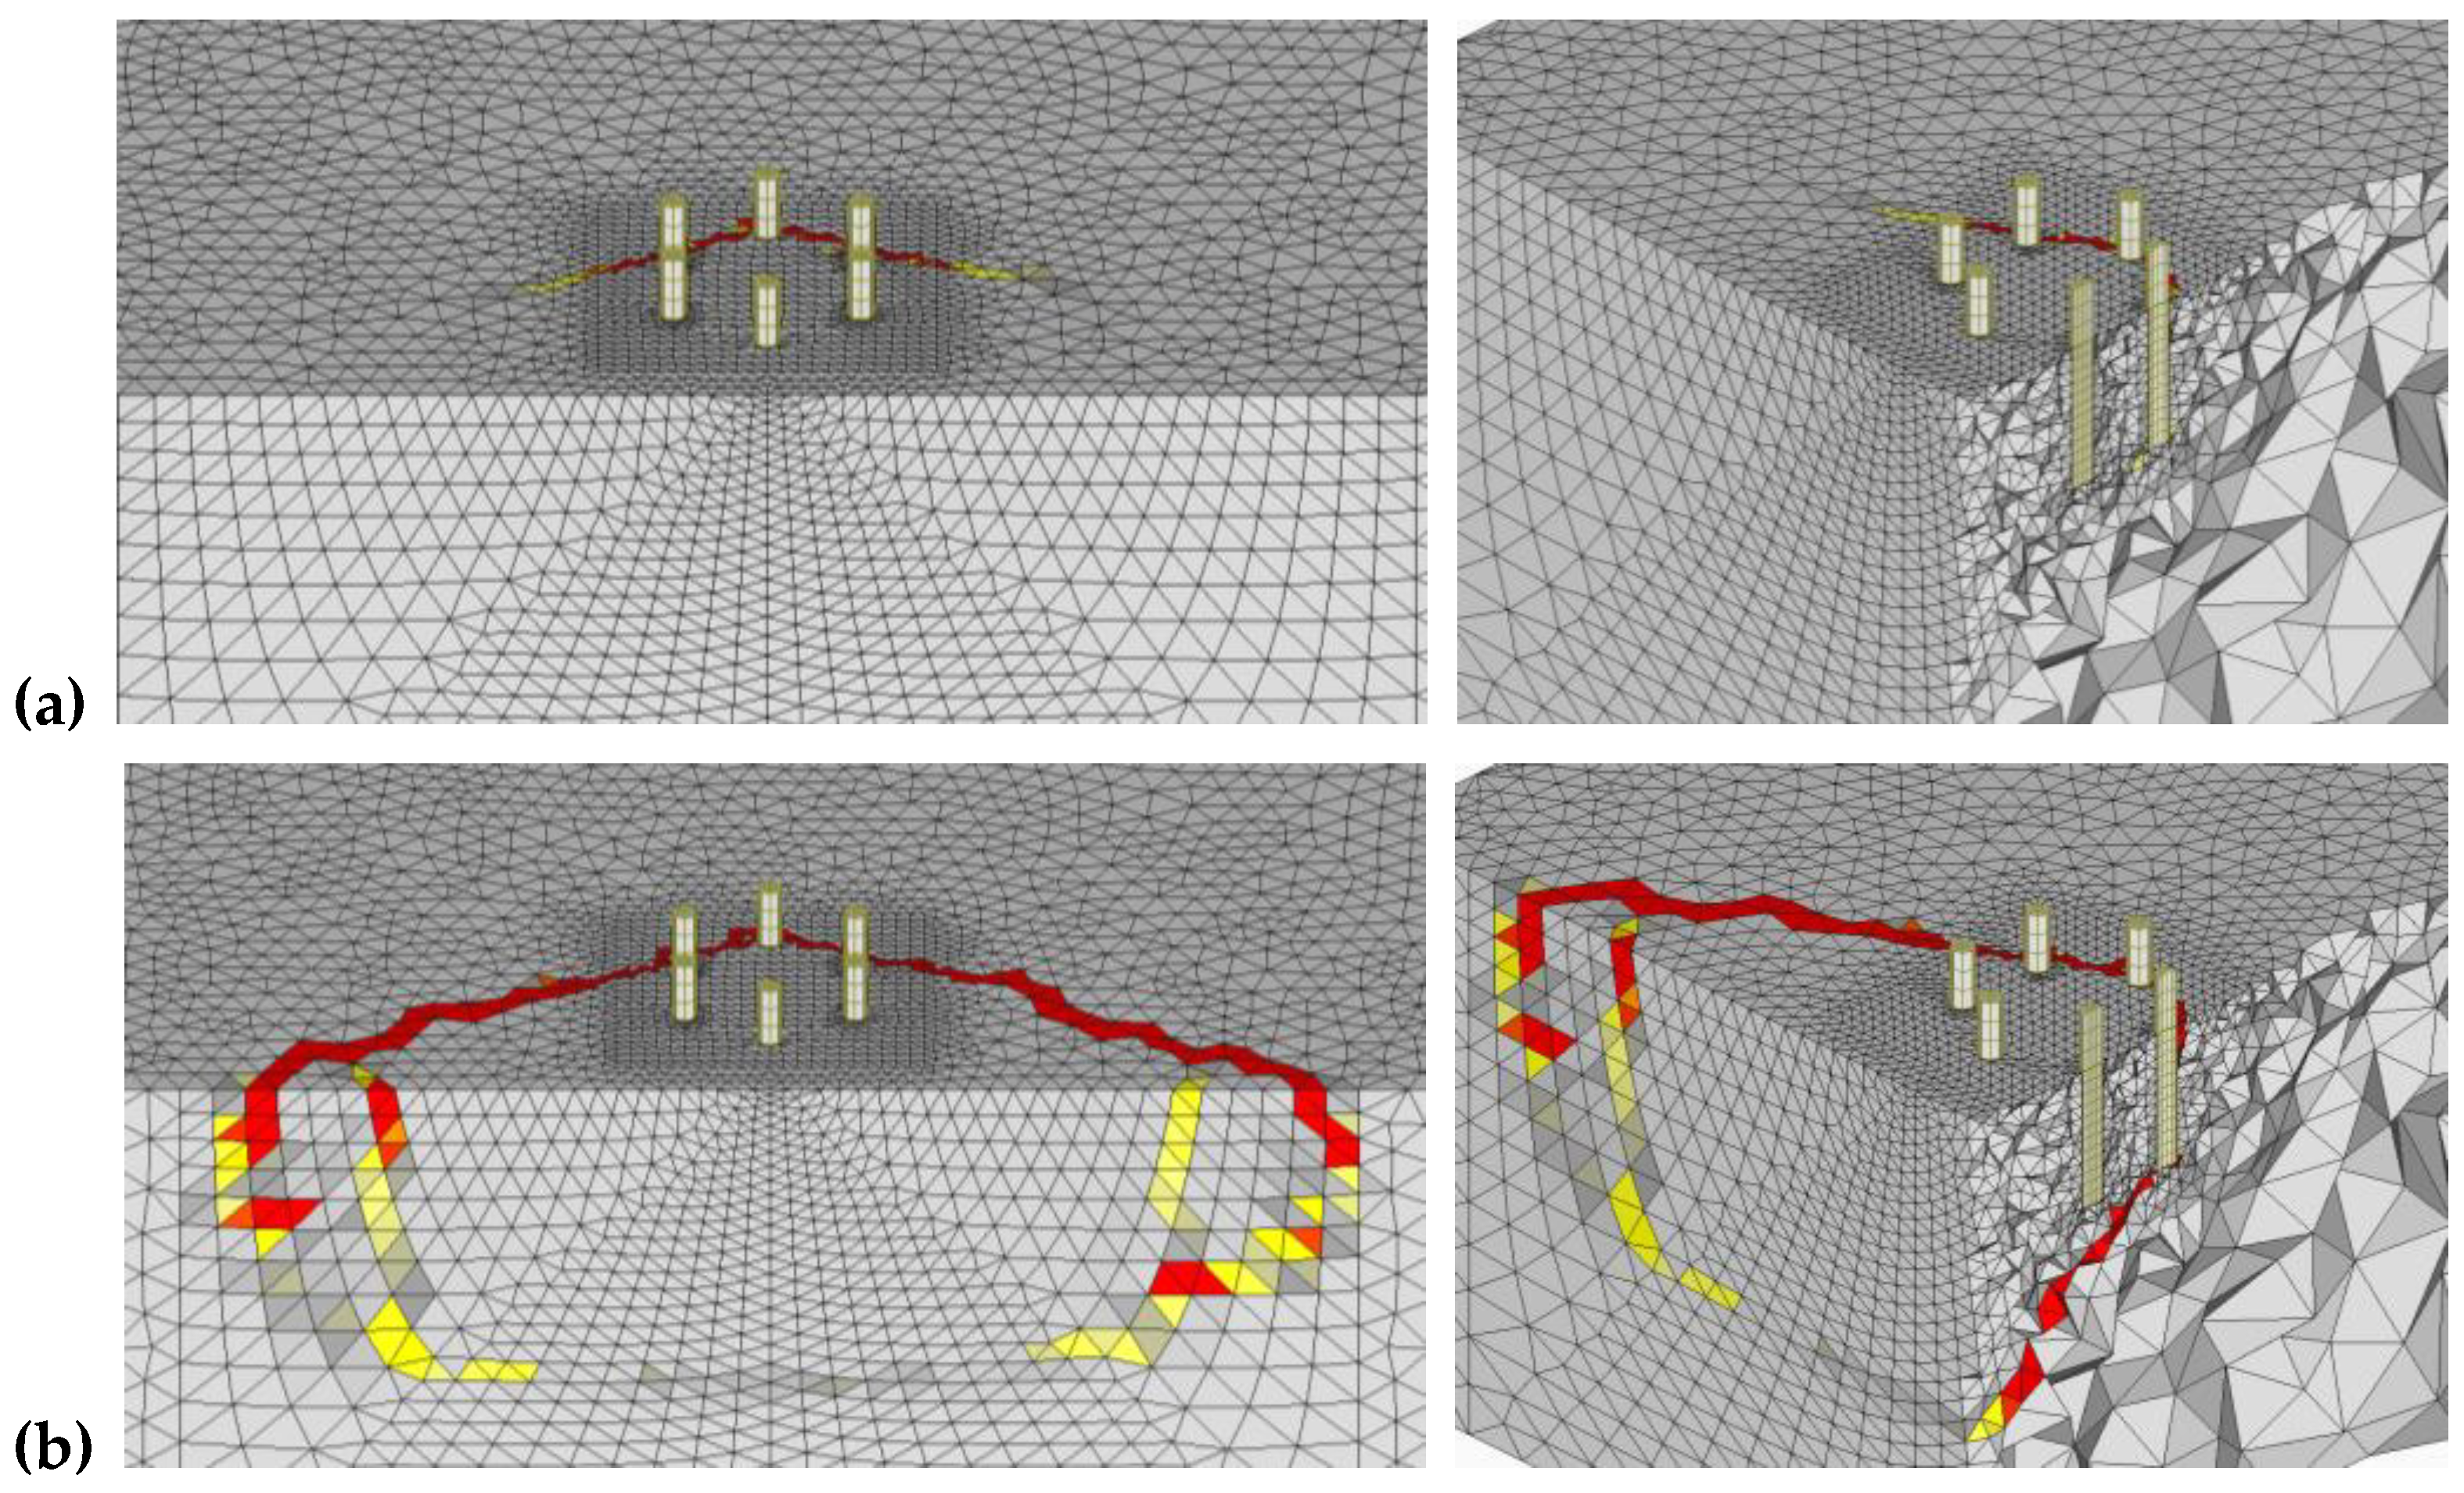
The numerically obtained failure crack pattern for the case of group Tri-A loaded perpendicular to the edge is shown in Figure 7. The cracks are visualized by plotting the principle tensile strains with a legend where the red color represents a critical crack width of 0.3 mm or more. Figure 7a shows the developed cracking at the ultimate load that shows a small crack at the front. However, it is clear that the failure crack originates from the back anchor and the small damages at the front row do not influence the force distribution significantly at the back anchor. Figure 7b depicts the crack pattern in the post-peak phase with a major crack coming from the back anchor and also a secondary tensile crack is visible behind the back anchor. The crack pattern is very similar to the crack pattern obtained in the tests [13,14]. A clear concrete edge breakout body is visible with a crack from the back anchor row propagating at an inclination of 1:1.5 (~35 degrees). The observations match well with the tests on anchorages performed without hole clearance in [7,9] that showed that the failure crack of such anchorages would initiate from the back anchor row.
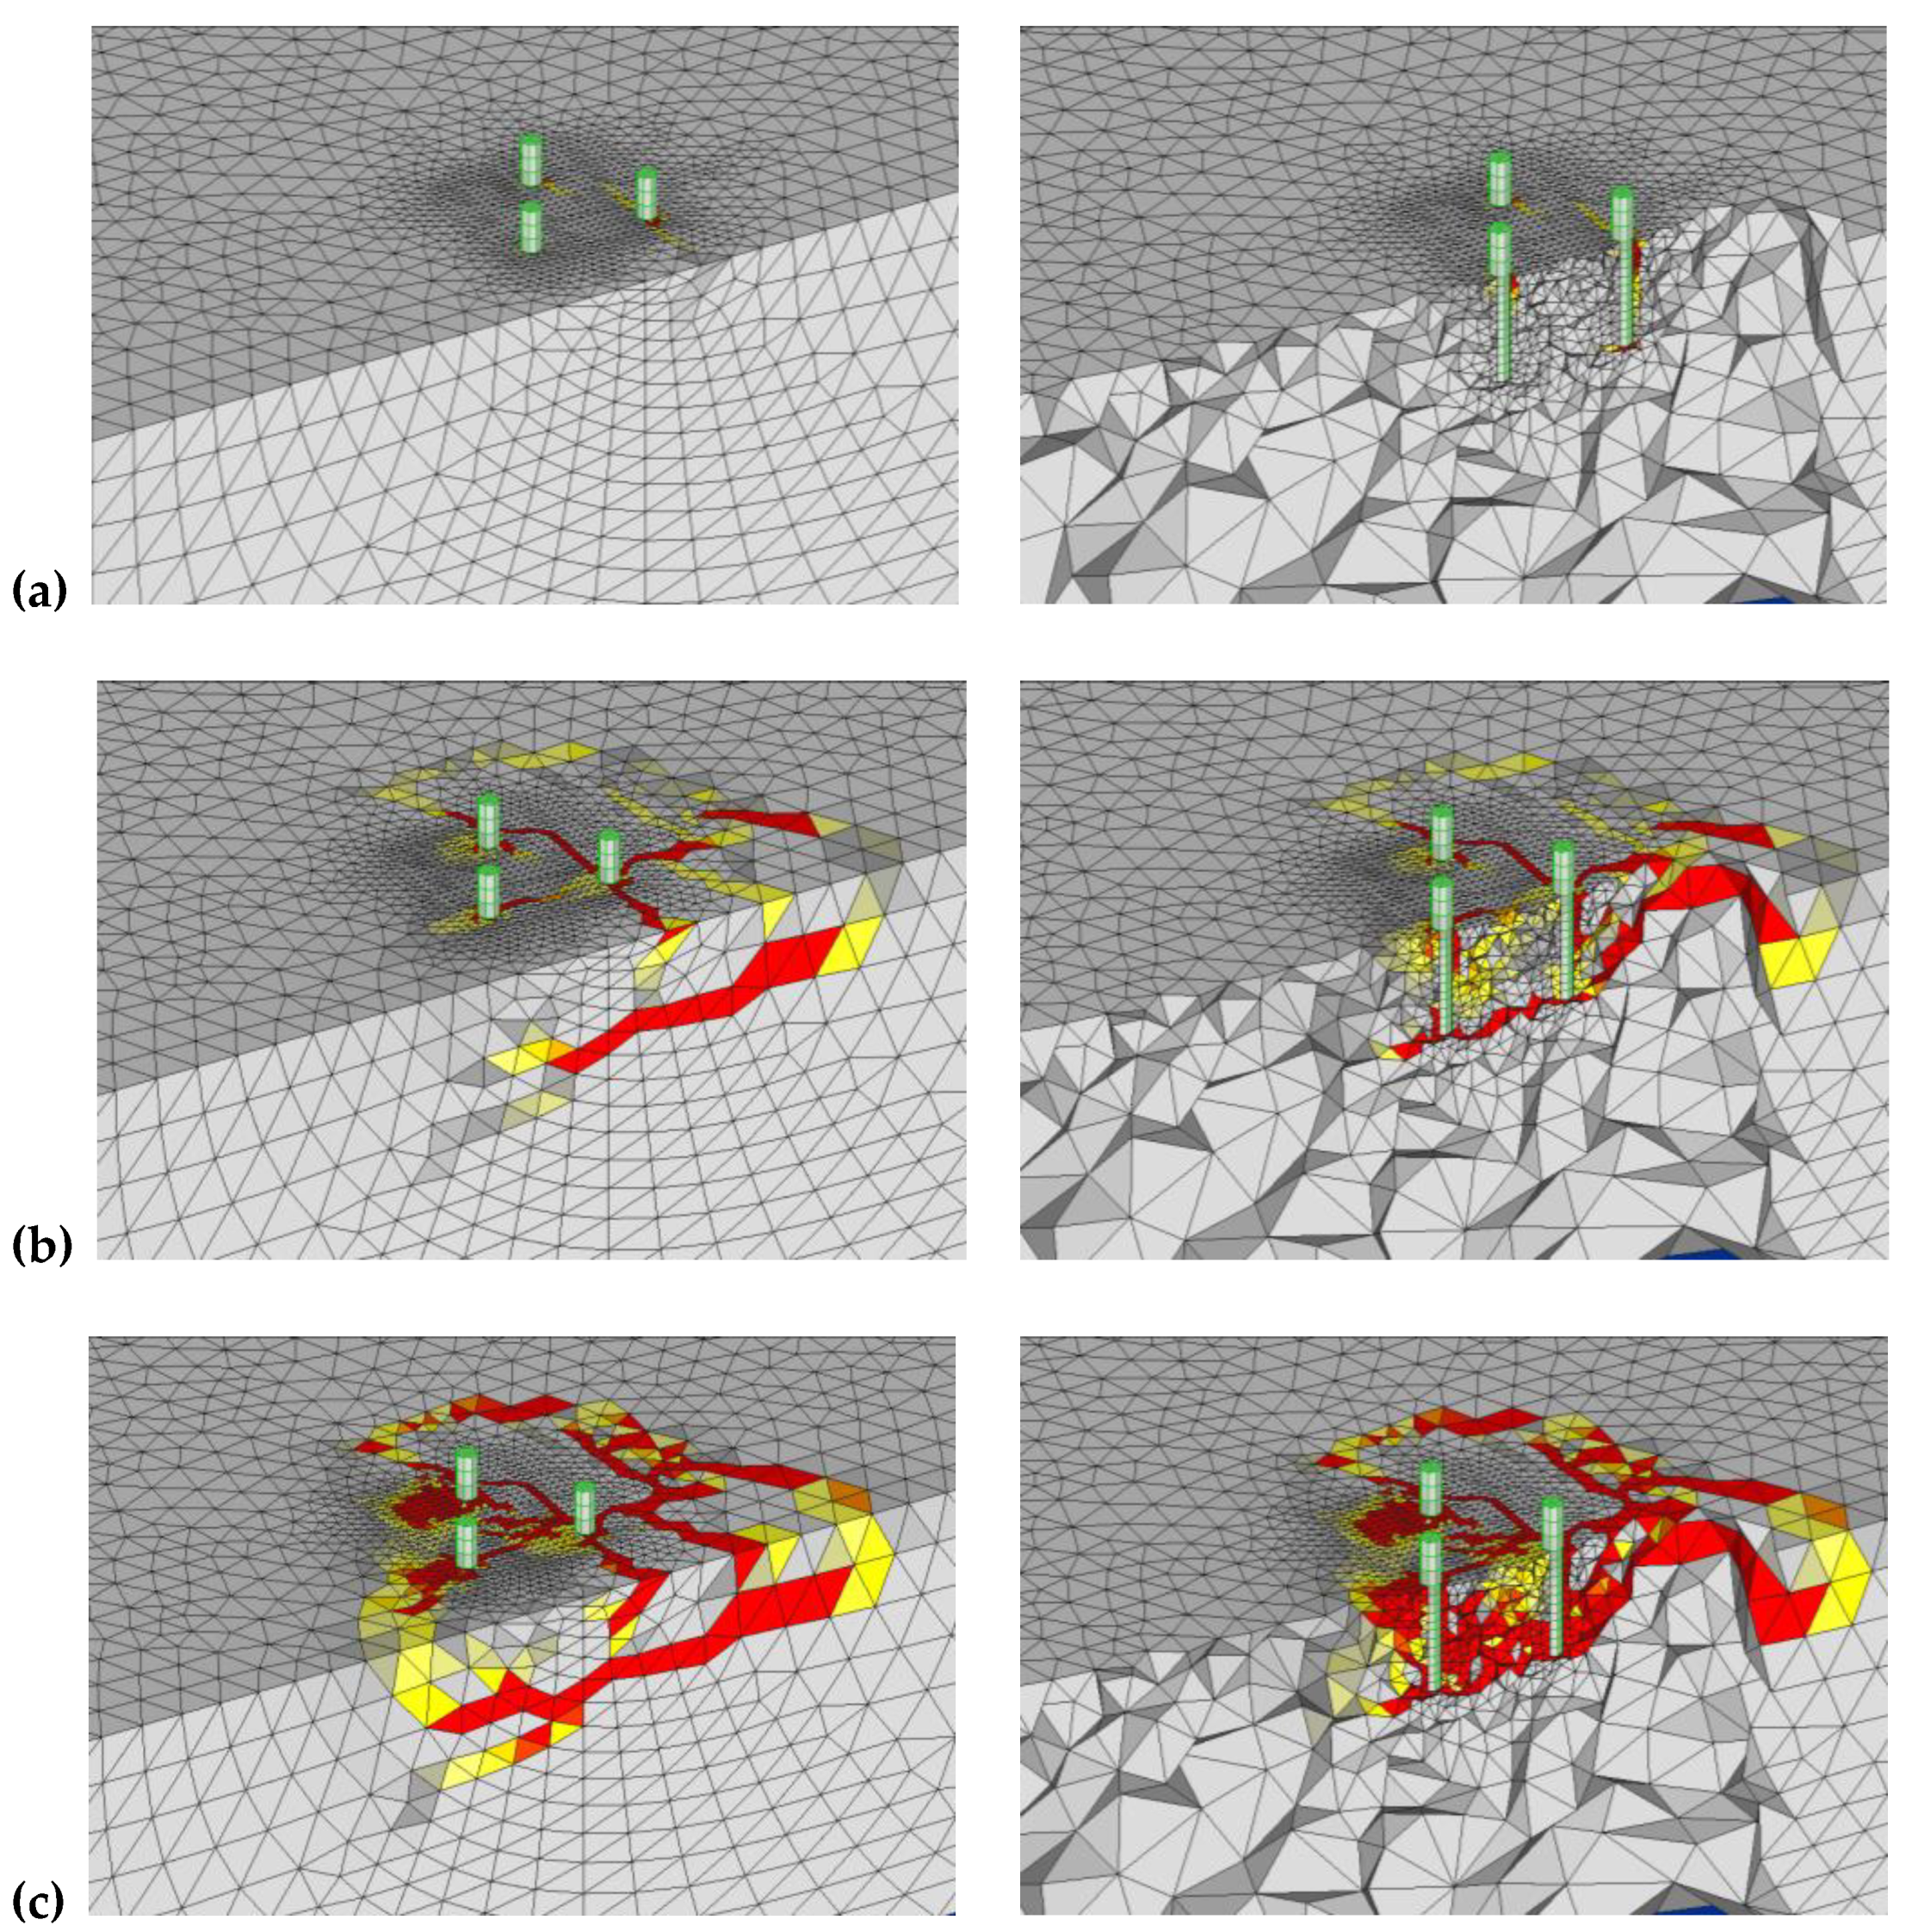
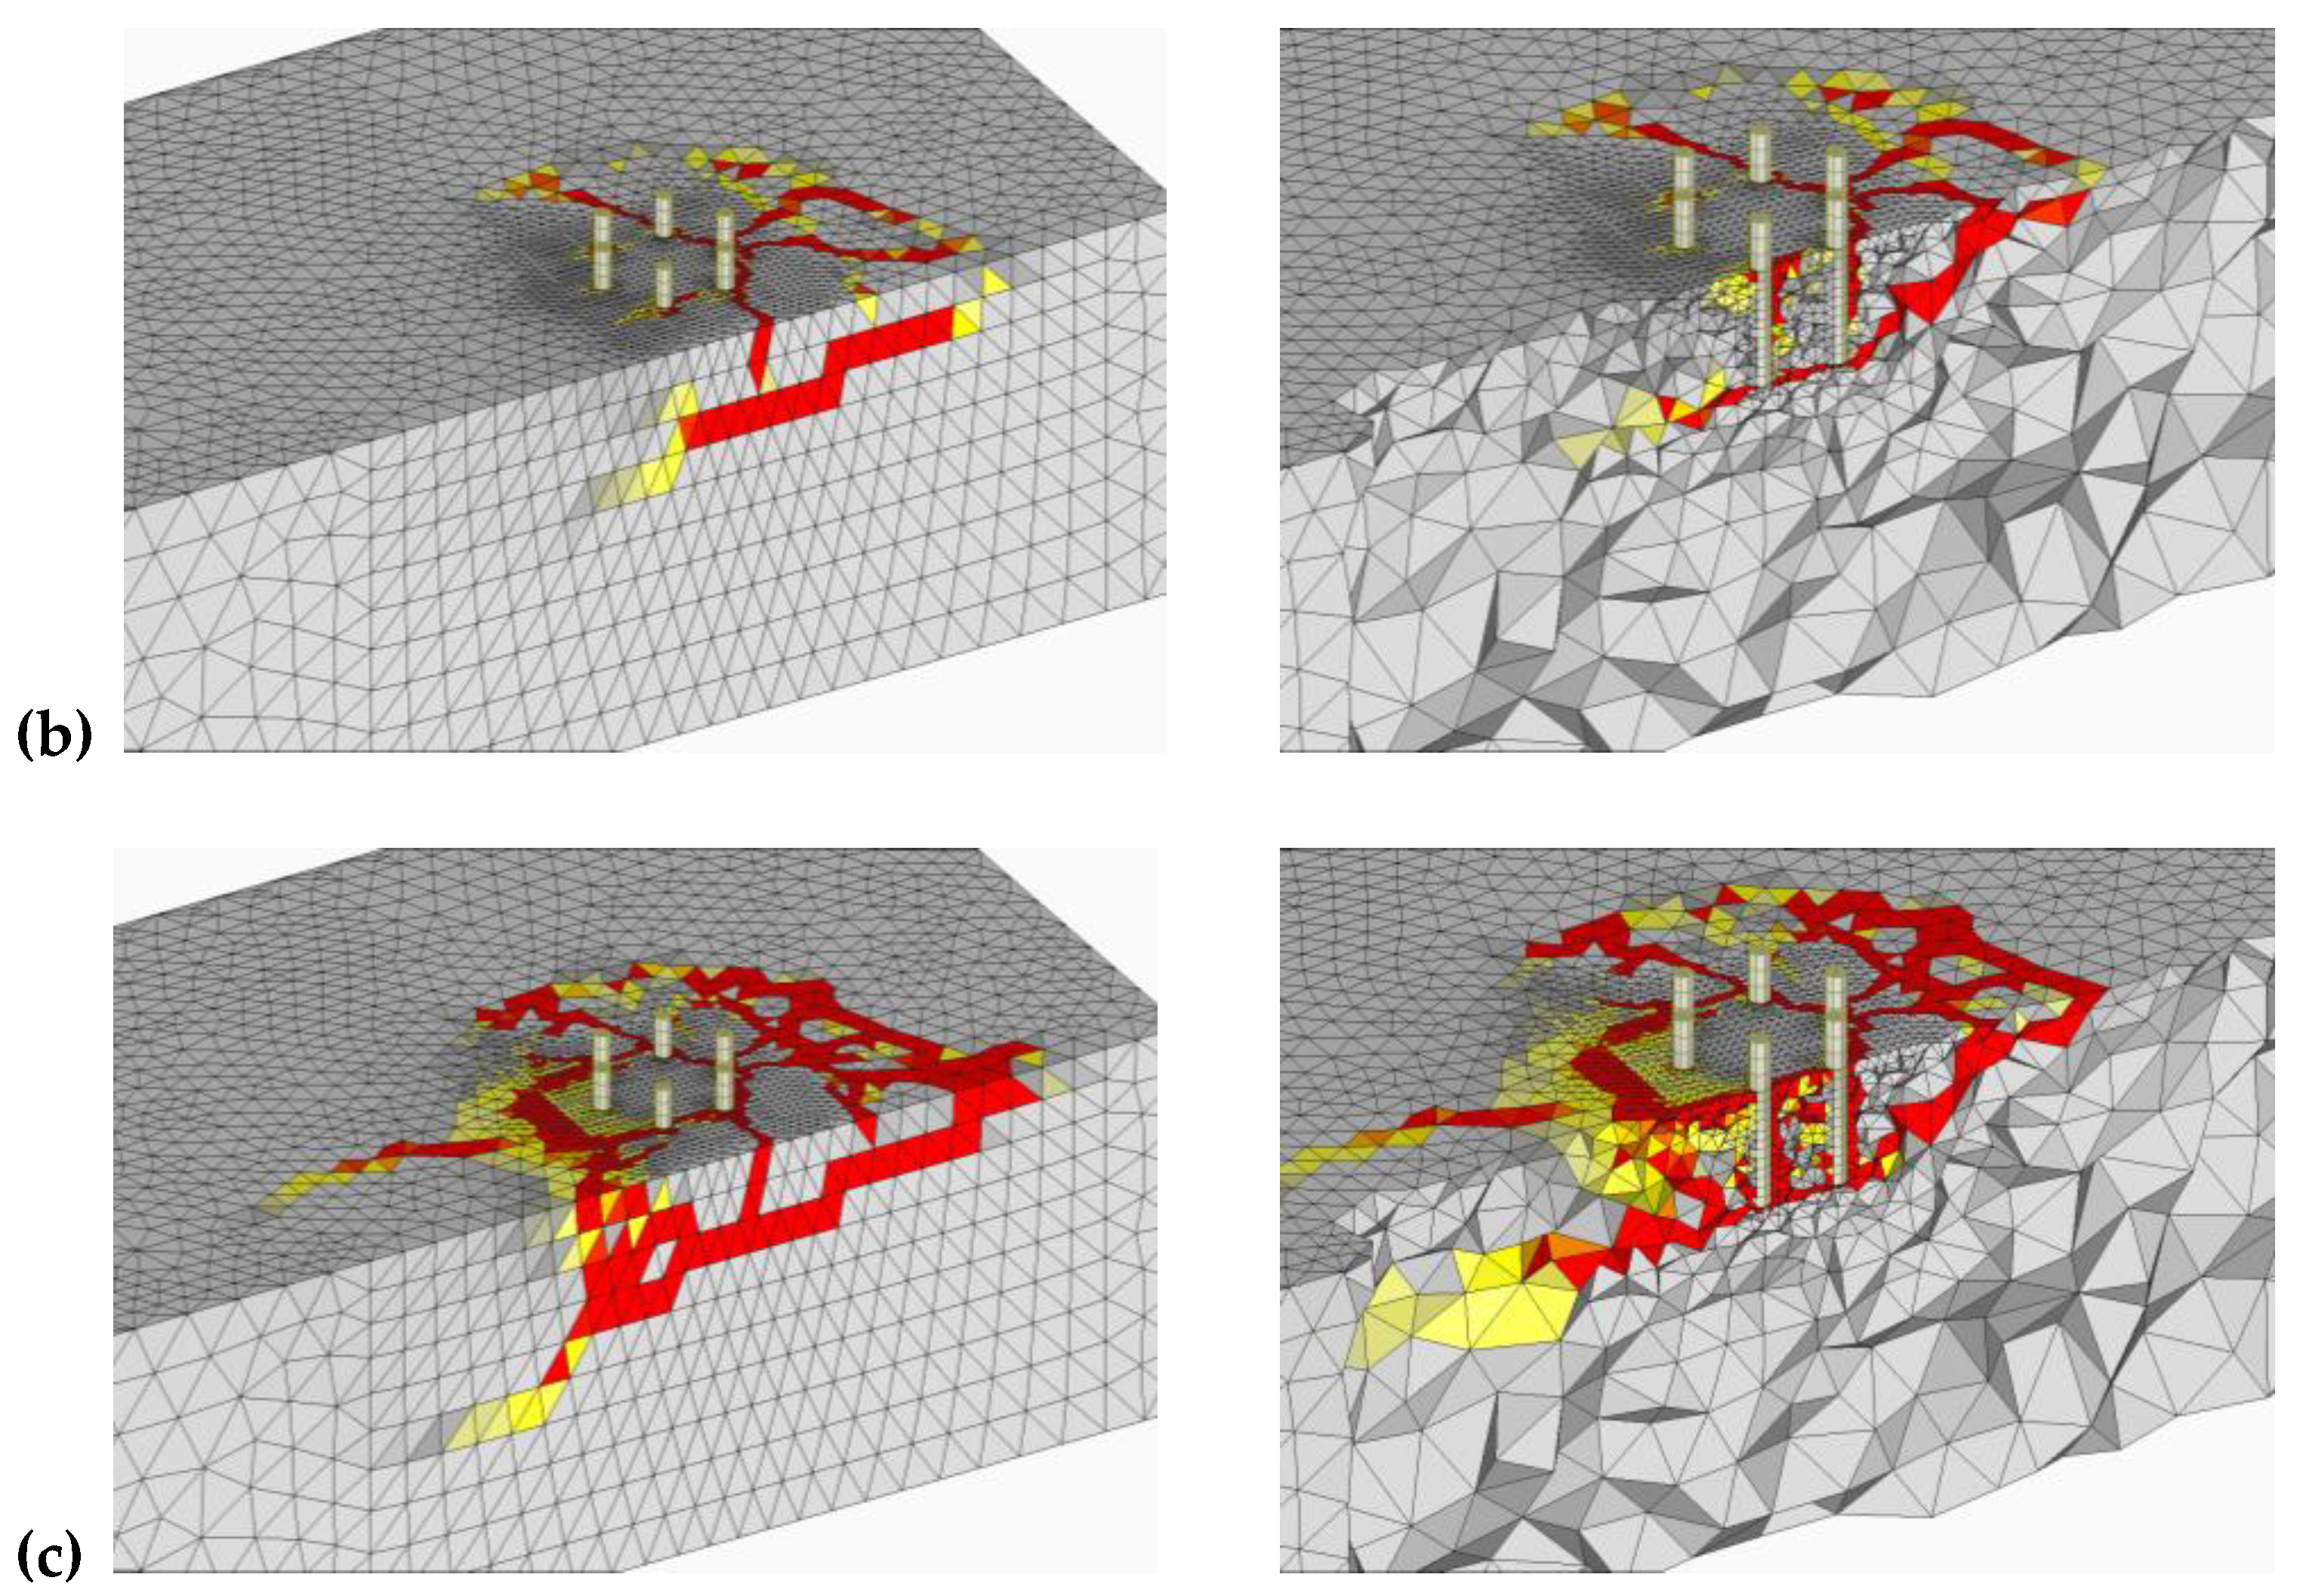
For the same group, when the load is applied parallel to the concrete edge, the first crack appears from the anchor close to the edge and behind as shown in Figure 8a. Note that the shear load is applied from right to left. At peak load, two major cracks appear from the back anchor, one propagating parallel to the edge and another crack propagating perpendicular to the edge (Figure 8b). The section cut (Figure 8b, right) shows that a crack appears from the embedment depth of the anchor and propagates inclined upwards to the back side. The failure mode appears as a mix of concrete edge breakout and pryout failure. The final breakout body shows several cracks coalescing together and crushing of concrete in front of the anchors.

3.1.2. Group Tri-B

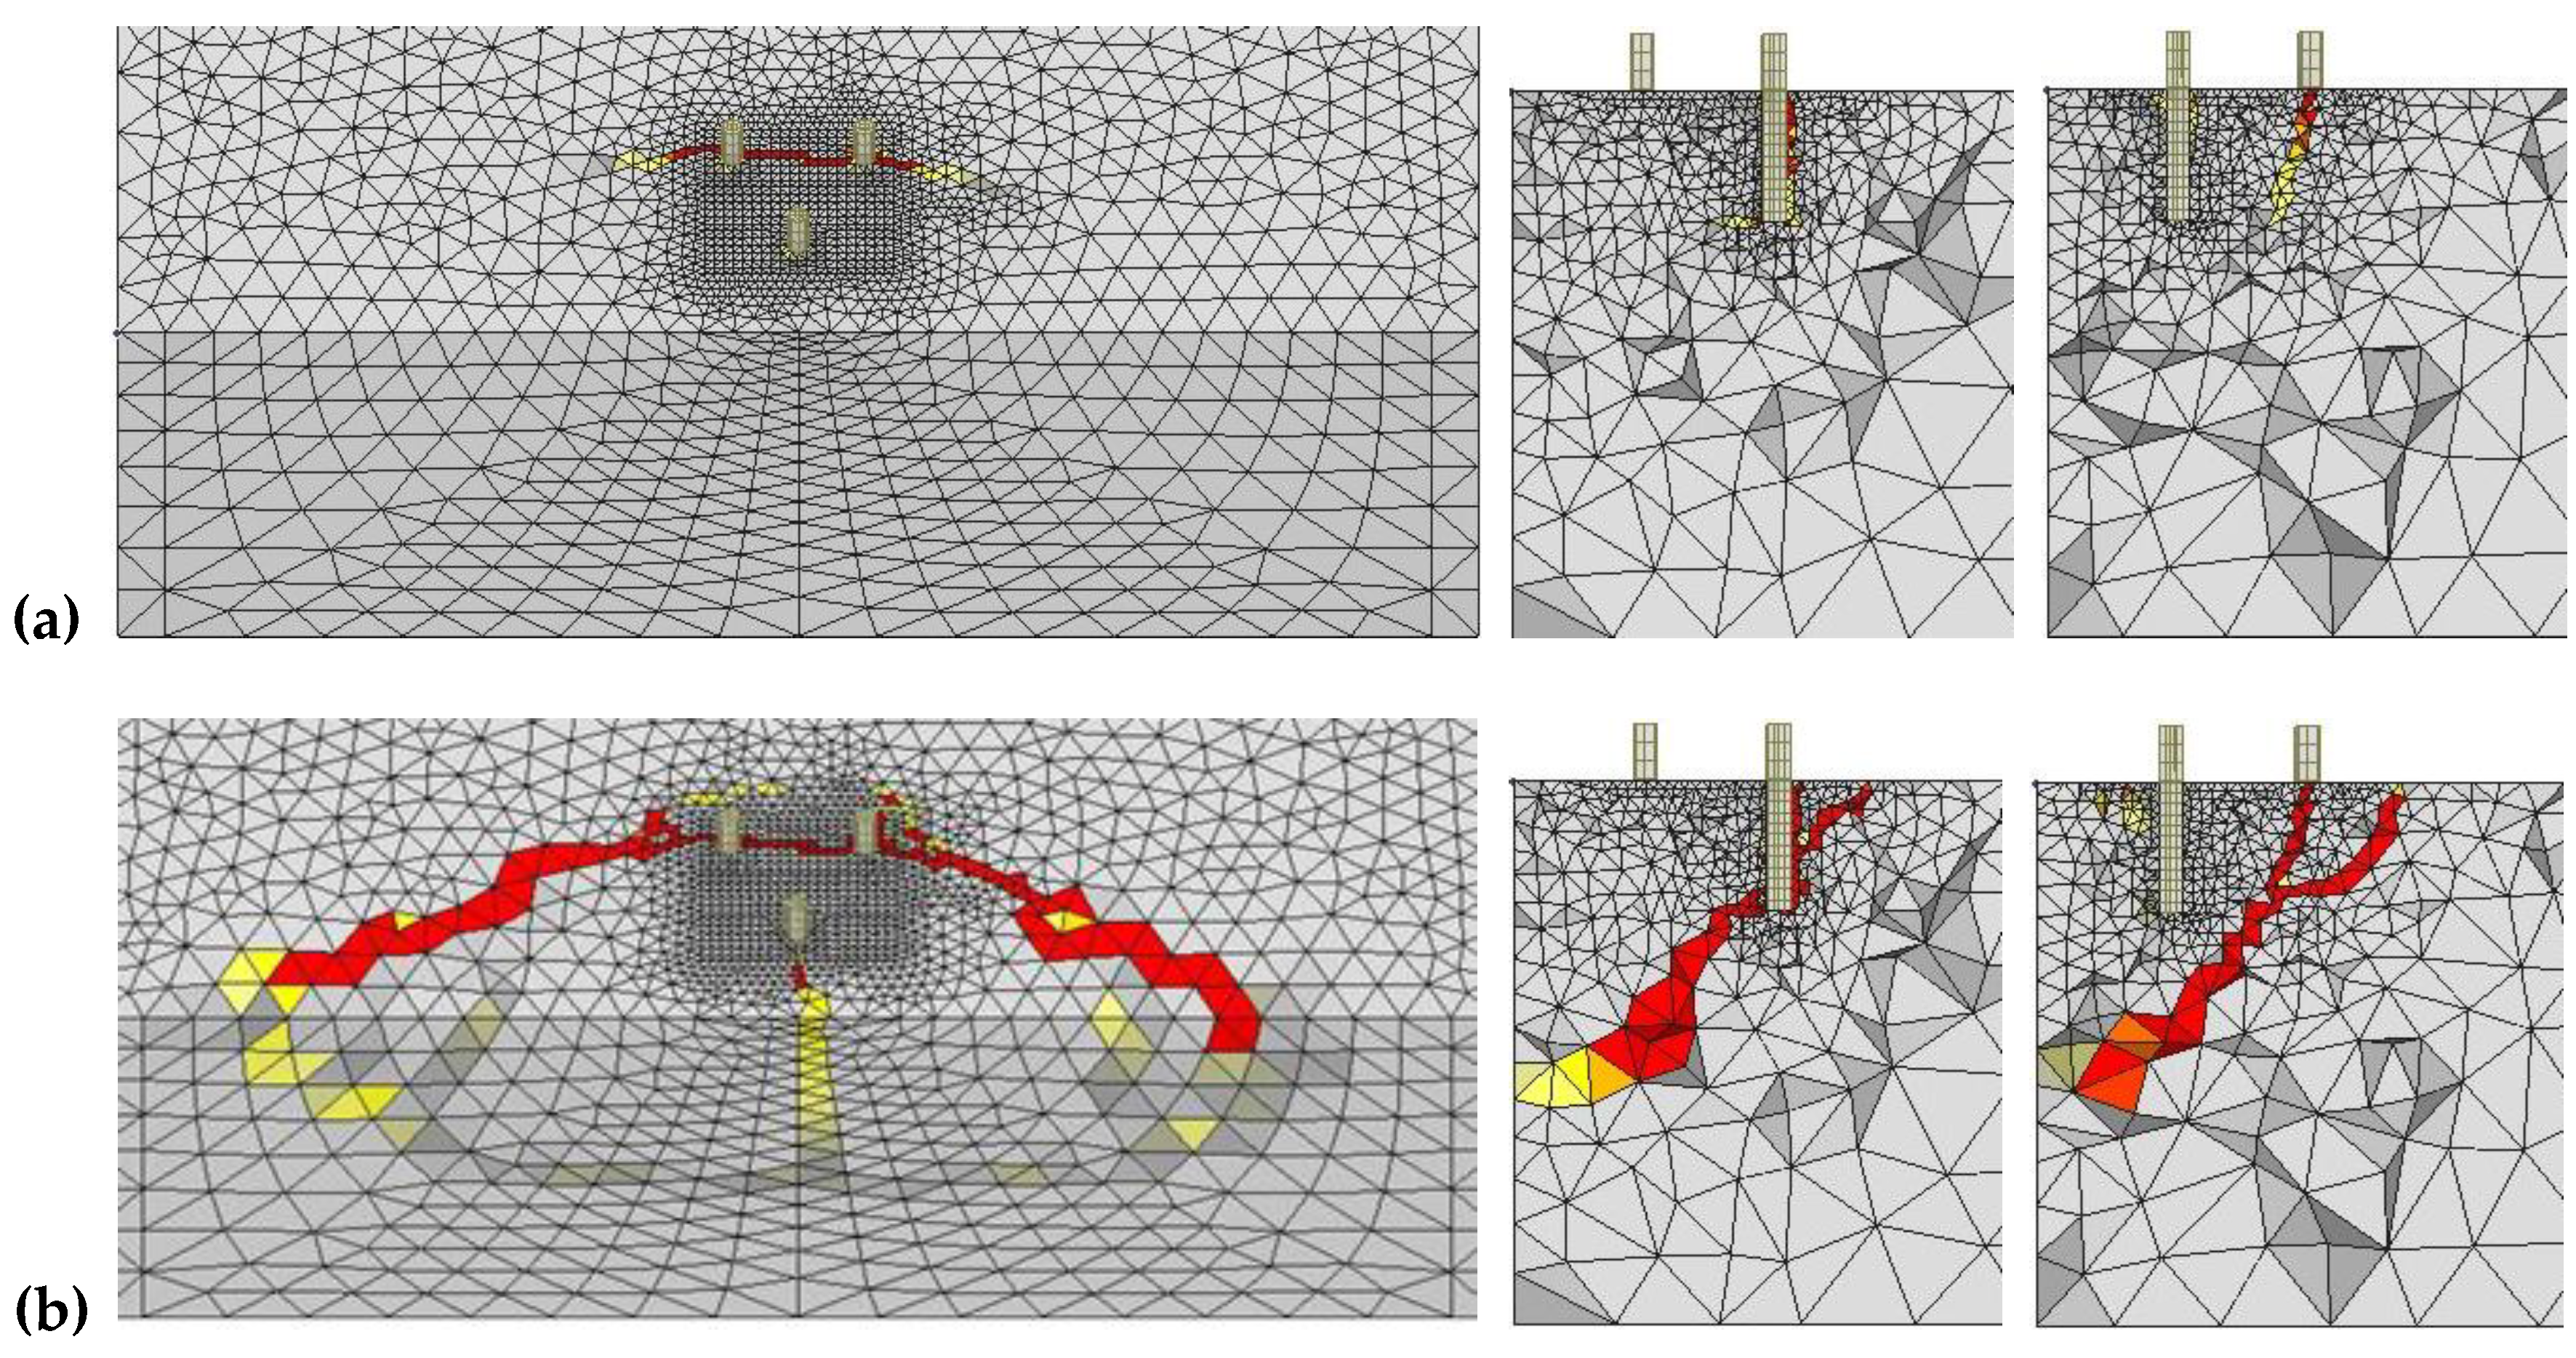
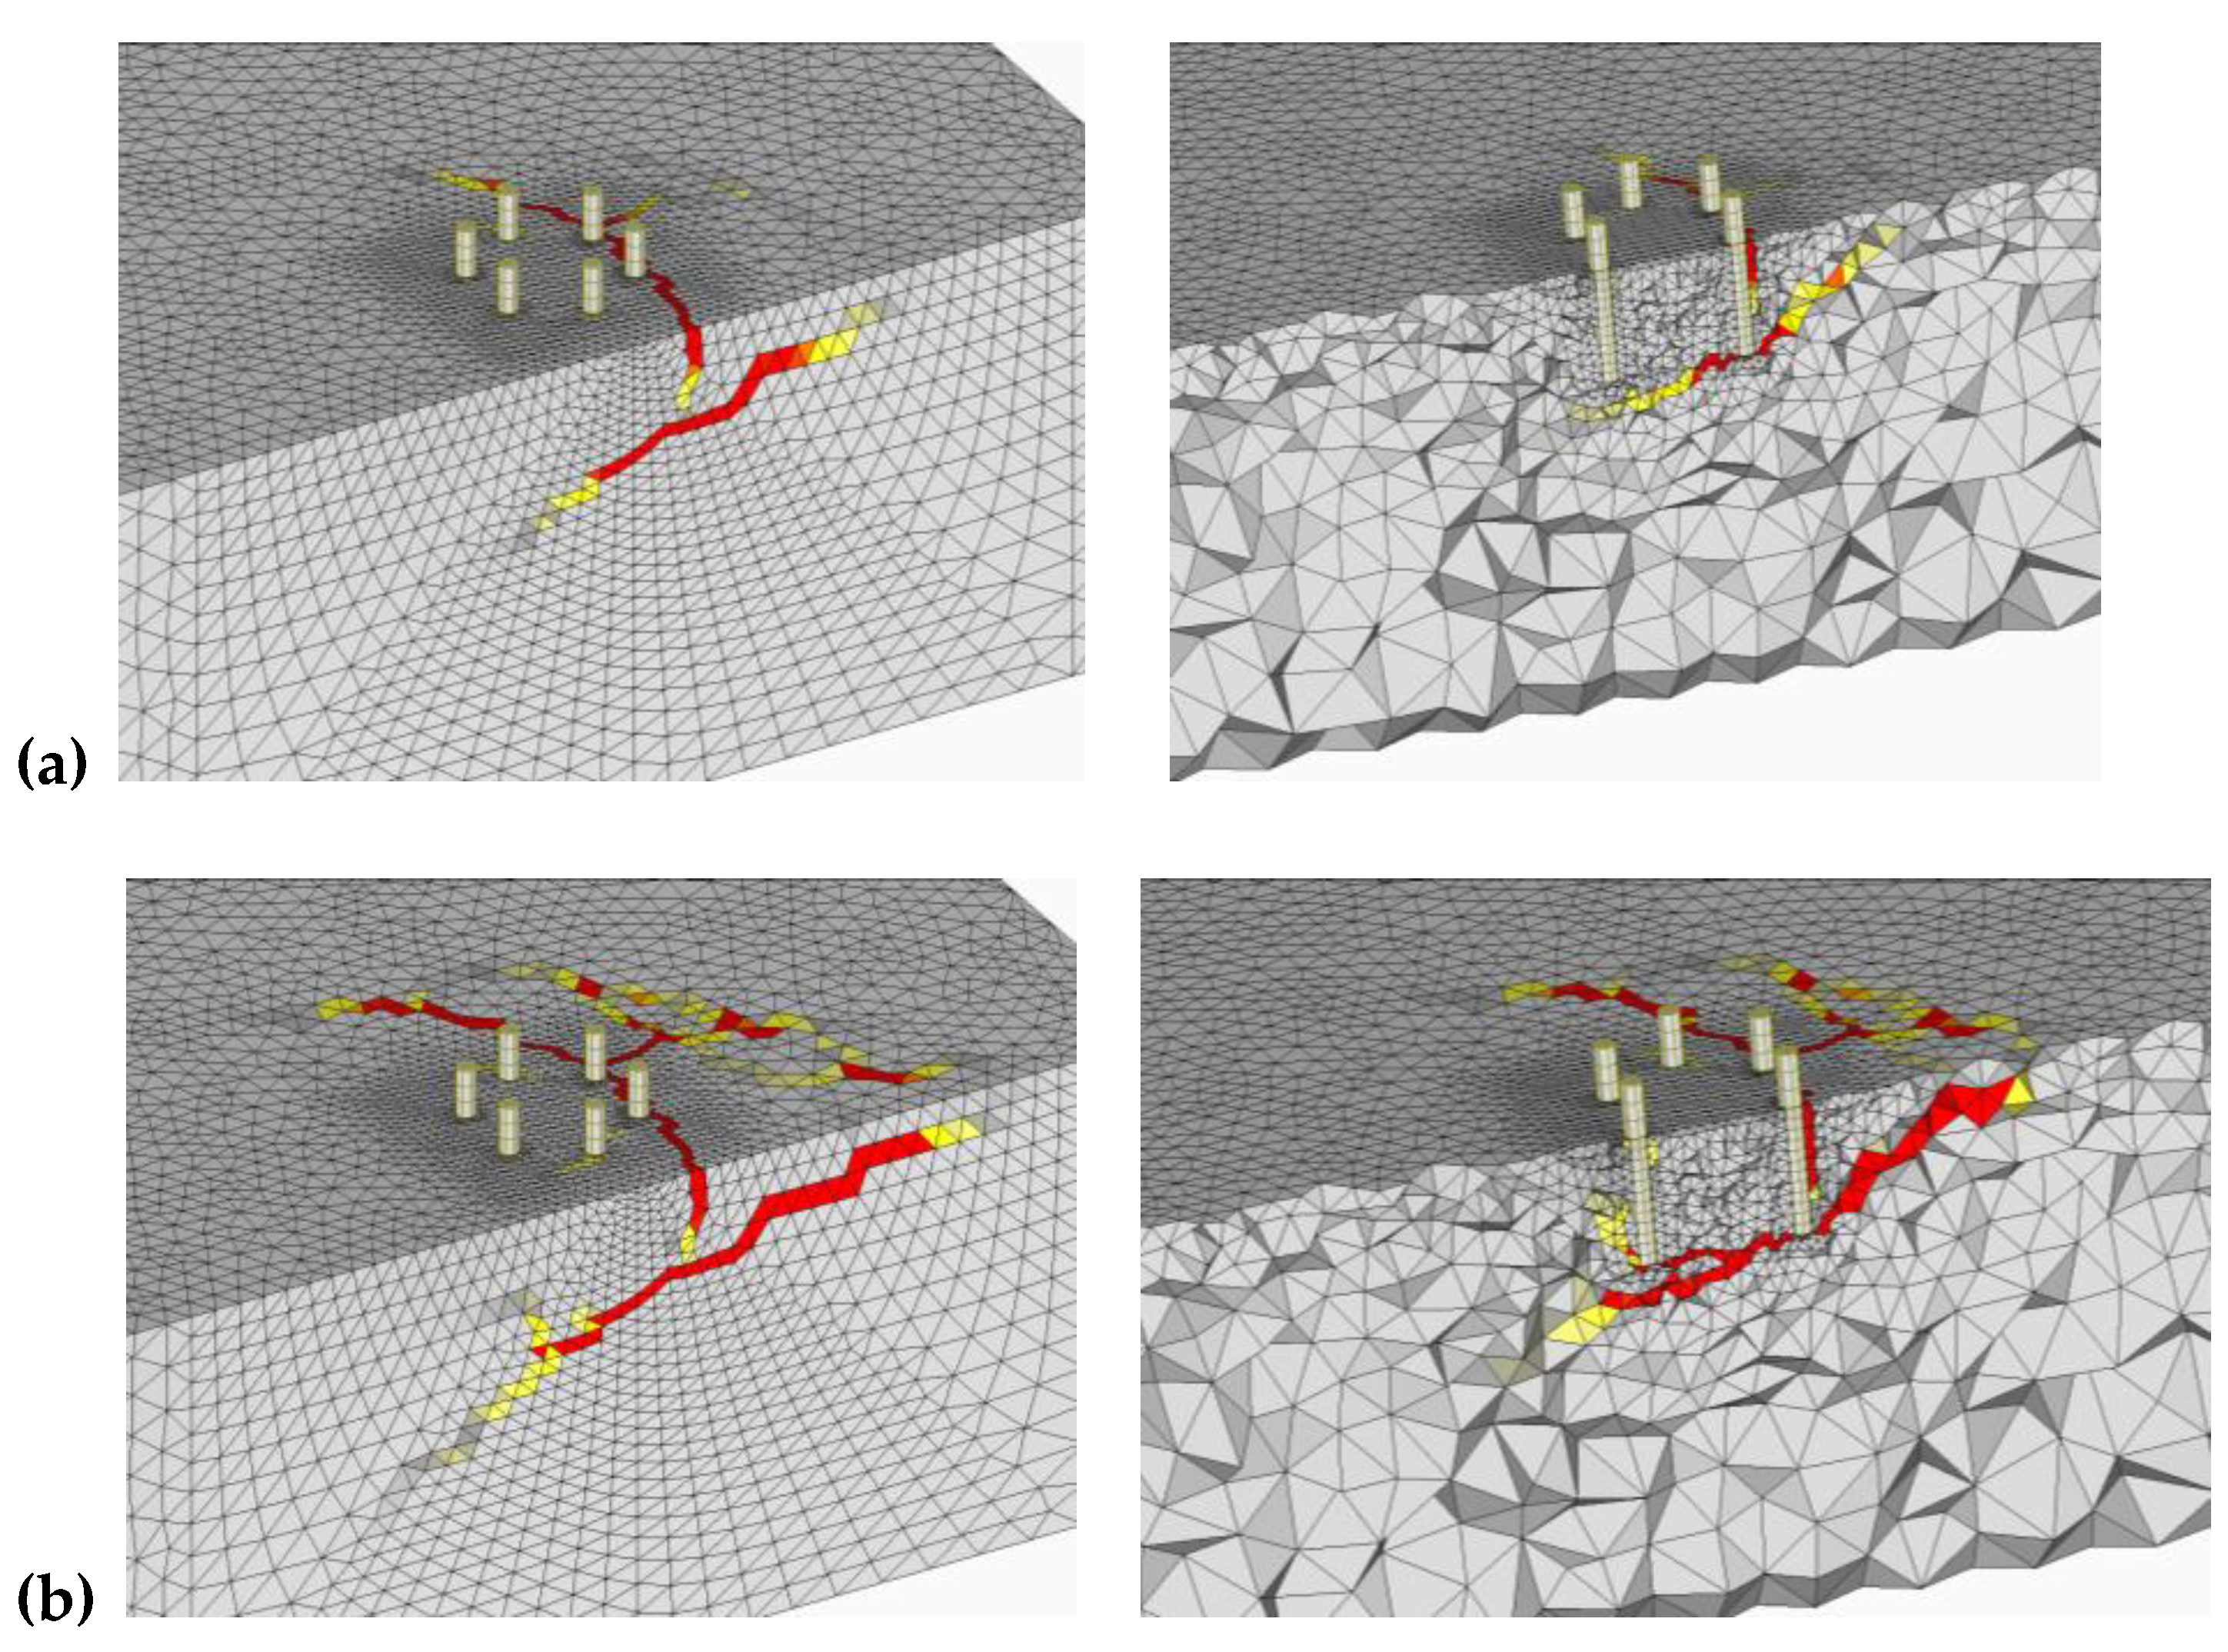
Group Tri-B was a mirror image of the Group Tri-A with one anchor in the front and two anchors in the back row. Group Tri-B displayed same initial stiffness as for Group Tri-A due to the same number of anchors in the group. This is understandable since the shear stiffness of the anchors in normal concrete is considered fairly independent of the edge distance provided that all other installation parameters are the same [9,13,14,29]. However, due to different orientation of the anchors, this group reached a higher failure load. The load-displacement curve given in Figure 6 shows that both the groups display a similar load-displacement response qualitatively. For the group Tri-B loaded perpendicular to the edge, the failure load was 107.9 kN, which is approximately 11% higher than the value obtained for Group Tri-A when loaded perpendicular to the edge. This difference can be explained by the fact that in series GS-Tri-B, the back anchor row can activate more concrete due to the presence of two anchors. The crack pattern obtained from the numerical analysis is depicted in Figure 9. We can see that the failure crack developed from the back anchor row, and there is only a small concrete crushing visible at the front anchor. In addition, a vertical crack has developed from the front anchor in the post-peak, and a secondary crack is visible behind the back anchor in the post-peak phase.
For the case of Group Tri-B loaded parallel to the concrete edge, the ultimate load was obtained as 230.4 kN, which is approximately 2.1 times the failure load of the Group Tri-B loaded perpendicular to the edge. The first crack appears from the right back anchor even if it is further away from the edge than the front anchor (see Figure 10a). At peak load, a major crack appears from the back anchor that propagates perpendicular to the edge and another crack that propagates parallel to the edge (Figure 10b). Furthermore, a crack appears from the embedment depth of the anchor and propagates inclined upwards to the back side. The post-peak breakout body shows several cracks running parallel and perpendicular to the edge and crushing of concrete in front of the anchors. The failure mode appears to be a mix of concrete edge breakout and pryout failure. This is similar to the failure mode observed for Group Tri-A loaded parallel to the edge.

3.2. Hexagonal Anchor Groups

3.2.1. Group Hex-A

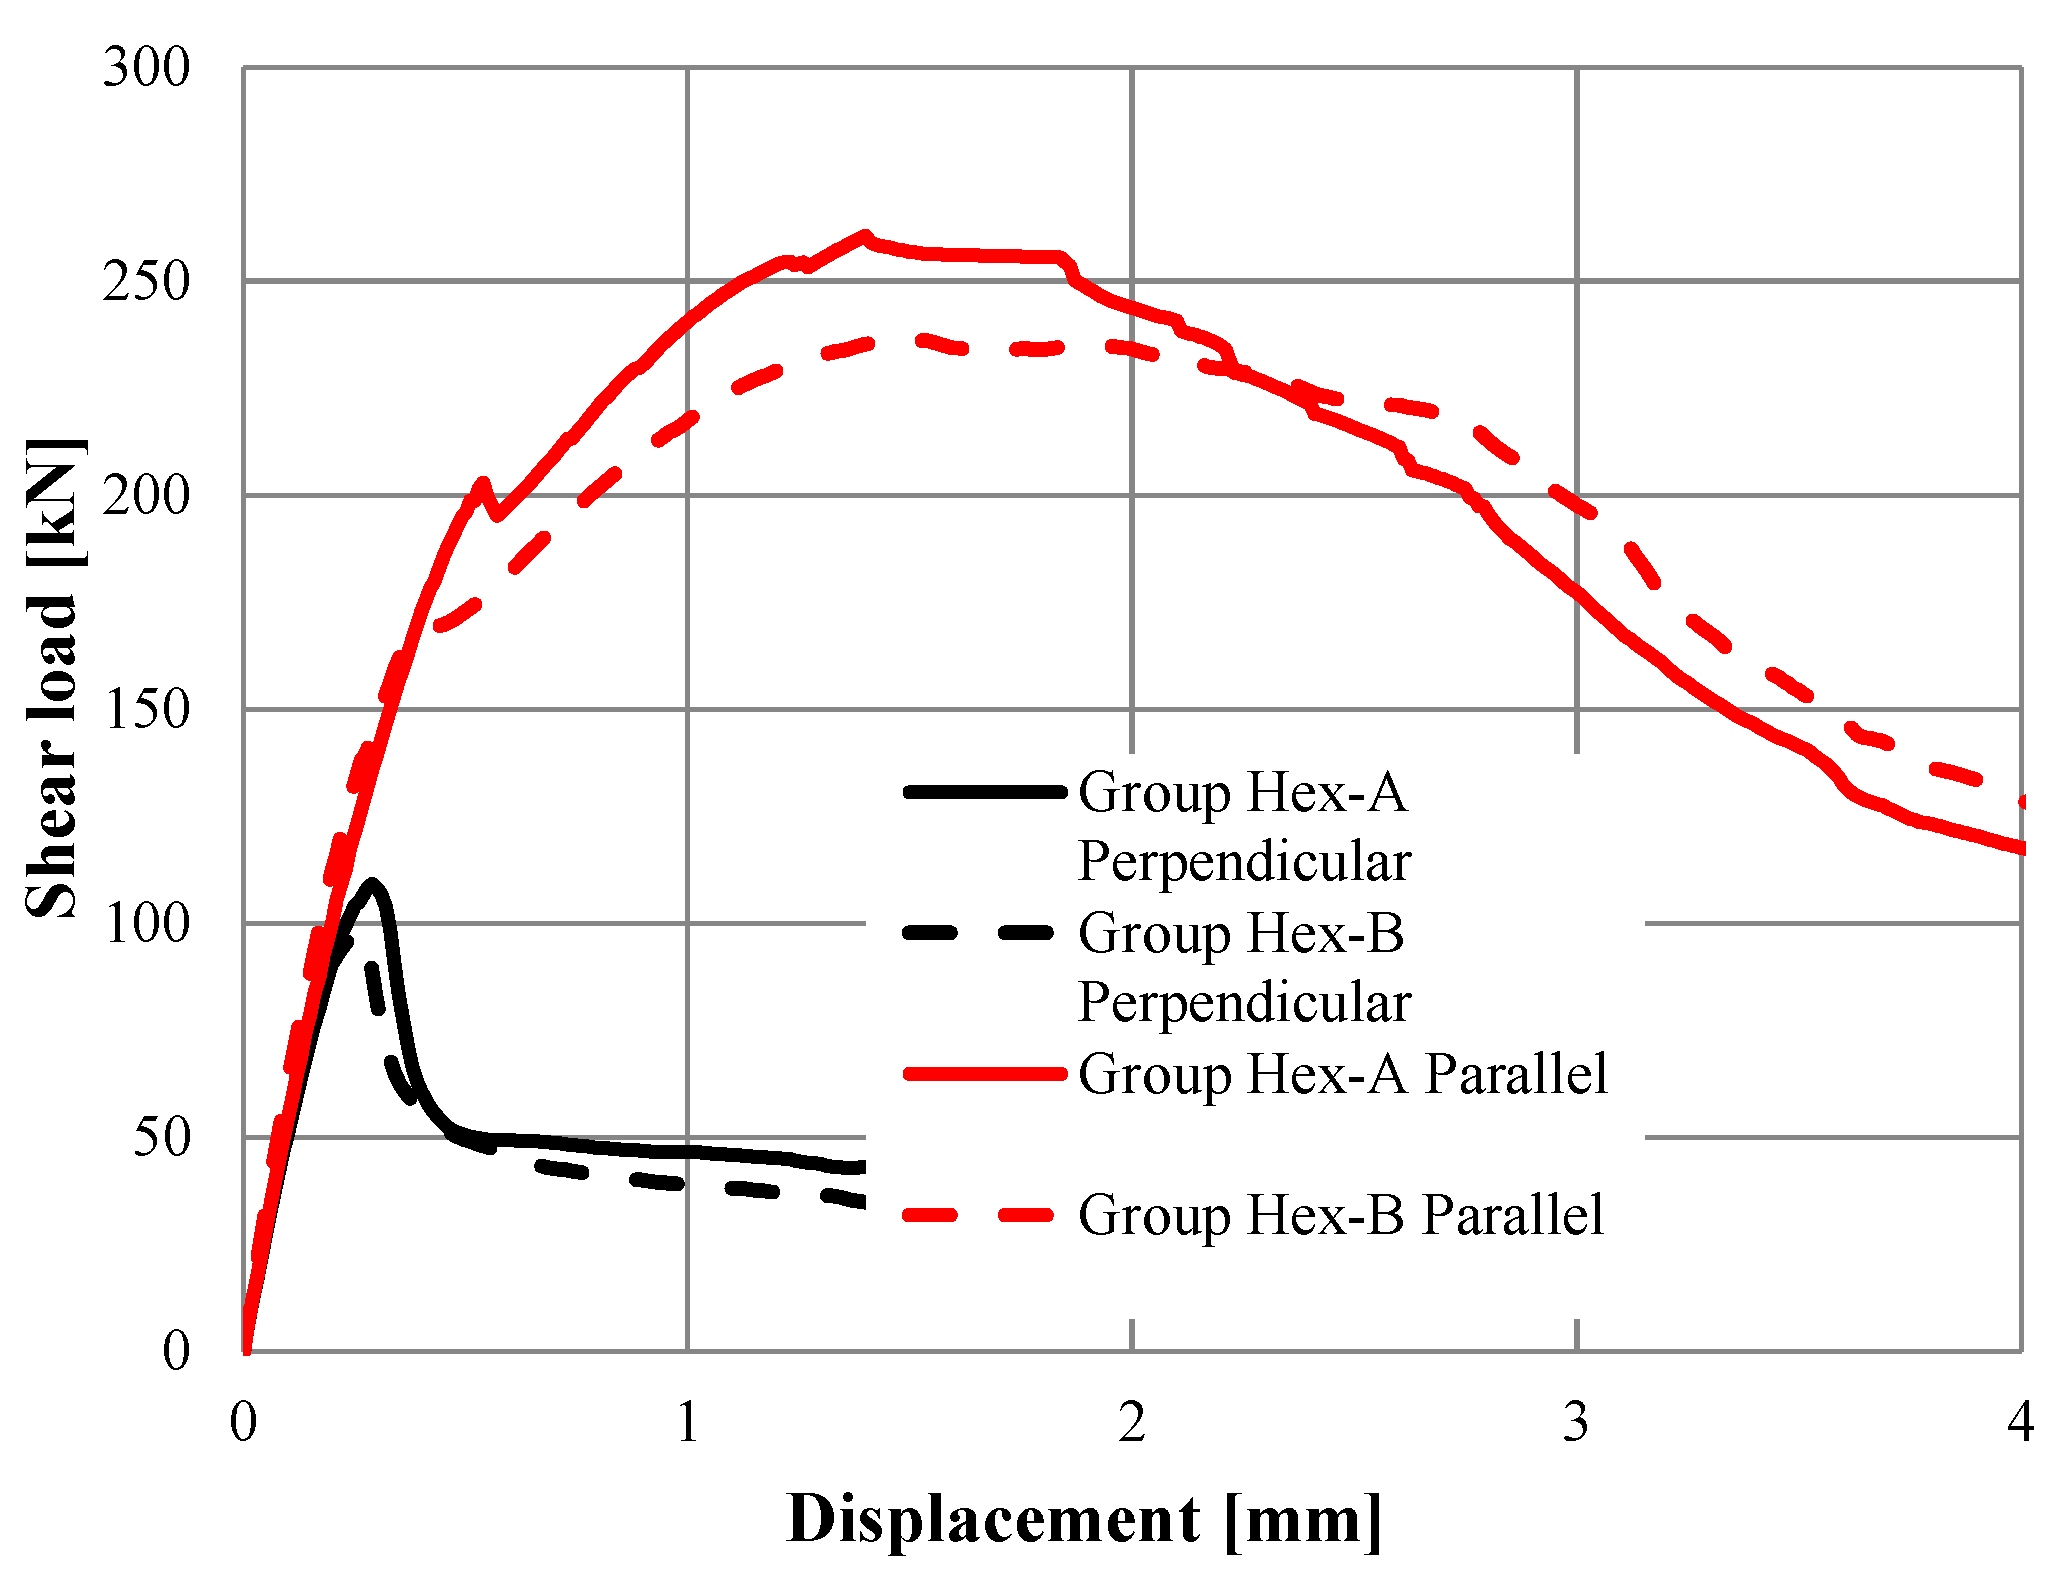
Group Hex-B had six anchors arranged in a regular hexagonal pattern and oriented in a way that three anchor rows were formed with two anchors each in every row (refer to Table 1). The shear load vs. displacement curves obtained from numerical analysis for Group Hex-A loaded perpendicular and parallel to the edge are depicted in Figure 11. The numerically obtained failure load of the group Hex-A loaded perpendicular to the edge was 109.2 kN, which is rather close to the failure load obtained for the case of group Tri-B under similar loading scenario. This can be explained by the fact that the edge distance of the back anchor row is same for both the cases (see Table 1). It was observed that the anchor spacing of the last anchor row is somewhat larger for group Tri-B (120 mm) than for group Hex-A (80 mm). Nevertheless, the failure load obtained for group Hex-A is slightly larger than group Tri-B, which may be attributed to the higher number of anchors resulting in lower pressure in front of the anchors for group Hex-A than for group Tri-B.
The influence of having a greater number of anchors in the group can be seen by comparing the failure load of the group Hex-A loaded parallel to the edge (260.7 kN), which was approximately 2.4 times the failure load for the same group loaded perpendicular to the edge. Thus, the current regulations stating that the concrete edge failure load of an anchor group loaded parallel to the edge may be taken as twice the concrete edge resistance of the same group loaded perpendicular to the edge seems valid (although a bit conservative) for hexagonal groups as well. Once again, the initial stiffness of the group appears to be independent of the direction of shear loading.
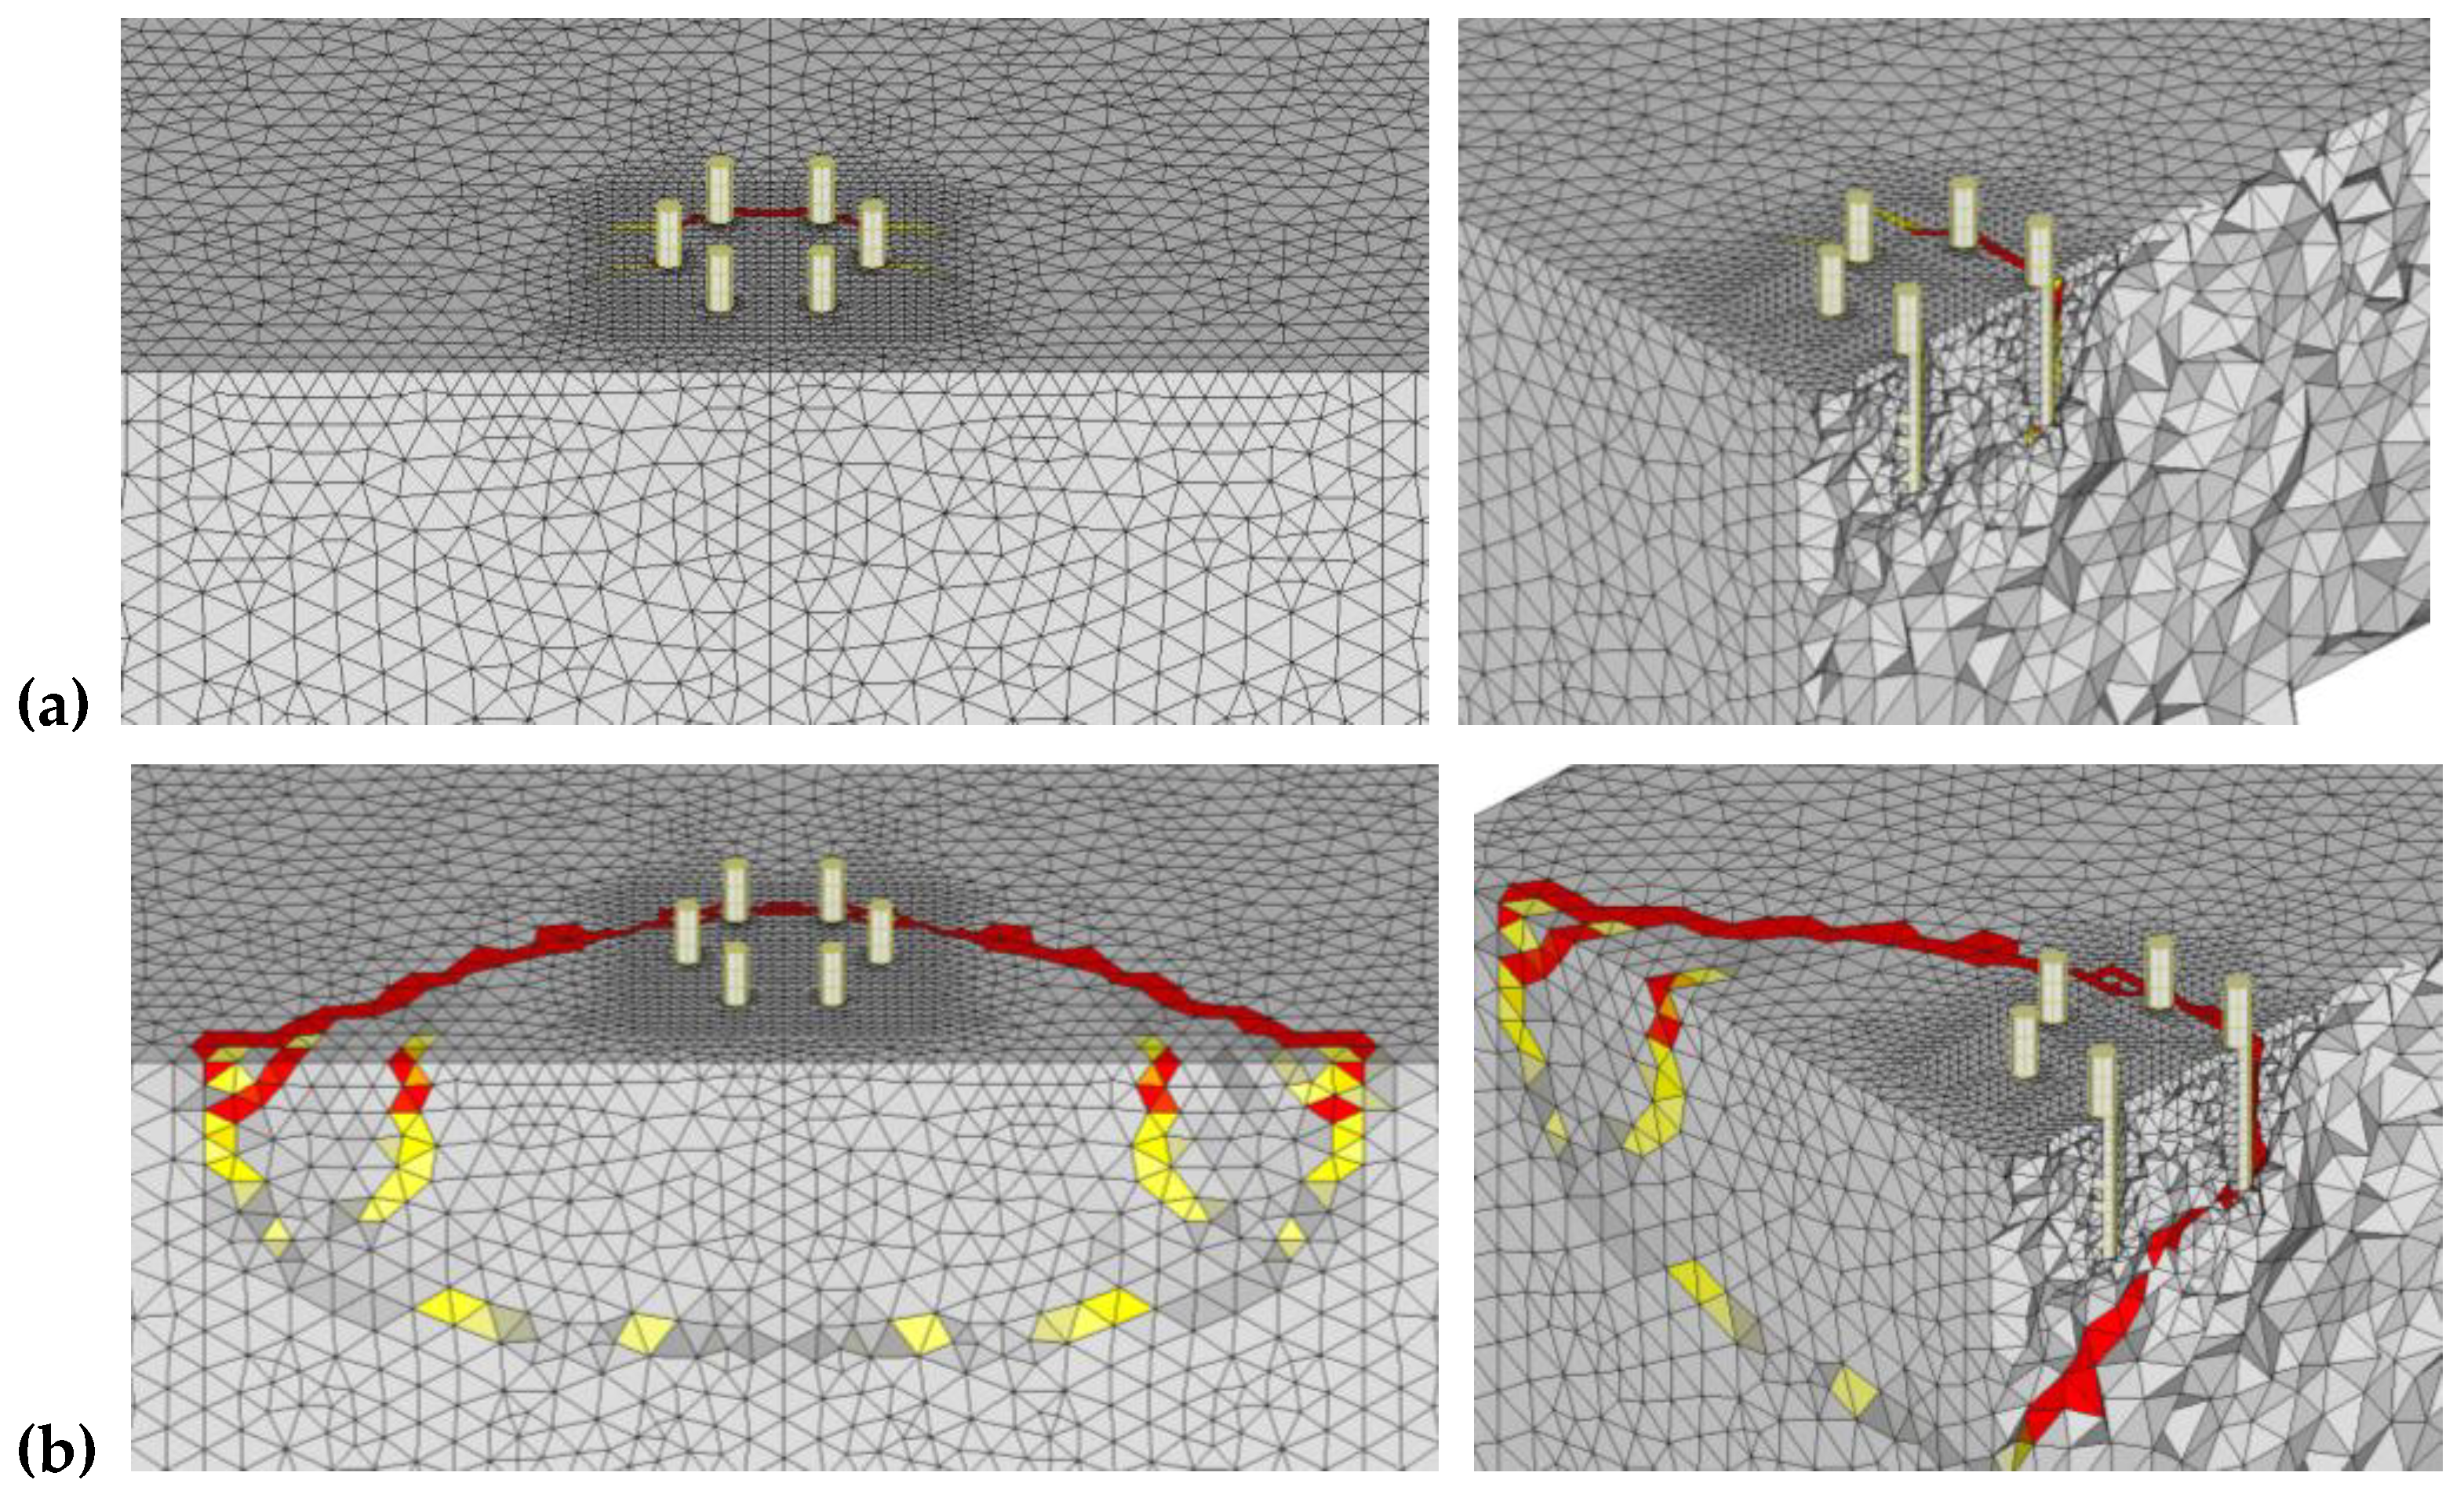
The numerically obtained failure crack pattern for group Hex-A loaded perpendicular to the edge is depicted in Figure 12 for (a) peak load, and (b) the post-peak phase. The failure crack originates from the back anchor row and the crack propagates horizontally in between the anchors of the back row and further outward at an angle of approximately 35 degrees. The crack pattern is very similar to the crack pattern obtained in the tests [14]. The view inside the concrete display the crack propagating from the back anchor row towards the front edge at an angle of approximately 35 degrees as well. These crack patterns match very well with the assumption of the CCD method [5] if the failure crack appearing from the back anchor row is considered.
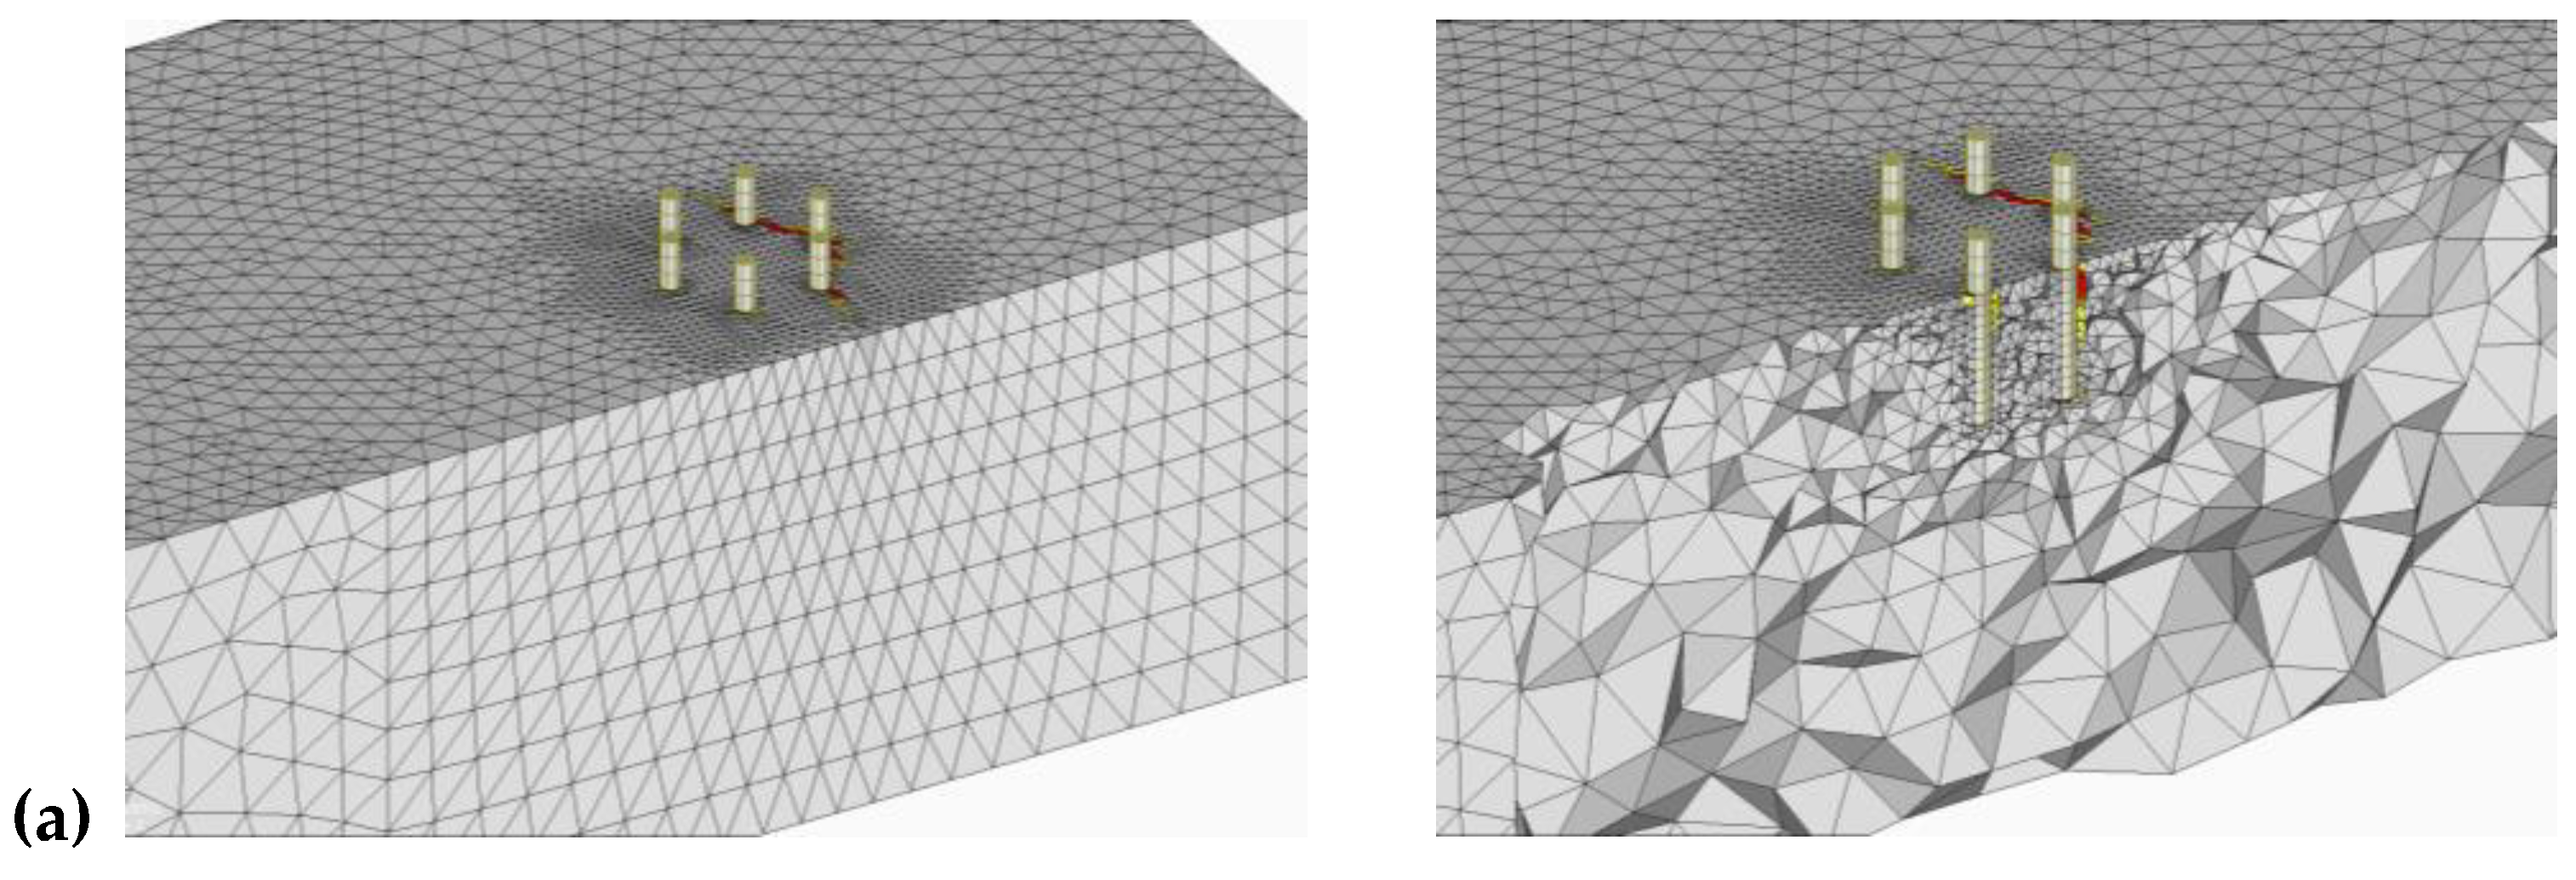
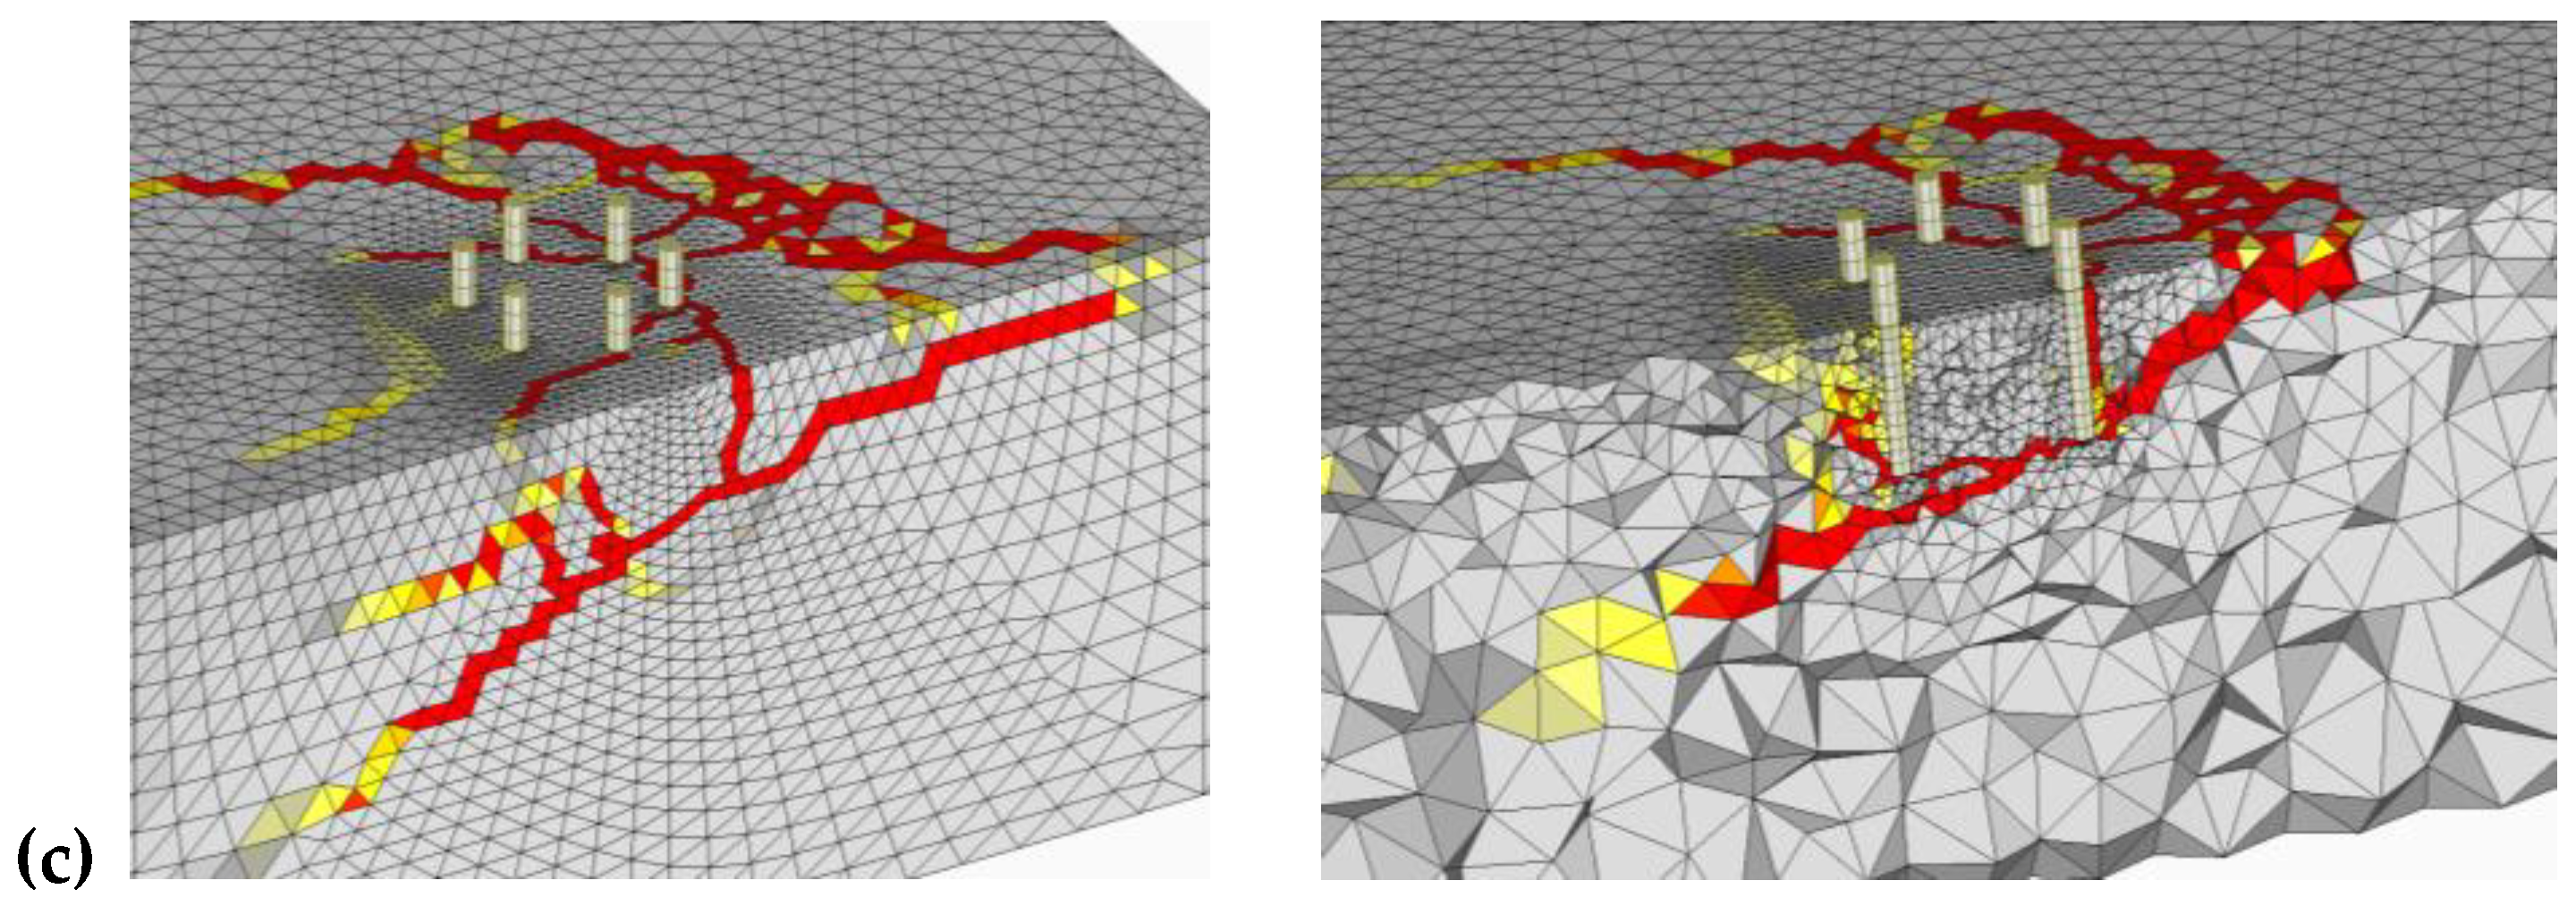
In case of the anchor group Hex-A loaded parallel to the edge, the first crack appears to join the back three anchors (Figure 13a), while at peak load, radial cracks appear from back three anchors. A horizontal crack joining the side anchors appears from the embedment depth (Figure 13b) and then propagates inclined upwards to the concrete surface. This is enhanced in the post-peak phase (Figure 13c) that display several cracks, concrete crushing and a breakout body with the concrete cone forming behind the anchor group (with respect to the loading direction). The same as in case of triangular anchor groups, for this case also the failure mode can be considered as a combination of concrete edge breakout and pryout failure.

3.2.2. Group Hex-B

Group Hex-B had the geometry identical to Group Hex-A, but rotated by 90 degrees. This orientation resulted in 4 anchor rows with one anchor each in the first and the last anchor row and 2 anchors each in second and third anchor row (compare Table 1). The peak load obtained from the analysis for group Hex-B when loaded perpendicular to the edge was 97.8 kN, which is comparable to the failure load obtained for group Tri-A loaded perpendicular to the edge. This is expected since both the groups have only one anchor at the last anchor row with the edge distance of 240 mm. The load-displacement curve given in Figure 11 shows similar characteristics as that for other groups, suggesting a concrete edge breakout failure mode. This is confirmed by the crack pattern obtained from the numerical analysis as depicted in Figure 14. Again, the failure crack developed from the back anchor row (single anchor in the row), and propagates at an angle of approximately 35 degrees to the horizontal.
For group Hex-B loaded parallel to the edge, the peak load attained by the group is 236.2 kN (2.4 times the failure load of the group loaded perpendicular to the edge). The first cracks appear from the two anchors in the back row (with respect to the loading direction) perpendicular to the edge and perpendicular to the loading direction (Figure 15a). At peak load (Figure 15b), a horizontal crack between the anchors appearing from the level of embedment depth is visible that inclines upwards behind the anchor group (with respect to the loading direction). The cracking enhances in the post-peak phase (Figure 15c). The failure mode appears to be a mix of pryout and concrete edge breakout.

4. Comparison with Analytical Models

The numerical simulations performed on anchor groups with anchors arranged in a triangular or hexagonal pattern show that for the investigated anchorages loaded perpendicular to the edge, where no annular gap exists between the base plate and the anchors, the failure crack appears from the back anchor row. This is in agreement with the previous research [6,7,9,30,31], which showed that, when an anchor group having a ratio of anchor spacing to edge distance (s1/c1,1) less than 1.0 and loaded in shear perpendicular to the concrete edge, the crack origination from the front row is suppressed by the compression field that originates from the back anchor row. Therefore, it is attempted to calculate the failure load of the anchorages analyzed in this work by adapting the models given in EN1992-4 [1] (considering the failure crack from the front anchor row) and fib Bulletin 58 [3] (considering the failure crack from back anchor row).
Based on the EN 1992-4 [1] and fib Bulletin 58 [3], the mean shear resistance of an anchorage in case of concrete edge failure can be calculated as
V R m , c = V R m , c 0 · A c , V A c , V 0 · Ψ s , V · Ψ h , V · Ψ e c , V · Ψ α , V · Ψ r e , V
where,
V R m , c 0 is the mean basic resistance in case of concrete edge failure of a single anchor in uncracked concrete without any influences and is calculated according to Equation (6)
V R m , c 0 = 1.33 · 2.4 · d n o m α · l f β · f c m · c 1 1.5
α = 0.1 · ( l f c 1 ) 0.5
β = 0.1 · ( d n o m c 1 ) 0.2
where,
d n o m nominal anchor diameter;
l f effective embedment depth; l f = h e f in case of a uniform diameter of the shank of the headed fastener and a uniform diameter of the post-installed fastener;
f c m mean concrete cylinder compressive strength measured on concrete cylinder of ø =150 mm and h = 300 mm, which is convertible from fcc,150 (mean cube compressive strength with side length of a = 150 mm) f c m = 0.8 · f c c , 150 ;
c 1 edge distance (c1 = edge distance of the front row according to EN1992-4 [1] and or edge distance of back row according to fib Bulletin 58 [3]);
A c , V A c , V 0 ratio, takes into account the geometrical effect of spacing as well as of further edge distances and partly the effect of thickness of the concrete member on the resistance.
A c , V 0 reference projected area, A c , V 0 = 4.5 · c 1 2 ;
A c , V area of the idealised concrete breakout body, limited by the overlapping concrete cones of adjacent fasteners ( s 3 · c 1 ) as well as by edges parallel to the assumed loading direction ( c 2 1.5 · c 1 ) and by member thickness ( h 1.5 · c 1 );
Ψ s , V takes account of the disturbance of the distribution of stresses in the concrete due to further edges of the concrete member on the shear resistance;
Ψ h , V takes account of the fact that the concrete edge resistance does not decrease proportionally to the member thickness as assumed by the ratio A c , V A c , V 0 ;
Ψ e c , V takes into account a group effect when different shear loads are acting on the individual fasteners of a group (eccentric loading);
Ψ α , V takes account of the influence of a shear load inclined to the edge under consideration on the concrete edge resistance;
Ψ r e , V takes account of the effect of reinforcement located on the edge
Since the models given in [1,3] are valid for rectangular groups only, the calculations were done based on following modifications. For the calculation of mean concrete edge resistance according to EN1992-4 [1], only the front anchor row was considered, while applying Equation (5) through Equation (8). Similarly, for the calculation of the mean concrete edge breakout capacity according to fib Bulletin 58 [3], only the back anchor row was considered. For example, for Group Tri-A, c1 is taken as 120mm (corresponding to front anchor row, see Table 1 for calculations according to EN1992-4, while for calculations according to fib Bulletin 58, c1 is taken as 240 mm (corresponding to back anchor row, see Table 1).
The failure loads thus calculated are summarized and compared with the results of the numerical analyses in Table 2. It can be seen that for all the cases, considering the failure crack from back anchor row on the basis of fib Bulletin 58 results in values similar to those obtained from the analyses. On contrary, considering the failure crack from the front anchor row according to EN1992-4 results in rather conservative estimates of failure loads. Therefore, for such anchorages, considering the failure crack from the back anchor row seems reasonable. However, it must be noted that these observations are valid only for the cases where no annular gap exists between the anchor and the base plate (zero-hole clearance). It has been shown by Bokor [14] that the hole clearance pattern can have a significant negative influence on the load-displacement behavior as well as the concrete edge breakout capacity of the anchorages.
Furthermore, the results of the numerical analysis obtained for the cases with loading parallel to the edge are compared with the corresponding analytical values calculated assuming that the resistance of an anchorage loaded parallel to the edge is twice the resistance of the same anchorage loaded perpendicular to the edge (Table 3). It can be seen that this assumption followed in the current norms fits rather well also for the results obtained for triangular and hexagonal anchorages investigated in this work. Once again, the failure loads calculated according to fib Bulletin 58 (assuming the failure crack from back anchor row) fit the results of numerical analysis quite well. The resistance calculated assuming the failure crack from the front anchor row (approach given by EN1992-4) is rather conservative in all the investigated cases.

5. Summary and Conclusions

In this work, 3D finite element numerical simulations were carried out on anchor groups with bonded anchors arranged in a triangular and hexagonal pattern and loaded in shear perpendicular to the edge or parallel to the edge. The target failure mode for the investigations was concrete edge failure. The following major conclusions could be drawn from this work:
1. In all of the cases loaded perpendicular to the edge, a failure crack appeared from the back anchor row. This is attributed to the fact that the anchor groups were considered without any hole clearance and the spacing to edge distance was limited to 1.0.
2. It seems reasonable to calculate the concrete edge resistance of the group by assuming the failure crack appearing from the back anchor row and considering the number of anchors and the anchor spacing in the back anchor row.
3. The failure load of the groups loaded in shear parallel to the edge can be considered as twice the failure load of the corresponding groups loaded in shear perpendicular to the edge.
Note: The conclusions given above are based purely on the results of the numerical analysis on the limited configurations considered in this work. This includes only triangular and hexagonal configurations subjected to shear loads without any hole clearance and without any eccentricity. Furthermore, the ratio of anchor spacing to the edge distance is limited to 1.0.
Experimental investigations are needed to confirm the findings of this work as well as to verify the influence of various aspects on the shear behavior of non-rectangular anchorages. In general, a displacement-based approach is required that can consider the influence of important aspects such as the anchorage geometry, loading position, hole clearance pattern, etc. on the performance of anchorages under shear loads. One such approach has been worked out by Bokor [14] and will be presented in a future publication.

Author Contributions

Conceptualization, B.B. and A.S.; methodology, B.B. and A.S.; formal analysis, B.B., A.S.; data curation, B.B.; writing—original draft preparation, B.B.; writing—review and editing, A.S.; supervision, A.S. All authors have read and agreed to the published version of the manuscript.

Funding

This research received no external funding.

Institutional Review Board Statement

Not applicable.

Informed Consent Statement

Not applicable.

Data Availability Statement

Not applicable.

Conflicts of Interest

The authors declare no conflict of interest.

References

  1. EN 1992-4. Eurocode 2: Design of Concrete Structures—Part 4: Design of Fastenings for Use in Concrete; European Committee for Standardization (CEN): Brussels, Belgium, 2018. [Google Scholar]
  2. ACI 318. Building Code Requirements for Structural Concrete (ACI 318-19) and Commentary (ACI 318R-19); American Concrete Institute: Farmington Hills, MI, USA, 2019. [Google Scholar]
  3. Fédération Internationale du Béton: Design of Anchorages in Concrete: Part I-V; International Federation for Structural Concrete: Lausanne, Switzerland, 2011.
  4. Eligehausen, R.; Mallée, R.; Silva, J.F. Anchorage in Concrete Construction; Ernst & Sohn: Berlin, Germany, 2006. [Google Scholar]
  5. Fuchs, W.; Eligehausen, R.; Breen, J.E. Concrete Capacity Design (CCD) Approach for Fastening to Concrete. ACI Struct. J. 1995, 92, 73–94. [Google Scholar]
  6. Hofmann, J. Tragverhalten und Bemessung von Befestigungen unter Beliebiger Quer-Belastung in Ungerissenem Beton. Ph.D. Thesis, Institute of Construction Materials, University of Stuttgart, Stuttgart, Germany, January 2005. [Google Scholar]
  7. Sharma, A.; Eligehausen, R.; Asmus, J. Experimental investigations on concrete edge failure of multiple row anchorages with supplementary reinforcement. Struct. Concr. 2017, 18, 153–163. [Google Scholar] [CrossRef]
  8. Sharma, A.; Eligehausen, R.; Asmus, J. Comprehensive experimental investigations on anchorages with supplementary reinforcement. In Proceedings of the 3rd International Symposium on Connections between Steel and Concrete, Stuttgart, Germany, 27–29 September 2017. [Google Scholar]
  9. Grosser, P. Load-Bearing Behavior and Design of Anchorages Subjected to Shear and Torsion Loading in Uncracked Concrete. Ph.D. Thesis, Institute of Construction Materials, University of Stuttgart, Stuttgart, Germany, January 2012. [Google Scholar]
  10. Cook, R.A.; Halcovage, K.M.; Ansley, M.H. Anchor Embedment Requirement for Signal/Sign Structures. Ph.D. Thesis, University of Florida, Gainesville, FL, USA, July 2007. [Google Scholar]
  11. Bokor, B.; Sharma, A.; Hofmann, J. Experimental investigations on concrete cone failure of rectangular and nonrectangular anchor groups. Eng. Struct. 2019, 188, 202–217. [Google Scholar] [CrossRef]
  12. Bokor, B.; Sharma, A.; Hofmann, J. Spring modeling approach for evaluation and design of tension loaded anchor groups in case of concrete cone failure. Eng. Struct. 2019, 197, 109414. [Google Scholar] [CrossRef]
  13. Bokor, B.; Sharma, A.; Hofmann, J. Experimental investigations on the concrete edge failure of shear loaded anchor groups of rectangular and non-rectangular configurations. Eng. Struct. 2020, 222, 111153. [Google Scholar] [CrossRef]
  14. Bokor, B. Nonlinear Spring Modeling Approach for the Evaluation of Anchor Groups. Ph.D. Thesis, Institute of Construction Materials, University of Stuttgart, Stuttgart, Germany, 2021. [Google Scholar]
  15. Unterweger, A.; Spyridis, P.; Mihala, R.; Bergmeister, K. Shear Loaded Quadruple Fastenings Close to edge—Experimental and Numerical Analysis. Beton Stahlbetonbau 2008, 1013, 741–747. [Google Scholar] [CrossRef]
  16. Lachinger, S.; Bergmeister, K. Randnahe Mehrfachbefestigungen unter kombinierter Belastung. Beton Stahlbetonbau 2014, 109, 334–343. [Google Scholar] [CrossRef]
  17. Szeląg, M. Development of Cracking Patterns in Modified Cement Matrix with Microsilica. Materials 2018, 11, 1928. [Google Scholar] [CrossRef] [PubMed] [Green Version]
  18. Ožbolt, J.; Li, Y.; Kožar, I. Microplane model for concrete with relaxed kinematic constraint. Int. J. Solids Struct. 2001, 38, 2683–2711. [Google Scholar] [CrossRef]
  19. Bažant, Z.P.; Oh, B.H. Efficient numerical integration on the surface of a sphere. Z. Angewandete Math. Mech. 1986, 66, 37–49. [Google Scholar] [CrossRef]
  20. Bažant, Z.P.; Oh, B.H. Crack band theory for fracture of concrete. Matériaux Constr. 1983, 16, 155–177. [Google Scholar] [CrossRef] [Green Version]
  21. Schmid, K. Tragverhalten und Bemessung von Befestigungen am Bauteilrand mit Rückhängebewehrung unter Querlasten Rechtwenklig zum Rand (Behavior and Design of Anchorages on the Edge with Supplementary Reinforcement under Shear Loads Perpendicular to the Edge). Ph.D. Thesis, Institute of Construction Materials, University of Stuttgart, Stuttgart, Germany, 2010. [Google Scholar]
  22. Fichtner, S. Untersuchungen zum Tragverhalten von Gruppenbefestigungen unter Berücksichtigung der Ankerplattendicke und einer Mörtelschicht (Investigation of the Load-Bearing Behavior of Group Fastenings Taking into Account the Anchor Plate Thickness and a Mortar Layer). Ph.D. Thesis, Institute of Construction Materials, University of Stuttgart, Stuttgart, Germany, 2011. [Google Scholar]
  23. Tóth, M.; Sharma, A.; Hofmann, J. Influence of impact preloading on the residual concrete cone capacity. In Proceedings of the 3rd International Symposium on Connections between Steel and Concrete (ConSC 2017), Stuttgart, Germany, 27–29 September 2017. [Google Scholar]
  24. Ruta, D. Numerical and Experimental Study of Concrete Structures Exposed to Impact and Fire. Ph.D. Thesis, Institute of Construction Materials, University of Stuttgart, Stuttgart, Germany, 2018. [Google Scholar]
  25. Jebara, K.; Ožbolt, J.; Sharma, A. Pryout capacity of headed stud anchor groups with stiff base plate: 3D finite element analysis. Struct. Concr. 2020, 21, 905–916. [Google Scholar] [CrossRef]
  26. Tian, K. Concrete Failure of Headed Stud Fasteners Exposed to Fire and Loaded in Shear: Experimental and Numerical Study. Ph.D. Thesis, Institute of Construction Materials, University of Stuttgart, Stuttgart, Germany, 2019. [Google Scholar]
  27. Tóth, M.; Bokor, B.; Sharma, A. Numerical study on closely spaced anchor groups of identical configurations under centric tension loading. Eng. Struct. 2020, 224, 111245. [Google Scholar] [CrossRef]
  28. Karihaloo, B.L. Fracture Mechanics and Structural Concrete; Longman Scientific and Technical Publishers: London, UK; John Wiley: Hoboken, NJ, USA, 1995; ISBN 0-582-21582-X. [Google Scholar]
  29. Tian, K.; Ožbolt, J.; Sharma, A.; Hofmann, J. Experimental study on concrete edge failure of single headed stud anchors after fire exposure. Fire Saf. J. 2018, 96, 176–188. [Google Scholar] [CrossRef]
  30. Anderson, N.S.; Meinheit, D.F. A review of headed-stud design criteria in the sixth edition of the PCI design handbook. PCI J. 2007, 52, 2–20. [Google Scholar] [CrossRef] [Green Version]
  31. Grosser, P.; Cook, R. Load-Bearing Behavior of Anchor Groups Arranged Perpendicular to the Edge and Loaded by Shear Towards the Free Edge. Ph.D. Thesis, Department of Civil and Coastal Engineering, University of Florida, Gainesville, FL, USA, 2009. [Google Scholar]
Figure 1. Examples of non-rectangular anchor groups used in practice (photos by author).
Civileng 02 00038 g001
Figure 2. Test setup used by Bokor et al. [12] for conducting shear tests on anchorages of (a) triangular configuration and (b) hexagonal configuration (photos by author).
Civileng 02 00038 g002
Figure 3. Concept of the microplane model: integration point with microplanes (left) and decomposition of strain vector on the specified microplane (right)—Figure taken from [16].
Civileng 02 00038 g003
Figure 4. (a) 3D finite element model of GS-Tri-A, (b) base plate and anchos, (c) contact between anchor and concrete and contact between the base plate and concrete surface, (d) bond type bar elements along the anchor shaft and contact type bar elements below the base plate.
Civileng 02 00038 g004aCivileng 02 00038 g004b
Figure 5. Idealized bond stress-slip relationship used to model the behavior of epoxy mortar.
Civileng 02 00038 g005
Figure 6. Load-displacement curves obtained for triangular groups from numerical analysis.
Civileng 02 00038 g006
Figure 7. Crack pattern obtained from numerical analysis for Group Tri-A loaded perpendicular to the edge (a) at peak load, and (b) in post-peak phase.
Civileng 02 00038 g007
Figure 8. Crack pattern obtained from numerical analysis for Group Tri-A loaded parallel to the edge (a) first cracks, (b) at peak load, and (c) post-peak phase.
Civileng 02 00038 g008
Figure 9. Crack pattern obtained from numerical analysis for Group Tri-B loaded perpendicular to the edge (a) at peak load, and (b) post-peak phase.
Civileng 02 00038 g009
Figure 10. Crack pattern obtained from numerical analysis for Group Tri-B loaded parallel to the edge (a) first cracks, (b) at peak load, and (c) post-peak phase.
Civileng 02 00038 g010aCivileng 02 00038 g010b
Figure 11. Load-displacement curves obtained for hexagonal groups from numerical analysis.
Civileng 02 00038 g011
Figure 12. Crack pattern obtained from numerical analysis for Group Hex-A (a) at peak load, and (b) Crack pattern in the post-peak phase.
Civileng 02 00038 g012
Figure 13. Crack pattern obtained from numerical analysis for Group Hex-A loaded parallel to the edge (a) first cracks, (b) at peak load, and (c) post-peak phase.
Civileng 02 00038 g013aCivileng 02 00038 g013b
Figure 14. Crack pattern obtained from numerical analysis for Group Hex-B (a) at peak load, and (b) Crack pattern in the post-peak phase.
Civileng 02 00038 g014
Figure 15. Crack pattern obtained from numerical analysis for Group Hex-B loaded parallel to the edge (a) first cracks, (b) at peak load, and (c) post-peak phase.
Civileng 02 00038 g015aCivileng 02 00038 g015b
Table 1. Main geometric parameters of the cases analyzed in this work.
Series IDAnchor ConfigurationEdge Distance of the Corresponding
Anchor Row [mm]
Anchor Spacing, s [mm]
c11c12c13c14
Tri-A Civileng 02 00038 i001120240--139
Tri-B Civileng 02 00038 i002120240--139
Hex-A Civileng 02 00038 i003101171240-80
Hex-B Civileng 02 00038 i0048012020024080
Table 2. Comparison of numerical results with analytically obtained failure loads for the investigated anchor groups loaded perpendicular to the edge.
Series IDFailure Load from Numerical
Analysis, Vu,num
[kN]
Analytical Mean Failure Loads, Vu,calcRatio
Vu,num/Vu,calc
EN1992-4 [1]
[kN]
Fib Bull. 58 [3]
[kN]
EN1992-4 [1]
[-]
Fib Bull. 58 [3]
[-]
Tri-A96.849.588.41.961.10
Tri-B107.935.7105.43.021.02
Hex-A109.221.488.45.101.24
Hex-B97.836.398.22.691.00
Table 3. Comparison of numerical results with analytically obtained failure loads for the investigated anchor groups loaded parallel to the edge.
Series IDFailure Load From Numerical
Analysis, Vu,num
[kN]
Analytical Mean Failure Loads, Vu,calcRatio
Vu,num/Vu,calc
EN1992-4 [1]
[kN]
Fib Bull. 58 [3]
[kN]
EN1992-4 [1]
[-]
Fib Bull. 58 [3]
[-]
Tri-A213.499.0176.82.161.21
Tri-B230.471.4210.83.231.09
Hex-A260.742.8176.86.091.47
Hex-B236.272.6196.43.251.20
Publisher’s Note: MDPI stays neutral with regard to jurisdictional claims in published maps and institutional affiliations.