Article

Analytical Investigation of Tension Loaded Deformed Rebar Anchors in Concrete

Department of Civil and Architectural Engineering and Construction Management, University of Cincinnati, Cincinnati, OH 45221, USA
*
Author to whom correspondence should be addressed.
CivilEng 2021, 2(2), 442-458; https://doi.org/10.3390/civileng2020025
Submission received: 30 April 2021 / Revised: 28 May 2021 / Accepted: 1 June 2021 / Published: 4 June 2021
(This article belongs to the Special Issue Connections in Concrete)

Abstract

:
Experimental testing of deformed rebar anchors (DRAs) has not been performed extensively, so there is limited test data to understand their failure behavior. This study aims to expand upon these limited tests and understand the behavior of these anchors, when loaded in tension. Analytical benchmark models were created using available test data and a parametric study of deformed rebar anchors was performed. Anchor diameter, spacing, embedment, and number of anchors were varied for a total of 49 concrete breakout simulations. The different failure modes of anchors were predicted analytically, which showed that concrete breakout failure is prominent in the DRA groups. The predicted concrete breakout values were consistent with mean and 5% fractile concrete capacities determined from the ACI concrete capacity design (CCD) method. The 5% fractile factor determined empirically from the simulation results was kc = 26. This value corresponds closely with kc = 24 specified in ACI 318-19 and ACI 349-13 for cast-in place anchors. The analysis results show that the ACI CCD formula can be conservatively used to design DRAs loaded in tension by applying a kc factor no greater than 26.

1. Introduction

Deformed rebar anchors (DRAs) are commonly anchored to thick, concrete walls in safety-related nuclear facilities. These bars, which conform to ASTM A615, are typically butt-welded to embedment plates (Figure 1) or the surface of steel-plate composite (SC) walls. The plates act as attachment locations for pipe brackets and equipment supports. DRAs may be used in straight, hooked, or headed configurations to transfer force between the attachment plate and the concrete wall.
To date, the ACI nuclear code (ACI 349-13) [1] has not specifically addressed this anchor connection type, leading to incorrect assumptions regarding the design of these anchors in tension. Designers have traditionally assumed that if the anchors are embedded at their development length, the capacity of DRAs in tension is controlled by the bar strength in tension, and that concrete modes of failure, such as concrete breakout, are precluded. However, the potential for concrete breakout was demonstrated in a series of large-scale experimental tests conducted by Chicchi et al. [2]. In addition to DRAs, deformed wire anchors (DWAs) conforming to ASTM A496 were also tested. These anchors were grouped in different orientations (i.e., 5 bars × 5 bars, 2 bars × 2 bars) and with different end conditions (straight, hooked), as well as bar diameters (#6, #9, D-41.3). All six large-scale group anchor tests consisted of embedment depths greater than or equal to the development length of the bar. In each test, concrete breakout was the controlling failure mode. In response to that study, the ACI 349-0C committee on Nuclear Structures—Anchorage is currently working on modifying their provisions to include consideration of concrete failures for DRAs in tension. Neglecting the breakout failure mode for tension loaded DRAs may result in this brittle failure to occur at forces lower than what the group anchor assembly was designed for.
DRAs are also used in column–foundation connections [3]. The deformed rebar extending from the base of the column are cast-in-place or post-installed in the foundation and used as end anchorages. In other cases, the column base is provided with an embed plate and post-installed in the foundation using adhesive anchors for which rebar are used as the anchors. DRAs may be designed as end anchorages or as adhesive anchors [4]. End anchorages are designed according to Chapters 23 and 25 of ACI 318-19 [5], which provides guidance on the strut-and-tie concept and reinforcement details. It is assumed that concrete breakout does not occur in end anchorages [6]. Adhesive anchors are designed according to Chapter 17 of ACI 318-19 [5], which considers steel and concrete failure modes for anchors. These failure modes include pullout (bond), steel rupture, concrete breakout, which are discussed later. For the same condition (diameter, number, spacing, embedment depth, concrete, bond, and strength of rebar), the design capacity of DRAs may vary between the end anchorage design method and the adhesive anchor design method [4]. The different capacities for the same application of DRAs may confuse design engineers. Engineers may design DRA groups as end anchorages to achieve greater capacity, but this is not recommended since the design provisions do not sufficiently take group effect of DRAs into account and overestimate the capacity [6]. This group effect is thoroughly considered in the adhesive anchor design method [6]. Therefore, DRA groups designed as end anchorages may lead to unsafe results and should rather be designed based on Chapter 17 of ACI 318-19 [5], which considers concrete failure modes for anchors. Mahrenholtz et al. [7] also proposed designing column-foundation connections with cast-in-place or post-installed deformed reinforcing bars according to Appendix D of ACI 318-11, which is Chapter 17 of ACI 318-19 [5].
This research proposes numerical methods to evaluate the behavior of DRAs loaded in tension in order to expand upon the limited experimental results that have been previously obtained. The experimental results are benchmarked, and the analytical parametric studies of DRA groups are performed by varying anchor diameter, spacing, embedment depth, and orientation of anchors.

Current Code Provisions

DRAs may fail by pullout/bond, steel rupture, or concrete breakout when loaded in uniaxial tension without edge effects. Appendix D of ACI 349-13 [1] and Chapter 17 of ACI 318-19 [5] provide design equations for addressing these potential failure modes. In pullout/bond failure, the anchor slips out of the concrete due to the loss of bond between the anchor and the concrete. Steel rupture occurs when the external tensile force exceeds the tensile strength of the anchor steel. In concrete breakout, a cone-shaped fracture surface is formed in the concrete after the external load exceeds the tensile strength of the concrete. Since this current study explores the potential of concrete breakout in a tension loaded DRA system using practical sizes and dimensions, focus will be given to concrete breakout strength considerations.
Fuchs et al. [8] developed an empirical formula to predict the load capacity of the anchors in concrete breakout failure, commonly known as the Concrete Capacity Design (CCD) method. This approach is implemented in both ACI 349-13 [1] and ACI 318-19 [5] provisions to design cast-in and post-installed anchors for concrete breakout failure. The CCD-based concrete breakout strength of a group of anchors in tension is calculated by equation 17.6.2.1b of ACI 318-19 [5], shown below:
Ncbg = (ANc/ANco)ψec,N ψed,N ψcp,NNb
Ncbg is the nominal concrete breakout strength of a group of anchors in tension. A N c and A N c o represent the projected concrete failure area of the anchor group and single anchor, respectively. The factors ψ e c , N , ψ e d , N , ψ c , N , and ψ c p , N consider load eccentricity, edge effects, concrete cracking, and critical distance of post-installed anchors (to control splitting), respectively. These factors are taken as 1.0 for cases of zero eccentricity, no edge effects, cracked concrete, and use of cast-in anchors. In uncracked concrete, the factor ψ c , N is equal to 1.25 and 1.4 for cast-in and post-installed anchors, respectively. N b is the concrete breakout strength of single anchor in tension in cracked concrete. It is calculated by equation 17.6.2.2.1 of ACI 318-19, reproduced below:
N b = k c   f c h e f   1.5
Here, f c is the compressive strength of the concrete and h e f is the effective embedment depth of the anchor. The empirically derived factor k c is 24 for cast-in anchors and 17 for post-installed anchors in cracked concrete. It represents the factor necessary to predict the 5% fractile strength (with 90% confidence) of concrete breakout in cracked concrete.
A k factor was also empirically derived from the mean of test results in uncracked concrete by Fuchs et al. [8]. Fuchs et al. [8] suggested a mean k factor of 40 for cast-in anchors (headed studs and headed anchor bolts) and 35 for post-installed anchors in uncracked concrete. The kc (5% fractile) factors provided in ACI can be converted to mean k values. These values are 40 and 31.7 for the cast-in anchors and the post-installed anchors, respectively. The k value of 40 for the cast-in anchors is calculated by taking 24 ( k c ) times 1.25 ( ψ c , N ) times 4/3 (a simple factor to convert from 5% fractile to mean). Similarly, the k value of 31.7 for post-installed anchors is calculated by taking 17 ( k c ) times 1.4 ( ψ c , N ) times 4/3.
The CCD method is limited to regular, rectangular configurations with maximum three anchors in a row [9]. Tests of larger anchor groups (exceeding three anchors in a row) are recommended to understand the applicability of the CCD method to these configurations. Some examples of larger anchor group experimental testing are Bokor et al. [10] and Chicchi et al. [2]. Bokor et al. [10] performed tests on expansion anchors and adhesive anchors of different geometric configurations (regular and irregular), with up to eight anchors in a group. Chicchi et al. [2] performed tests on DRA groups with five anchors in a row. The obtained results [2] are used in this paper to perform analytical investigation of rectangular DRA configurations with four, five, and six anchors in a row.
The DRAs used in this study are cast-in-place reinforcing bars, but presumably behave similarly to post-installed adhesive anchors [2]. Additionally, the kc and k factors used in the code provisions were based empirically on headed studs and expansion anchor tests with cracked concrete [8]. ACI 318-19 [5] states that adhesive anchor kc values are approximately equal to the factors derived for expansion anchors; however, with limited experimental data and no additional guidance in the provisions for the application of DRAs, an appropriate adjustment factor for DRAs is not yet known. The work in this paper will consider the application of the CCD approach to the numerical findings and will recommend appropriate k and kc factors for DRAs.

2. Development of Benchmarked Analytical Models

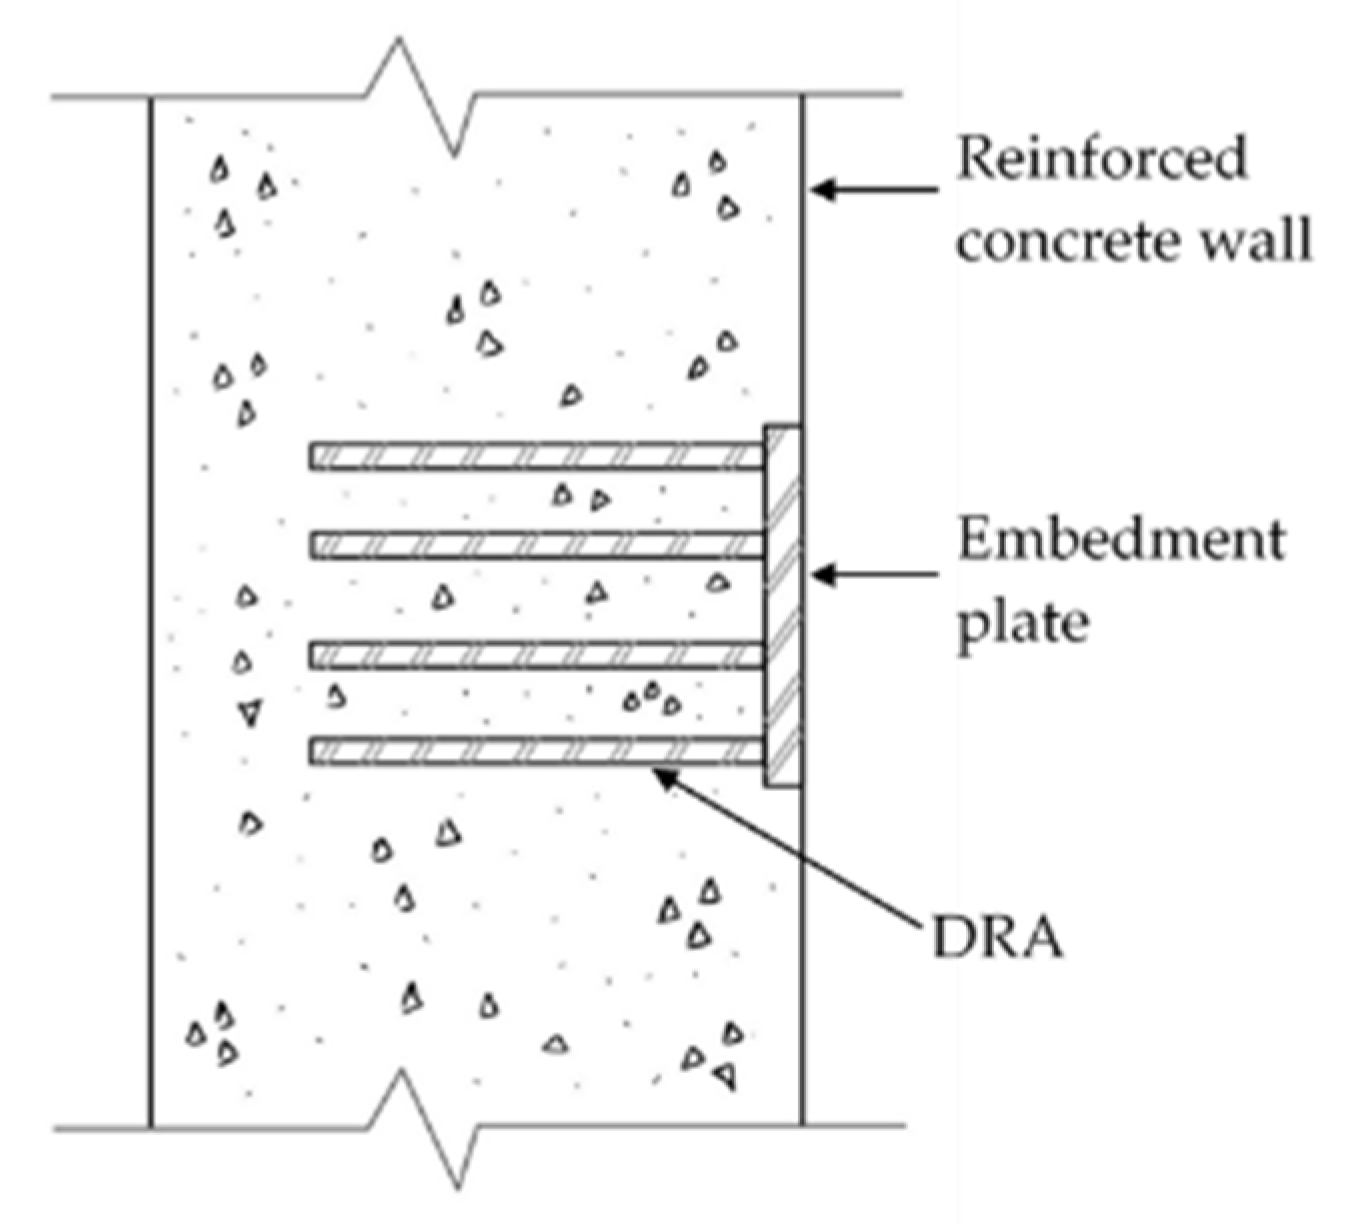
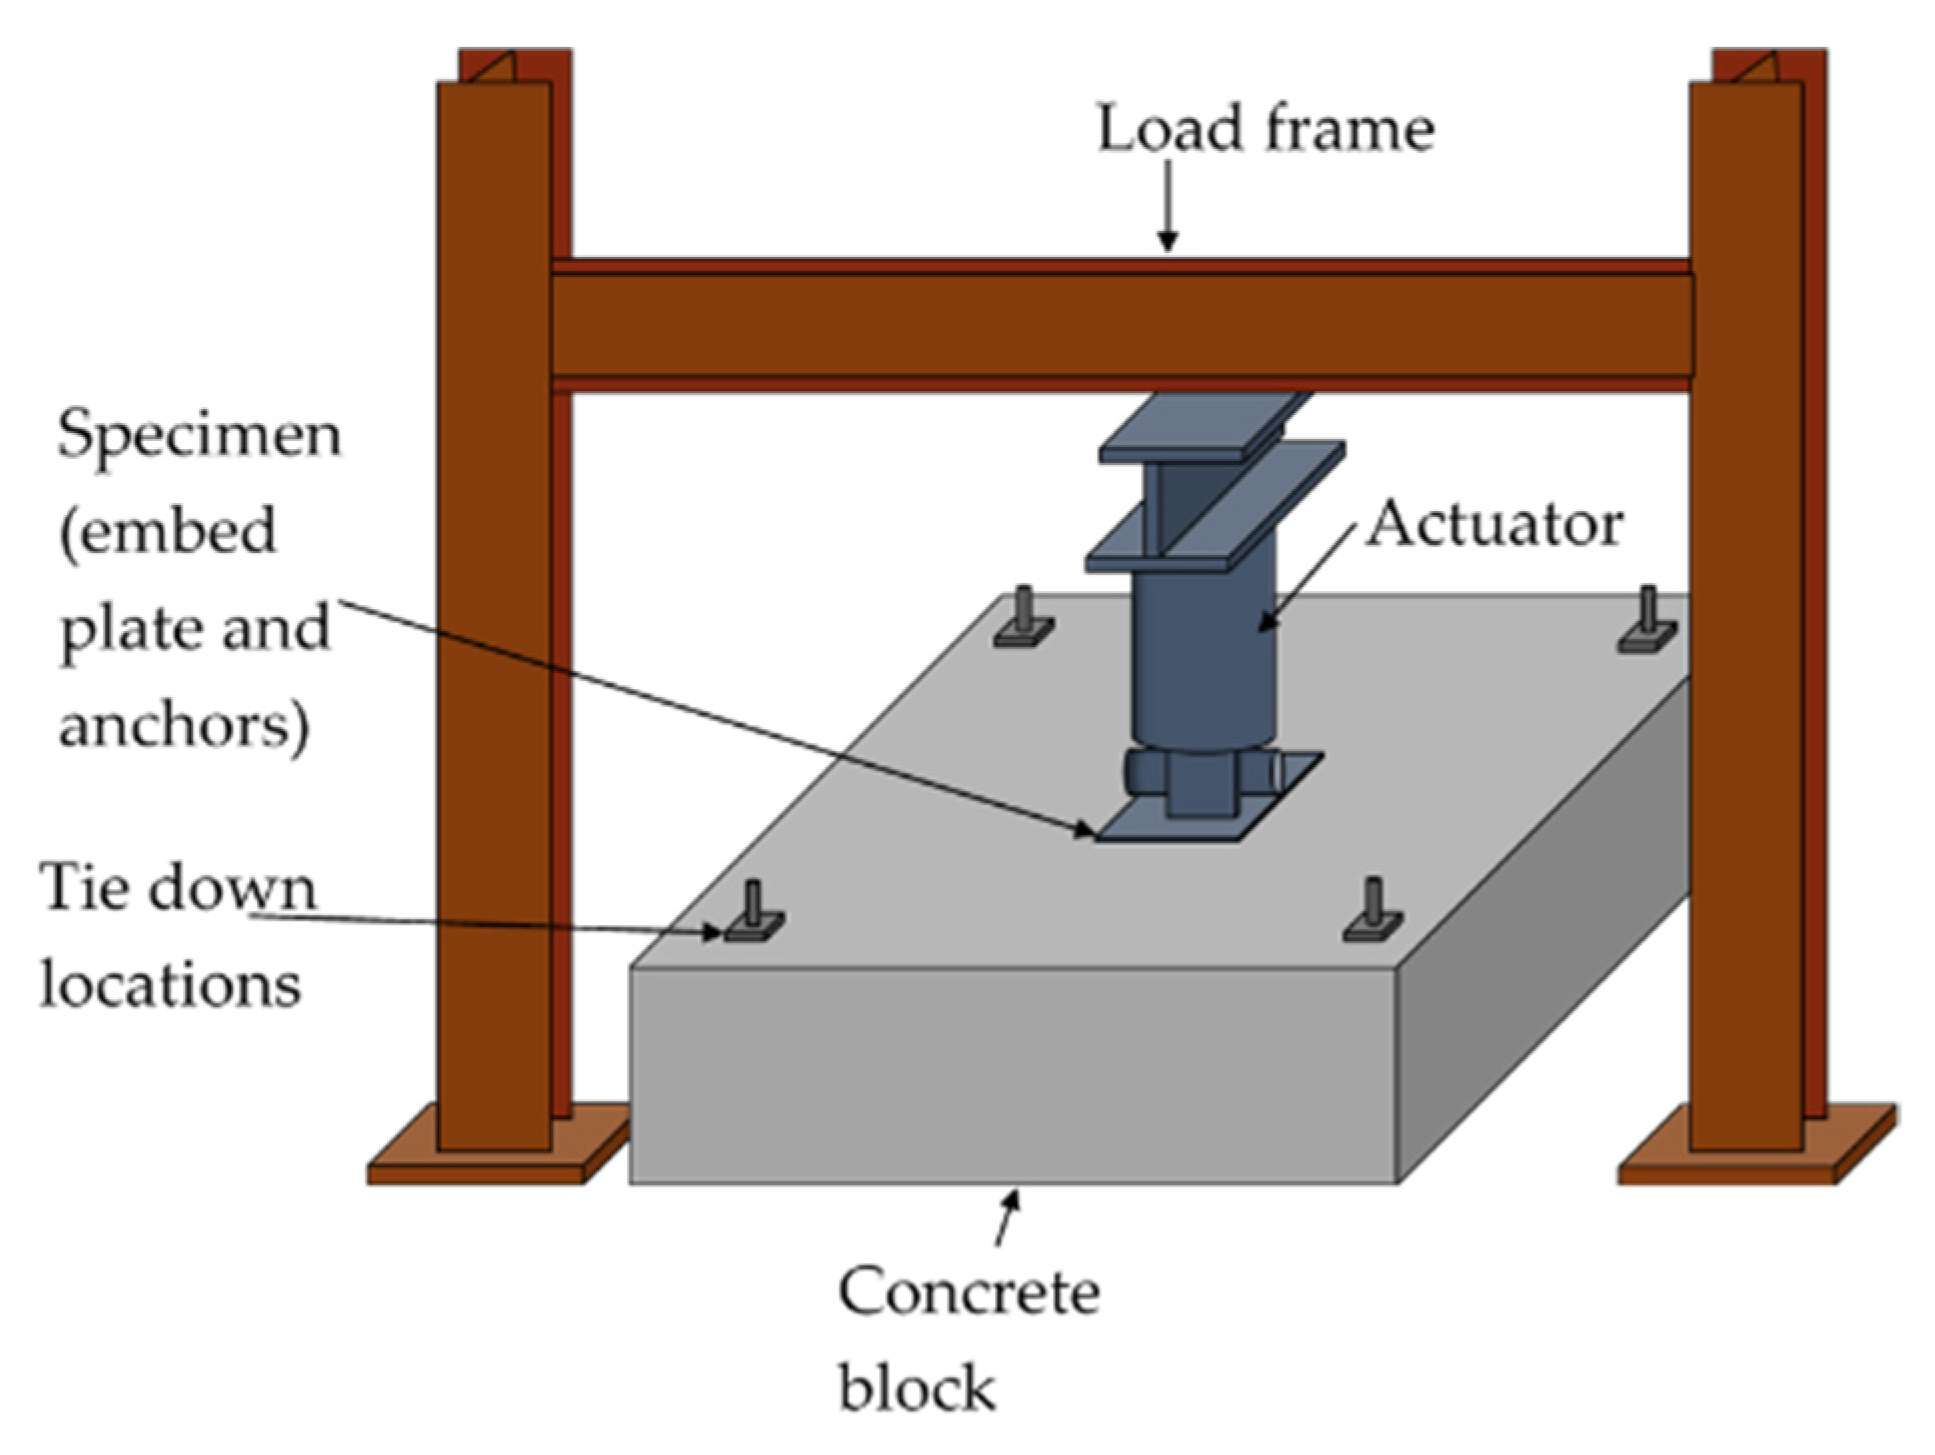
2.1. Previous Physical Experiments

Chicchi et al. [2] conducted pullout tests of groups of DRAs and DWAs embedded in concrete blocks. The tests varied parameters such as the diameter of the anchor (db), anchor configuration (a × b), anchor spacing (s), and anchor embedment depth (hef). The concrete compressive strength ( f c ) also varied in the experiment. The concrete block was 3.5 m by 3.5 m wide, 0.9 m thick, and reinforced with #6 (19 mm) mat rebar at 152 mm and 304 mm on center on its top and bottom surface. In the experiment, the block was post-tensioned in all four corners and the DRAs were cast in the center of the block (Figure 2). The anchors were welded to steel embed plate at the top surface of the concrete. The embed plate was connected to the actuator with the clevis and loaded in tension. The uplift of the concrete block was prevented by the post-tensioned bars at each corner. The actuator was attached to the load frame that stabilized and resisted the actuator’s load.
The available test data of straight DRAs (Table 1) was used to benchmark the modeling approach for the analytical investigation. This includes five single anchor pullout tests and two group anchor tests in the 5 × 5 configuration. Additional tests [2] consisted of bent DRAs and DWAs, which are beyond the scope of this study. A lack of straight bar group anchor physical test results limited the extent of the additional benchmarking that was possible.
The DRA experiments by Chicchi et al. [2] were analyzed with finite element (FE) models using the approach outlined in the following sections in order to verify the proposed material models and simulate the failure modes observed in the experiments. The initial stiffness and the peak loads were appropriately predicted, and the failure modes were correctly simulated.

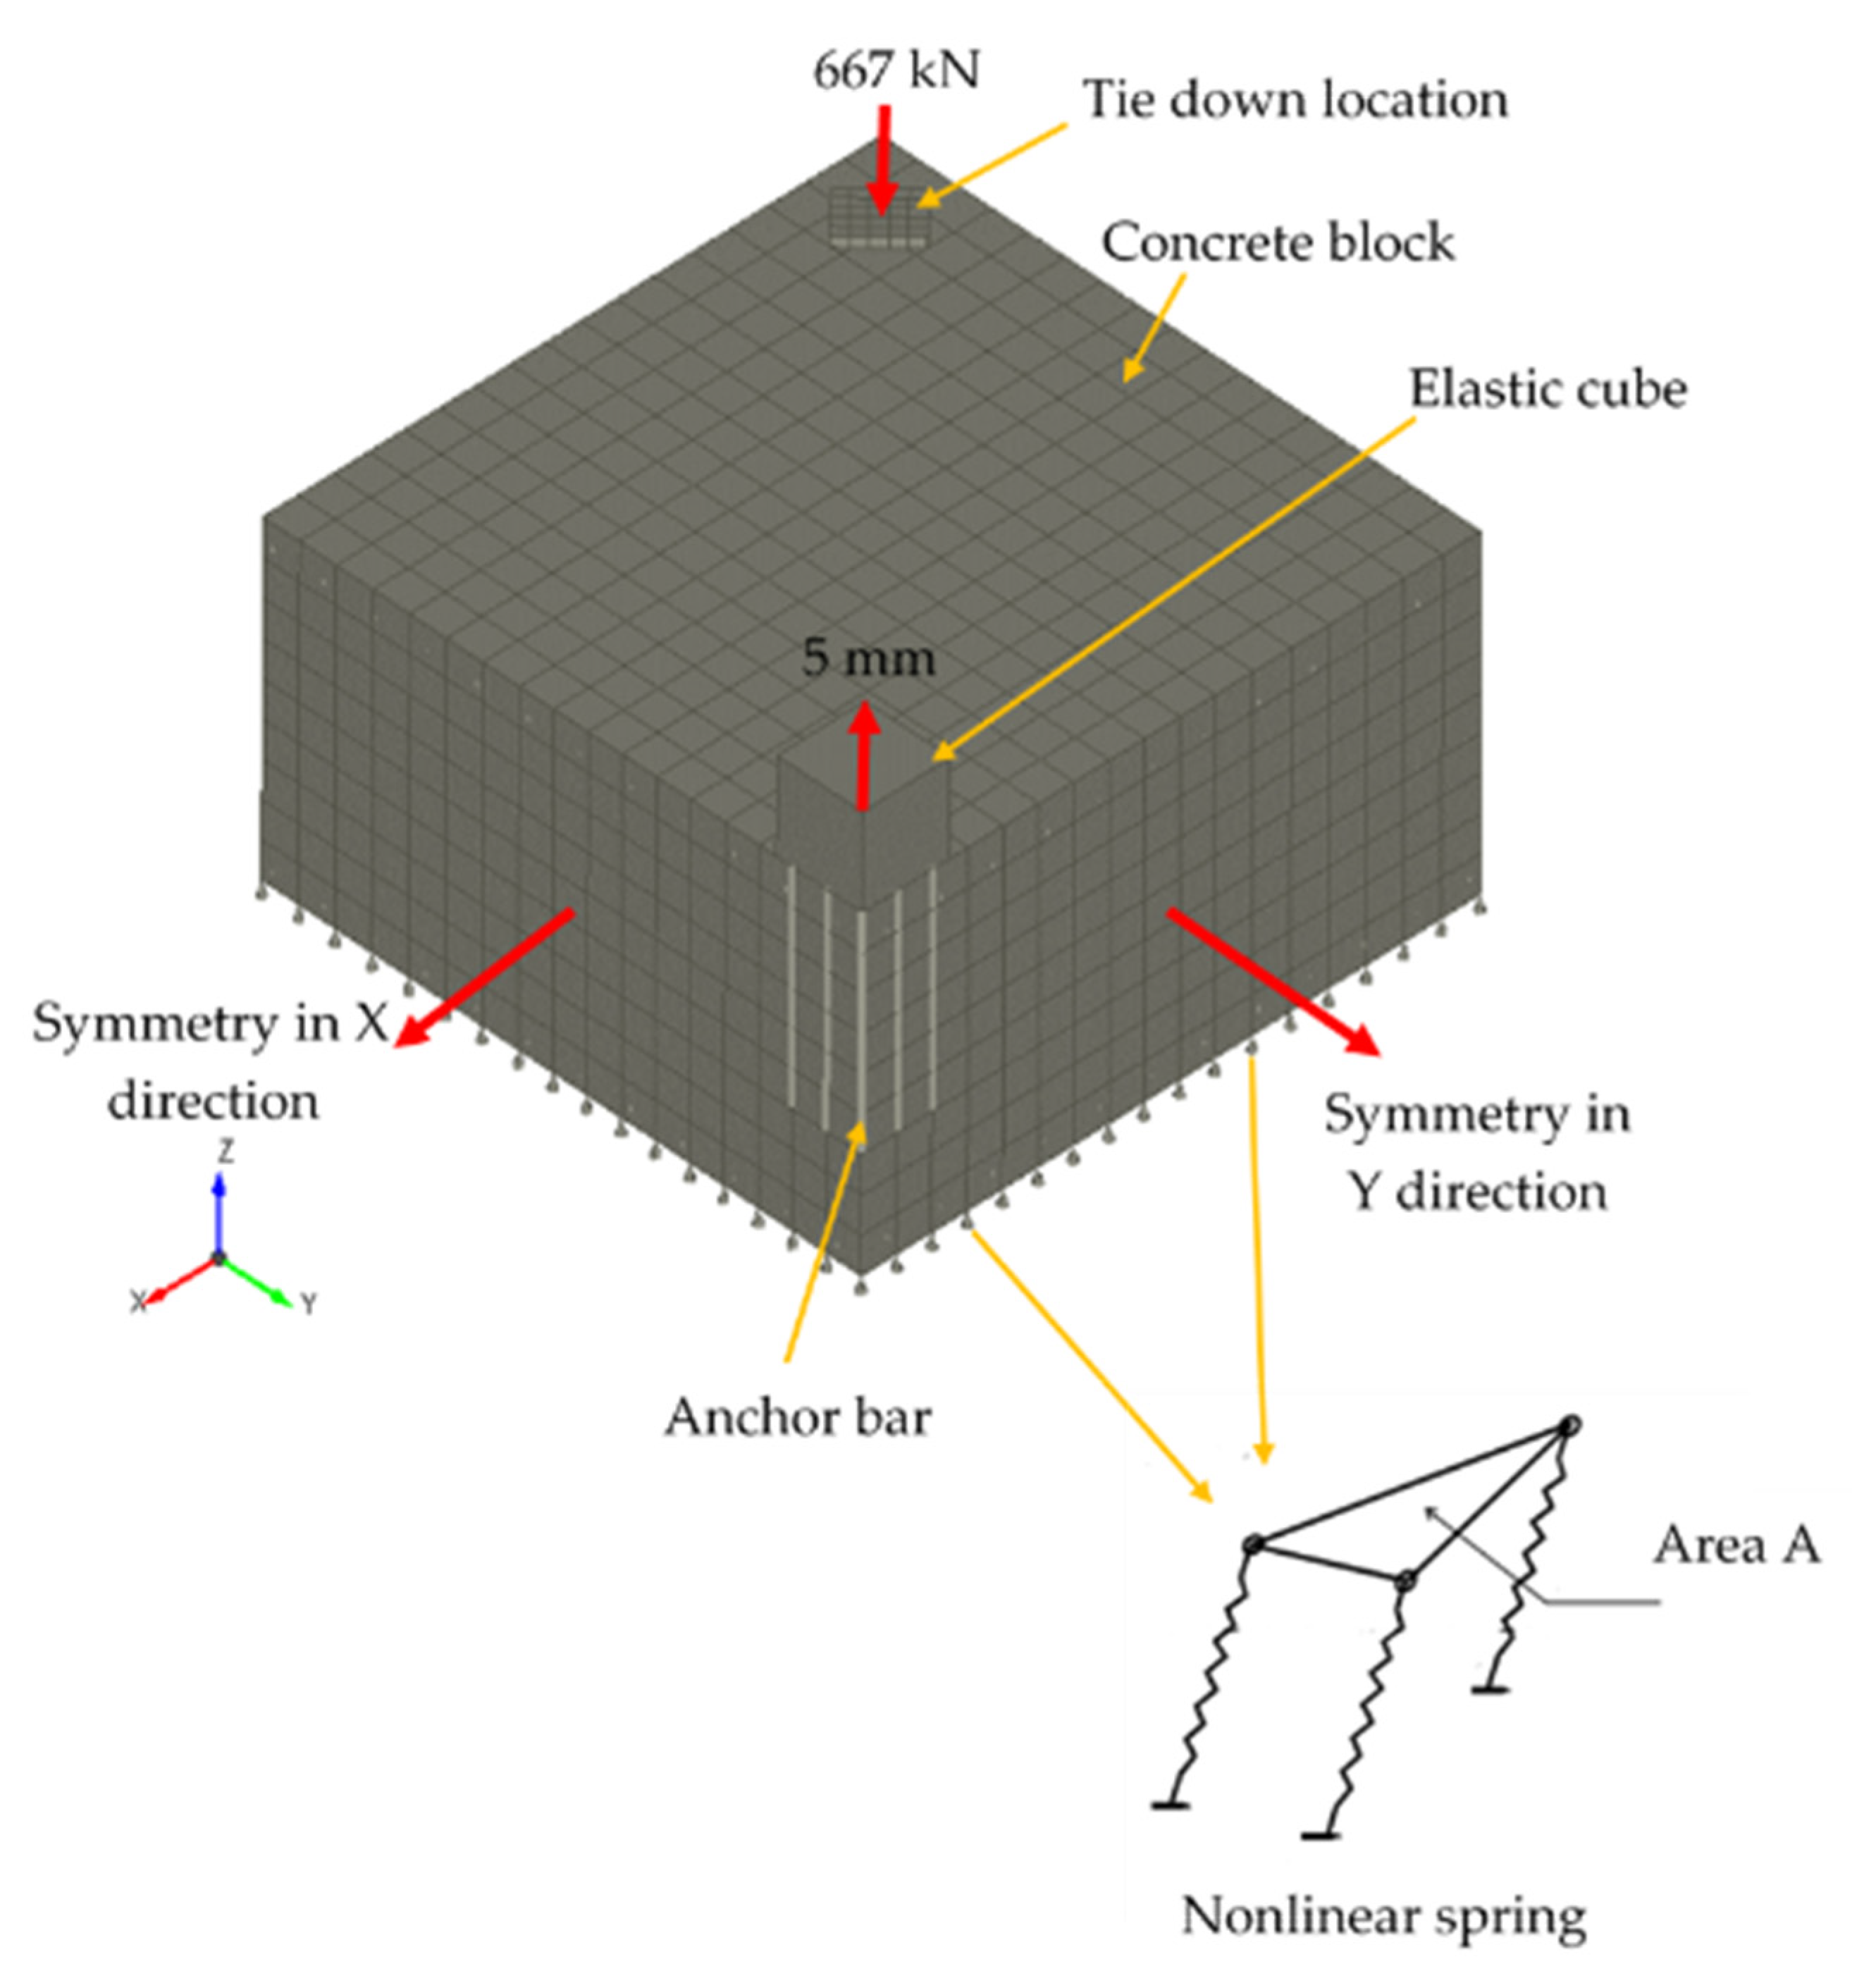
2.2. Finite Element Model

The test setup was modeled using the FE software, Atena [11]. The model (Figure 3) consisted of 1D anchor and rebar elements and 3D concrete elements. Only a quarter of the test setup was modeled and symmetry was applied to reduce analysis time and memory. The corners of the concrete macro-element consisted of 1D post-tensioned (PT) cable elements with downward PT forces of 667 kN to simulate the tie down locations of the experiment. The top elements of the anchors were fixed to the 3D elastic steel cube and pulled vertically to a displacement of 5 mm. The 3D elastic steel cube represented the 50 mm thick embed plate which did not deform or experience damage during the experiment. The bottom surface of the concrete block consisted of nonlinear spring elements active in compression only. The compressive stiffness of the spring was equal to 106 mN/m, which was large enough to prevent downward movement of the block. The tensile stiffness of the spring was sufficiently small to result in negligible tensile force. These springs were used to simulate the bearing of the test specimens against the strong floor of the experiment. Rebar elements (lengthwise and crosswise) were embedded in the concrete elements to form mat reinforcing at the top and bottom, which matched the physical experiment [2].

2.2.1. Concrete Material Model

The CEB-FIP Model Code (MC) 2010 [12] was used to characterize the compressive and tensile properties of concrete in analytical models, as outlined in Table 2. This approach provides formulas for determining the tensile strength (fctm), tangent modulus of elasticity (Ecm), fracture energy (GF), and maximum crack opening ( w c ) of concrete based on a cylinder compressive strength of concrete (fcm). fcm is equal to f c reported in the experiment [2]. For Test G_1, fctm, Ecm, GF, and w c were calculated based on fcm = 31.4 MPa and shown in Table 2. Fracture energy is the energy required to propagate a tensile crack of unit area [12]. GF by MC 2010 [12] was 135.76 N/m for Test G_1, but the value used in the analytical modeling was 58 N/m. The lower value was selected based on the close agreement of the analytical and experimental failure load of Test G_1, which is shown later. The GF value by MC 2010 [12] overestimated the failure load. According to Vos [13], GF in N/m is equal to 25 times fctm in MPa. For Test G_1, it is 61.25 N/m which is close to 58 N/m used in the analysis. This further justifies the use of lower fracture energy value in this study.

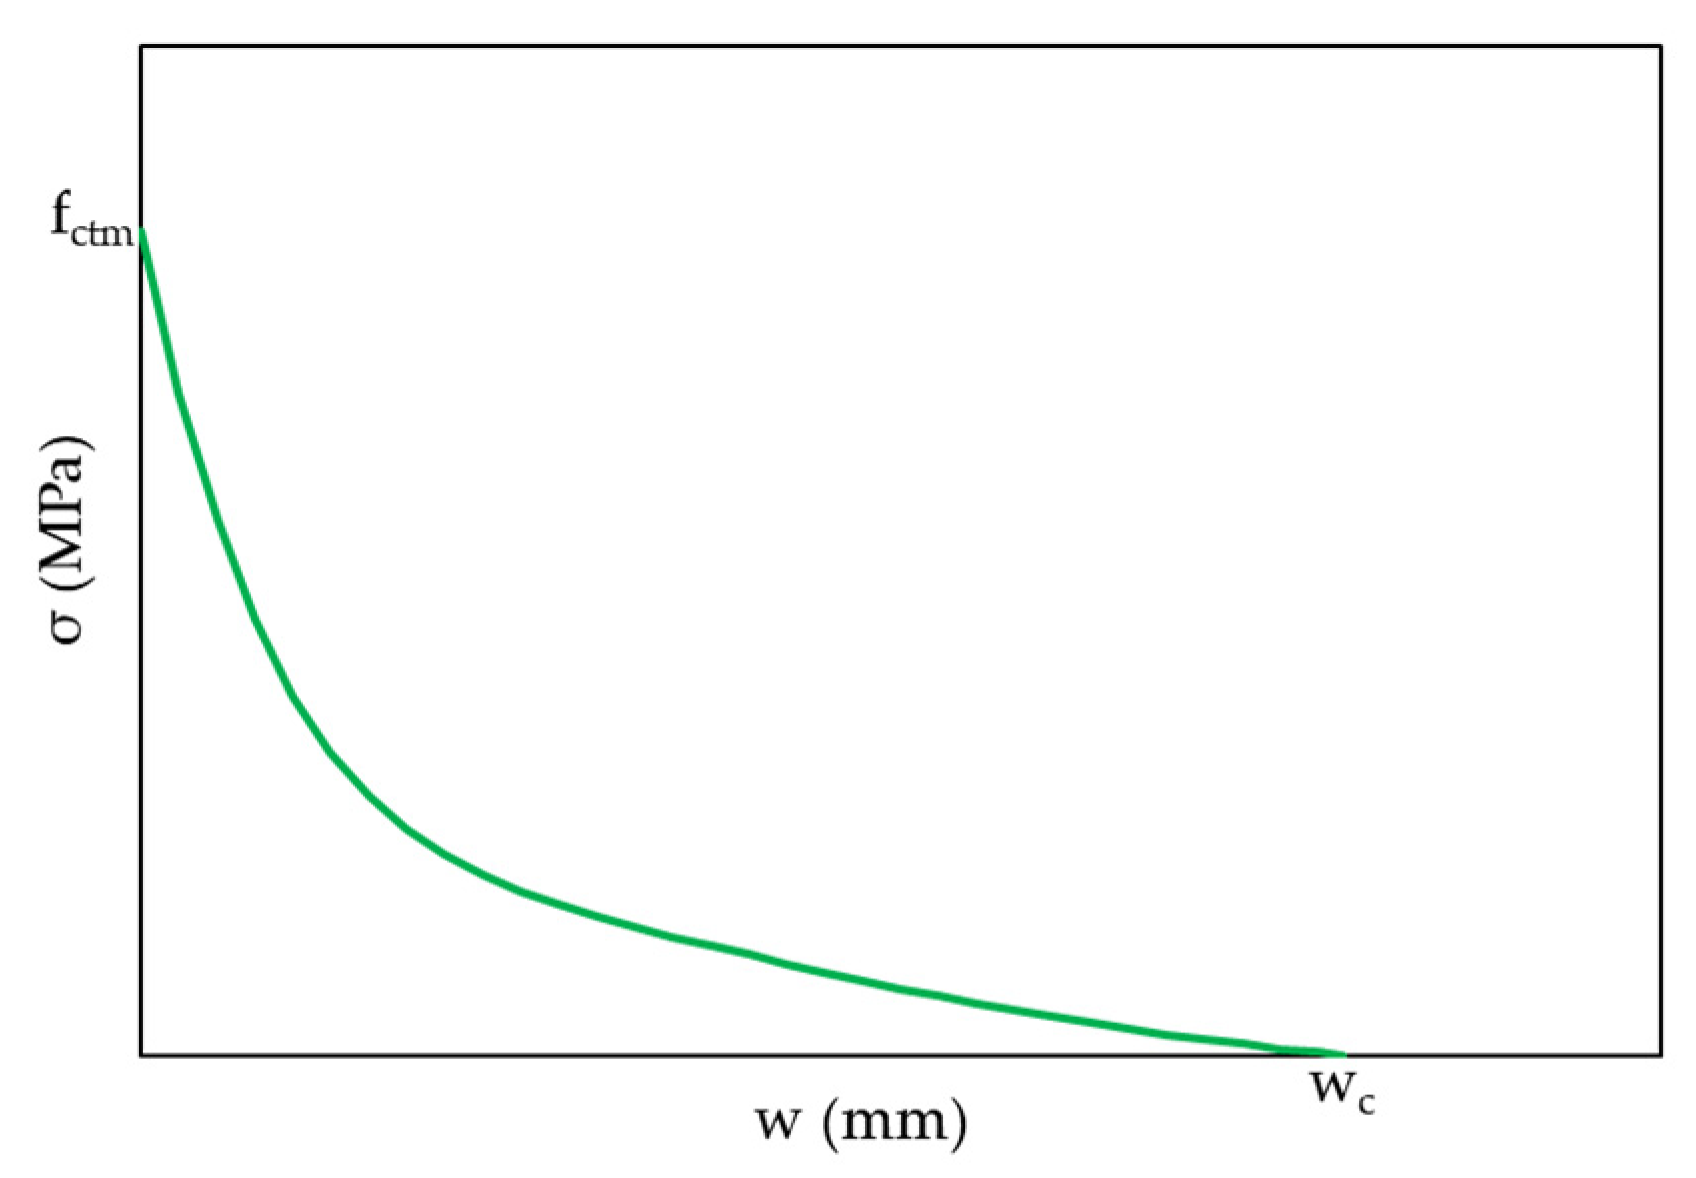
2.2.2. Tension Softening Curve for Concrete Material Model

The tension softening phenomenon represents the cracking and rapid loss of strength of the concrete once the peak tensile strength (fctm) is exceeded. The pre-peak tensile behavior of the concrete is assumed linear elastic until fctm. The exponential expression by Cornelissen et al. [14] was used to define the tension softening in the concrete model (Equation (3), Figure 4). The curve shows the decline in tensile stress (σ) as a function of crack opening ( w ) until w c is reached.
σ f c t m = { 1 + ( c 1 w w c ) 3 } e c 2 w w c w w c ( 1 + c 1 3 ) e c 2
where,
σ = tensile stress at a given value of crack opening (MPa);
w = crack opening displacement (mm);
c1 = material constant equal to 3.0;
c2 = material constant equal to 6.93.

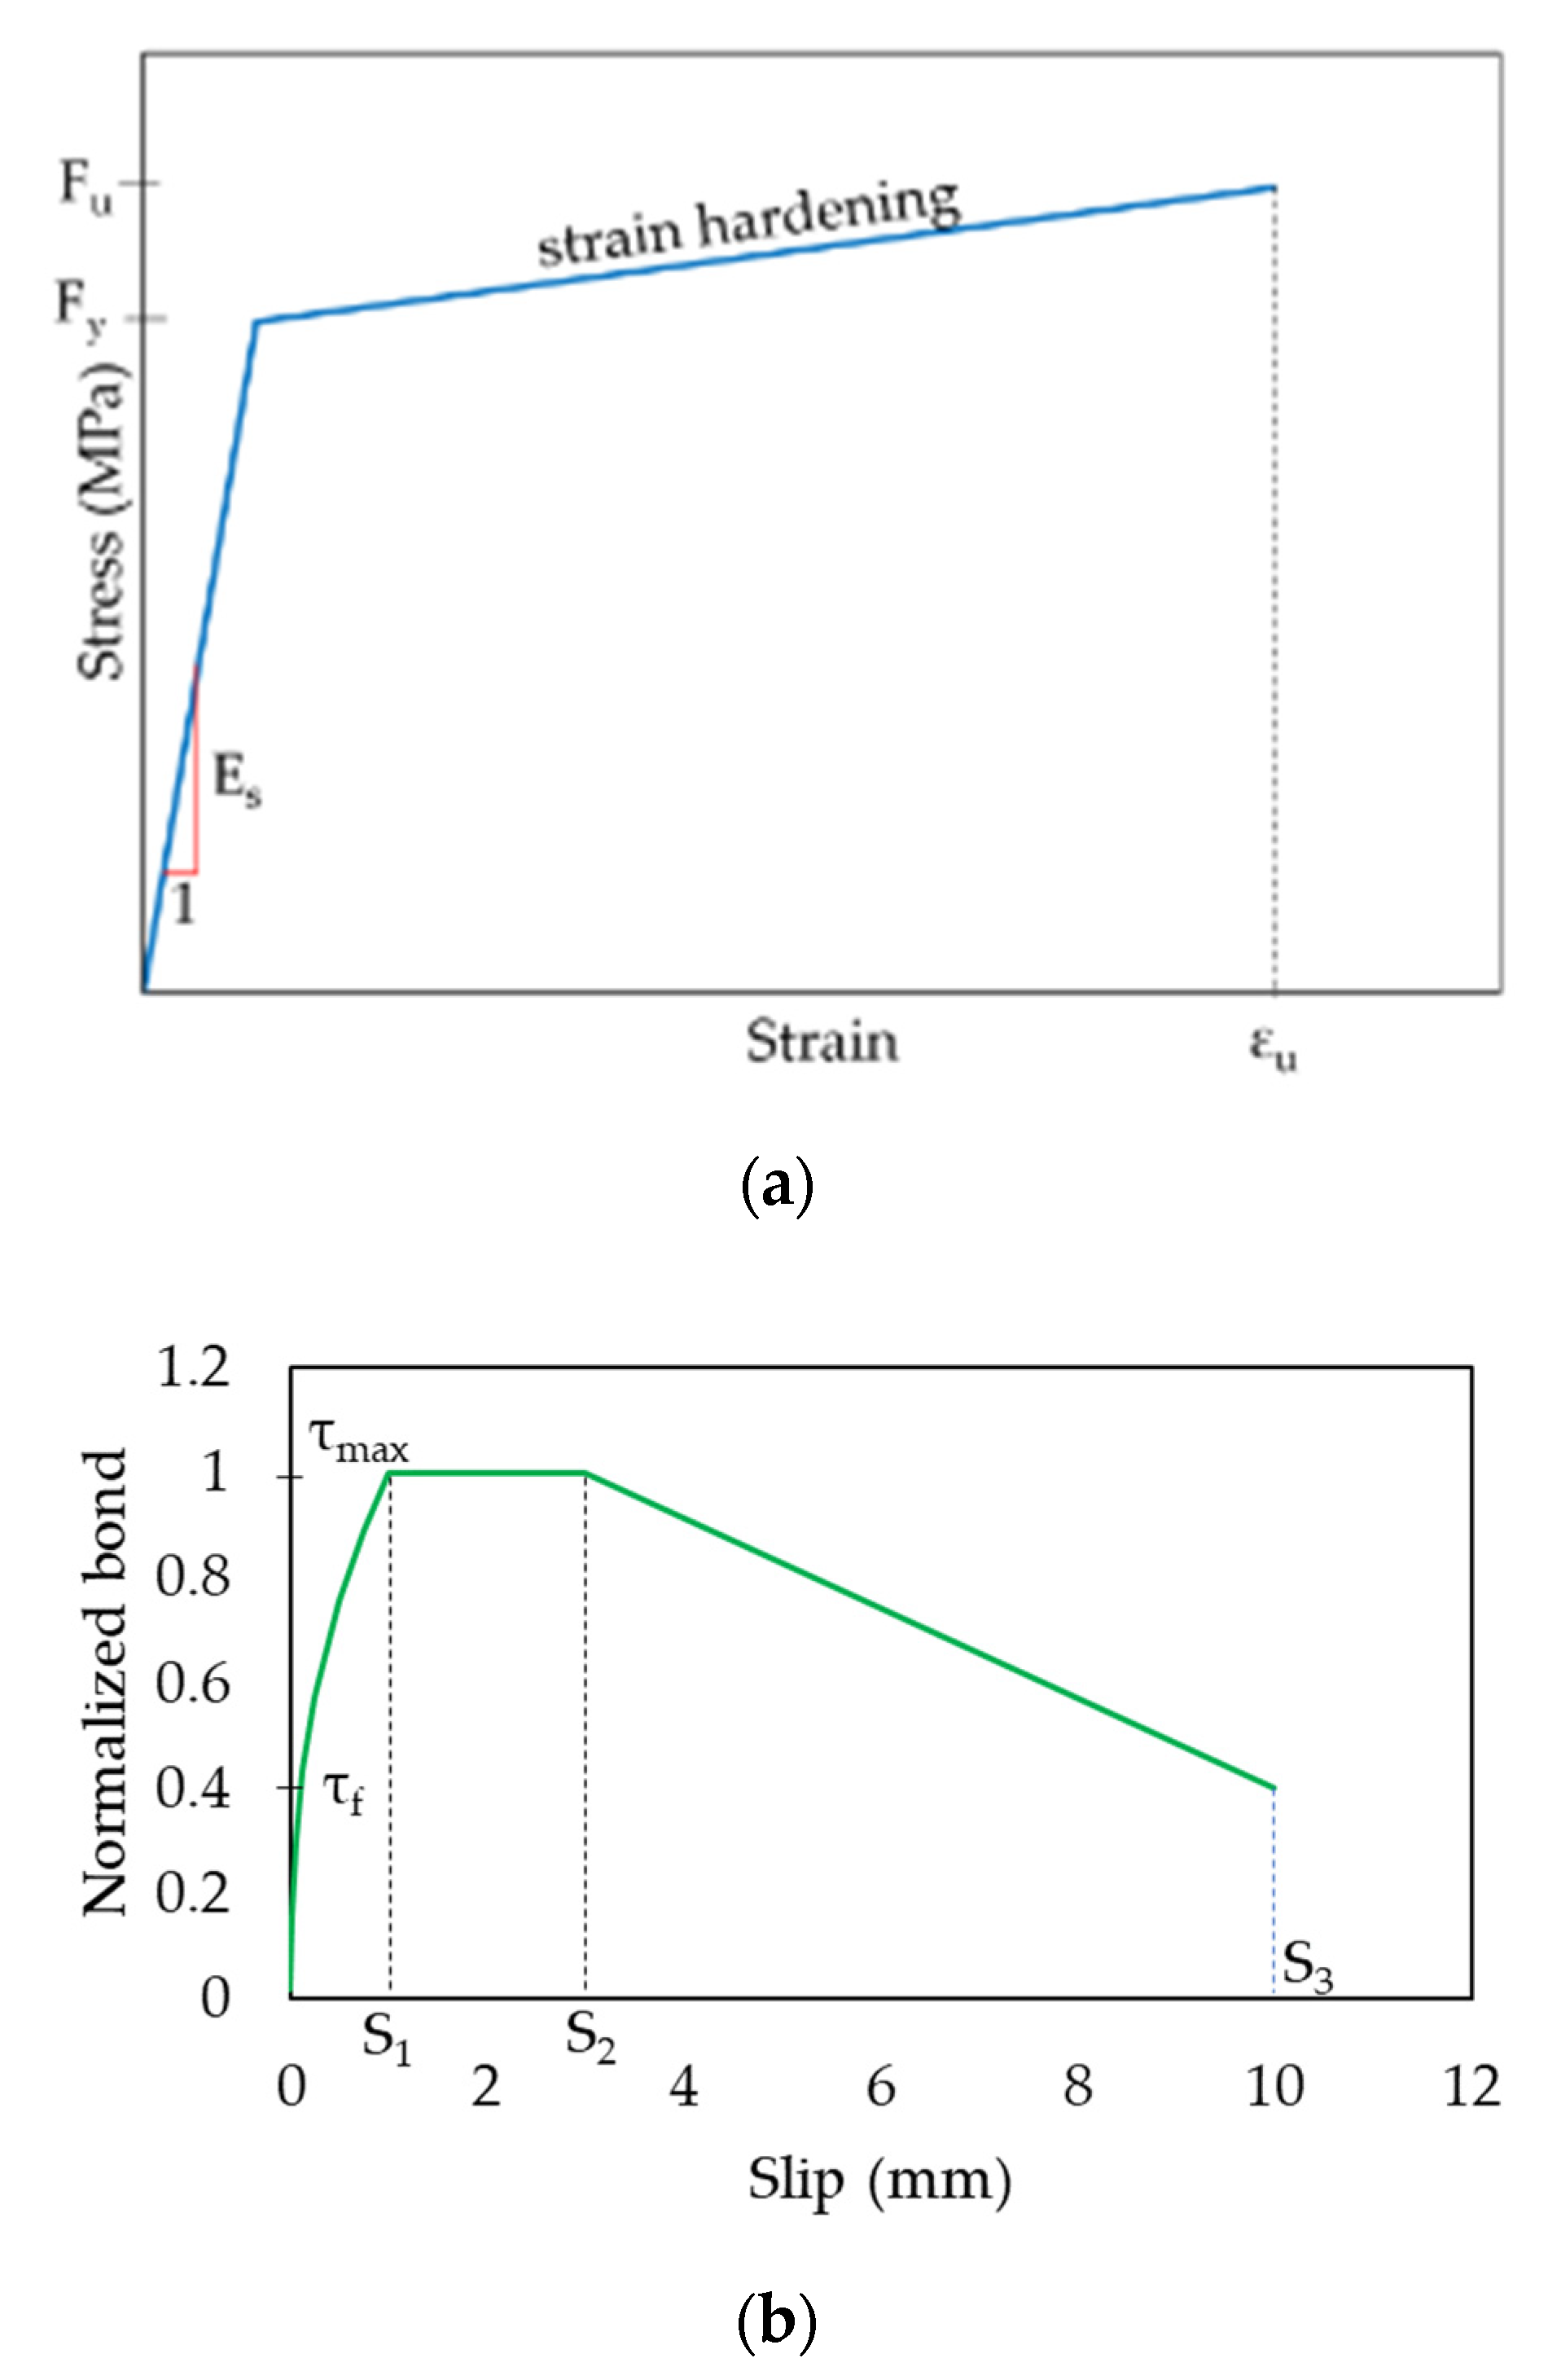
2.2.3. Steel Model and Interaction between Steel and Concrete

A bilinear stress–strain curve with strain hardening (Figure 5a) was used to define the steel material model representing the anchors and mat reinforcement bars. The modulus of elasticity of steel (Es) was equal to 2 × 10⁵ MPa. The yield stress (Fy), ultimate stress (Fu), and ultimate strain (εu) values (Table 3) were calibrated from analytical benchmarking of the single DRA test data in coordination with the reported material properties from the experimental study. The steel was assumed to rupture beyond the ultimate point in the stress–strain curve.
The normalized bond–slip curve (Figure 5b) from MC 1990 [15] was used to define the interaction between the anchors and the concrete. The curve starts with a non-zero bond strength value, plateaus at maximum bond stress (τmax), and drops linearly to failure stress (τf) equal to 40% of τmax. The slip values (S1 and S2) at plateau and S3 at failure are 1 mm, 3 mm, and 10 mm, respectively [15]. The appropriate bond–slip curve for analysis was obtained by multiplying the normalized bond values in Figure 5b by τmax. τmax was calibrated analytically (Table 3) by benchmarking the single DRA test results in coordination with the reported bond stress values from the experimental study.

2.2.4. Element Type and Mesh Size

The 3D elements in the FE model were CCIsoBrick elements. The 1D anchor and mat rebar elements were CCBarwithBond and CCIsoTruss elements. The PT cable and nonlinear spring elements were CCExternalCable and CCPlaneSpring elements. The mesh size of the model was 100 mm, which is consistent with mesh sizes used in other Atena modeling [16].
A mesh sensitivity analysis was performed using the group anchor test (G_1). The models with mesh size of 50 mm predicted higher peak load than the models with 100 mm mesh size (Figure 6). The cracks did not propagate to the top surface of the concrete and form a failure cone in the 50 mm mesh model. In the 100 mm mesh model, there was a distinctive breakout cone at failure. This could be explained by the crack band theory, where the tensile crack band (Lt) is increased to trigger the localization of diagonal cracks and allow their propagation [17]. Lt is the spacing between two cracks and is approximately equal to the element size [17]. By increasing the mesh size from 50 mm to 100 mm in this study, Lt was increased, and the diagonal cracks were able to propagate to the concrete top and form a concrete breakout cone. Crack band method assumes a single crack inside each finite element [17]. However, for larger element size, more than one crack can localize inside the element making it more brittle [17]. Stiffness loss occurred in the 100 mm mesh model before failure due to the formation of larger cracks compared to the 50 mm mesh model (Figure 6).
The post-peak region of the experimental curve had a gradual decline because the tests were force-controlled. The specimens did not take additional pullout forces after reaching failure while the pullout displacement increased rapidly (Figure 6). The force-controlled nature of the testing may also be why stiffness loss was not observed in the physical testing. Ultimately, the study was continued with the mesh size of 100 mm to reduce analysis time and better match the peak pullout capacity of the test and produce more conservative pullout values.
Figure 6 also shows the crack patterns for each mesh size. The crack legend provided in the figure provides crack opening displacement (COD). Per Atena [11], there are three COD levels: COD1, COD2, and COD3. COD1 filters maximum crack size. COD3 shows all the cracks in the concrete. In Figure 6, legend COD1 is used to color-code the wider cracks. In all other figures, COD3 is used to show all cracks, and the color-coded legend is not provided in order to better display the crack patterns.
The FE analysis was performed using Atena’s static solver and the Full Newton-Raphson method. This method uses the concept of incremental step-by-step analysis with multiple iterations in each step to reach convergence for out-of-balance forces. The pullout loading of the anchor elements in the FE model was displacement controlled. The reaction force and the displacement of the model were monitored at the pullout point. The Atena theory manual [11] provides detailed information about the element types, mesh size, and loading method.

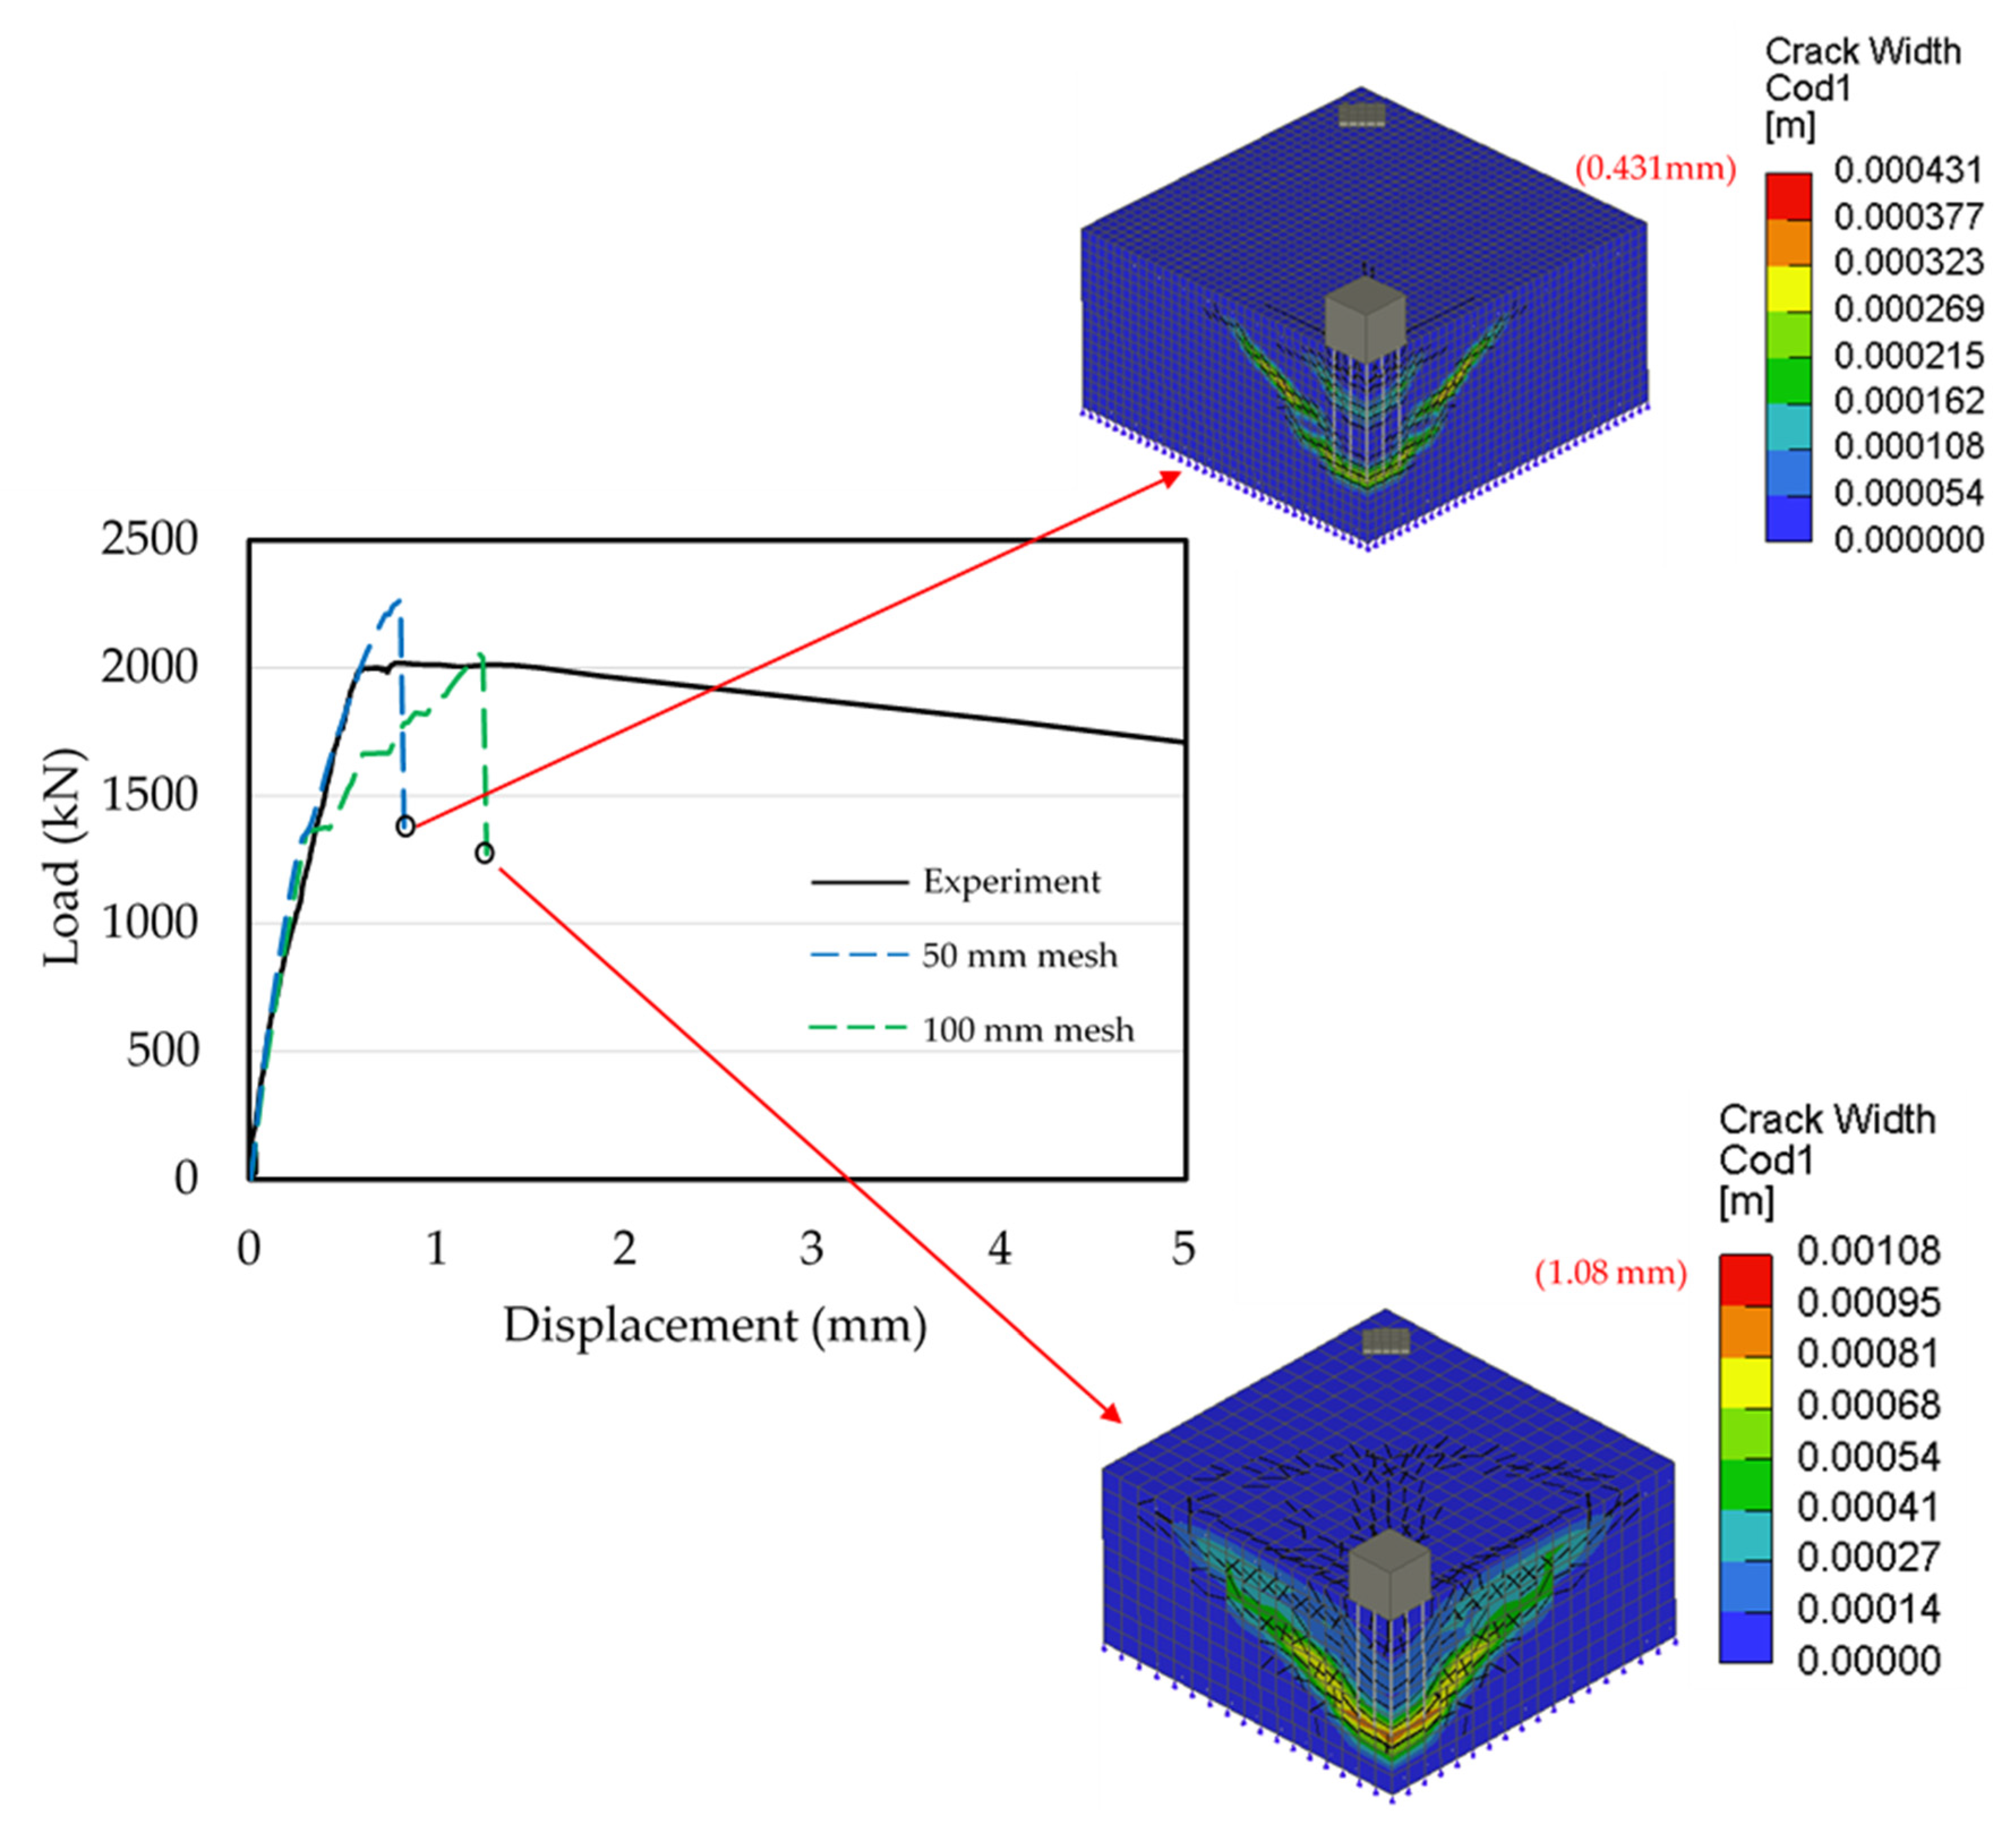
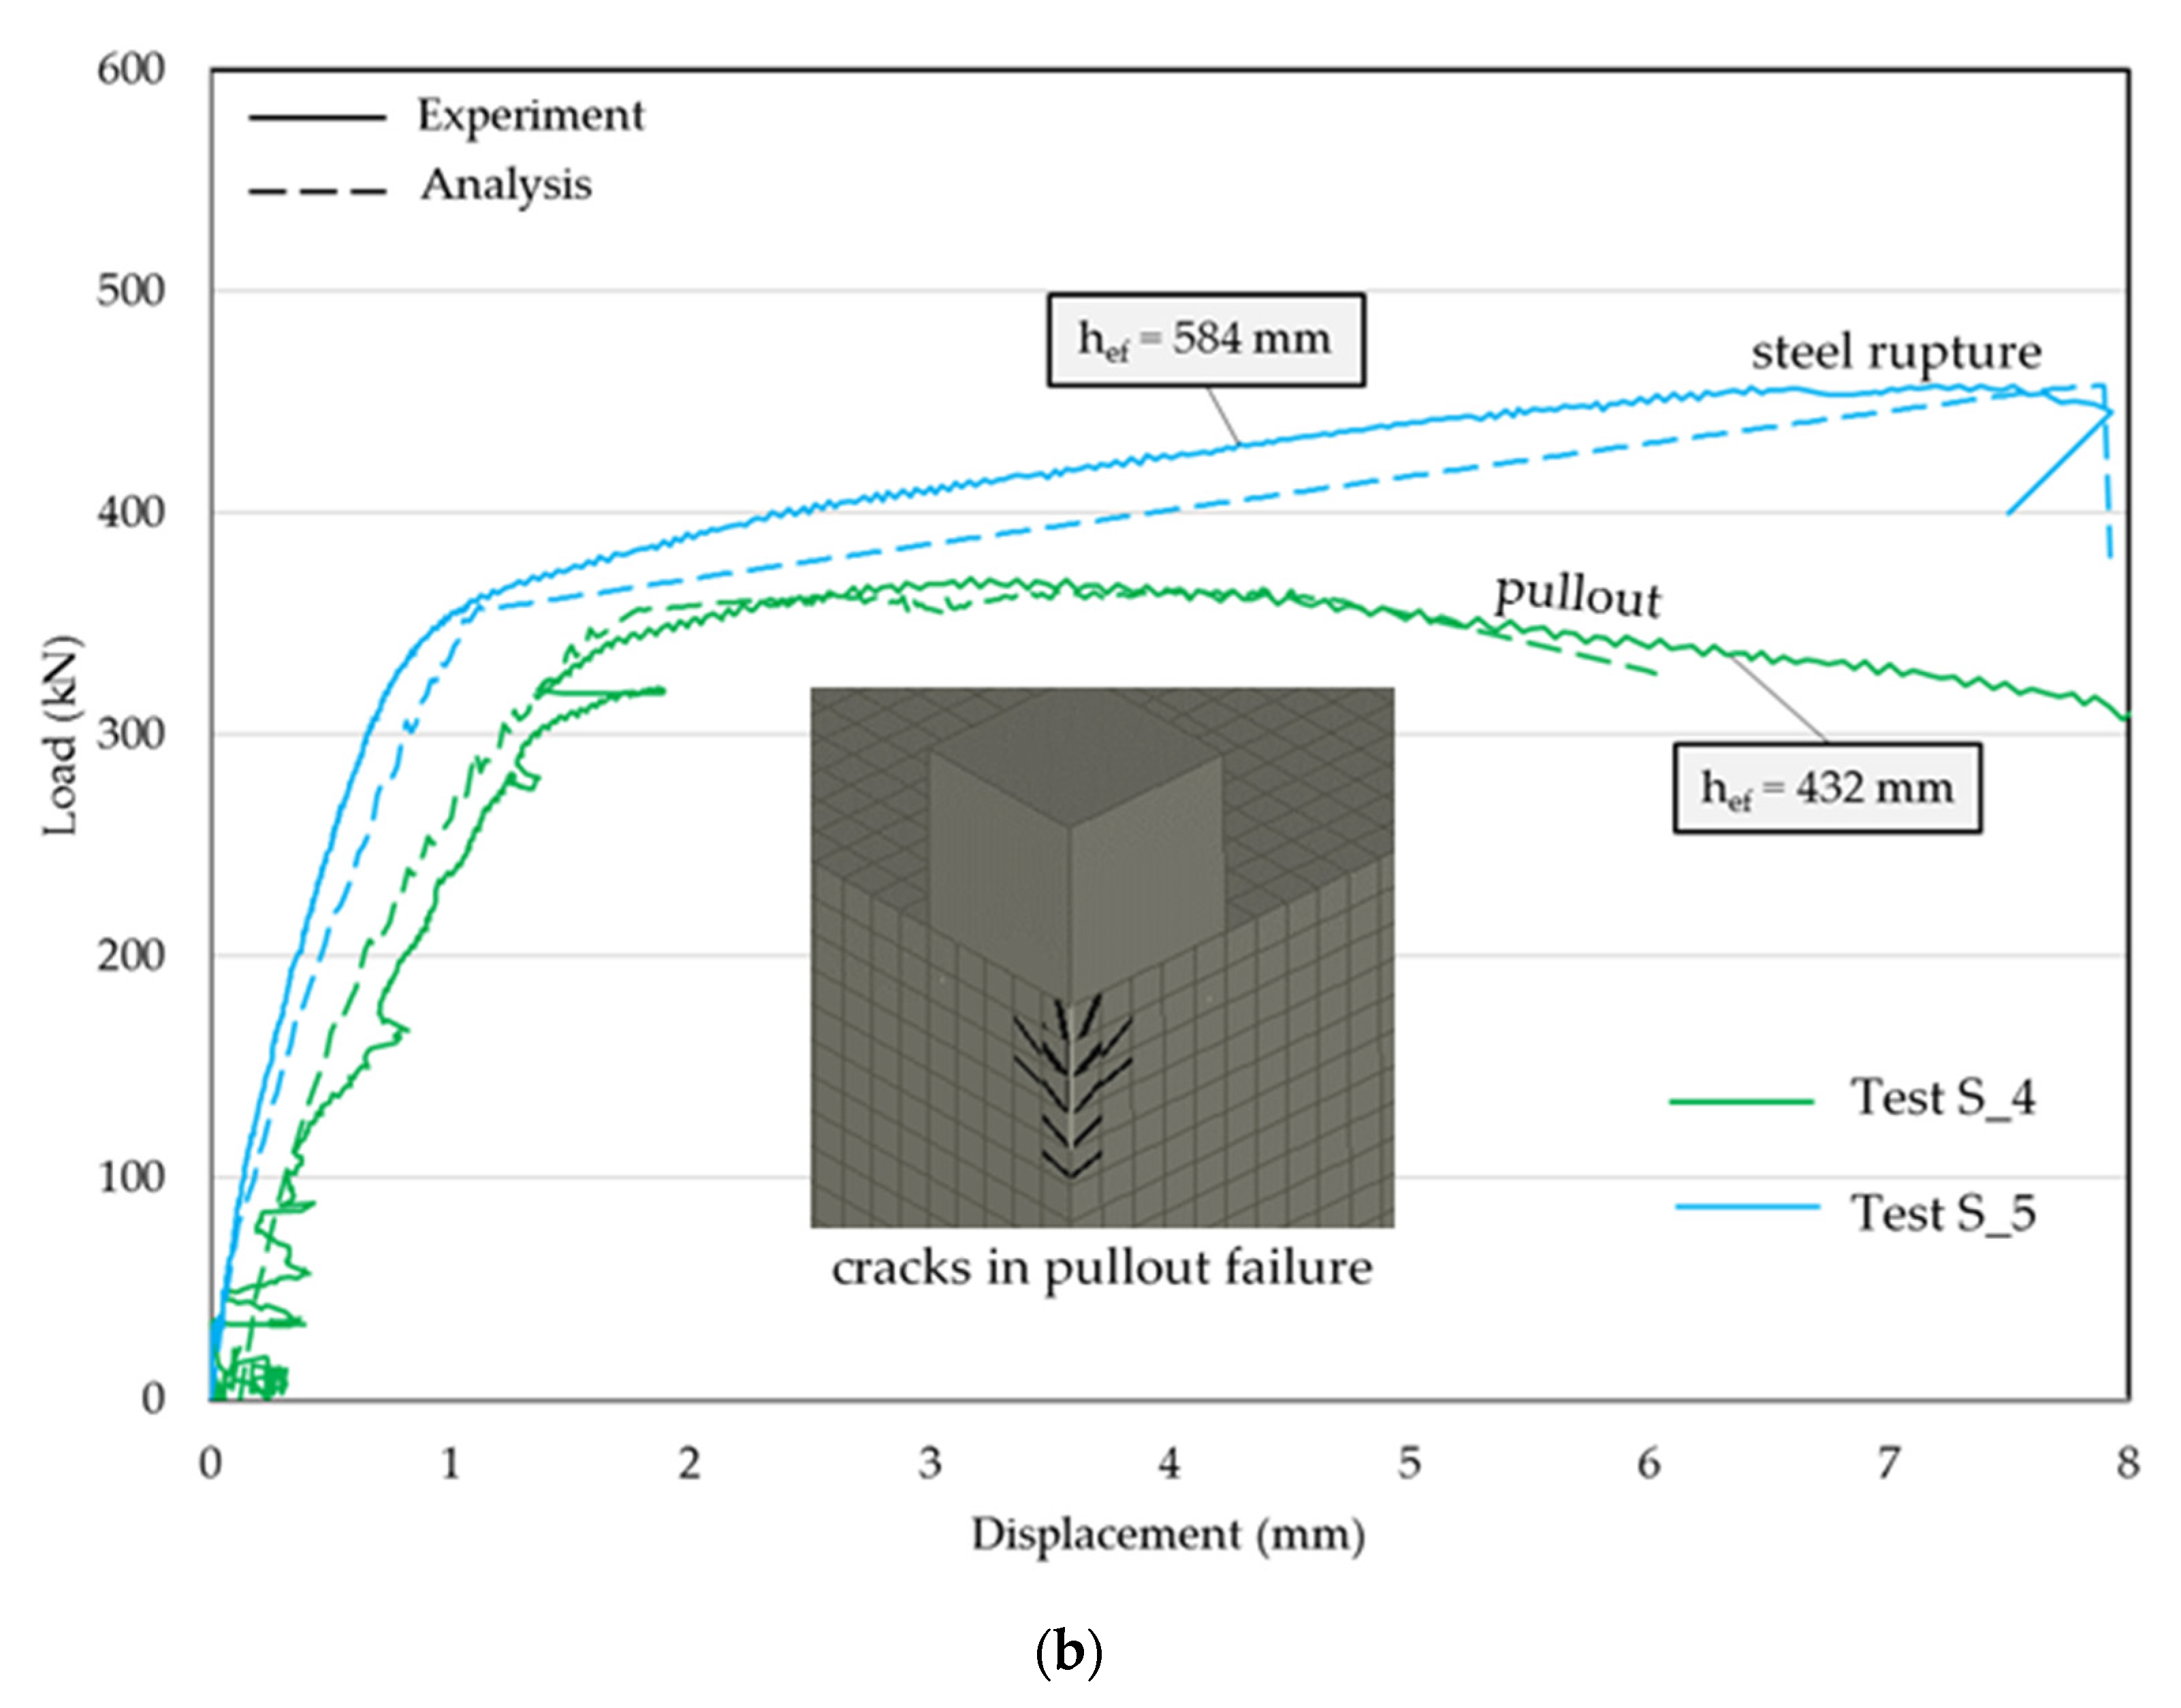
2.2.5. Benchmarked Single Anchor Model

The single anchor tests from Table 1 were benchmarked using the Atena modeling approach previously described. Single anchor tests S_1, S_2, and S_4 failed by pullout/bond failure whereas the models (S_3 and S_5) failed by steel rupture at the end of the analysis (Figure 7). The anchors with pullout failure had hef values less than their development lengths (Ld) calculated by the equation 25.4.2.4a of ACI 318-19 [5], reproduced below.
L d = [ 3 40 F y f c ψ t ψ e ψ s ψ g ( c b + K t r d b ) ] d b
The factors ψt, ψe, ψs, and ψg represent reinforcement location factor, coating factor, size factor, and grade factor, respectively. These factors were equal to 1.0 for this study except ψs, which was equal to 0.8 for #6 (19 mm) and smaller bar diameters. The confinement term ( c b + K t r d b ) was equal to 2.5. Anchors that failed by steel rupture had hef greater than Ld.
Figure 7a shows that the experimental and analytical force-displacement results for tests S_1 to S_3 with #6 (19 mm) bars were very similar. The post-yield response of the analytical curve varied from the experiment for test S_3 due to the simplified bilinear assumption of steel model. Good agreement was also found in Figure 7b, which provides a comparison of experimental and analytical force–displacement results for tests S_4 and S_5, using #9 (28.7 mm) bars. Concrete cracks typically observed around the surface of the anchor during bond failure are also shown in the figure. These cracks were localized around the anchor and along its length.

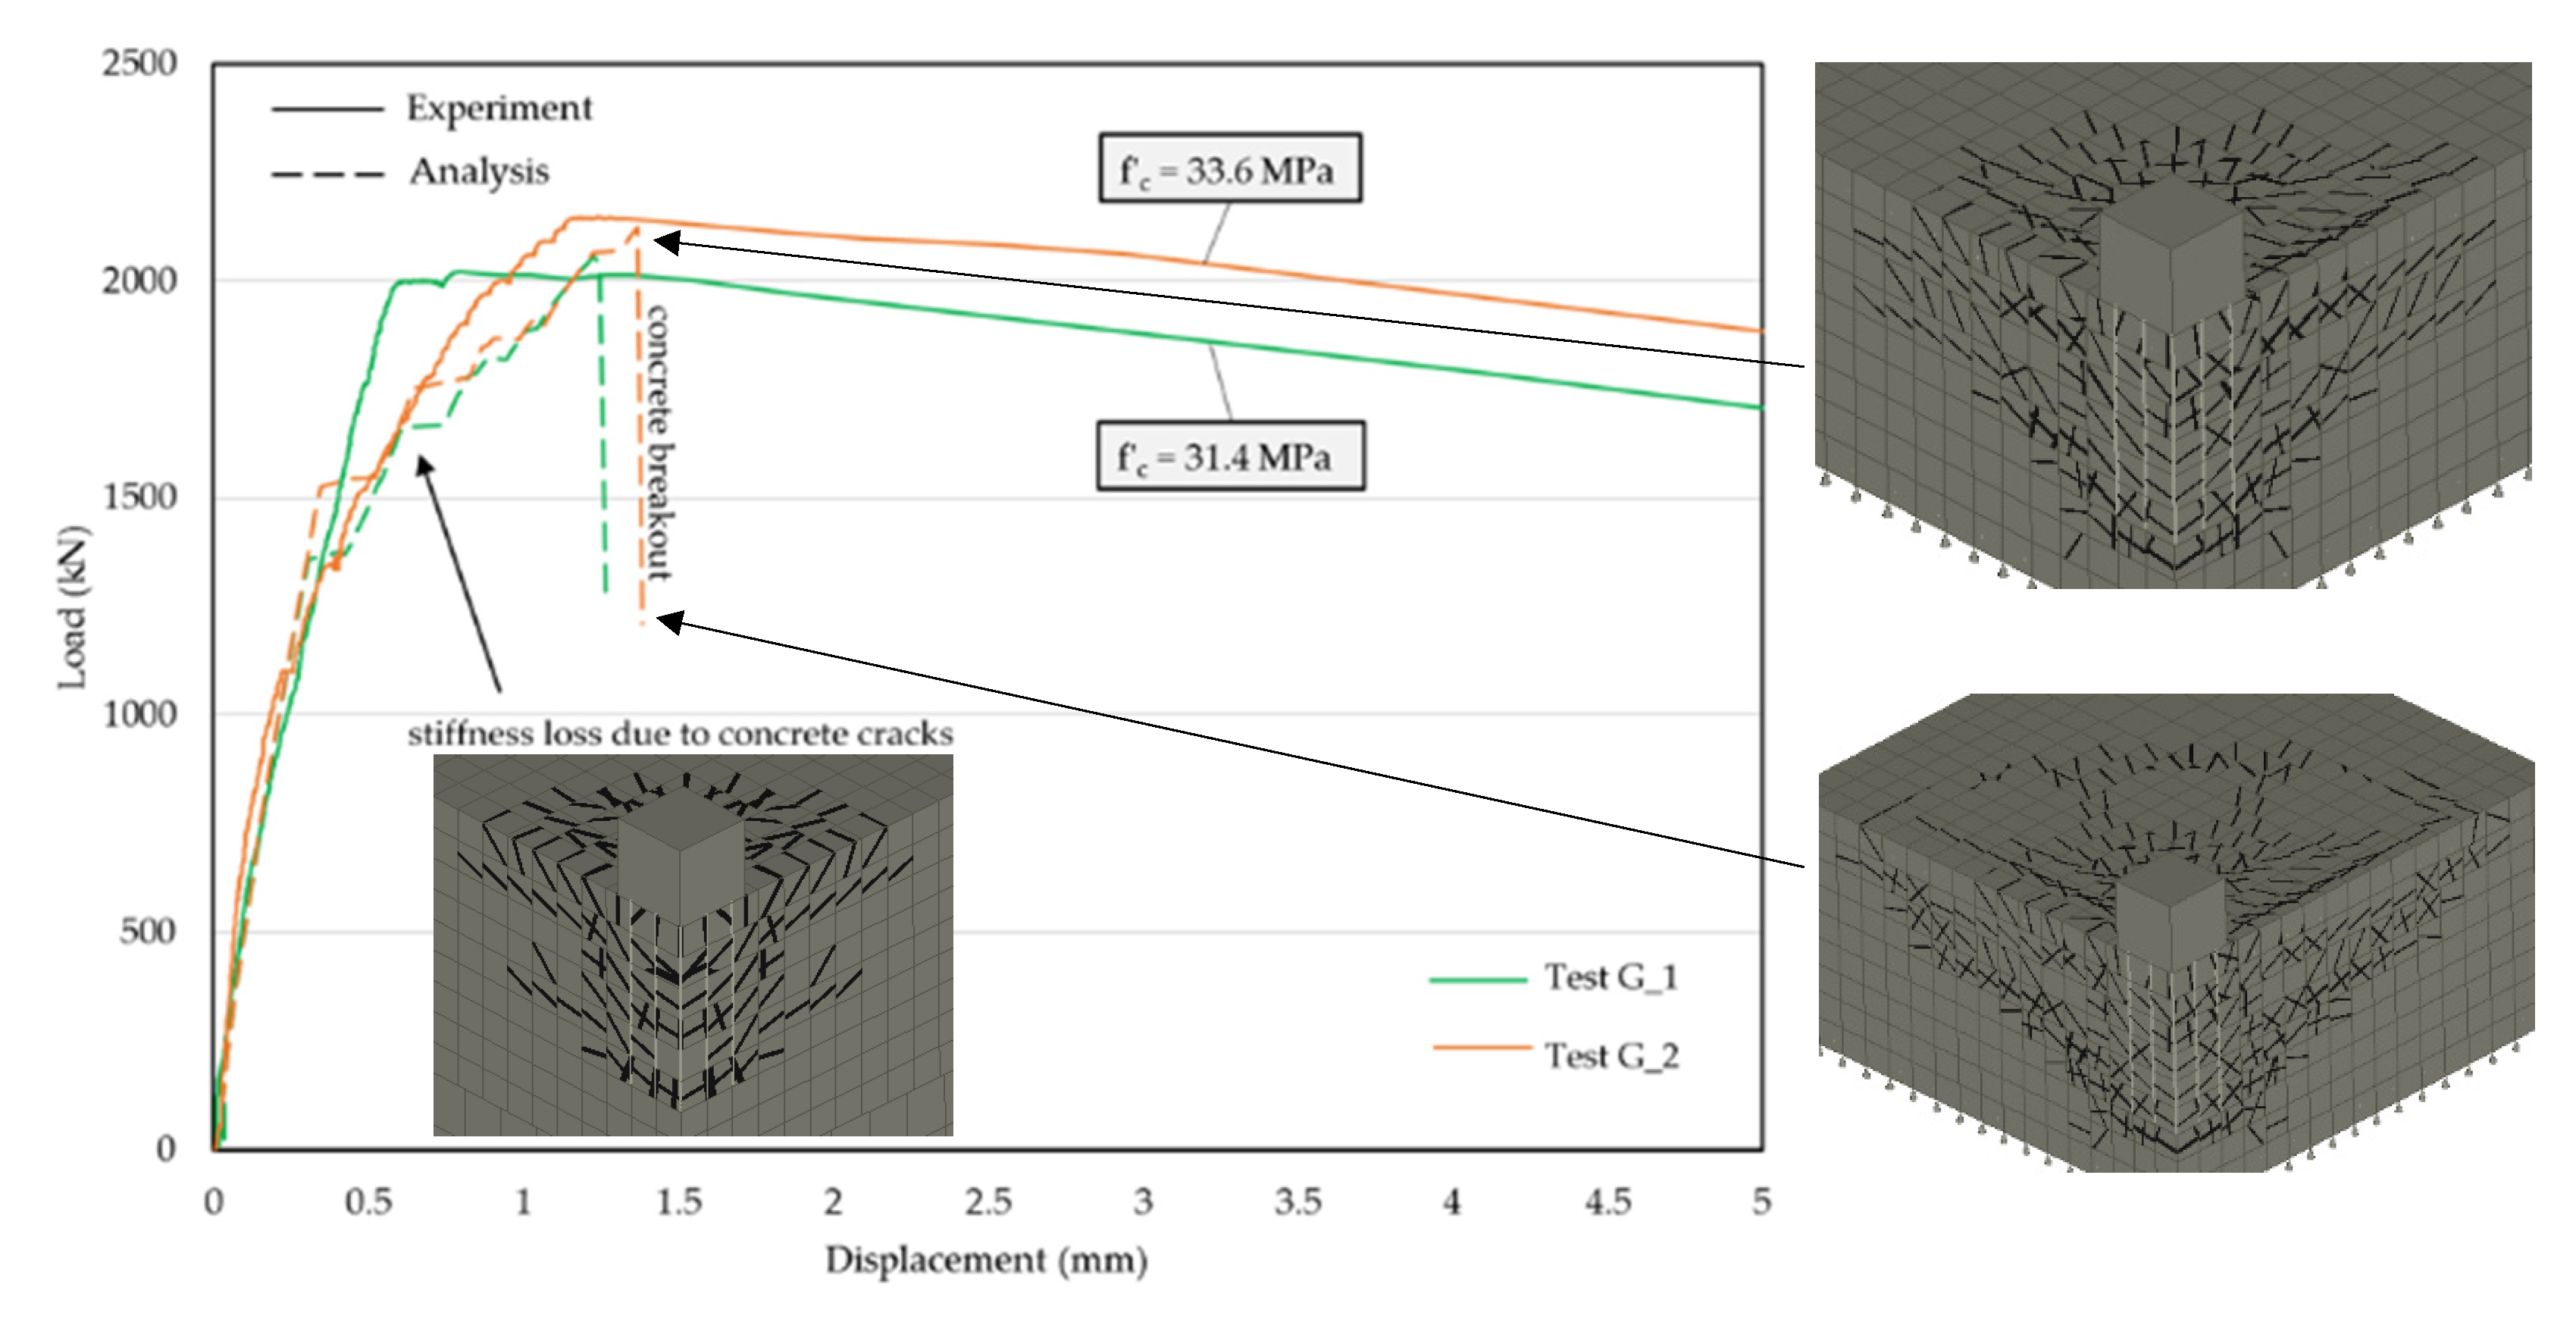
2.3. Benchmarked Group Anchor Model

The group anchor system models (G_1 and G_2) failed by concrete breakout (Figure 8). The same failure modes were observed for these tests in the experiment [2]. The two tests only varied in compressive strength of the concrete. The load–displacement responses (Figure 8) of the group anchor system models were obtained by using GF = 58 N/m for G_1 and GF = 62 N/m for G_2. These fracture energy values were calibrated by comparing the analytical and experimental breakout capacities. The models displayed concrete cracks and loss in stiffness after reaching 75% of their ultimate load carrying capacities. This stiffness loss was not apparent in the G_1 experimental response. The closer view of crack pattern at different stages of loading is also shown in Figure 8. At initial/pre-peak load, the cracks formed around the mid and the end of anchors and propagated towards the concrete top surface. At peak load, the cracks started to take the shape of a cone. Finally, at failure, the cracks reached the concrete top surface and formed a breakout cone. It should be noted that these crack diagrams were formed in a quarter symmetry model.

3. Parametric Study

The modeling assumptions for benchmarking the test data of DRAs were replicated using different values of anchor parameters and material properties to develop a more robust parametric study (Table 4). The selected anchor diameters (db) for the parametric study were common US rebar sizes (#3, #6, #9, which correspond to 9.5 mm, 19 mm, and 28.7 mm diameter bars, respectively). The selected orientations (a × b) of the anchors were 4 × 4, 5 × 5, and 6 × 6, which have been commonly used in nuclear facilities. These orientations represent the layout of the number of anchors in each direction. Three standard anchor spacing (s) values were selected at approximately 50 mm increments. Three embedment depth (hef) values (in 72 mm increments) were also considered for the parametric study. The minimum embedment depth of the DRA was equal to the development length of the bar (Ld). Embedment depths lower than Ld was avoided to target concrete breakout failure. The spacing and embedment depths were varied in order to understand the anchor behavior and controlling failure mode, as a function of anchor spacing and depth. Two different compressive strengths were also considered. Anchor diameter, configuration, embedment, and spacing were all varied for concrete with a compressive strength of 27.6 MPa and 41.4 MPa. The fracture energy value of 58 N/m from the benchmarked group anchor model (previous section) was used for the parametric analyses. The lower value was selected to be conservative. A total of 83 parametric analyses were performed.

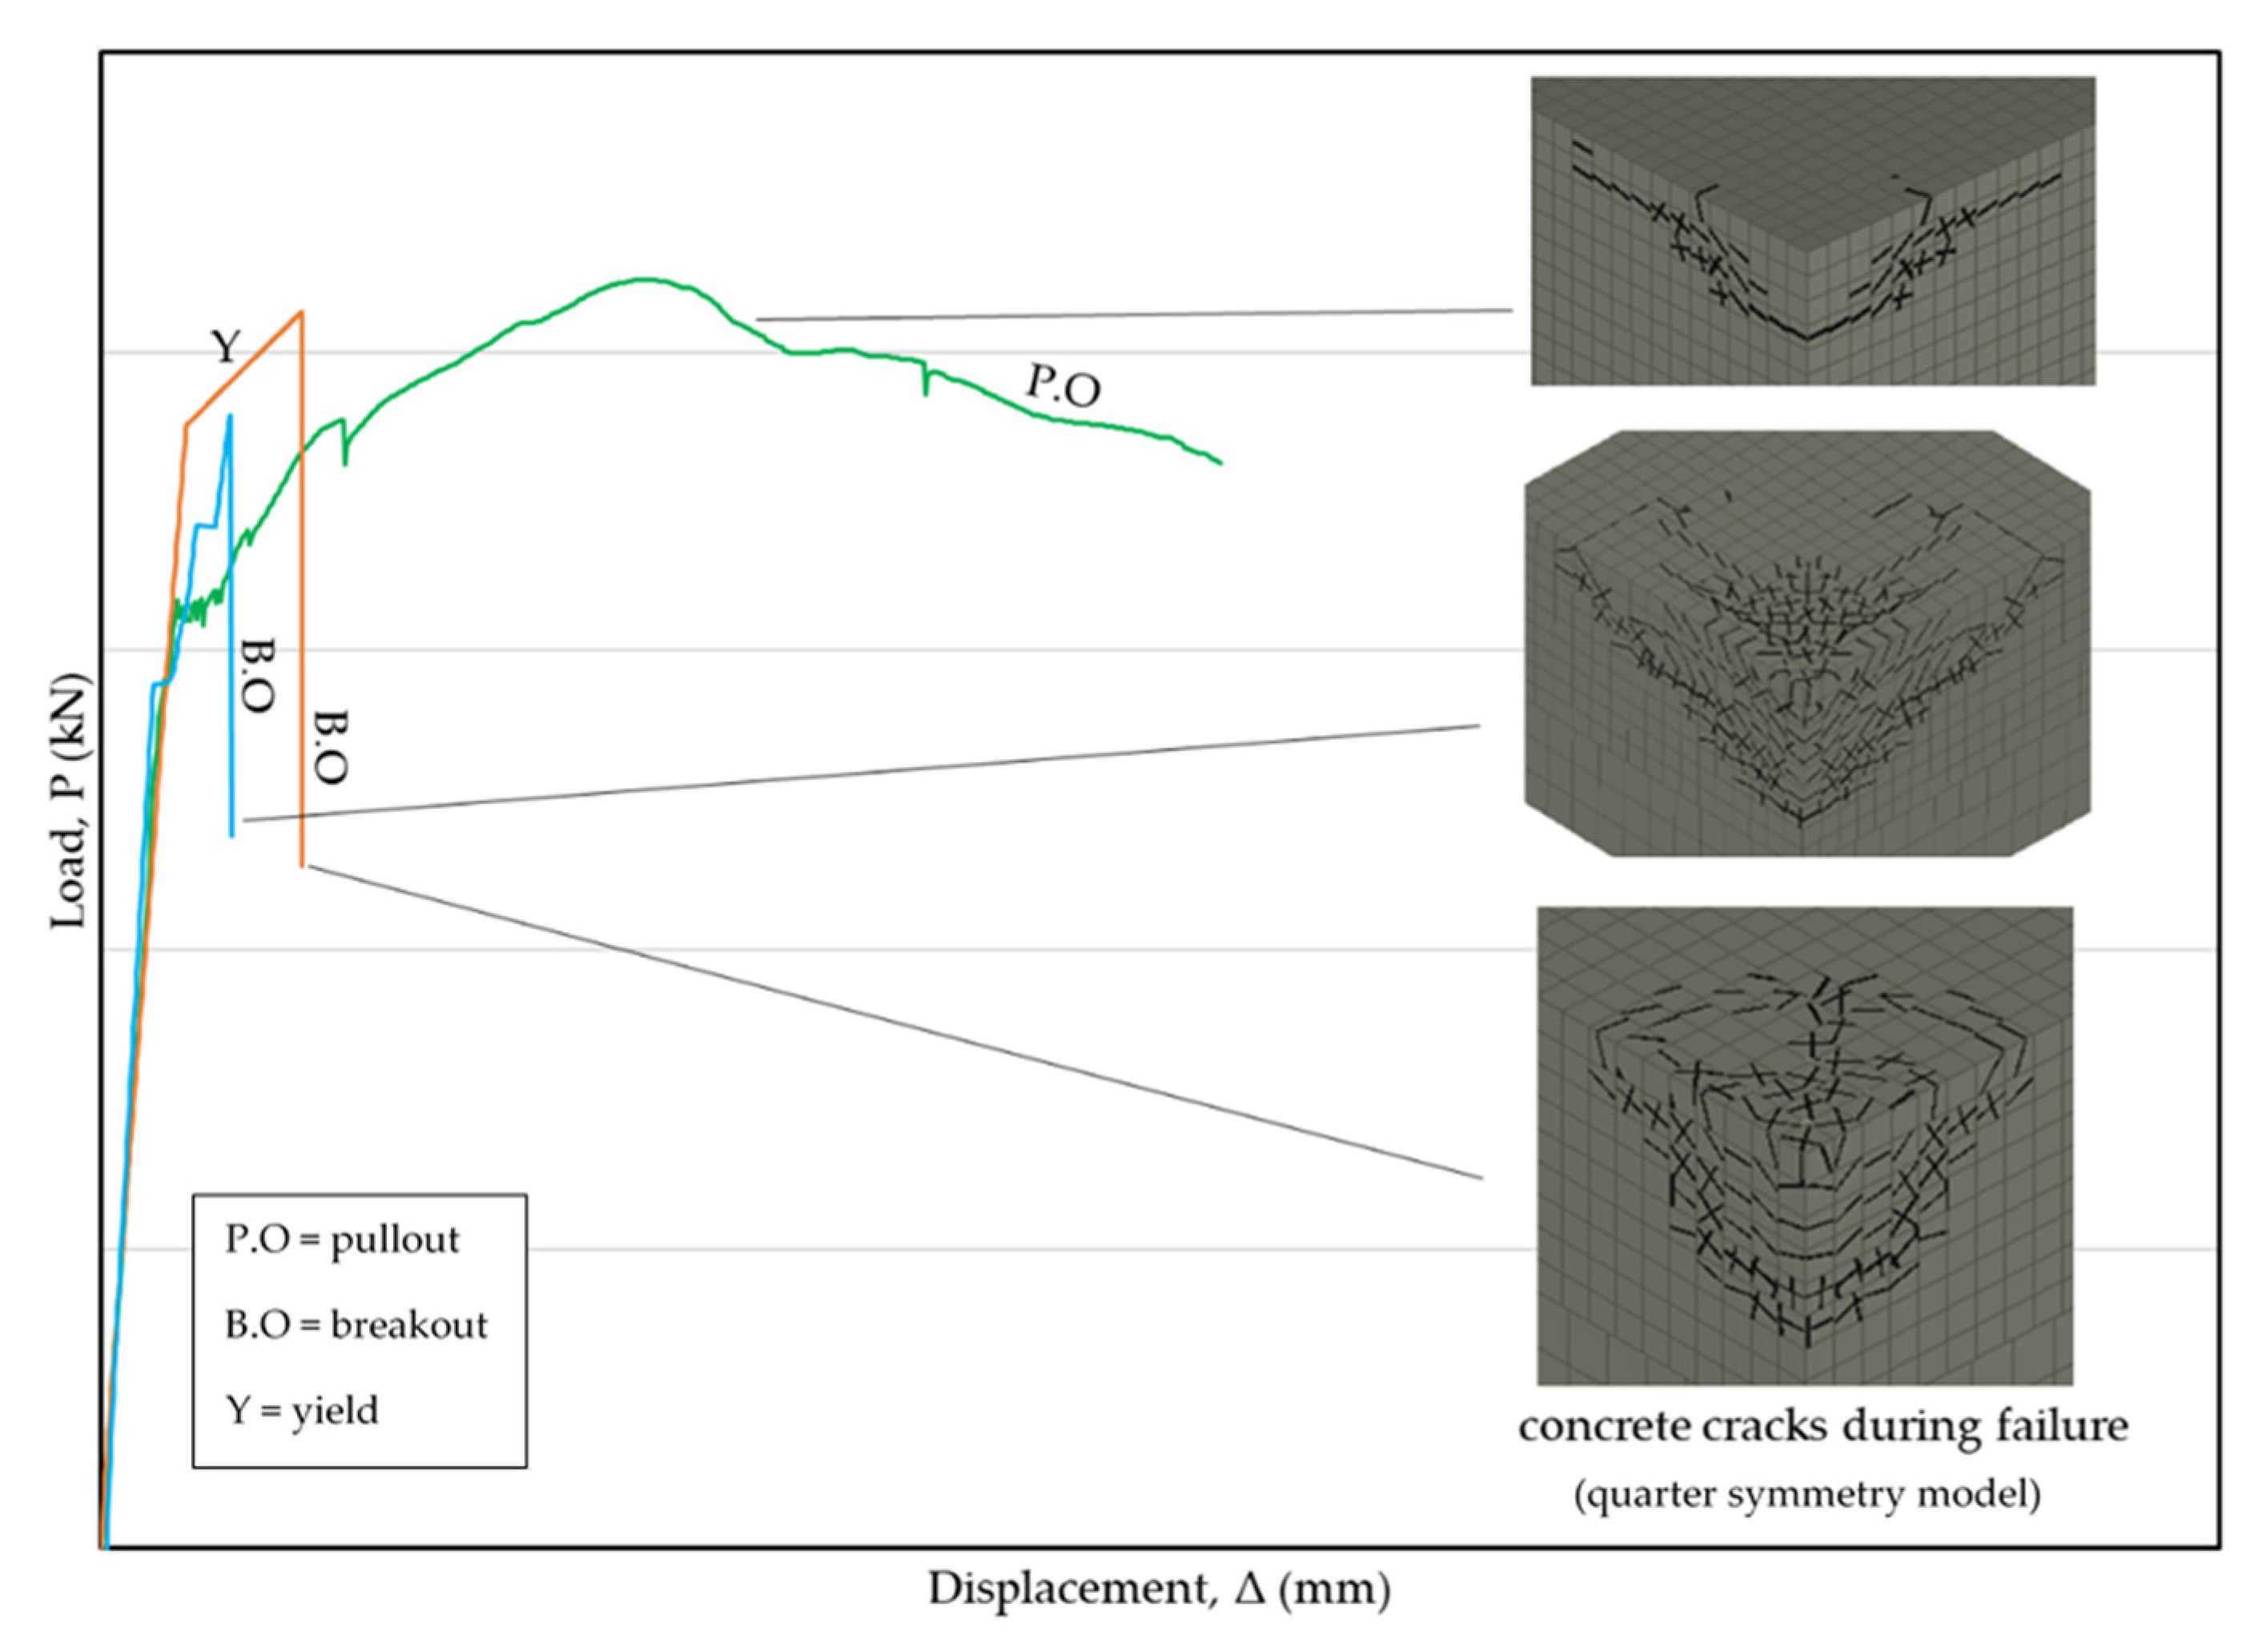
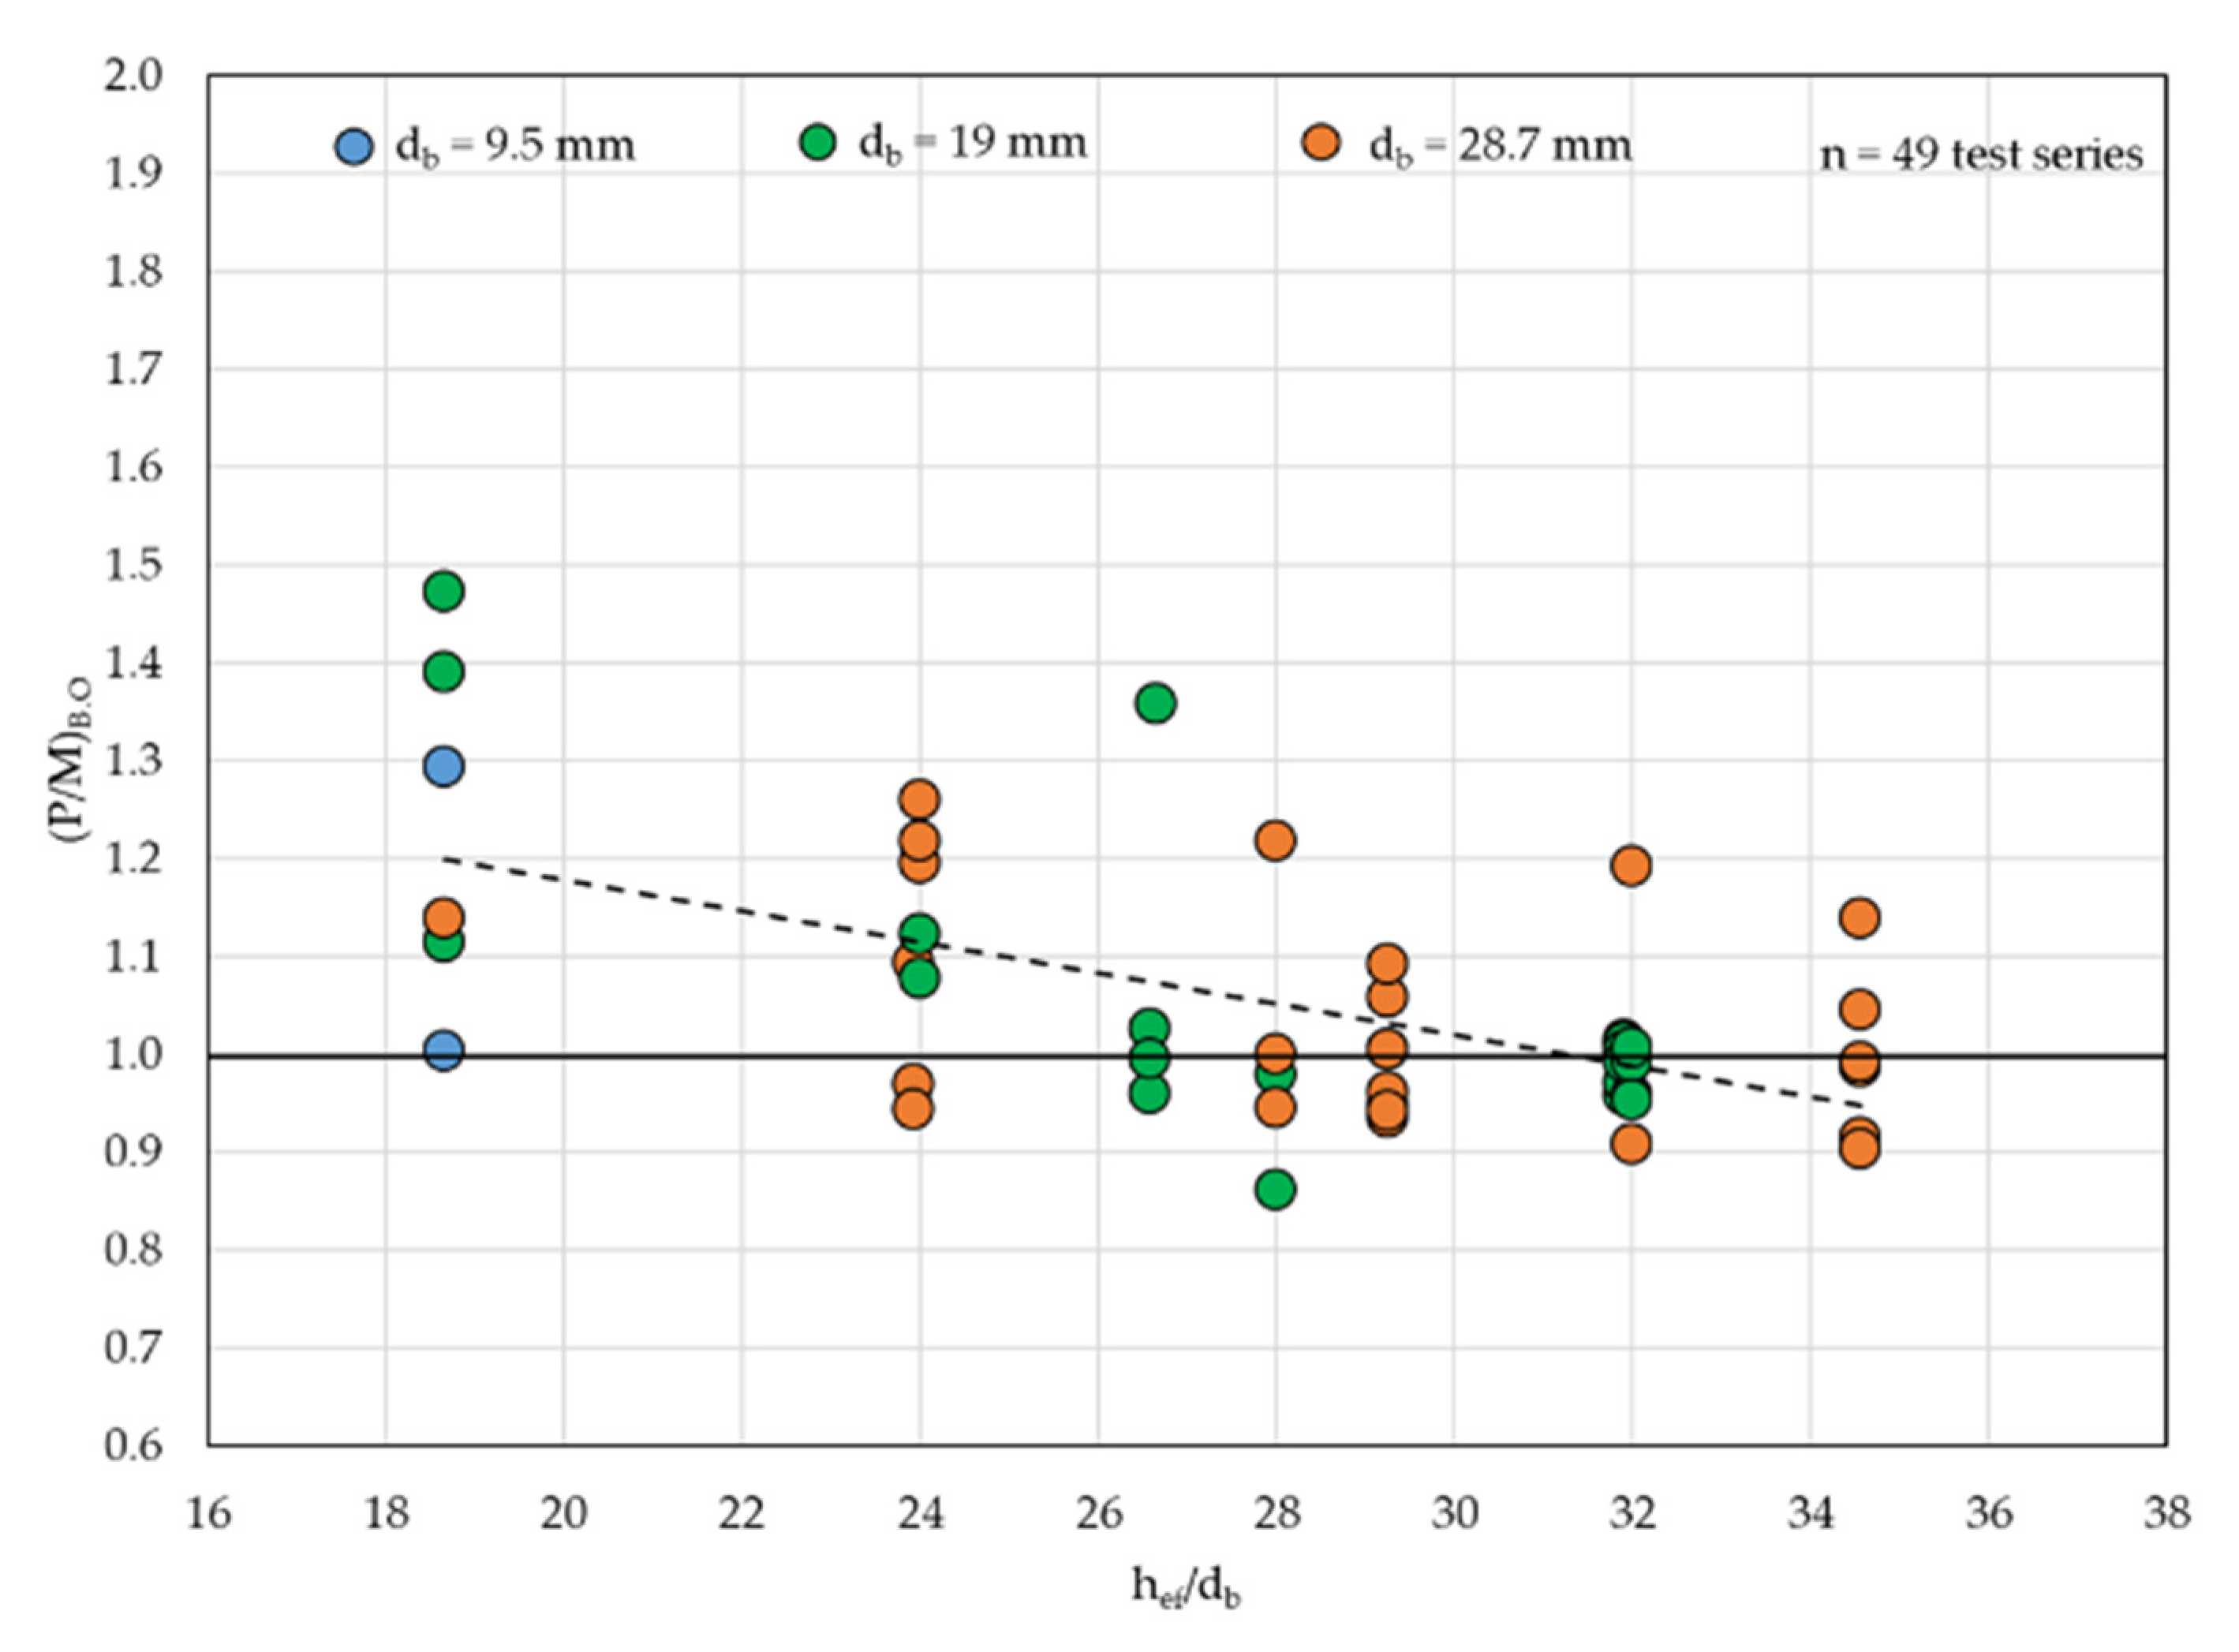
Results from Parametric Study

The different values of anchor parameters and material properties (Table 4) were incorporated into FE Atena models using the validated modeling approach explained in Section 2. The failure modes prevalent throughout the analyses were pullout and concrete breakout. Figure 9 shows the typical three behaviors observed throughout the parametric study. In the pullout case (marked P.O in Figure 9), concrete cracks were observed at the periphery of the anchor and farther away from it during pullout failure. These cracks indicated a mixed pullout/concrete failure, which was evident after comparing them to the typical cracks in pullout failure of single anchors (Figure 7b). Pullout failure was dominant in DRA models with hef = Ld. At deeper embedments, another mixed failure also occurred, which consisted of steel yielding followed by concrete breakout. This was observed in the models with widely spaced anchors. The breakout cone was shallower for the mixed failure cases. The third behavior observed was concrete breakout, where no steel yielding occurred, and the development of a breakout cone was evident. Breakout was achieved at low displacements, showing the brittle nature of this failure mode. This greatly contrasts the gradual decline of load over a larger displacement during pullout failure, which indicates a more ductile failure.
Out of the 83 analyzed samples in the parametric study, 49 of them failed by concrete breakout and the mixed case of steel yielding followed by breakout. The pullout failure case was neglected when evaluating breakout behavior. Figure 10 shows the ratio of predicted to mean capacities (P/M)B.O of DRAs relative to the hef/db ratio of the anchors for these 49 samples. As different bar diameters were presented in this study, the ratio hef/db was used to normalize the influence of diameter size. The predicted breakout capacities (PB.O) were the peak capacities determined from the FE analyses. The mean breakout capacities (MB.O) were calculated from the CCD equations in ACI 318-19 using a k (mean) factor of 40, empirically derived by Fuchs [8] for uncracked concrete. (P/M)B.O ratios greater than 1.0 indicated that the FE models were capable of achieving strengths greater than the code-predicted values, while values less than 1.0 indicated that using a k value of 40 was unconservative for the given anchor scenario being tested. The dashed line in the figure represented the best fit of the scattered data. Figure 10 shows a downward trend of (P/M)B.O relative to increasing values of hef/db. The negative slope of the dashed line indicates that the predicted capacities generally dropped below the mean capacities at higher hef/db ratios. In other words, a k factor of 40 was conservative at shorter embedment to bar diameter ratios, but less conservative at greater embedments.
Figure 11 shows the ratio of (P/M)B.O relative to the spacing to bar diameter ratio, s/db. The positive or upward slope of the dashed line indicates that the predicted capacities generally exceeded the mean capacities at higher s/db ratios. Wider spacing of anchors resulted in conservative predictions of peak anchor capacity using a k factor of 40. The concrete crack patterns for different embedment depths and spacings did not vary greatly from those shown in Figure 9.
The ratio of (P/M)B.O was multiplied by Fuchs’ k factor of 40 to obtain the FE-predicted k factor for each test result. The value of k factor was between 35 and 45 for 75% of the analyzed tests of DRA system, which ultimately failed by concrete breakout. The recommended k factors for cast-in and post-installed anchors by Fuchs [8] are 40 and 35. The ACI equivalent k factors for cast-in and post-installed anchors are 40 and 31.7 (Section 1).
The histogram (Figure 12) was used to show the frequency distribution of the predicted k factor determined from FE analyses. The k factor was predicted in the range of 30 to 60 from the 49 samples taken out of the parametric data of DRAs. The mean k factor of these analyzed samples was 42. More than 20 samples predicted k close to 35 and 40. The n, x ¯ , and v in the histogram represented the total, mean, and standard deviation of the samples, respectively. The breakout capacities produced from the FE models differed by a coefficient of variance (c.o.v or v) of 10.95%. This is a reasonable amount of variation commonly observed in the anchorage field.
Based on n, x ¯ , and v from this parametric study, the kc (5% fractile) factor for DRAs in cracked concrete was calculated to be 26. This was calculated by taking 42 ( x ¯ ) times 1/1.25 (1/ ψ c , N ) times 0.784 [(1-K05v) factor to convert from mean to 5% fractile]. K05 is equal to 1.969 for n = 49 [5].

4. Conclusions

This study presented results from tension loaded DRA groups simulated using the FE software, Atena. The analysis results showed that the concrete breakout failure mode must be considered in the design of DRA groups. This consideration may be important in the design of nuclear power facilities, where engineers often assume other failure modes such as pullout or steel failure (yielding or rupture) control over concrete breakout failure.
The primary conclusions formed based on the parameters tested in this study are as follows:
  • Concrete breakout failure was dominant in tension loaded DRA groups with adequate development lengths (hef > Ld) and typical configurations.
  • The ACI CCD formula was found to be a feasible method to estimate concrete capacity of tension loaded DRAs using a kc factor no greater than 26.
  • Smaller spacing and deeper embedment of DRAs led to less conservative predictions of breakout capacity using the CCD formula.
The analytical simulations produced higher capacities at wider anchor spacing relative to the CCD formula with k = 40. For widely spaced anchors, steel yielding preceded concrete breakout and exhibited a hybrid failure. As the ACI CCD formula does not appear to account for hybrid failure, this could explain the overestimation of DRA breakout capacity for larger anchor center to center spacing (s > 10db).
The kc factor of 26 determined from this study corresponds closely with kc = 24 specified in ACI 318-19 [5] and ACI 349-13 [1] for cast-in-place anchors. This shows that, for the given scenarios simulated in this study, the code-mandated kc factor of 24 can be conservatively used to predict concrete breakout capacities for cast-in DRAs subjected to tension.
The findings of this study pertain to DRAs loaded in uniaxial tension in uncracked concrete without edge effects. This study was limited in the selection of anchor diameter, configuration, spacing, and embedment depth, but was representative of configurations used in practice. Expansion of this numerical study would help to further validate the findings. Further, more experimental investigations are needed in order to provide opportunities for additional benchmarking. These investigations may include additional pullout tests of DRAs to further benchmark the analytical models, bond–slip tests of DRAs, and more expansive experimental parametric studies. The scope of the study can be expanded by including additional variables such as bent anchors, deformed wire anchors, and eccentric loading. Combined shear and tension load, as well as edge effects ought to be also considered in future work.

Author Contributions

Conceptualization, R.A.C.; methodology, R.A.C. and S.C.; software, S.C.; investigation, R.A.C. and S.C.; writing—original draft preparation, S.C.; writing—review and editing, R.A.C.; supervision, R.A.C. Both authors have read and agreed to the published version of the manuscript.

Funding

This research received no external funding.

Data Availability Statement

Data available within the article.

Conflicts of Interest

The authors declare no conflict of interest.

References

  1. ACI Committee 349, American Concrete Institute; International Organization for Standardization. Code Requirements for Nuclear Safety Related Concrete Structures (ACI 349-13) and Commentary; American Concrete Institute: Farmington Hills, MI, USA, 2013. [Google Scholar]
  2. Chicchi, R.; Varma, A.H.; Seo, J.; Bradt, T.; McCarty, E. Experimental Testing of Tension-Loaded Deformed Anchors in Concrete. ACI Struct. J. 2020, 117, 133–146. [Google Scholar] [CrossRef]
  3. Mahadik, V.; Sharma, A.; Hofmann, J. Cast-in and post-installed rebar anchorage systems in RC column foundation joints: Experimental investigations. Eng. Struct. 2021, 238, 112208. [Google Scholar] [CrossRef]
  4. Mahrenholtz, C.; Eligehausen, R.; Reinhardt, H.W. Qualification and design of cast-in-place and post-installed reinforcing bar anchorages. ACI Struct. J. 2020, 117, 3–16. [Google Scholar] [CrossRef]
  5. ACI Committee 318, American Concrete Institute; International Organization for Standardization. Building Code Requirements for Structural Concrete (ACI 318-19) and Commentary; American Concrete Institute: Farmington Hills, MI, USA, 2008. [Google Scholar]
  6. Mahrenholtz, C.; Eligehausen, R. Groups of reinforcing bar anchorages—A comparison of the capacity calculated as end anchorage and as adhesive anchor. In Proceedings of the fib Symposium 2019, Krakow, Poland, 27–29 May 2019. [Google Scholar]
  7. Mahrenholtz, C.; Akguzel, U.; Eligehausen, R.; Pampanin, S. New Design Methodology for Seismic Column-to-Foundation Anchorage Connections. ACI Struct. J. 2014, 111, 1179–1190. [Google Scholar] [CrossRef]
  8. Fuchs, W.; Eligehausen, R.; Breen, J.E. Concrete capacity design (CCD) approach for fastening to concrete. ACI Struct. J. 1995, 92, 73–94. [Google Scholar]
  9. Part 4. Design of fastenings for use in concrete. In EN1992-4 Eurocode 2 Design of Concrete Structures; European Committee for Standardization: Brussels, Belgium, 2018; EN1992-4:2018 (E).
  10. Bokor, B.; Sharma, A.; Hofmann, J. Experimental investigations on concrete cone failure of rectangular and non-rectangular anchor groups. Eng. Struct. 2019, 188, 202–217. [Google Scholar] [CrossRef]
  11. Cervenka, V.; Jendele, L.; Cervenka, J. ATENA Program Documentation Part 1 Theory; Cervenka Consulting: Prague, Czech Republic, 2011; p. 231. [Google Scholar]
  12. Federation Internationale du Beton. fib Model Code for Concrete Structures 2010; Ernst & Sohn, a Wiley Brand: Lausanne, Switzerland, 2013. [Google Scholar]
  13. Vos, E. Influence of Loading Rate and Radial Pressure on Bond in Reinforced Concrete. Ph.D. Thesis, Delft University, Delft, Netherlands, 1983; pp. 219–220. [Google Scholar]
  14. Cornelissen, H.A.W.; Hordijk, D.A.; Reinhardt, H.W. Experimental determination of crack softening characteristics of normal-weight and lightweight concrete. Heron 1986, 31, 45–56. [Google Scholar]
  15. Comité Euro-International du Béton. CEB-FIP Model Code 1990: Design Code; Thomas Telford Publishing: London, UK, 1993. [Google Scholar]
  16. Cervenka, V.; Červenka, J.; Pukl, R.; Sajdlova, T. Prediction of Shear Failure of Large Beams Based on Fracture Mechanics. In Proceedings of the 9th International Conference on Fracture Mechanics of Concrete and Concrete Structures; International Association for Fracture Mechanics of Concrete and Concrete Structures: Berkeley, CA, USA, 2016. [Google Scholar]
  17. Cervenka, J.; Cervenka, V.; Laserna, S. On crack band model in finite element analysis of concrete fracture in engineering practice. Eng. Fract. Mech. 2018, 197, 27–47. [Google Scholar] [CrossRef]
Figure 1. DRAs attached to embedment plate.
Civileng 02 00025 g001
Figure 2. Test setup.
Civileng 02 00025 g002
Figure 3. Finite element model in Atena (quarter symmetry).
Civileng 02 00025 g003
Figure 4. Qualitative tension softening curve of concrete.
Civileng 02 00025 g004
Figure 5. (a) Bilinear stress–strain curve of steel; (b) normalized bond–slip curve.
Civileng 02 00025 g005
Figure 6. Comparison of FE results of 50 mm and 100 mm mesh size models (quarter symmetry).
Civileng 02 00025 g006
Figure 7. Load–displacement responses of single anchors: (a) S_1, S_2, and S_3 (db = 19 mm); (b) S_4 and S_5 (db = 28.7 mm).
Civileng 02 00025 g007aCivileng 02 00025 g007b
Figure 8. Load–displacement responses of group anchors.
Civileng 02 00025 g008
Figure 9. P-∆ responses and failure modes of various parametric analyses.
Civileng 02 00025 g009
Figure 10. (P/M)B.O vs. hef/db.
Civileng 02 00025 g010
Figure 11. (P/M)B.O vs. s/db.
Civileng 02 00025 g011
Figure 12. Histogram of k factor determined by FE analyses.
Civileng 02 00025 g012
Table 1. DRA test data [2].
Test db (mm)a × bs (mm)hef (mm)f’c (MPa)
S_1191 × 1-20329.6
S_2191 × 1-27929.6
S_3191 × 1-48329.6
S_428.71 × 1-43226.3
S_528.71 × 1-58426.3
G_1195 × 5102609.631.4
G_2195 × 5102609.633.6
S = single; G = group; 5 × 5 = 25 anchors with 5 anchors in each row and column.
Table 2. Material properties of concrete.
Concrete PropertiesMC 2010 [12] FormulasFor Test G_1
Cylinder
compressive strength
f c m (MPa)31.4 MPa (from experiment [2])
Tensile strength f c t m = 0.3 × ( f c m 8 ) 2 3 (MPa)2.45 MPa
Tangent
modulus of elasticity
E c m = 21.5 × 10 3 × ( f c m 10 ) 1 3 (MPa)31,483.4 MPa
Fracture energy G F = 73 × f c m 0.18 (N/m)135.76 N/m
58 N/m (used)
Maximum crack opening w c = 5.14 × G F f c t m (mm)0.122 mm
Table 3. Material properties of steel and maximum bond stress.
Test Fy (MPa)Fu (MPa)εuτmax (MPa)
S_1469.1710.40.098.5
S_2469.1710.40.098.8
S_3469.1710.40.098.8
S_4552710.40.0610.5
S_5552710.40.0610.5
G_1469.1710.40.098.8
G_2469.1710.40.098.8
Table 4. Data for parametric analysis.
ParametersValues
db9.5 mm, 19 mm, 28.7 mm
a × b(4 × 4), (5 × 5), (6 × 6)
s102 mm, 152 mm, 203 mm
hefLd, (Ld + 76), (Ld + 152) mm
f ′c27.6 MPa, 41.4 MPa
GF58 N/m
τmax2 f c MPa [15]
Fy, Fu, εu414 MPa, 710 MPa, 0.09
Publisher’s Note: MDPI stays neutral with regard to jurisdictional claims in published maps and institutional affiliations.

