Article

Study of the Bond Capacity of FRCM- and SRG-Masonry Joints

by
Karrar Al-Lami
1,2,
Tommaso D’Antino
1 and
Pierluigi Colombi
1,*
1
ABC Department of Architecture, Built Environment and Construction Engineering, Politecnico di Milano, 20133 Milan, Italy
2
Civil Engineering Department, College of Engineering, University of Wasit, Al-Rabee st, Wasit 00964, Iraq
*
Author to whom correspondence should be addressed.
CivilEng 2021, 2(1), 68-86; https://doi.org/10.3390/civileng2010005
Submission received: 13 December 2020 / Revised: 4 January 2021 / Accepted: 6 January 2021 / Published: 10 January 2021
(This article belongs to the Special Issue Advances in Civil Engineering)

Abstract

:
Fiber-reinforced cementitious matrix (FRCM) and steel-reinforced grout (SRG) have been increasingly applied as externally bonded reinforcement to masonry members in the last few years. Unlike fiber-reinforced polymer (FRP), FRCM and SRG have good performance when exposed to (relatively) high temperature and good compatibility with inorganic substrates, and they can be applied to wet surfaces and at (reasonably) low temperatures. Although numerous studies investigated the mechanical properties and bond performance of various FRCM and SRG, new composites have been developed recently, and their performance still needs to be assessed. In this study, the bond behavior of three FRCM composites and one SRG composite applied to a masonry substrate is investigated. Sixteen single-lap direct shear tests (four tests for each composite) are performed. The FRCM studied comprised one layer of carbon, PBO (polyparaphenylene benzobisoxazole), or alkali-resistant (AR)-glass bidirectional textile embedded within two cement-based matrices. The SRG composite comprised one layer of a unidirectional stainless-steel cord textile embedded within a lime-based matrix. The results show a peculiar bond behavior and failure mode for each composite. Based on these results, the behavior of the carbon and PBO FRCM is modeled solving the bond differential equation with a trilinear cohesive material law (CML).

1. Introduction

The strengthening and retrofitting of existing concrete and masonry structures have attracted great attention in the last few decades. Fiber-reinforced polymer (FRP) composites have been largely used as an externally bonded reinforcement (EBR) of existing structural and non-structural concrete and masonry members due to their high mechanical properties, durability, and ease of installation [1,2,3,4]. Nonetheless, FRP EBR has some disadvantages mainly associated with the use of organic matrices (usually epoxy resins), which have poor performance at (relatively) high temperature (close to or higher than their glass transition temperature), produce toxic fumes if heated, cannot be applied to wet surfaces, and have poor physical–chemical compatibility with inorganic substrates. In order to accommodate these drawbacks, the organic matrix was replaced with inorganic matrices, such as cement, hydraulic lime, and geopolymer mortars [5,6,7]. However, the impregnation of continuous fiber sheets was difficult in this case due to the size of micro-aggregates in the matrix. Therefore, to improve the matrix–fiber bond behavior and allow the stress transfer between different layers of matrix, fiber sheets were replaced with open-mesh textiles [8]. This type of composite is usually referred to as fiber-reinforced cementitious matrix (FRCM), textile-reinforced mortar (TRM) [8,9,10,11], or, when the textile comprises steel cords, steel-reinforced grout (SRG) [6,12,13].
Textiles made of different high-strength fibers can be used in FRCM composites, such as aramid, basalt [14,15], carbon [7,16], PBO (polyparaphenylene benzobisoxazole) [17,18], and alkali-resistant (AR) glass [19,20]. Textiles are generally organized in a bidirectional open mesh configuration. The textile configuration (size, directions, and shape of single yarn, spacing between yarns) can be modified to provide specific properties to the composite [21,22]. Furthermore, textile yarns can be coated with resin to protect them, facilitate their handling and installation, and improve the matrix–fiber bond behavior. In SRG composites, galvanized or stainless-steel cords are employed. These cords are organized in unidirectional textiles and can have different spacing depending on the performance sought [6,8,23].
FRCM and SRG have progressively become attractive for strengthening and retrofitting both masonry and concrete structures for their competitive cost, resistance to (relatively) high temperatures, compatibility with the substrate, and applicability on wet surfaces and at (reasonably) low temperatures. The main difference between FRCM for concrete or masonry applications lies in the matrix employed, which should be ad hoc engineered to optimize the compatibility with the substrate [21,22]. Numerous researchers [6,7,20,21,24] have been investigating the performance of various FRCM and SRG in the last decade, and the findings allowed for developing acceptance criteria and design guidelines for this type of composite [9,10,11]. However, the available literature showed that each inorganic–matrix composite has peculiar properties that depend on several parameters (e.g., textile and matrix physical and mechanical properties and textile layout) and that are hard to estimate without proper experimental tests and analyses.
In this paper, the bond behavior of three FRCM composites and one SRG composite is investigated by means of single-lap direct shear tests on composite-masonry joints. The FRCM comprised a bidirectional carbon, PBO, or AR-glass textile, whereas the SRG comprised a unidirectional stainless-steel cord textile. Cement- and lime-based mortars were used as the matrix. For the PBO and carbon FRCM studied in this paper, other experimental investigations are available in the literature (see e.g., [25]). However, no other contributions are available regarding the AR-glass FRCM and the stainless-steel SRG considered. Based on the results obtained, an analytical procedure is used to solve the bond differential equation and model the behavior of the PBO and carbon FRCM using a trilinear cohesive material law (CML). Due to the specific failure mode observed in AR-glass FRCM- and SRG-masonry joints, the analytical procedure could not be performed.

2. Experimental Program

Six masonry blocks with dimensions 120 mm × 125 mm × 380 mm were assembled using six half-bricks. Commercially available fired-clay bricks with dimension of 55 mm × 120 mm × 250 mm were employed [26], whereas the 10 mm thick mortar joints were comprised of a pre-mixed cementitious mortar. The compressive strength, splitting strength, and elastic modulus of the bricks were determined in [27] by testing cylinders cored from the bricks and were 20.3, 3.12, and 7300 MPa, respectively. The pre-mixed mortar had a 28-day compressive strength of 2.5 MPa, as declared by the manufacturer [28].
Three types of FRCM composites and one SRG composite were externally bonded to the masonry blocks. Four nominally equal specimens were tested for each type of composite. The FRCM composites comprised three different bidirectional textiles and two inorganic mortars (here referred to as matrices to prevent confusion with the mortar used to assemble the blocks). The first and second FRCM composite comprised carbon and PBO textiles, respectively, which were embedded within the same cement-based matrix [29]. The third FRCM composite included an AR-glass-coated textile embedded within a cement-based mortar. Finally, the SRG composite was comprised of a unidirectional stainless-steel cord textile embedded within a natural hydraulic lime NHL 5 matrix [30]. Figure 1 shows the four types of textiles considered in this study. While the carbon and PBO textiles have longitudinal and transversal yarns not threaded together, the AR-glass textile was obtained with the leno wave technique [31], where the transversal (weft) yarns pass through longitudinal (warp) yarns (Figure 1). Therefore, only in the AR-glass FRCM the transversal yarns may contribute to the composite capacity when the load is applied to the longitudinal yarns [32].
The mechanical properties of the textiles and matrices are summarized in Table 1, where the properties of carbon and PBO textiles were measured by tensile tests as reported in [21,25], respectively, while those of the steel textile were reported by the manufacturer [33]. The tensile strength and elastic modulus of the AR-glass textile were obtained by nine tensile tests on specimens comprising three longitudinal yarns according to [11] and were equal to 874 MPa (coefficient of variation (CoV) = 0.078) and 65,300 MPa (CoV = 0.221), respectively. Table 1 also reports the geometrical properties of the textile used. The carbon and PBO textile yarns were assumed to have a rectangular cross-section with width b* and thickness t*. The steel cords and the AR-glass yarns were assumed to have circular cross-sections with diameter d*.

2.1. Specimen Preparation

After being assembled, the masonry blocks were cured in a climatic chamber for 28 days at 25 °C and 90% RH. At the end of the curing period, the FRCM and SRG strips were applied to each face of the masonry block except that cut. The bonded length and width of each composite were 300 mm and 50 mm, respectively. The bonded length was selected to be greater than the effective bond length reported in the literature for similar composites [21,34,35,36] and comply with that recommended by the Italian initial type testing procedure [11]. The width was selected to include at least three textile longitudinal yarns. The strips included n = 5 longitudinal yarns for carbon, n = 5 for PBO, n = 3 for AR-glass, and n = 7 for stainless-steel composites. The FRCM or SRG strips were applied to the block following these steps:
  • The masonry block surface was wet with water to prevent absorption of the matrix water by the substrate.
  • A first (internal) layer of matrix was applied to the substrate using plastic molds to control the bonded area and matrix layer thickness. The thickness of the layer was 5 mm as recommended by the manufacturer [29,30,37].
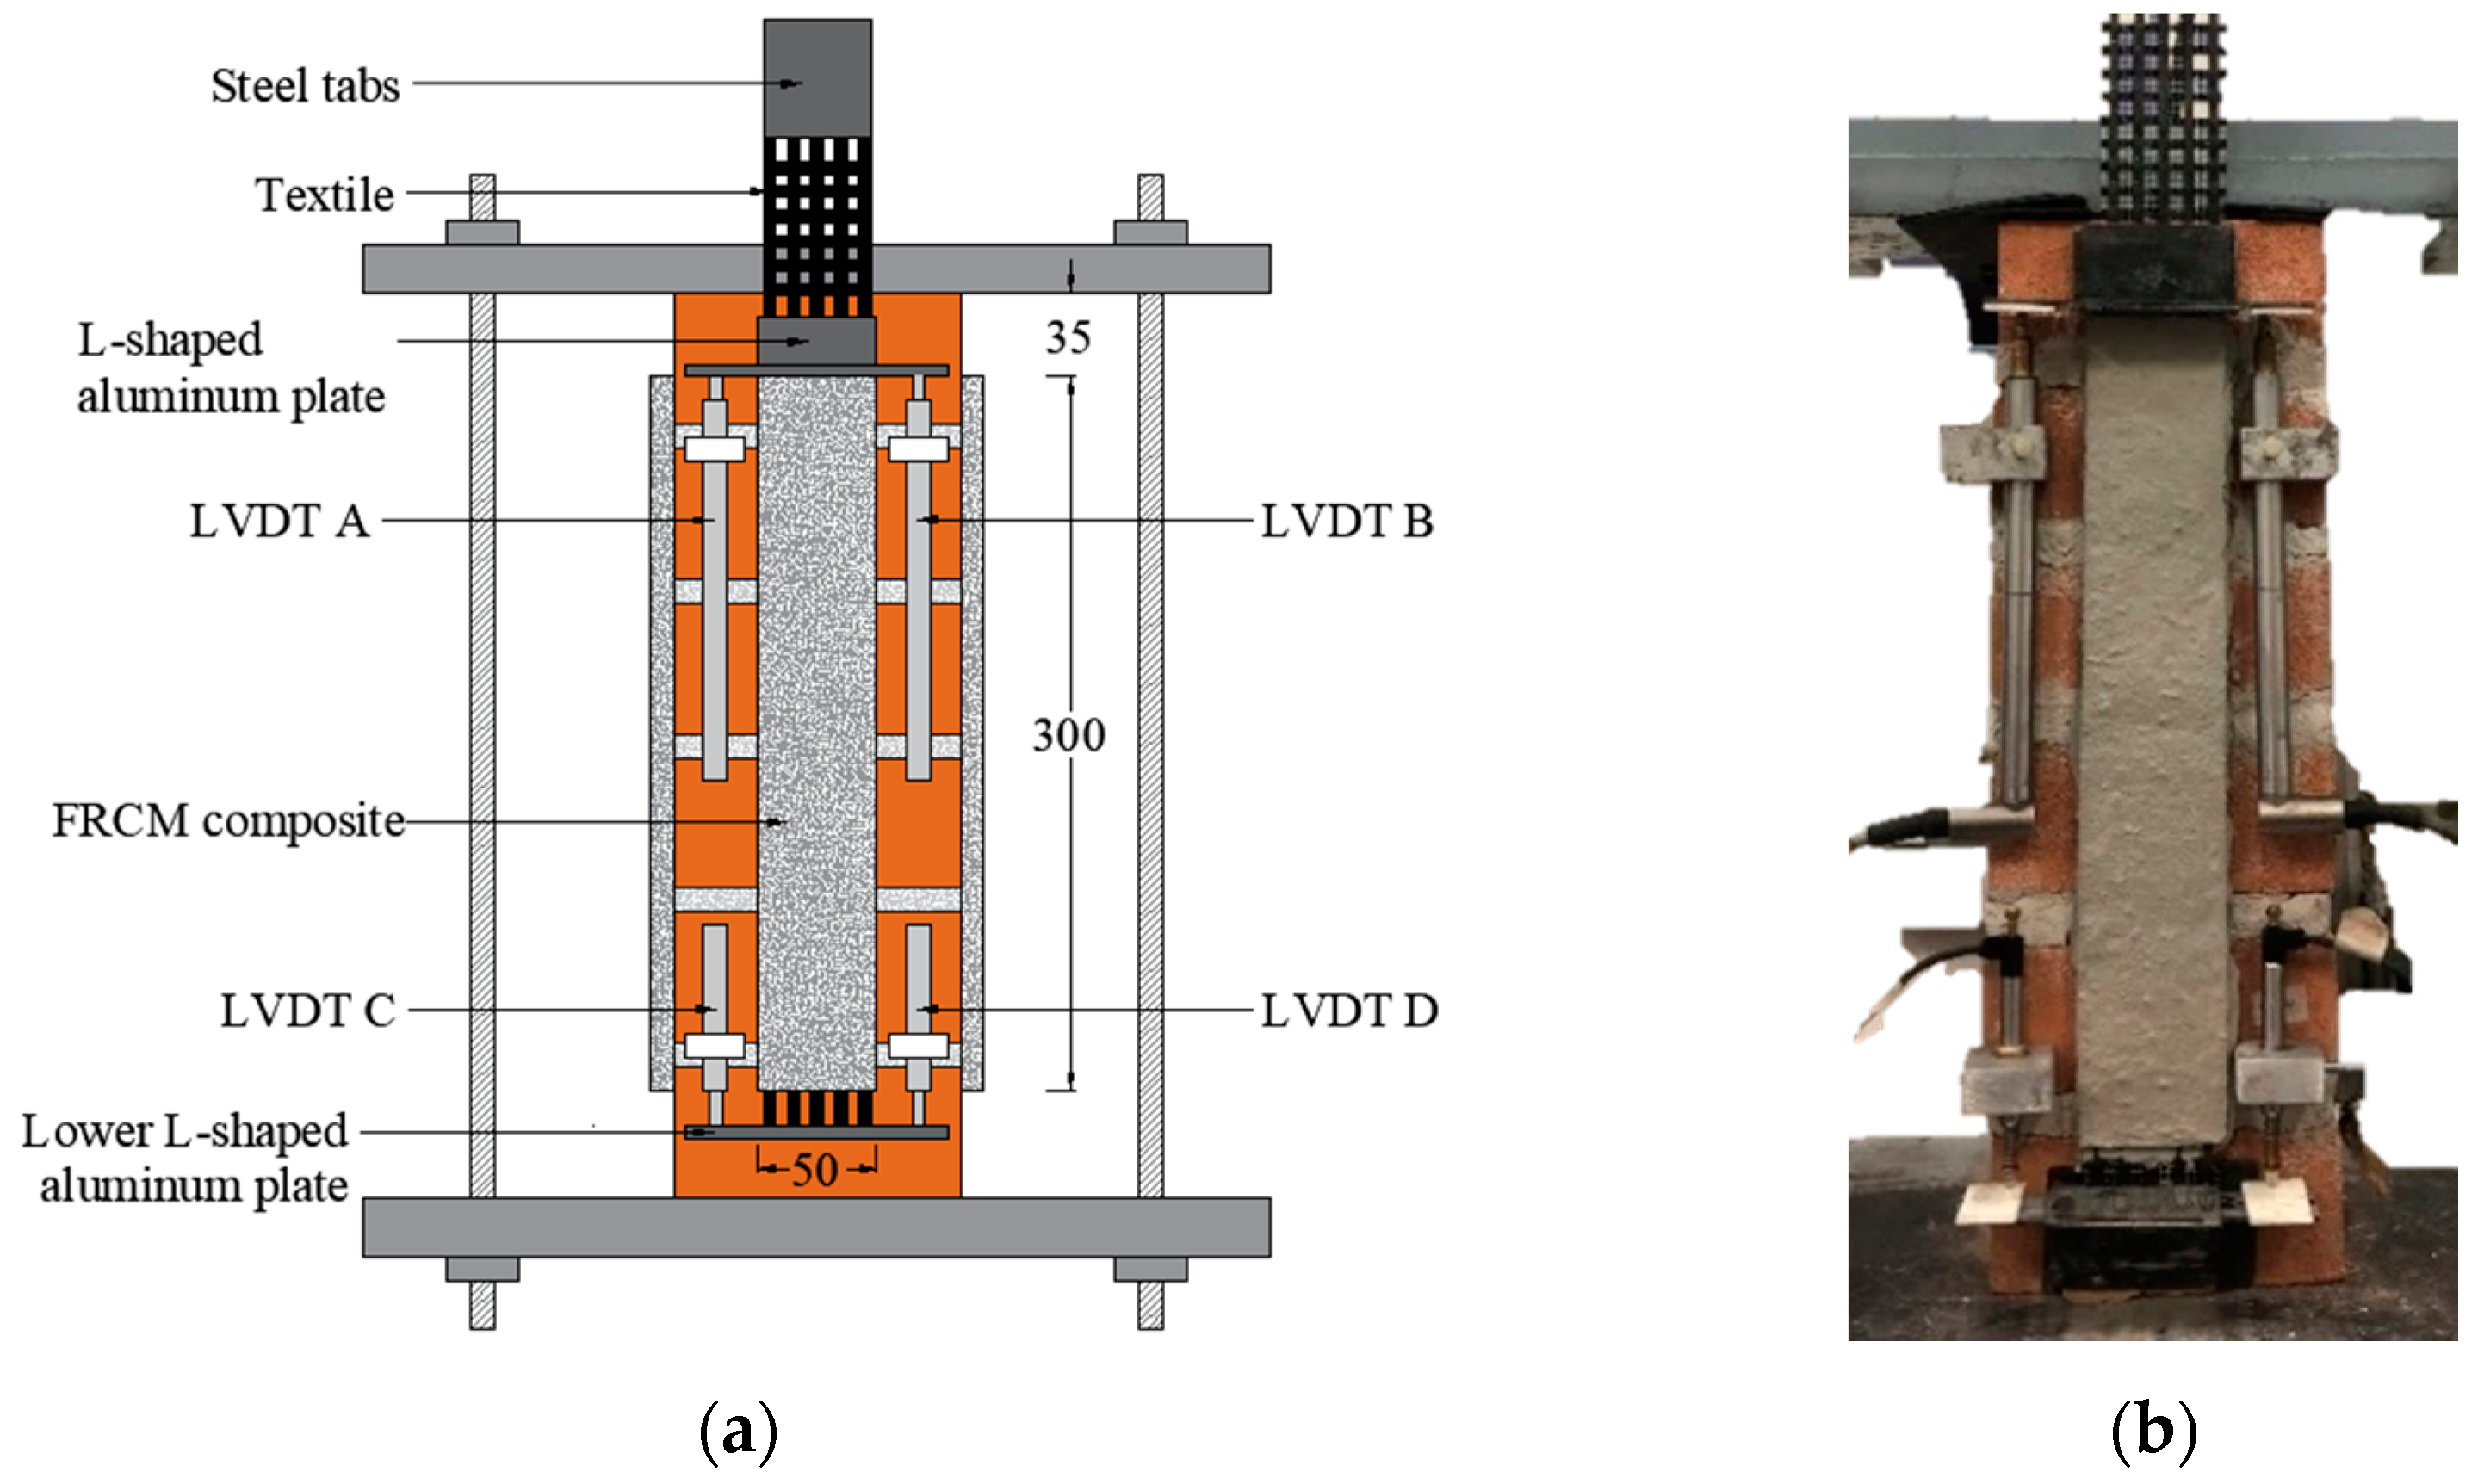
  • A textile strip 630 mm long was gently pressed onto the internal matrix layer. The textile strip was left bare outside the loaded end for 310 mm and outside the free end for 20 mm. The bonded length started 35 mm far from the masonry block edge at the loaded end to prevent the substrate wedge failure [11]. The specimen geometry is shown in Figure 2.
  • Finally, a second (external) layer of matrix with the same dimension of the matrix internal layer was applied over the textile again using a plastic mold to control its geometry.
The specimens were left for 24 h in the lab conditions to allow an initial hardening of the matrix. Then, a composite strip was applied to the other two non-cut faces of the masonry block following the same procedure adopted for the first strip. The specimens were cured inside an environmental chamber for 28 days at 25 °C and 90% RH.

2.2. Single-Lap Direct Shear Test Set-up

A single-lap pull-push direct shear test (Figure 2) was employed in this study. The masonry block was restrained between two steel plates connected by four steel threaded bars. Two steel tabs were epoxy bonded to the end of the bare textile strip at the loaded end to promote gripping by the testing machine. Tests were conducted in displacement control by monotonically increasing the machine stroke at a rate of 0.2 mm/min [11]. The relative displacement between the substrate and the bare fiber just outside the bonded length at the loaded end was measured using two Linear Variable Displacement Transducers (LVDTs) attached to the masonry block and reacting off of an L-shaped aluminum plate attached to the bare fiber just outside the bonded length (Figure 2). The average of the measures of these two LVDTs (A and B) is named global slip g in this paper. Furthermore, two LVDTs (C and D) were attached to the masonry block at the free end and reacted off of an L-shaped aluminum plate attached at the end of the bare fibers at the free end (Figure 2). The average of LVDT C and D measures is named free end slip sF in this paper.

3. Results and Discussion

Specimens were named following the notation DS_300_50_X_n, where DS indicates the type of test (direct shear), 300 is the bonded length (in mm), 50 is the bonded width b1 (in mm), X indicates the composite used (C = carbon FRCM, P = PBO FRCM, G = AR-glass FRCM, S = SRG), and n is the specimen number. The specimen tested are listed in Table 2, where the peak load P*, corresponding average peak load P ¯ * , peak stress (or bond capacity) σ*, corresponding average peak stress σ ¯ * , peak load per unit width P b * = P * / b 1 , corresponding average peak load per unit width P ¯ b * , and failure mode FM are also reported. The bond capacity σ* was determined using Equation (1):
σ * = P * n b * t *
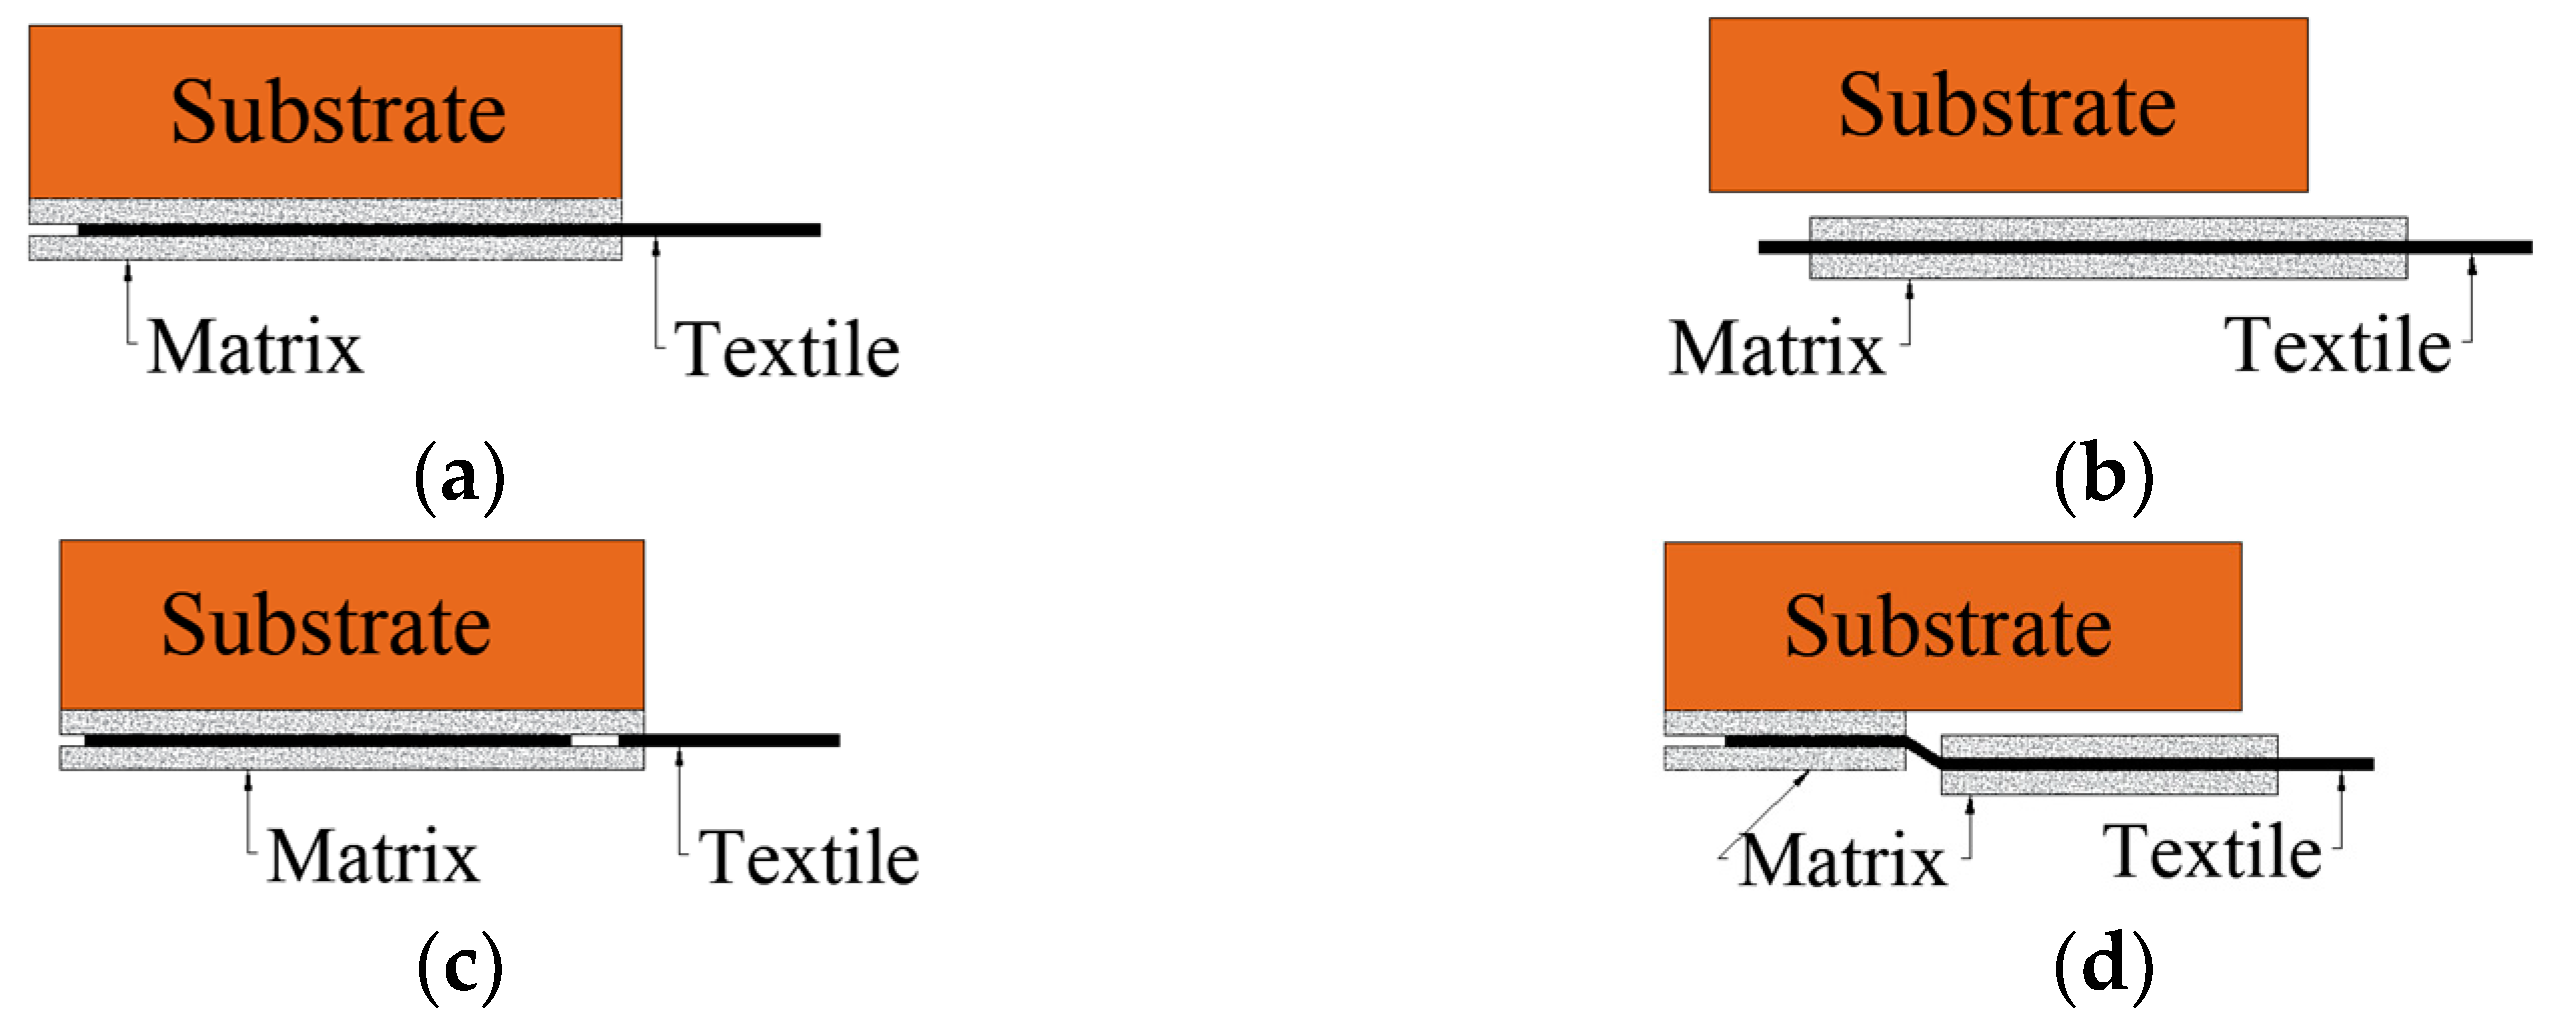
where n is the number of longitudinal yarns within the composite strip width. Four different modes of failure were observed in this study (Figure 3). Failure modes were indicated with the notation YZ, where Y indicates the failure type (D = debonding failure, R = fiber rupture, M = mixed failure) and the subscript Z indicates where the failure occurred (m = within the matrix, s = within the substrate, ms = at the matrix–substrate interface, and mf = at the matrix–fiber interface). When mixed failure occurred, the order of the failure modes referred to in the notation indicates the order these modes occurred in the test. The first failure mode was debonding at the matrix–fiber interface (Dmf), which was characterized by slippage of the textile within the matrix (Figure 3a). The second failure mode was debonding at the matrix–substrate interface (Dms) without damage of the substrate (Figure 3b). The third failure mode was a mixed debonding at the matrix–fiber interface followed by fiber rupture (MDmfR, see Figure 3c). The last failure mode was a mixed debonding at the matrix–substrate interface and matrix–fiber interface (MDmsDmf), which is often triggered by transverse cracking of the matrix (Figure 3d). More details on the failure modes are provided in the following Section 3.1.

3.1. Bond Performance of Carbon FRCM-Masonry Joints

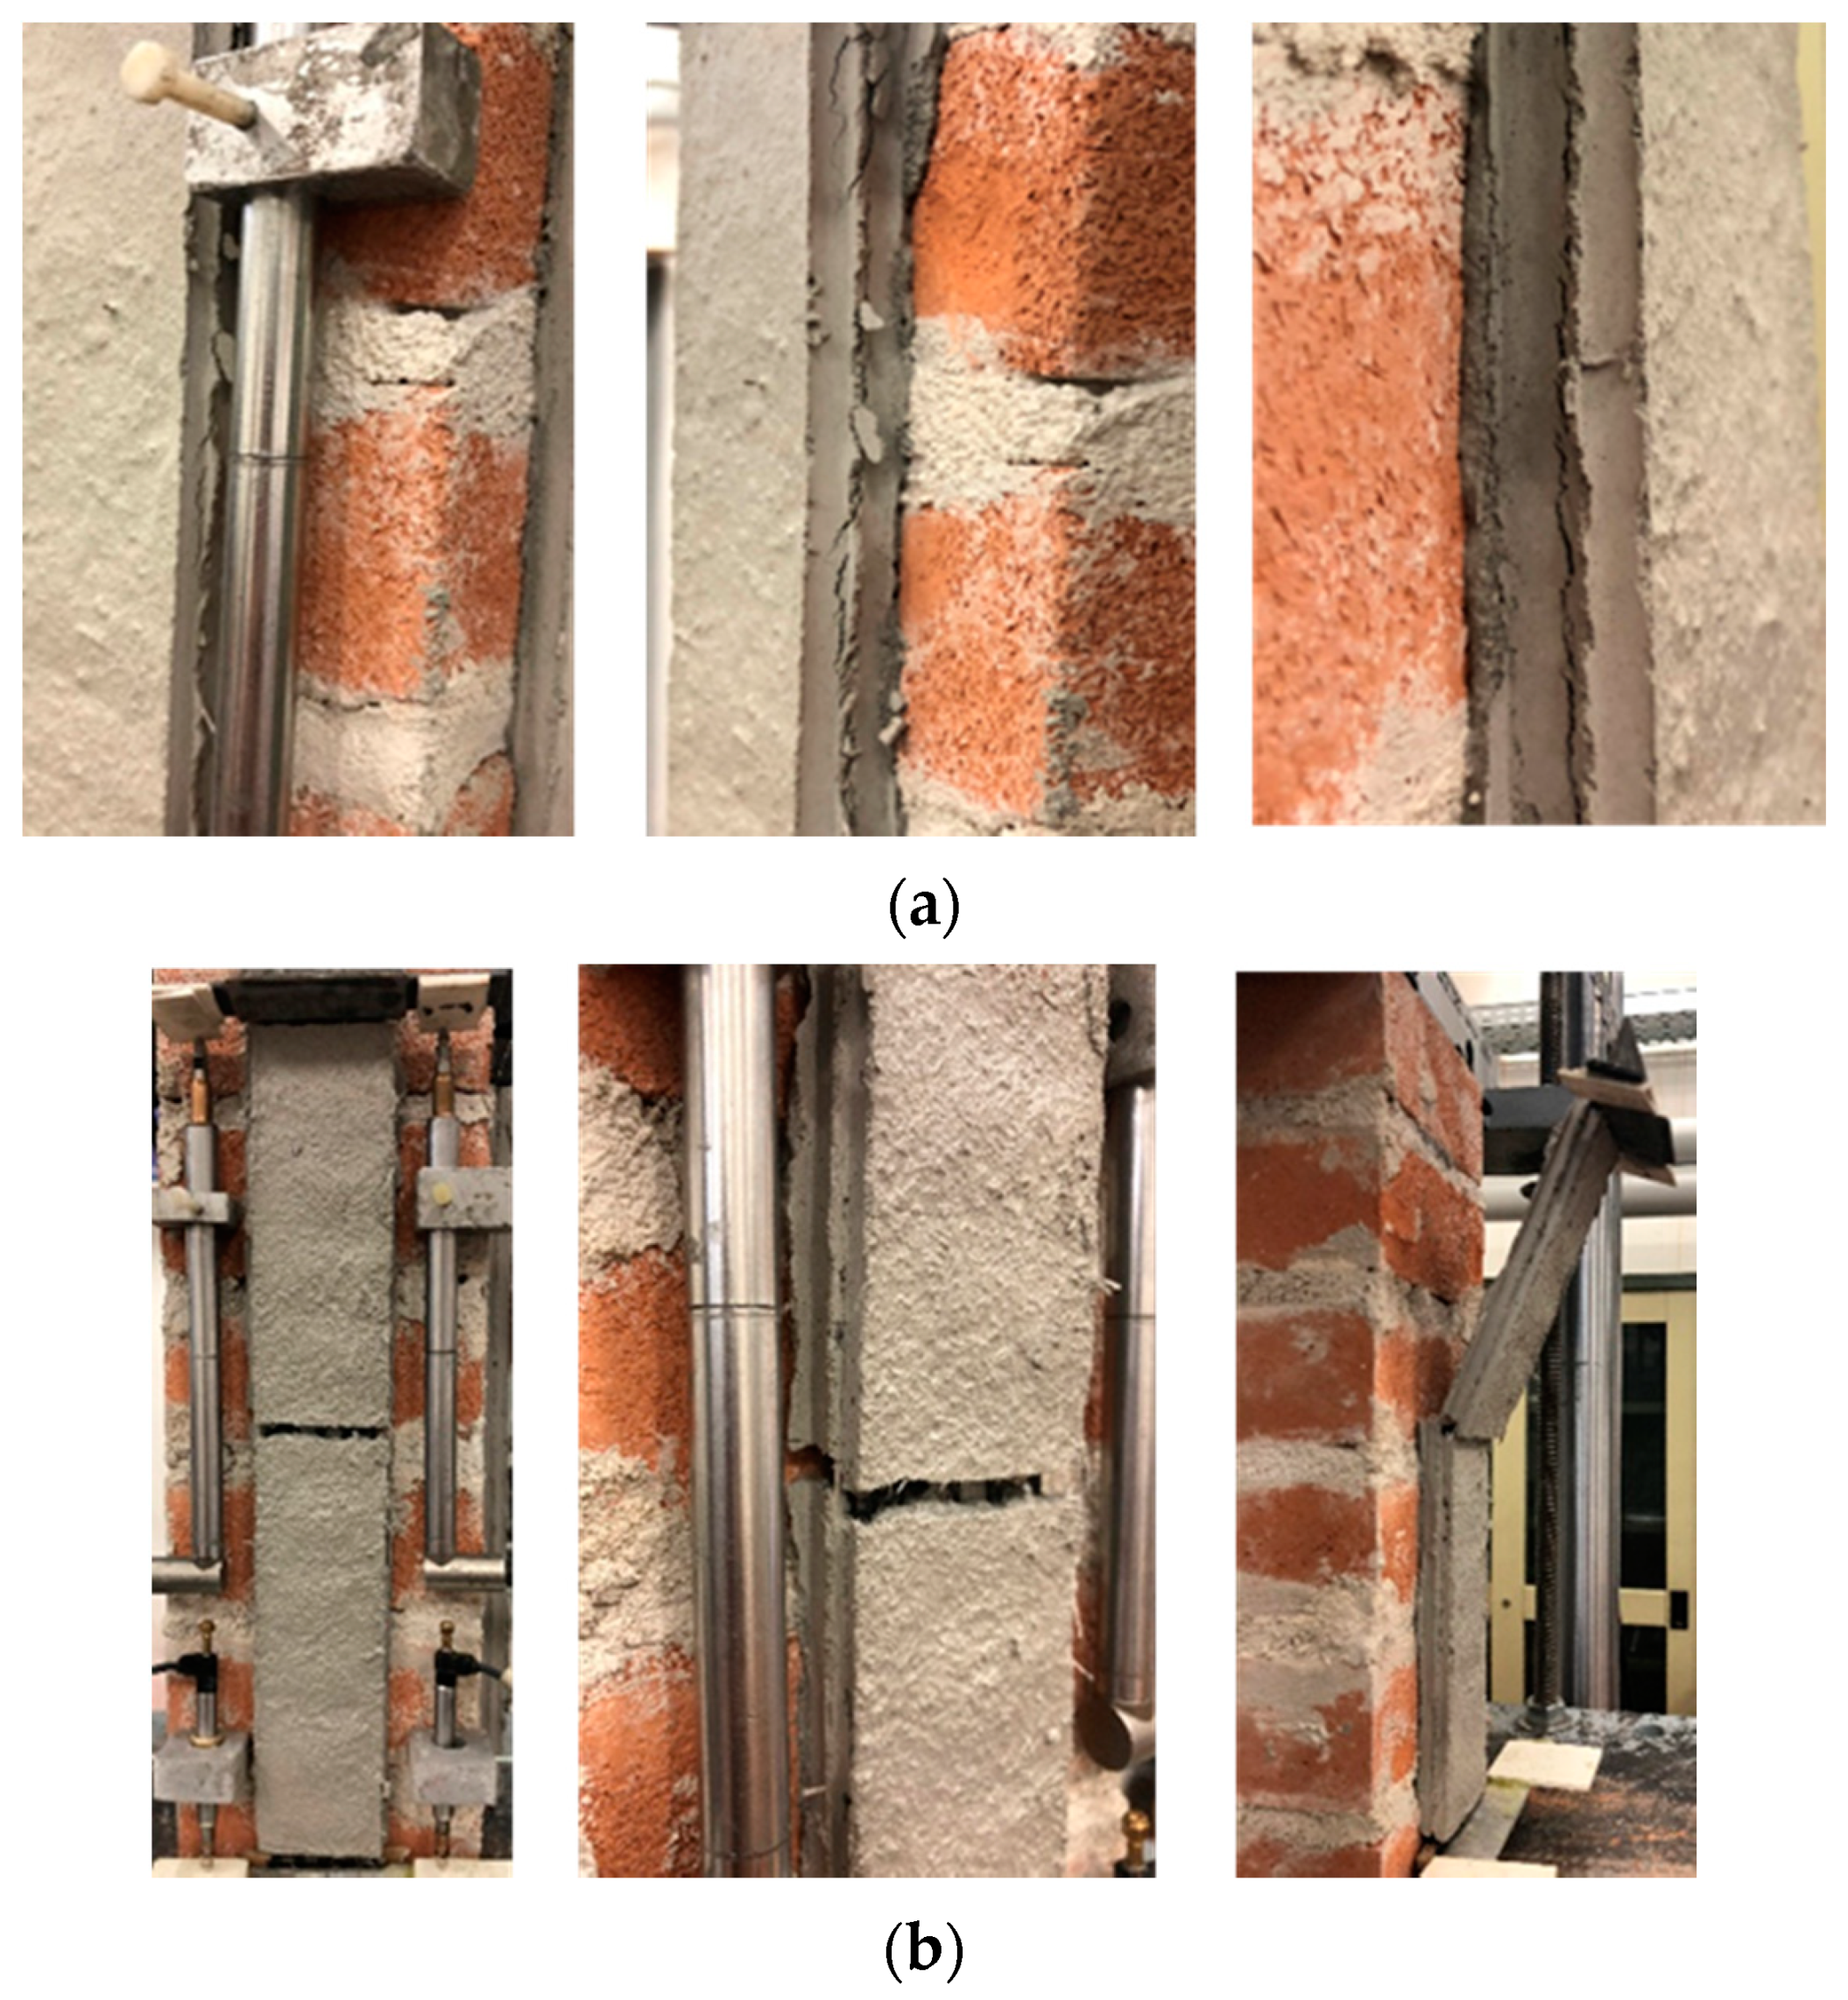
Two failure modes were observed in carbon FRCM-masonry joints. All specimens except DS_300_50_C_1 failed due to debonding at the matrix–fiber interface (Dmf). This failure mode was characterized by slippage of the textile yarns within the matrix without any visible crack on the matrix except for specimen DS_300_50_C_4, in which a longitudinal crack occurred between the internal and external layers of the matrix, as shown in Figure 4a. This crack is usually referred to as an interlaminar matrix crack [36]. Specimen DS_300_50_C_1 showed a mixed debonding failure at the matrix–substrate and at the matrix–fiber interfaces (MDmsDmf), as shown in Figure 4b. This type of failure was previously observed in SRG-masonry joints tested by Franzoni et al. [6].
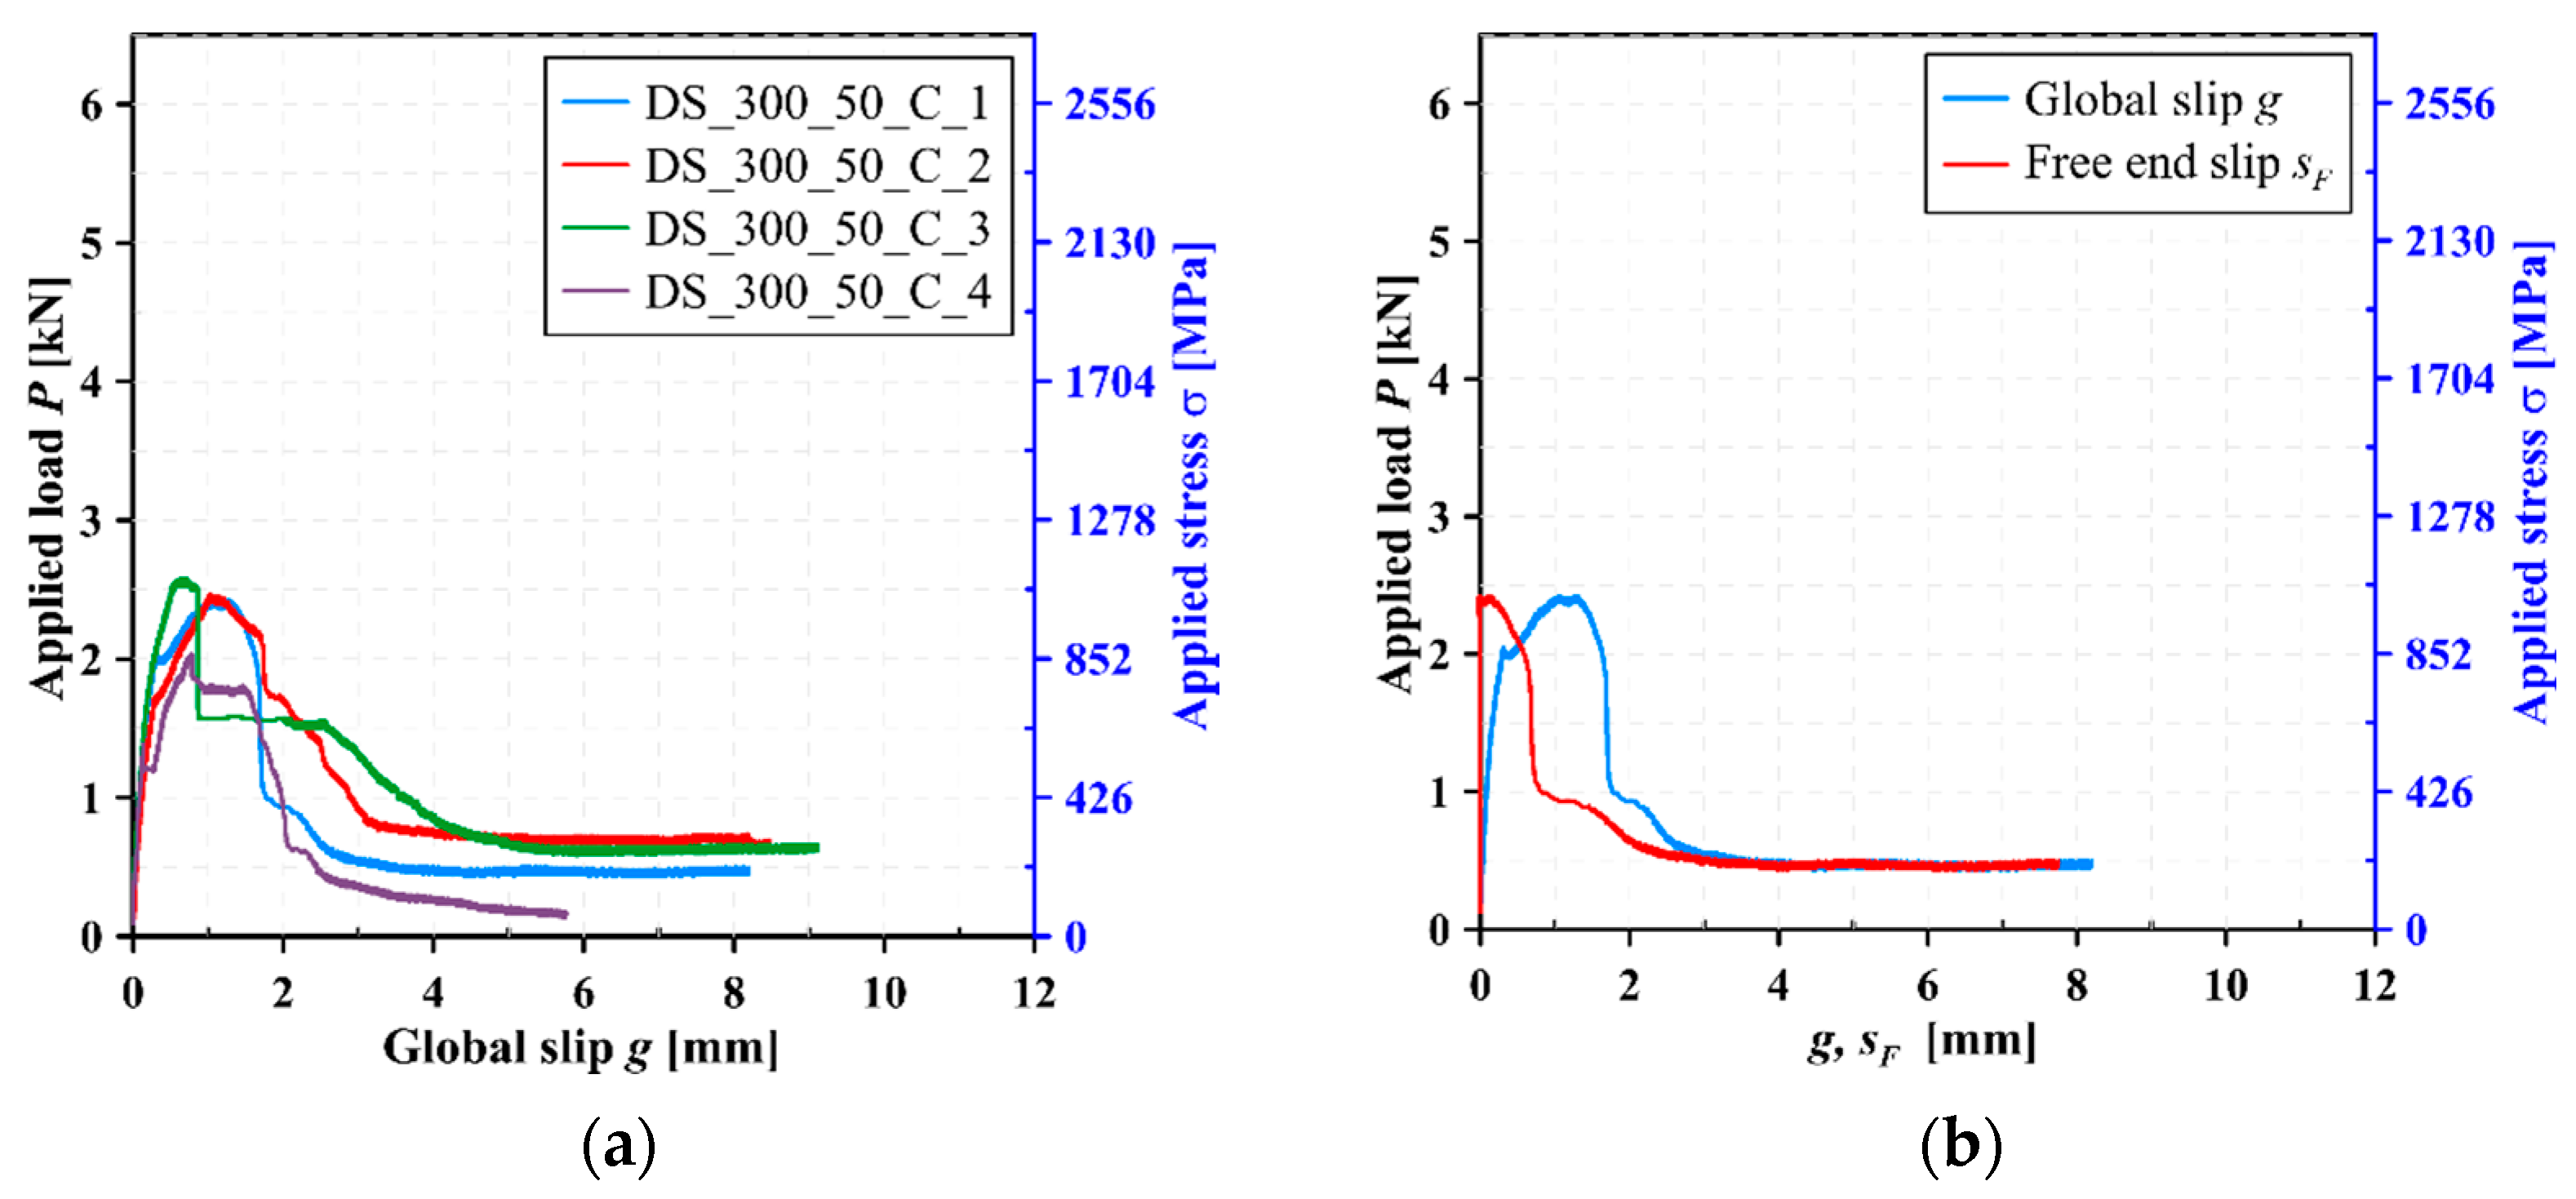
Figure 5a presents the applied load P—global slip g response of the carbon FRCM-masonry joint. Specimen DS_300_50_C_1 showed an initial linear P-g response (Figure 5a). At the end of the linear branch (approximately 81% of the peak load), a small load drop was observed due to the occurrence of a matrix transversal crack approximately at the middle of the composite bonded length (Figure 4b). After that, the upper part of the composite (i.e., close to the loaded end) debonded from the masonry substrate (Figure 4b), whereas the lower part remained bonded to it. With increasing g, the load increased further until the peak load P* was attained. At P*, the stress transfer zone (STZ), which is the zone along which the bond stress is transferred [21], had already attained the free end, as indicated by the non-zero values of sF (Figure 5b). A further increase of the global slip after P* led to a decrease of the applied load until complete matrix–fiber debonding in the lower portion of the strip still attached to the substrate, which was associated with a constant applied load due to friction (interlocking) among the fiber filaments and between fibers and the matrix [21,38].
The load response of specimens DS_300_50_C_2-4 resembled that of specimen DS_300_50_C_1. The initial linear behavior ended at approximately 70% of the peak load (Figure 5a), when micro-cracking started to occur at the matrix–fiber interface. Then, after the peak load was attained, the P-g curve showed a softening branch and a final residual applied load. For specimen DS_300_50_C_4, the applied load did not attain a constant value at the end of the test (Figure 5a). This behavior might be attributed to the occurrence of the matrix interlaminar crack in this specimen.

3.2. Bond Performance of PBO FRCM-Masonry Joints

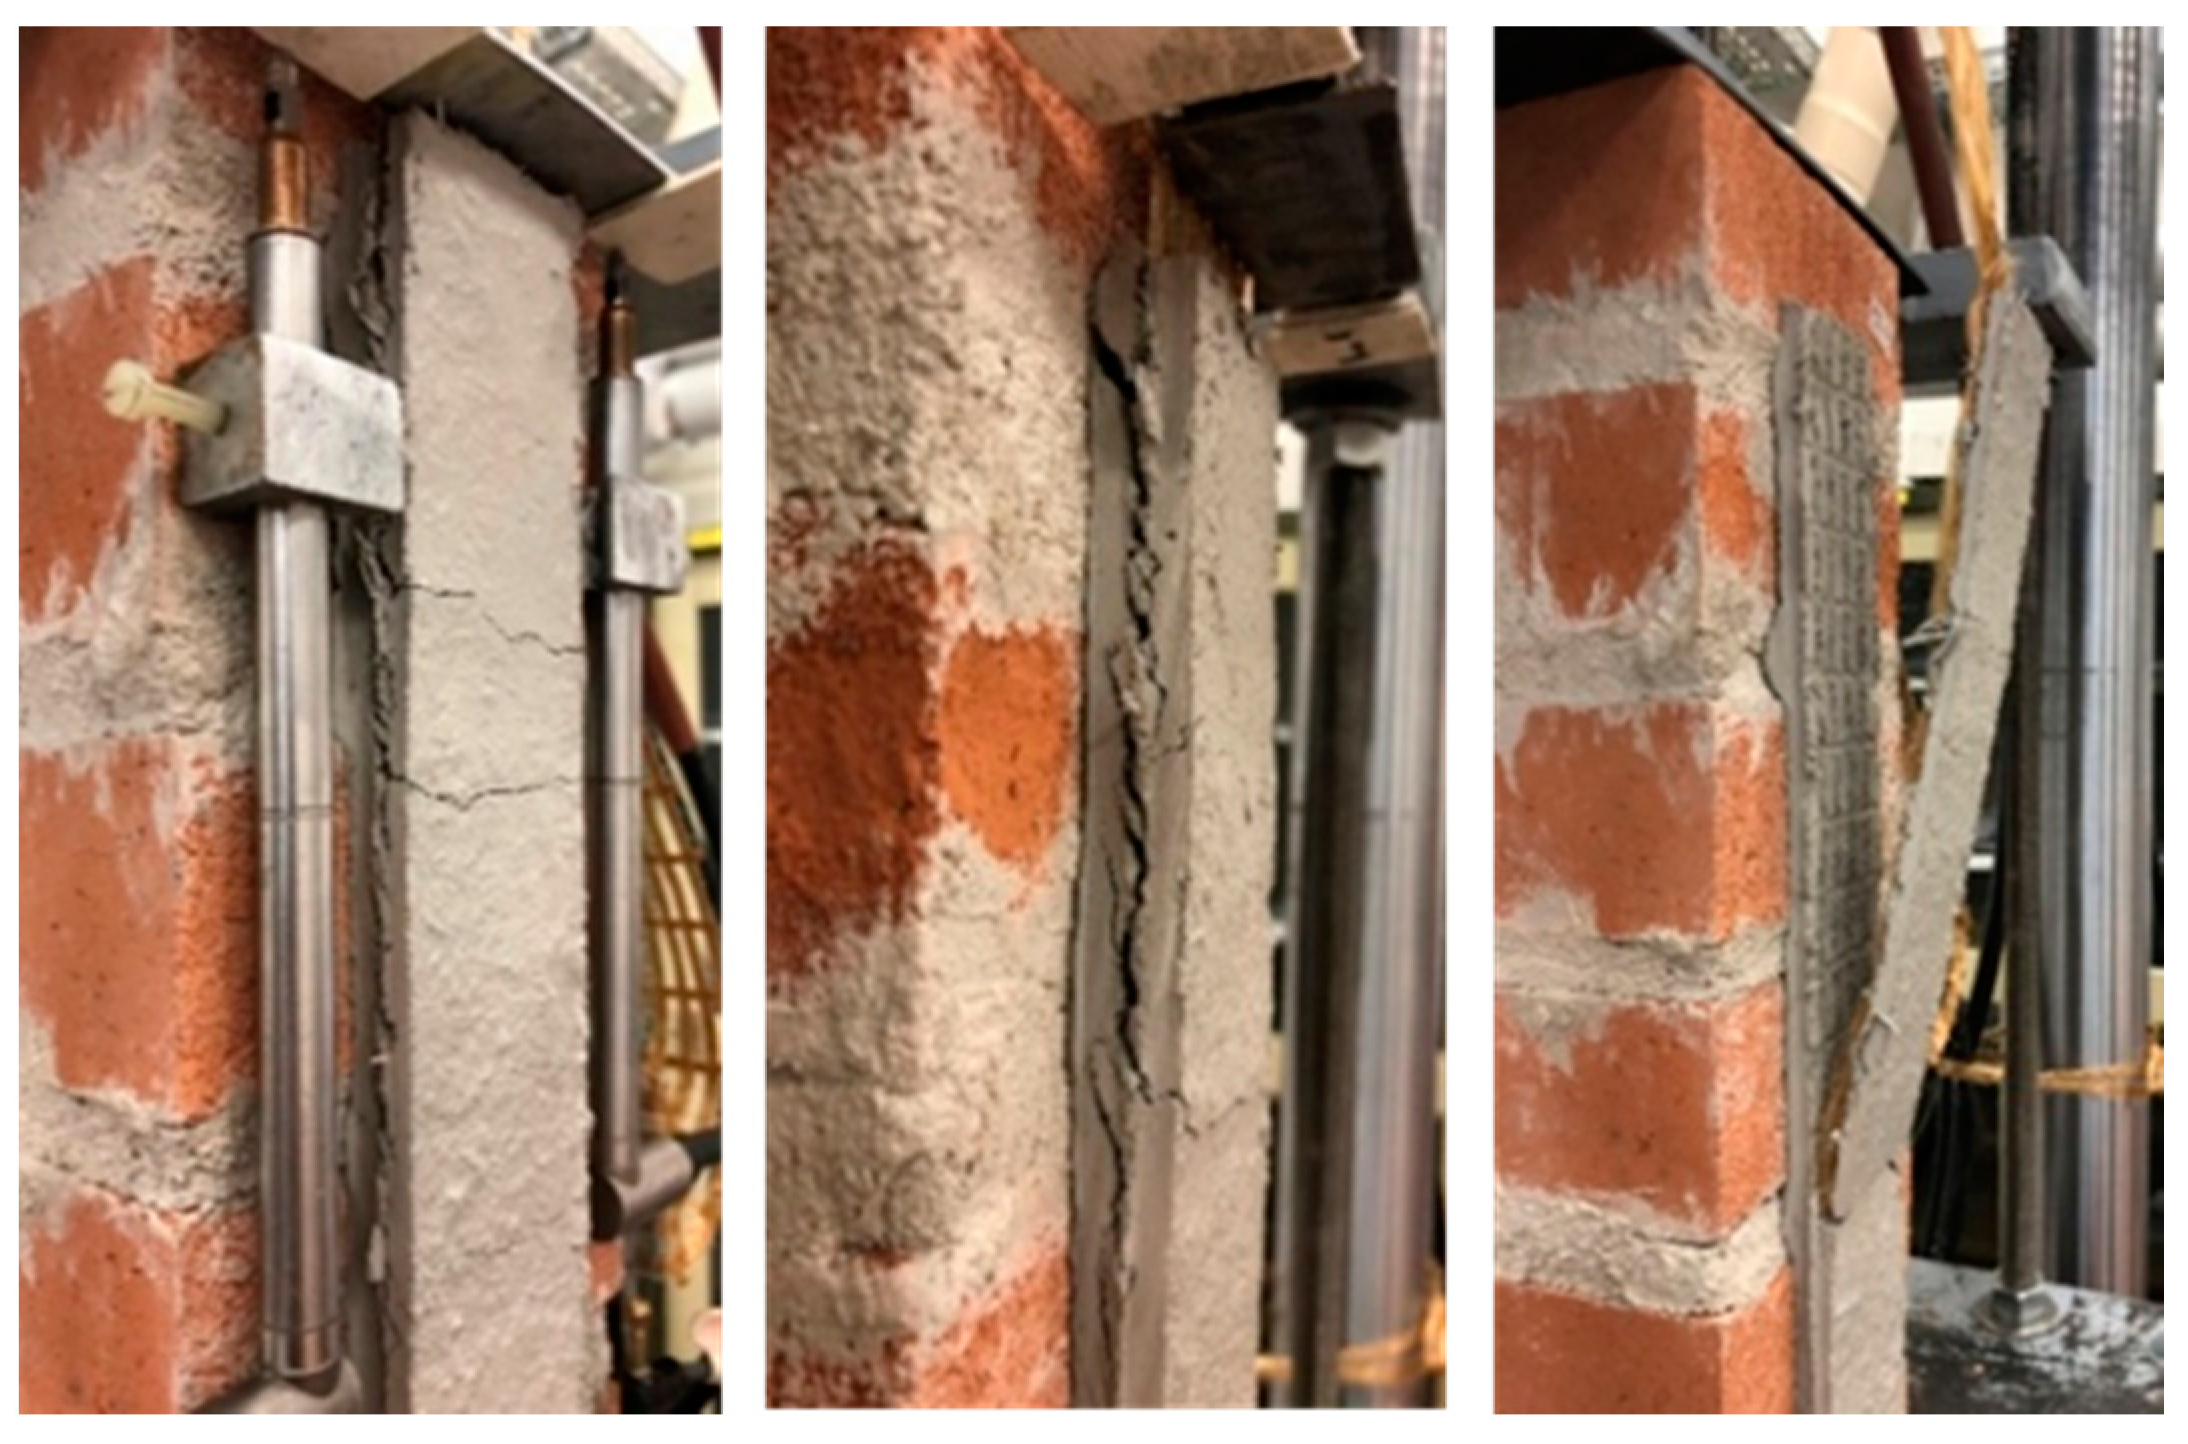
All specimens with PBO FRCM composite failed due to debonding at the matrix–fiber interface (Dmf), as generally reported in the literature for composites comprising PBO fibers [24,34]. The debonding, which determined the increasing slip of the fibers within the matrix, was characterized by the occurrence of several transversal cracks in the matrix external layer. These cracks eventually propagated toward the substrate and, except for specimen DS_300_50_P_2, determined the opening of a longitudinal crack at the internal–external matrix layer interface (matrix interlaminar crack), which in turn led to the detachment of the matrix external layer (Figure 6).
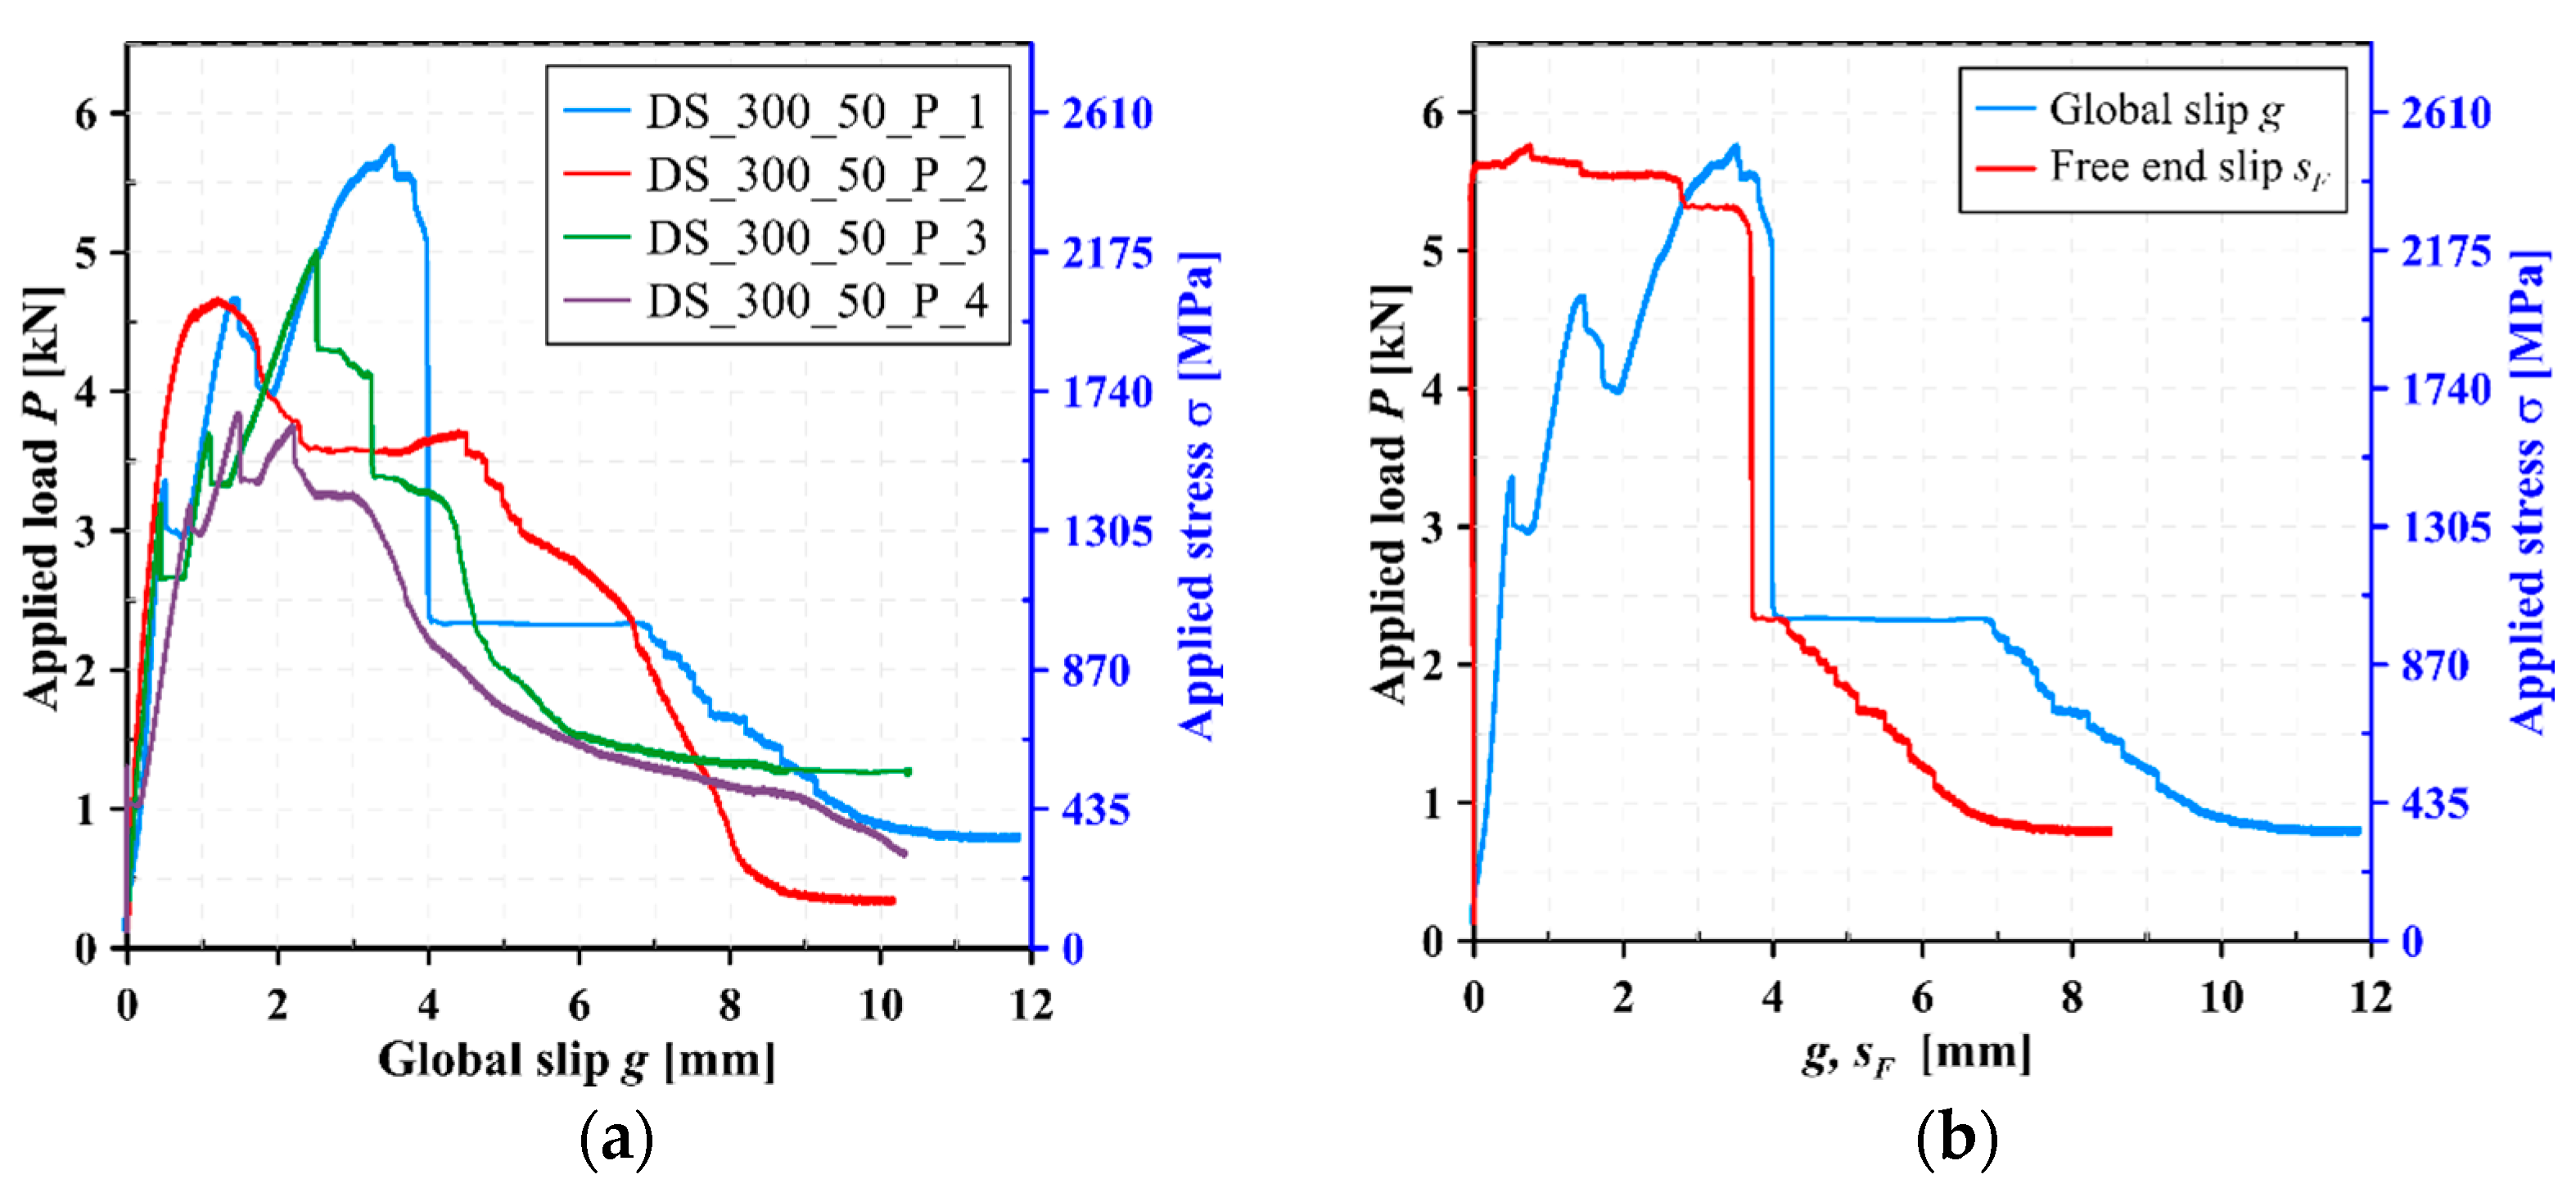
The P-g responses of specimens with the PBO FRCM composite are shown in Figure 7a. All specimens showed an initial linear elastic branch followed by a non-linear response up to the peak load. Then, the applied load decreased until the test was interrupted after complete debonding of the textile. Figure 7b shows that the free end slip sF started assuming non-zero values slightly before P* was attained, which indicates that the STZ attained the free end, as observed for carbon FRCM-masonry joints. After the initial elastic branch, all specimens except DS_300_50_P_2 showed sudden drops of the applied load associated with the opening of matrix transversal cracks (Figure 7).
At the end of the test, the applied load of specimen DS_300_50_P_4 did not show a constant residual applied stress, whereas the remaining specimens attained different constant applied load values. These differences can be attributed to the occurrence of the matrix transversal cracks.

3.3. Bond Performance of AR-Glass FRCM-Masonry Joints

Specimens with AR-glass FRCM composite failed due to debonding at the matrix–fiber interface followed by rupture of the textile yarns within the bonded length close to the loaded end (MDmfR), as shown in Figure 8.
The P-g responses are presented in Figure 9a. After the initial linear elastic branch, the slope of the P-g curves decreased due to micro-cracking at the matrix–fiber interface. The applied load increased with increasing g until a load drop occurred (Figure 9a). After this first load drop, which could be attributed to the rupture of some fiber filaments, the applied load decreased in all specimens except in specimen DS_300_50_G_4, and subsequent rupture of other fiber bundles determined further load drops until the test was interrupted. In specimen DS_300_50_G_4, a significant slope decrease was observed at approximately 1.6 kN (Figure 9), after which the applied load only slightly increased with increasing the global slip. This behavior can be attributed to slippage of the textile, which was followed by eventual rupture of some fiber bundles as observed by the load drops in the descending portion of the load response. These load drops might also be associated with failure of warp-weft yarn nodes, which were obtained with the leno wave technique in the AR-glass textile (Section 2). However, this could not be verified, because it was not possible to remove the external matrix layer without damaging the embedded textile.
For all specimens, non-zero values of the free end slip sF were observed slightly before the attainment of the peak load P*. sF increased with increasing g after P* (see e.g., Figure 9b), which indicates that debonding of the fiber from the matrix along the entire bonded length occurred. However, some textile yarns eventually ruptured for high values of g, which did not allow for measuring a reliable residual applied stress for all specimens.

3.4. Bond Performance of SRG-Masonry Joints

Specimens with SRG reported two different failure modes. Specimens DS_300_50_S_1 and 2 failed due to the sudden debonding of the entire composite strip at the matrix–substrate interface (Dms), as shown in Figure 10a. The remaining specimens (DS_300_50_S_3 and 4) reported mixed rupture of some steel cords at the loaded end and debonding at the matrix–fiber interface (MRDmf), as shown in Figure 10b.
The P-g responses of specimens with SRG are shown in Figure 11a. Two types of response were observed depending on the failure mode. When complete detachment of the composite strip occurred (specimens DS_300_50_S_1 and 2), the load response was approximately linear until the peak load, when failure occurred (Figure 11a). The slight non-linearity observed in the P-g curve can be attributed to micro-cracking at the matrix–fiber interface and consequent matrix–fiber debonding close to the loaded end, as also indicated by matrix transversal cracks (Figure 11a). However, complete debonding of the fiber from the matrix did not occurred, as confirmed by null free end slip for the entire test.
When fiber rupture occurred (specimens DS_300_50_S_3 and 4), the ascending part of the load responses resembled those of specimen DS_300_50_S_1 and 2. At the peak load, matrix–fiber debonding was fully developed and the STZ attained the free end, as confirmed by non-zero sF values in Figure 11b. The P-g descending branch was characterized by sudden load drops associated with rupture of one or more steel cords. Eventually, the remaining cords completely debonded from the embedding matrix and a residual applied load, attributed to the presence of friction at the matrix–fiber interface, was observed.

3.5. Comparison of the Bond Performance for the Various Composite Systems

In this section, the bond capacity of the different composites is analyzed to provide an indication on their performance. However, it should be noted that FRCM comprising different fibers and matrices should not be compared only in terms of their bond capacity or peak load per unit width. In fact, numerous parameters are considered when selecting a certain FRCM or SRG composite for a specific application. Among them, important parameters are the composite stiffness, strength, cost, compatibility with the substrate, and textile layout (unidirectional, bidirectional, and multidirectional).
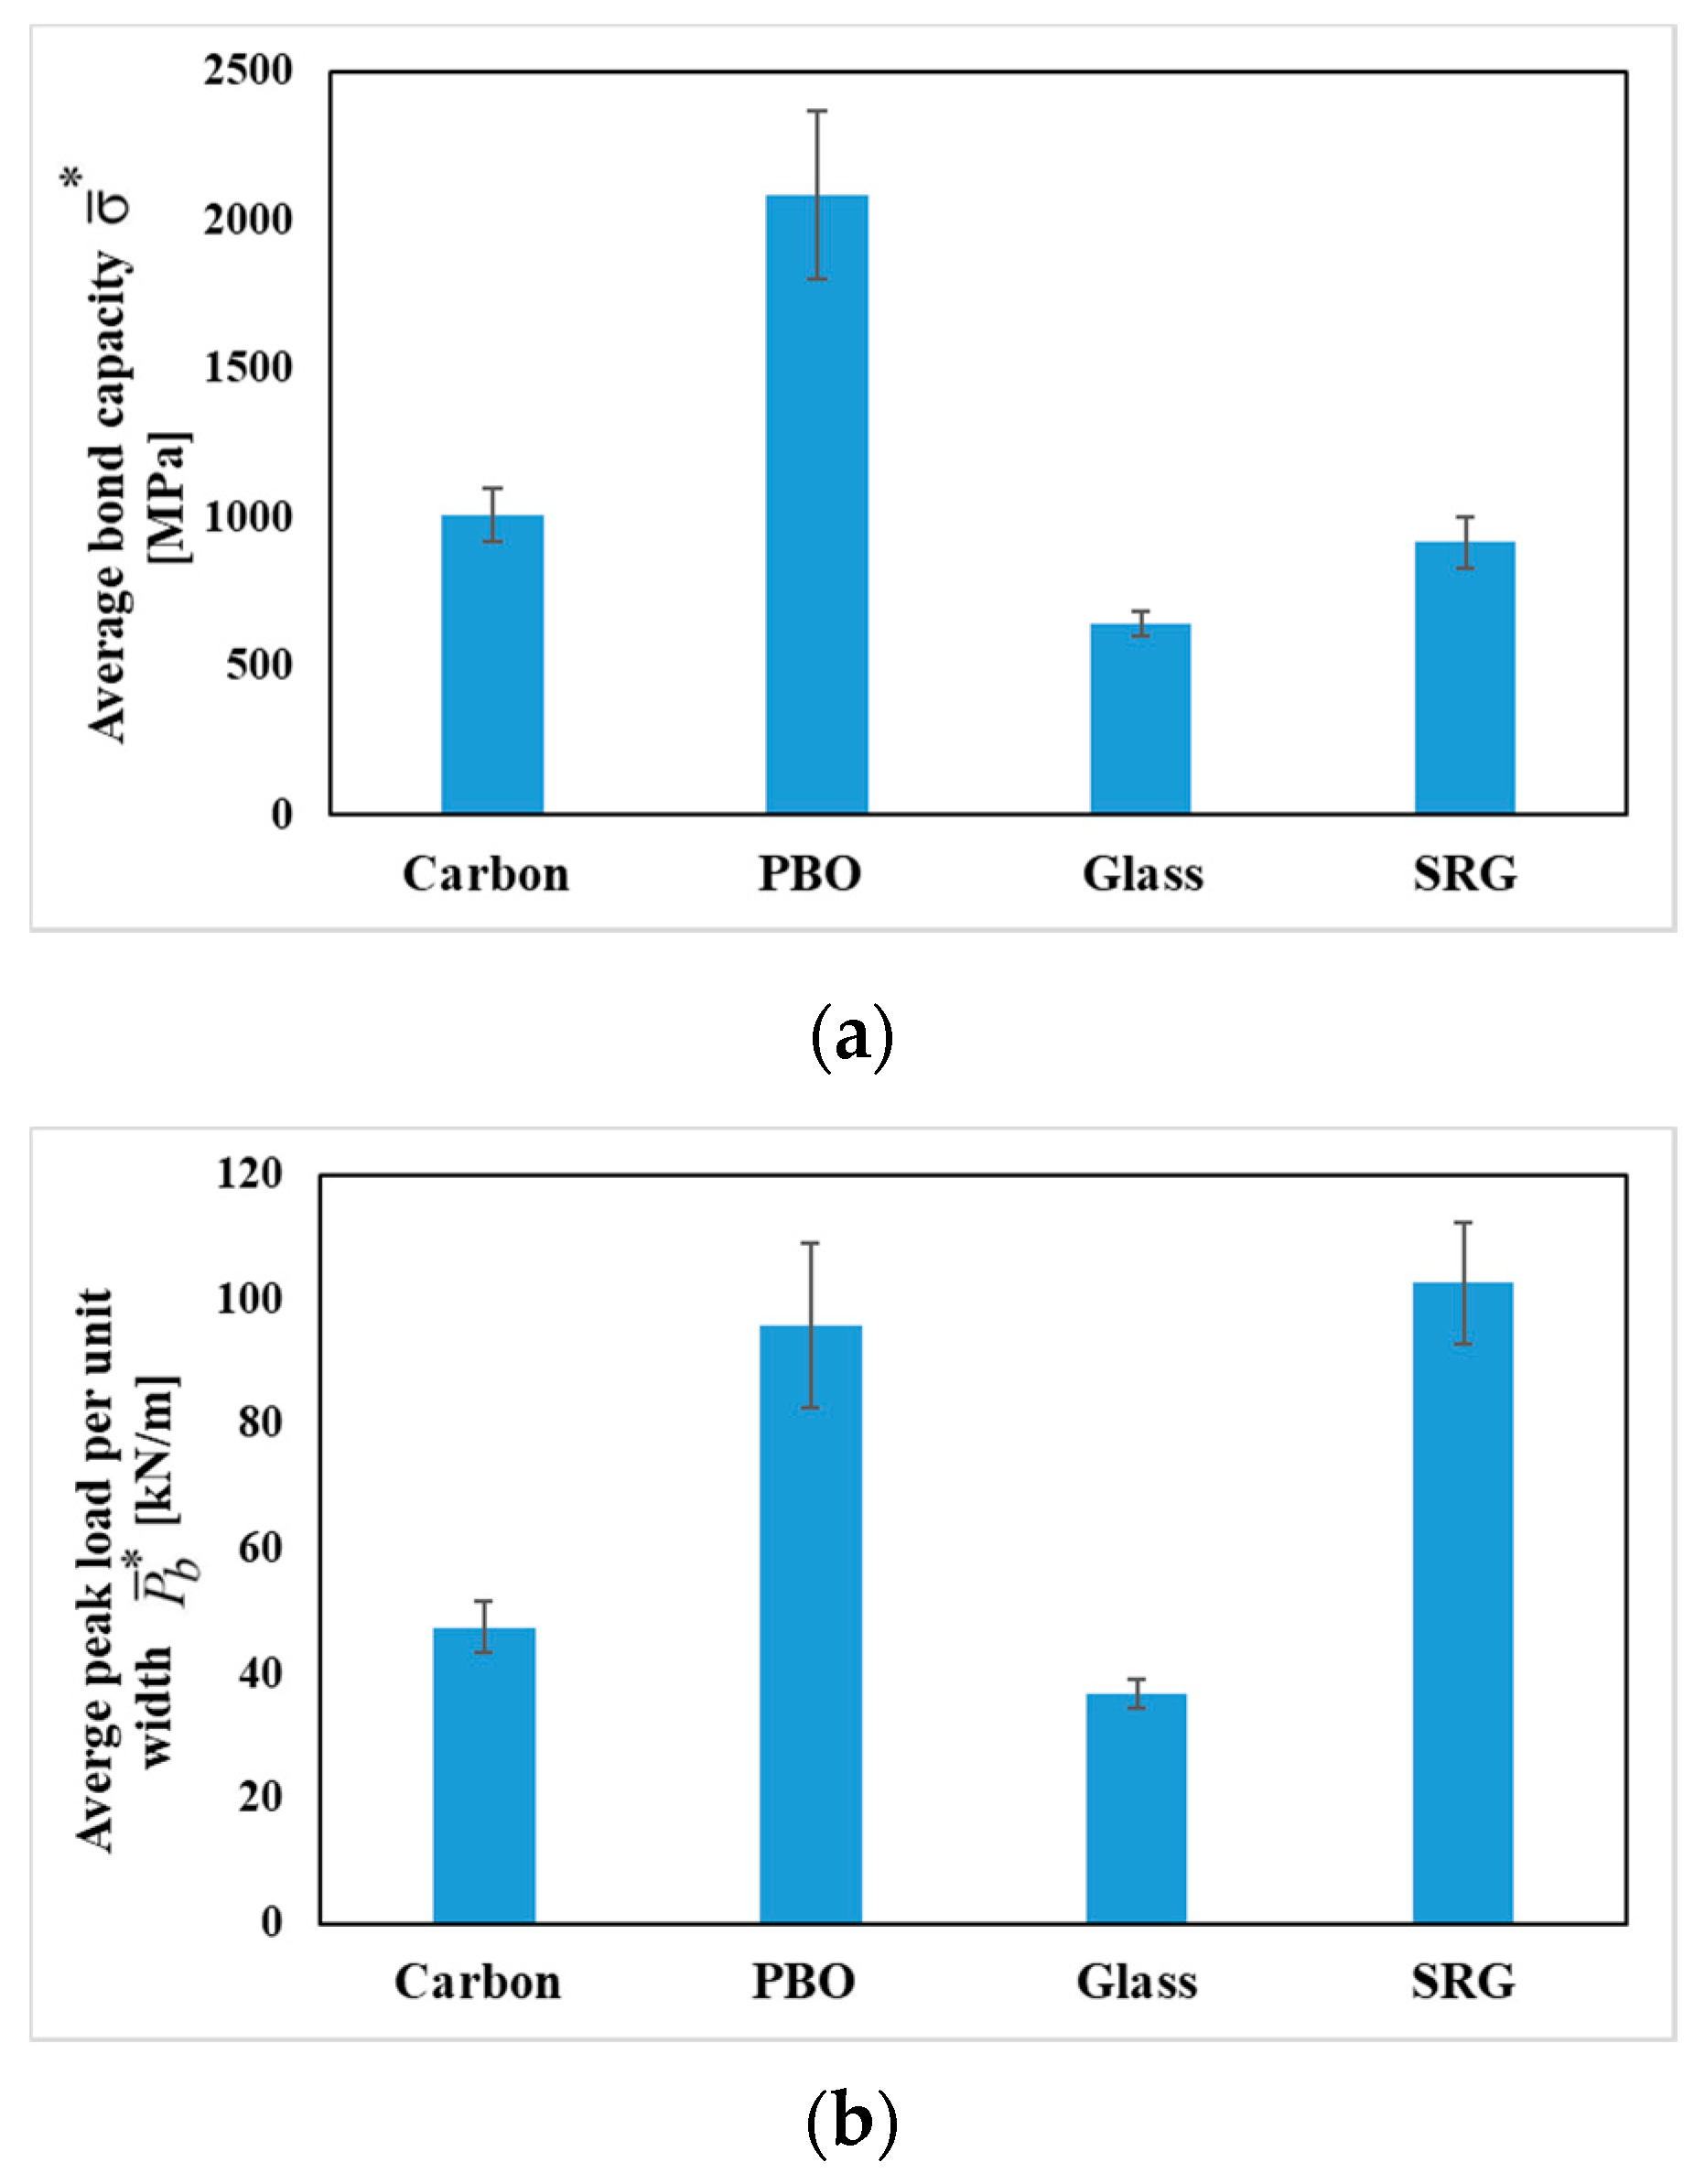
Figure 12a compares the average bond capacity of the FRCM and SRG composites in Table 2, along with the corresponding standard deviation (indicated with error bars). The average bond capacity σ ¯ * (see Equation (1)) ranged between 636 MPa for the AR-glass FRCM and 2109 MPa for the PBO FRCM (Table 2). The coefficient of variation (CoV) varied between 6.4% (AR-glass FRCM) and 13.7% (PBO FRCM). This value (scatter) can be considered acceptable given the sensitivity of FRCM and SRG composites to the manufacturing, curing, and handling [22]. In order to compare the composite capacity, the capacity (peak load) per unit width can be considered. Figure 12b compares the average peak load per unit width P ¯ b * listed in Table 2, along with the corresponding standard deviation (again indicated with error bars). The peak load per unit width ranges between 37 kN/m for the AR-glass composite and 103 kN/m for the SRG (Table 2). Clearly, the different cross-sectional area of each textile determined a completely different peak load per unit width.
Finally, the comparison of results in Figure 12a and the tensile strength of bare textiles in Table 1 shows that the exploitation ratio (i.e., the ratio between the average bond capacity and the textile tensile strength) is significantly less than 1.0 for all composites. The highest value is achieved by the AR-glass (0.74), while the lowest value is provided by the SRG (<0.46). Carbon and PBO have an exploitation ratio equal to 0.57 and 0.69, respectively.

4. Analytical Study

In this section, the results described in Section 3 are modeled using the analytical approach developed in [39]. In particular, a trilinear cohesive material law (CML), which relates the slip s and corresponding shear stress τ at the interface where slip occurs, is adopted to describe the bond behavior of FRCM-masonry joints. To properly calibrate the CML, a P-g response associated with debonding at the matrix–fiber or matrix–substrate interface should be used. Therefore, the analytical approach is employed to model the response of the carbon and PBO FRCM, for which failure due to debonding at the matrix–fiber interface occurred. In fact, the glass FRCM and the SRG showed fibers rupture and mixed mode failures. Although a calibration of the CML would be possible in any case, further tests with different bonded lengths should be carried out to clearly understand the effect of fiber rupture and mixed mode failure and obtain a reliable calibration of the CML for the glass FRCM and the SRG employed.
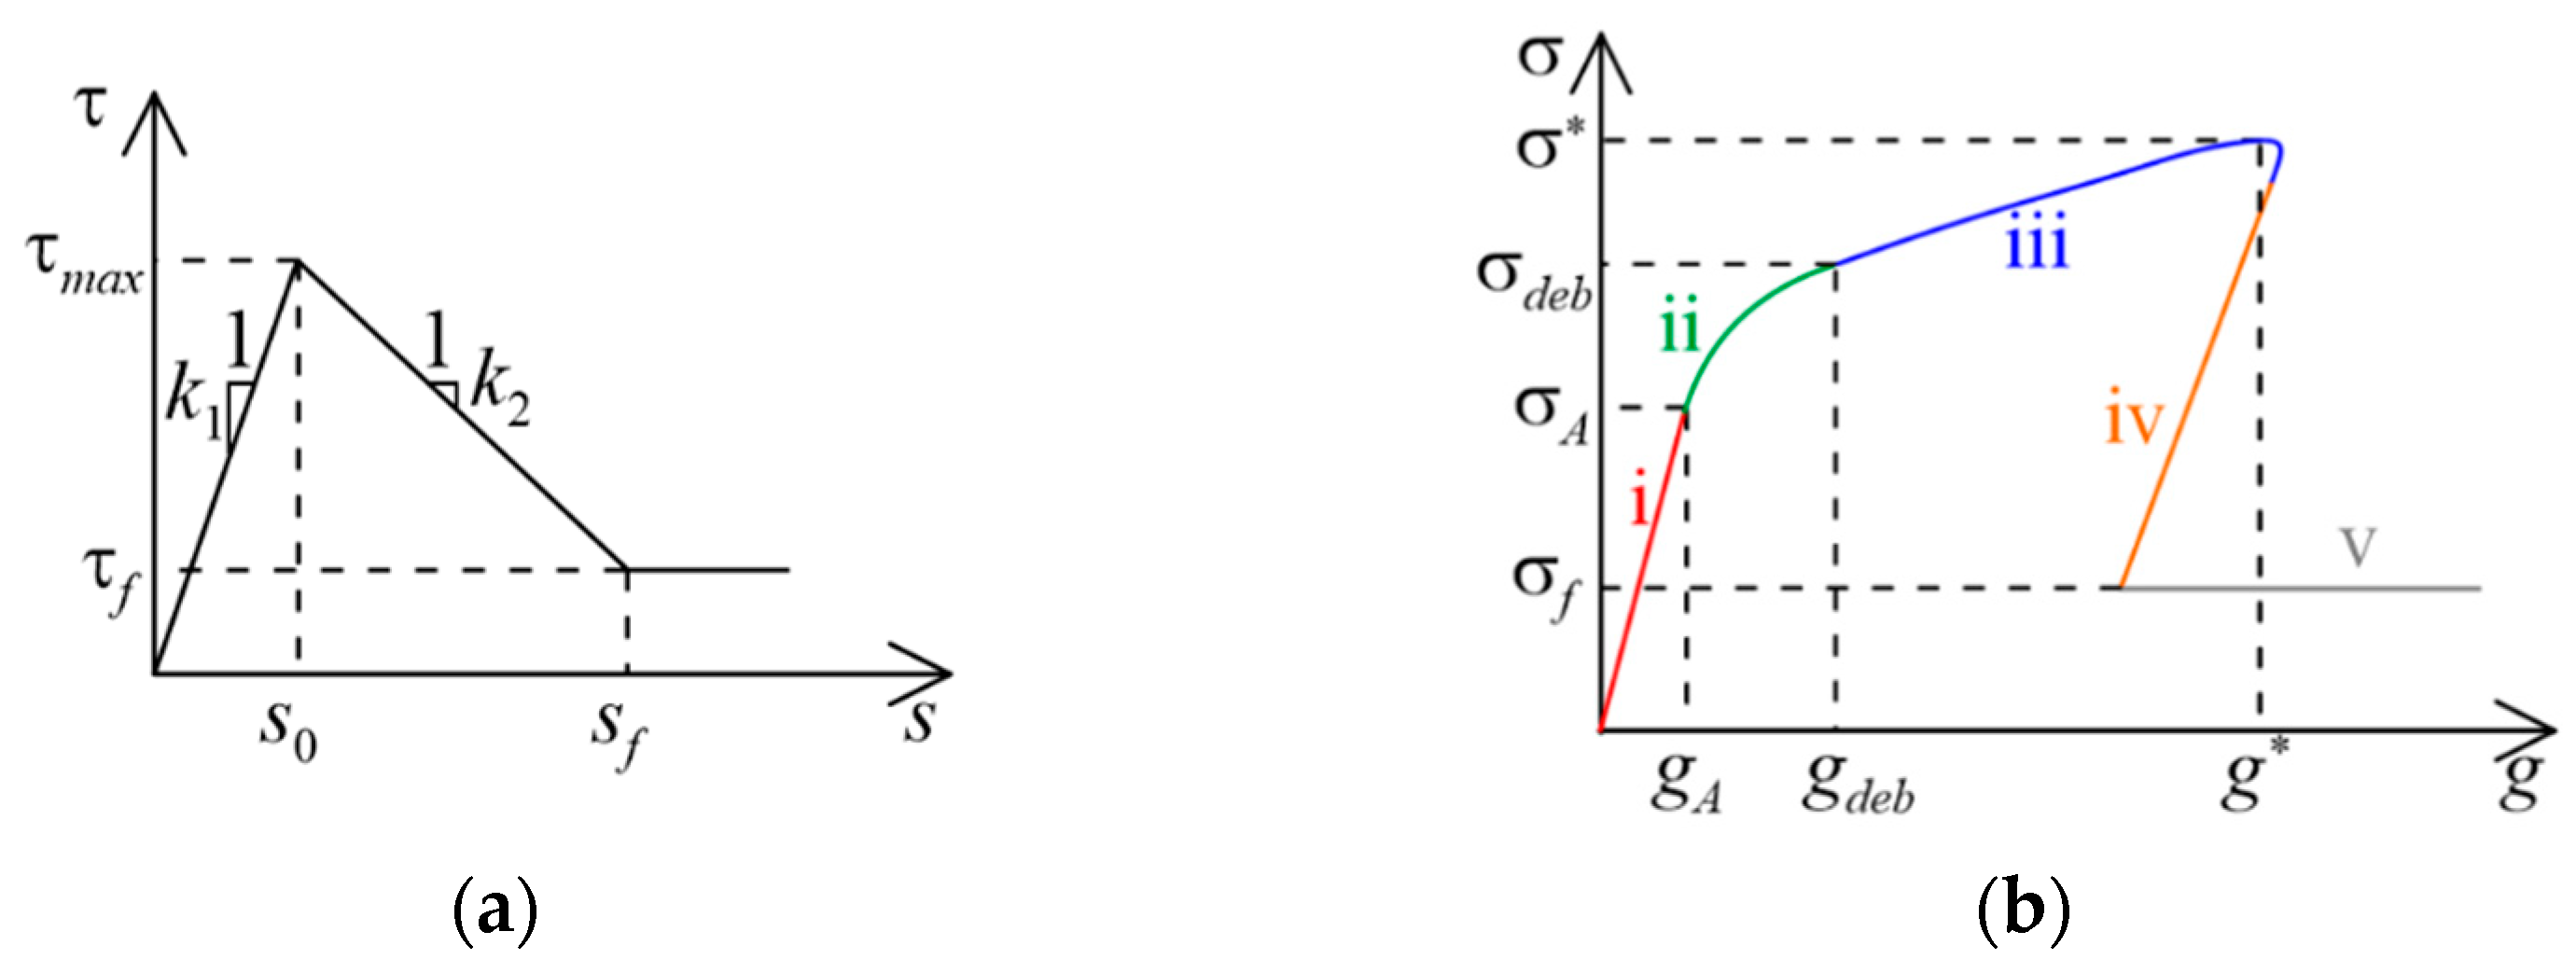
The trilinear CML (Figure 13a) is comprised of an elastic branch followed by a linear softening branch and a final horizontal friction branch. The elastic branch has slope k1 and ends when the maximum interface strength τmax is attained (or equivalently when the slip s0 is achieved). The softening branch has slope k2 and ends when the shear stress attains τf (or equivalently when the slip achieves sf). A trilinear CML was employed to study the bond behavior of PBO–concrete joints and allowed for an accurate modeling of the corresponding load response [39]. Simpler CML were also employed (e.g., bilinear elasto-fragile [40] or rigid-softening [41]). Although these CML can be easily calibrated, their simple shape entails for less accurate load responses with respect to those obtained with a trilinear CML.

4.1. Governing Equations

To obtain the governing equations of the problem, we assume pure Mode-II loading condition at the matrix–fiber interface, negligible deformation of the matrix and substrate, no composite width effect, and linear elastic behavior of the textile [21,42]. The carbon and PBO textiles adopted in this study were assumed to have yarns with a rectangular cross-section with a width b* much larger than the corresponding thickness t* (i.e., p ≅ 2b*, where p is the matrix–fiber contact perimeter of a single yarn). Namely, b*= 5 mm for both textiles, t* = 0.094 mm for the carbon textile, and t* = 0.092 mm for the PBO textile (Table 1). Considering the assumptions above, the bond differential equation that describes the shear τ(y) and slip s(y) distribution at the matrix–fiber interface [39] is:
d 2 s d y 2 2 E f t * τ = 0
where Ef is the textile Young’s modulus (see Section 2) and y is the coordinate along the bonded length with the origin of the reference system located at the composite free end (i.e., y = 0 at the free end, y = at the loaded end). Solving Equation (2) with a certain CML and enforcing appropriate boundary conditions [39] provides the interface shear stress τ(y), fiber axial strain ε(y) (or equivalently fiber applied stress σ(y) = Efε(y)), and slip s(y) for each point of the load response.
Considering an FRCM-masonry joint with a (relatively) long bonded length, i.e., a bonded length higher than the minimum length needed to fully establish the bond stress transfer mechanism (i.e., the effective bond length leff [43]), the load response can be divided in five stages (Figure 13b): (i) elastic, (ii) elastic-softening, (iii) elastic-softening debonding, (iv) softening-debonding, and (v) fully debonded stage. The solutions of Equation (2) for each of these stages are reported in Table 3.
In the first stage (i), the interface response is elastic along the whole bonded length. The fiber applied stress σ() and the global slip s() at the loaded end at the end of this stage are named σA and gA, respectively. As the shear stress at the loaded end overcomes τmax and starts decreasing according to the softening behavior of the CML, the response becomes non-linear, and stage (ii) (elastic-softening stage) begins. During this stage, a portion of interface of length l is associated with the softening branch while the remaining portion of length -l is associated with the elastic branch of the CML. The fiber applied stress at the end of this phase is the debonding stress σdeb. In stage (iii) (elastic-softening debonding stage), a portion of the interface of length d is debonded but still capable to provide an applied stress at the loaded end equal to 2τfd/t*. The remaining part of the interface is associated with the elastic-softening stage, where l is the length of the portion associated with the CML softening branch and -l-d is that associated with the CML elastic branch. In stage (iv) (softening-debonding stage), no portion of the interface is associated with the CML elastic branch, the length of the debonded portion is d, and the remaining portion with length -d is associated with the CML softening branch. The fiber applied stress at the end of this phase is due to friction only and is equal to the friction stress σf = 2τf/t*. Finally, in the last stage (v), the entire interface is debonded, and the fiber axialstress is constant and equal to σf while the global slip increases.

4.2. Evaluation of the Effective Bond Length

Since the bond stress transfer mechanism is associated with the elastic-softening stage (ii), the effective bond length leff can be computed by equating the loaded end slip in stage (ii) (see Table 3) to sf:
l e f f = l + 1 λ arctan [ λ ω sin ( ω l ) ( cos ( ω l ) τ f / τ m a x ) ] .
Since the adopted CML requires an infinite bonded length to fully develop the elastic stage [44], l (i.e., the length of the softening portion) can be evaluated by enforcing an applied stress for = leff equal to a certain fraction α of the applied stress associated with an infinite bonded length [39,45,46]:
l = 2 ω arctan [ α ω / ξ ( τ f / τ m a x ) 2 + ( α ω / ξ ) 2 1 τ f / τ m a x + 1 ]
where:
ξ = ω 1 + ω 2 / λ 2 .

4.3. Estimation of the CML Parameters

To fully define the trilinear CML, which is characterized by four of the parameters s0, τmax, sf, τf, k1, k2, and the area below the elastic-softening branch (i.e., the fracture energy GF = 0.5[sfmax + τf) − τfs0], see Figure 13a), four conditions are needed [39]. Among the possible strategies to define these conditions, in this paper, the parameters of the CMLs were calibrated by enforcing (see Figure 13b) the applied stress σA and corresponding global slip gA at the end of the elastic stage (i), the debonding stress σdeb, and the friction stress σf (Figure 13b). The average of these parameters identified on load responses in Figure 5 and Figure 7 allowed for calibrating the CML for the carbon and PBO FRCM, respectively. The shear stresses τmax and τf and corresponding slips s0 and sf obtained for the two CMLs are reported in Table 4.
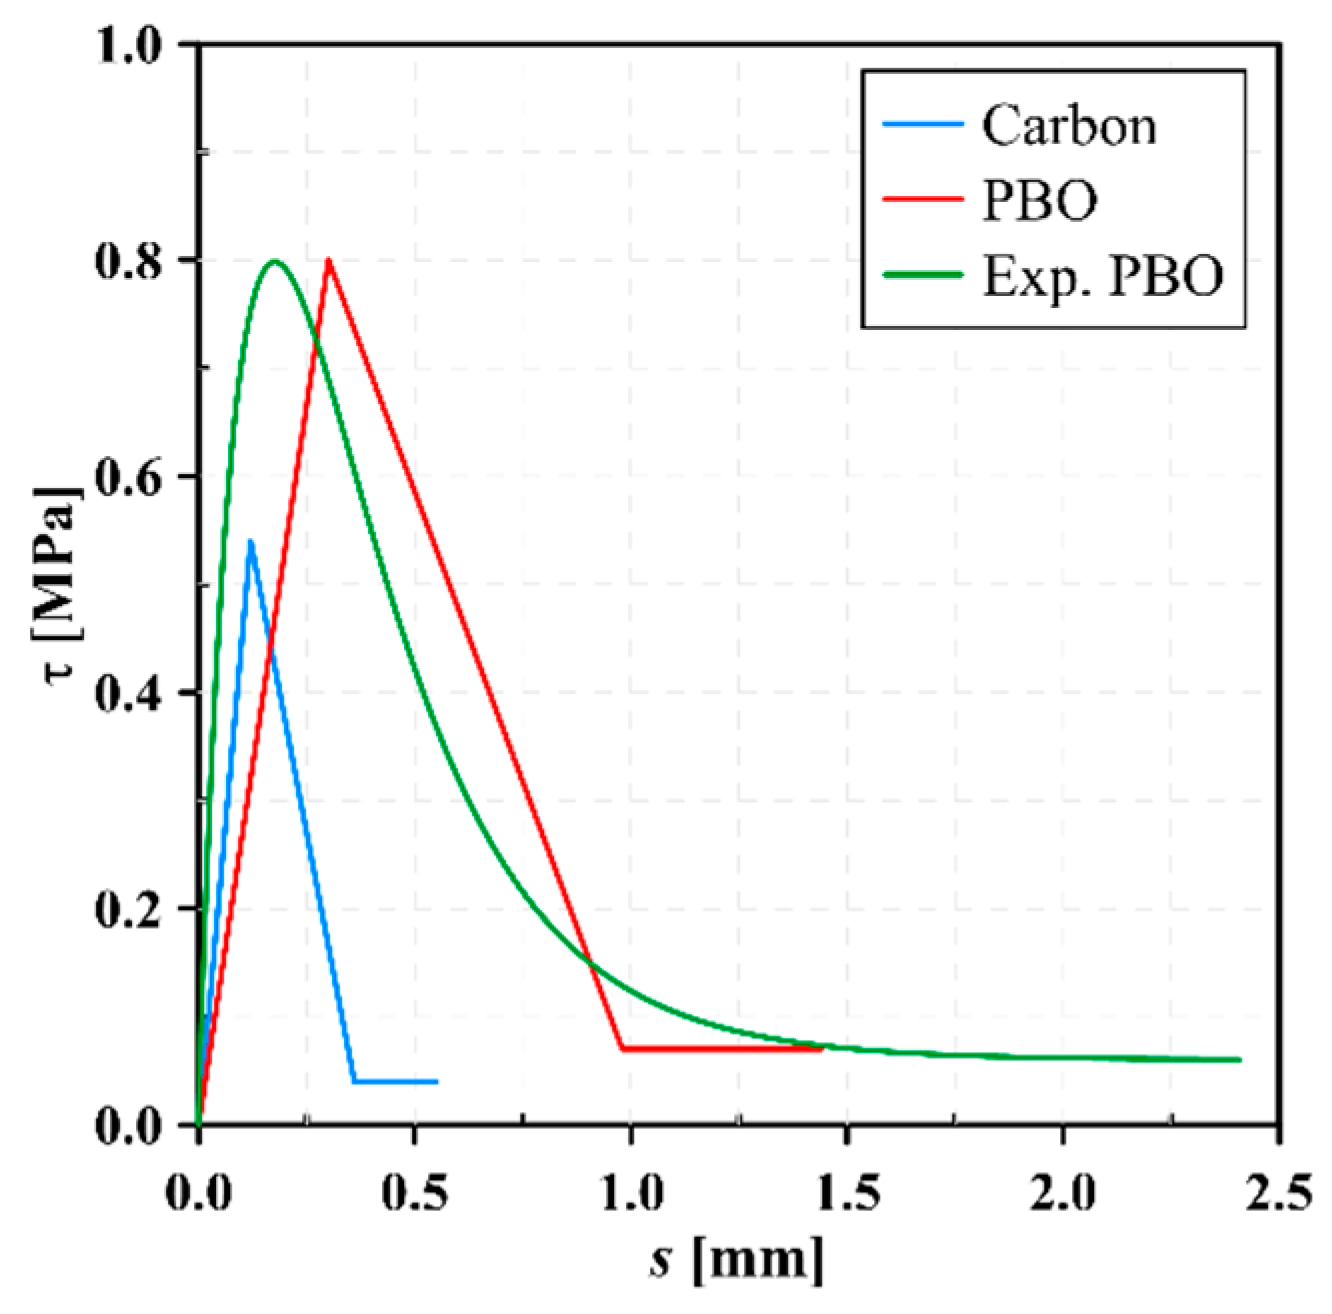
The CMLs are depicted in Figure 14, where the non-linear CML measured on FRCM-concrete joints with the same PBO textile using strain gauges attached to the fibers in [21] is also provided for comparison.
Figure 14 shows that the CML calibrated for the PBO FRCM and that measured on PBO FRCM-concrete joints [21] with the same textile are similar, although the matrix employed in this study and that in [21] were different. The matrix employed for the FRCM strips in [21] was specifically design to be applied on concrete substrates and had an average compressive strength fc = 28.4 MPa, whereas that employed in this paper was designed for masonry substrates and had fc = 25 MPa (Table 1). The limited differences in the PBO CMLs depicted in Figure 14 indicate that the calibration strategy adopted was effective in catching the main features of the matrix–fiber CML and that the matrix strength did not play a fundamental role in the definition of the CML.
The carbon CML showed a maximum shear stress and corresponding slip significantly lower than those of PBO CML (Figure 14). Moreover, the debonding of carbon fibers occurred at a slip sf = 0.36 mm, which is smaller than that associated with PBO fiber debonding (sf = 0.98 mm). Therefore, the fracture energy GF of the carbon CML is approximately 25% of that of the PBO CML, which entails for a debonding stress σdeb of the carbon FRCM equal to 50% of that of a corresponding PBO FRCM with the same geometrical properties [38].
The effective bond length leff and the length of portion associated with softening l for the carbon and PBO FRCM were computed with Equations (3) and (4), respectively, assuming α = 0.99 [39]. The results obtained, provided in Table 4, show that although the CML were significantly different, the effective bond lengths obtained for carbon (leff = 176 mm) and PBO (leff = 206 mm) FRCM have a difference of approximately 15% (a similar consideration can be made regarding the softening length l). However, previous results showed that the determination of the effective bond length of FRCM composites considering results from a single bonded length may provide misleading results [39]. Therefore, further studies are needed to confirm the values of leff found in this work.

4.4. Simulation of the Load Response

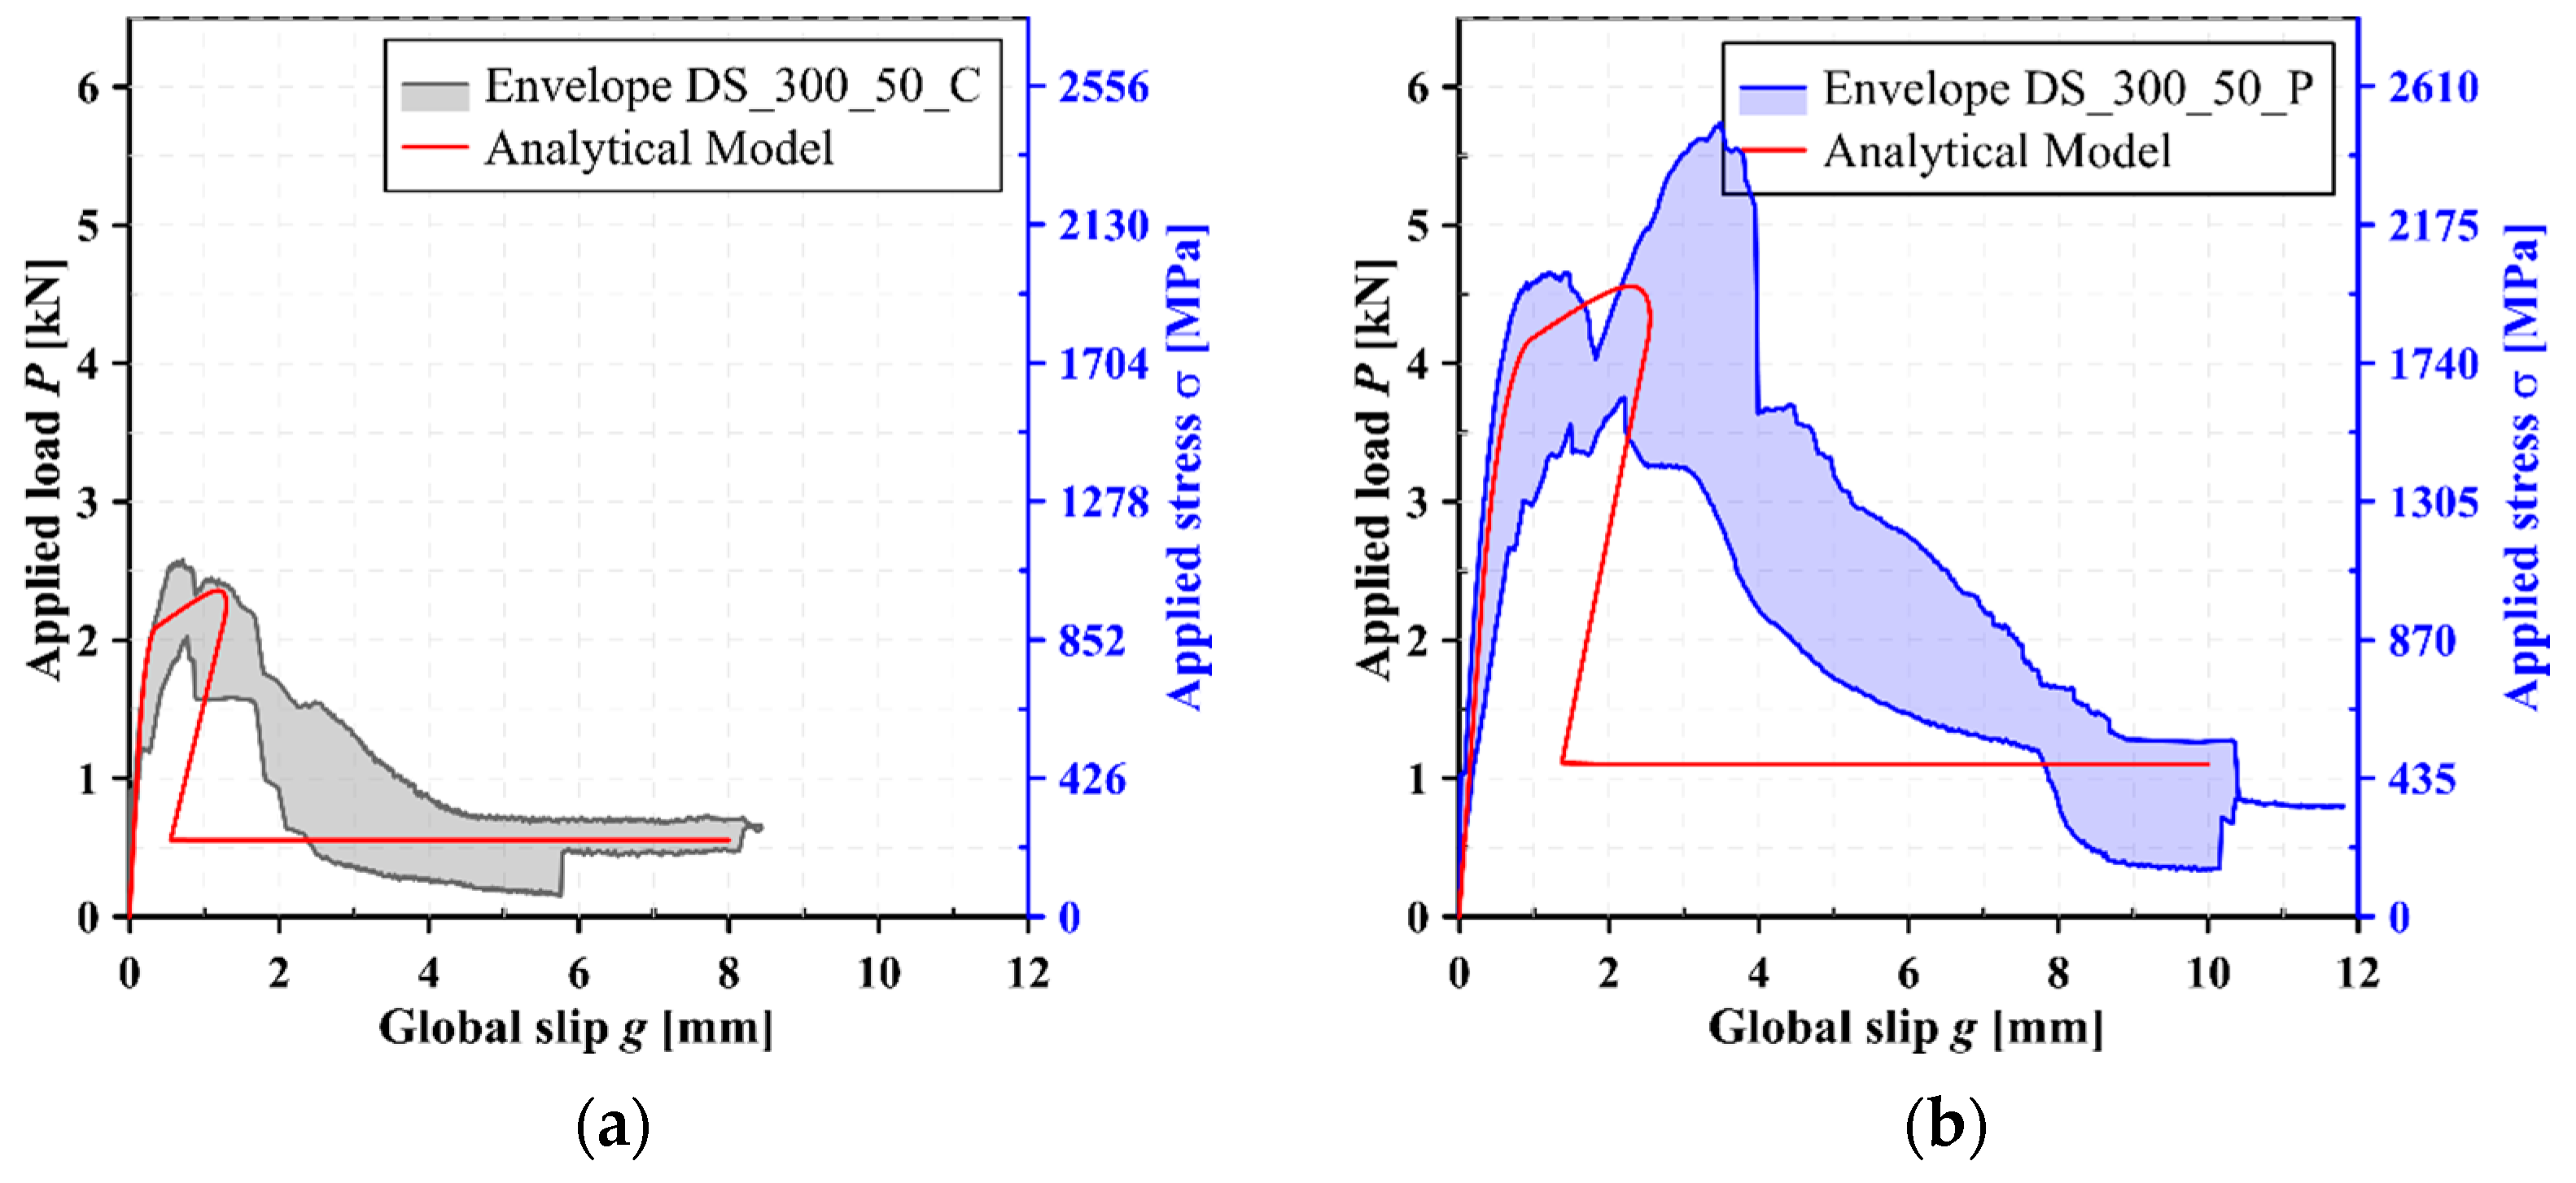
Once the CML is known, the load response can be constructed according to the equations in Table 3. The load responses obtained using the calibrated CMLs are depicted in Figure 15, where the envelope of the experimental load responses (see Figure 5 and Figure 7) are also reported for comparison. Despite the experimental results showed a significant scatter, as often observed in the literature [6,21,24], the analytical load responses matched well the experimental envelope curves up to the peak load. The analytical post-peak behavior was characterized by the presence of snap-back, whereas the global slip continued to increase during the experimental softening stage. This difference is caused by the experimental test control mode, which enforced a monotonical increase of global slip during the entire tests. Further details regarding the occurrence of snap-back in analytical and experimental FRP–substrate and FRCM–substrate joints can be found in [41,47].

5. Conclusions

The bond behavior of three types of FRCM composites and one SRG composite applied onto a masonry substrate was investigated in this paper. The FRCM composites comprised a carbon, PBO, or AR-glass textile and two types of cement-based matrices, whereas the SRG composite comprised a unidirectional stainless-steel cord textile embedded within a lime-based matrix. Sixteen single-lap direct shear tests, four for each composite type, were carried out.
The results showed different failure modes, even for the same composite. Debonding at the matrix–fiber interface occurred in all composites, although it was associated with other failure modes sometimes, such as debonding at the matrix–substrate interface (observed in carbon FRCM and SRG) and fiber rupture (observed in AR-glass FRCM and SRG). Depending on the composite, matrix transversal and longitudinal cracks were also observed, which were responsible for matrix–substrate failure and interlaminar matrix failure, respectively.
The applied load–global slip responses observed always showed an initial linear branch followed by a non-linear behavior up to the peak load. The carbon and PBO FRCM composites showed the presence of friction among the fiber filaments and between fibers and matrix, which was responsible for an increase of the applied load after the onset of debonding. For the AR-glass FRCM, it was not possible to clearly recognize the contribution of friction due to the occurrence of fiber subsequent rupture. Depending on the failure mode, specimens showed a load response softening branch (see e.g., carbon and PBO FRCM) or sudden decreases of the applied load due to fiber rupture (see e.g., AR-glass FRCM) or debonding at the matrix–substrate interface (see e.g., SRG composite).
The results obtained for carbon and PBO FRCM were modeled using an analytical approach based on the solution of the bond differential equation using a trilinear cohesive material law. The analytical and experimental load responses agreed well up to the peak load, whereas differences were observed in the descending branch due to the presence of a snap-back in the analytical response.

Author Contributions

Conceptualization, K.A.-L., and T.D.; experimental program, T.D. and K.A.-L.; analytical study, T.D., and P.C.; investigation, K.A.-L. and T.D.; writing—original draft, K.A.-L.; writing—draft review, T.D.; writing—editing T.D. and P.C. All authors have read and agreed to the published version of the manuscript.

Funding

This research received no external funding.

Data Availability Statement

The data presented in this study are available on request from the corresponding author. The data are not publicly available because part of an ongoing research.

Acknowledgments

This research was performed with the support of the Laboratorio Prove Materiali of the Politecnico di Milano.

Conflicts of Interest

The authors declare no conflict of interest.

References

  1. Abid, S.R.; Al-lami, K. Critical review of strength and durability of concrete beams externally bonded with FRP. Cogent Eng. 2018, 5. [Google Scholar] [CrossRef]
  2. Al-Lami, K.; Colombi, P.; D’Antino, T. Influence of hygrothermal ageing on the mechanical properties of CFRP-concrete joints and of their components. Compos. Struct. 2020, 238, 111947. [Google Scholar] [CrossRef]
  3. Heshmati, M.; Haghani, R.; Al-Emrani, M. Environmental durability of adhesively bonded FRP/steel joints in civil engineering applications: State of the art. Compos. Part B Eng. 2015, 81, 259–275. [Google Scholar] [CrossRef]
  4. Maljaee, H.; Ghiassi, B.; Lourenço, P.B.; Oliveira, D.V. FRP-brick masonry bond degradation under hygrothermal conditions. Compos. Struct. 2016, 147, 143–154. [Google Scholar] [CrossRef]
  5. Bencardino, F.; Condello, A.; Ashour, A.F. Single-lap shear bond tests on Steel Reinforced Geopolymeric Matrix-concrete joints. Compos. Part B Eng. 2017, 110, 62–71. [Google Scholar] [CrossRef] [Green Version]
  6. Franzoni, E.; Gentilini, C.; Santandrea, M.; Carloni, C. Effects of rising damp and salt crystallization cycles in FRCM-masonry interfacial debonding: Towards an accelerated laboratory test method. Constr. Build. Mater. 2018, 175, 225–238. [Google Scholar] [CrossRef]
  7. Carozzi, F.G.; Bellini, A.; D’Antino, T.; de Felice, G.; Focacci, F.; Hojdys, Ł.; Laghi, L.; Lanoye, E.; Micelli, F.; Panizza, M.; et al. Experimental investigation of tensile and bond properties of Carbon-FRCM composites for strengthening masonry elements. Compos. Part B Eng. 2017, 128, 100–119. [Google Scholar] [CrossRef]
  8. Koutas, L.N.; Tetta, Z.; Bournas, D.A.; Triantafillou, T.C. Strengthening of Concrete Structures with Textile Reinforced Mortars: State-of-the-Art Review. J. Compos. Constr. 2019, 23, 1–20. [Google Scholar] [CrossRef]
  9. ACI. 549.4R-20 Guide to Design and Construction of Externally Bonded Fabric-Reinforced Cementitious Matrix and Steel-Reinforced Grout Systems for Repair and Strengthening of Concrete Structures; American Concrete Institute: Farmington Hills, MI, USA, 2013. [Google Scholar]
  10. CNR. CNR-DT 215/2018 Guide for the Design and Construction of Externally Bonded FRP Systems for Strengthening Existing Structures; National Research Council: Rome, Italy, 2018; Available online: https://www.cnr.it/en/node/12827 (accessed on 7 January 2021).
  11. CSLLPP. Linea Guida per la Identificazione, la Qualificazione ed il Controllo di Accettazione di Compositi Fibrorinforzati a Matrice Inorganica (FRCM) da Utilizzarsi per il Consolidamento Strutturale di Costruzioni Esistenti; Consiglio Superiore dei Lavori Pubblici: Rome, Italy, 2018; Available online: https://www.ruregold.com/wp-content/uploads/2019/01/linee-guida-frcm-2018.pdf (accessed on 7 January 2021). (In Italian)
  12. Ombres, L.; Verre, S. Flexural Strengthening of RC Beams with Steel-Reinforced Grout: Experimental and Numerical Investigation. J. Compos. Constr. 2019, 23, 04019035. [Google Scholar] [CrossRef]
  13. De Santis, S. Bond behaviour of Steel Reinforced Grout for the extrados strengthening of masonry vaults. Constr. Build. Mater. 2017, 150, 367–382. [Google Scholar] [CrossRef]
  14. Marcari, G.; Basili, M.; Vestroni, F. Experimental investigation of tuff masonry panels reinforced with surface bonded basalt textile-reinforced mortar. Compos. Part B Eng. 2017, 108, 131–142. [Google Scholar] [CrossRef]
  15. Caggegi, C.; Carozzi, F.G.; De Santis, S.; Fabbrocino, F.; Focacci, F.; Hojdys, Ł.; Lanoye, E.; Zuccarino, L. Experimental analysis on tensile and bond properties of PBO and aramid fabric reinforced cementitious matrix for strengthening masonry structures. Compos. Part B Eng. 2017, 127, 175–195. [Google Scholar] [CrossRef]
  16. D’Ambrisi, A.; Focacci, F.; Luciano, R.; Alecci, V.; De Stefano, M. Carbon-FRCM materials for structural upgrade of masonry arch road bridges. Compos. Part B Eng. 2015, 75, 355–366. [Google Scholar] [CrossRef]
  17. Arboleda, D. Fabric Reinforced Cementitious Matrix (FRCM) Composites for Infrastructure Strengthening and Rehabilitation: Characterization Methods. Ph.D. Thesis, University of Miami, Coral Gables, FL, USA, 2014; pp. 1–131. [Google Scholar]
  18. D’Antino, T.; Carozzi, F.G.; Colombi, P.; Poggi, C. Out-of-plane maximum resisting bending moment of masonry walls strengthened with FRCM composites. Compos. Struct. 2018, 202, 881–896. [Google Scholar] [CrossRef]
  19. Nobili, A. Durability assessment of impregnated Glass Fabric Reinforced Cementitious Matrix (GFRCM) composites in the alkaline and saline environments. Constr. Build. Mater. 2016, 105, 465–471. [Google Scholar] [CrossRef] [Green Version]
  20. Williams Portal, N.; Flansbjer, M.; Johannesson, P.; Malaga, K.; Lundgren, K. Tensile behaviour of textile reinforcement under accelerated ageing conditions. J. Build. Eng. 2016, 5, 57–66. [Google Scholar] [CrossRef]
  21. D’Antino, T.; Carloni, C.; Sneed, L.H.; Pellegrino, C. Matrix-fiber bond behavior in PBO FRCM composites: A fracture mechanics approach. Eng. Fract. Mech. 2014, 117, 94–111. [Google Scholar] [CrossRef]
  22. de Felice, G.; D’Antino, T.; De Santis, S.; Meriggi, P.; Roscini, F. Lessons Learned on the Tensile and Bond Behavior of Fabric Reinforced Cementitious Matrix (FRCM) Composites. Front. Built Environ. 2020, 6, 1–15. [Google Scholar] [CrossRef]
  23. Borri, A.; Castori, G.; Corradi, M. Shear behavior of masonry panels strengthened by high strength steel cords. Constr. Build. Mater. 2011, 25, 494–503. [Google Scholar] [CrossRef]
  24. Sneed, L.H.; D’Antino, T.; Carloni, C. Investigation of bond behavior of polyparaphenylene benzobisoxazole fiber-reinforced cementitious matrix composite-concrete interface. ACI Mater. J. 2014, 111, 569–580. [Google Scholar] [CrossRef]
  25. Calabrese, A.S.; D’Antino, T.; Colombi, P.; Poggi, C. Study of the influence of interface normal stresses on the bond behavior of FRCM composites using direct shear and modified beam tests. Constr. Build. Mater. 2020, 262, 120029. [Google Scholar] [CrossRef]
  26. Terreal Italia San Marco Vivo Red Bricks. Tech. Doc. Available online: https://www.sanmarco.it/scheda-prodotto.php?id-categoria=2&id-prodotto=36 (accessed on 3 November 2020).
  27. D’Antino, T.; Santandrea, M.; Carloni, C. Advances in Knowledge of the Fracture Properties of Cohesive Materials: Fired-Clay and Tuff Bricks. J. Eng. Mech. 2020, 146, 4020079. [Google Scholar] [CrossRef]
  28. FASSA BORTOLO MS 20, Malta cementizia fibrorinforzata per muratura ed intonaco, per interni ed esterni. Tech. Doc. 2019, 2–3. Available online: https://www.fassabortolo.it/it/prodotti/-/p/6/56/prodotti-tradizionali/ms-20-malta-cementizia-per-muratura-ed-intonaco-da-utilizzare-a-mano-per-interni-ed-esterni (accessed on 3 November 2020).
  29. Ruregold PBO-Mesh Gold 70/18 & PBO-MX GOLD MURATURA. Tech. Doc. 2019. Available online: https://www.ruregold.com/ (accessed on 3 November 2020).
  30. TCS B-STRUCTURA. Tech. Doc. 2020. Available online: https://www.tcscalce.it/en/prodotto/b-structura (accessed on 3 November 2020).
  31. Hausding, J.; Lorenz, E.; Ortlepp, R.; Lundahl, A.; Cherif, C. Application of stitch-bonded multi-plies made by using the extended warp knitting process: Reinforcements with symmetrical layer arrangement for concrete. J. Text. Inst. 2011, 102, 726–738. [Google Scholar] [CrossRef]
  32. Mazzucco, G.; D’Antino, T.; Pellegrino, C.; Salomoni, V. Three-dimensional finite element modeling of inorganic-matrix composite materials using a mesoscale approach. Compos. Part B Eng. 2018, 143, 75–85. [Google Scholar] [CrossRef]
  33. TCS Steel X800-A4. Tech. Doc. 2020, 1–3. Available online: https://www.tcscalce.it/en/prodotto/tcs-steel-x800-a4 (accessed on 3 November 2020).
  34. D’Ambrisi, A.; Feo, L.; Focacci, F. Experimental analysis on bond between PBO-FRCM strengthening materials and concrete. Compos. Part B Eng. 2013, 44, 524–532. [Google Scholar] [CrossRef]
  35. Askouni, P.D.; Papanicolaou, C.G. Experimental investigation of bond between glass textile reinforced mortar overlays and masonry: The effect of bond length. Mater. Struct. Constr. 2017, 50, 1–15. [Google Scholar] [CrossRef]
  36. Santandrea, M.; Focacci, F.; Mazzotti, C.; Ubertini, F.; Carloni, C. Determination of the interfacial cohesive material law for SRG composites bonded to a masonry substrate. Eng. Fail. Anal. 2020, 111, 104322. [Google Scholar] [CrossRef]
  37. Sika Sika MonoTop®-722 Mur. Tech. Doc. 2019, 1–4. Available online: https://ita.sika.com/it/edilizia/rinforzi-e-incollaggistrutturali/sistemi-antisfondellamentopersolai/sika-monotop-722mur.html (accessed on 3 November 2020).
  38. Carloni, C.; D’Antino, T.; Sneed, L.H.; Pellegrino, C. Role of the matrix layers in the stress-transfer mechanism of FRCM composites bonded to a concrete substrate. J. Eng. Mech. 2015, 141, 1–10. [Google Scholar] [CrossRef]
  39. D’Antino, T.; Colombi, P.; Carloni, C.; Sneed, L.H. Estimation of a matrix-fiber interface cohesive material law in FRCM-concrete joints. Compos. Struct. 2018, 193, 103–112. [Google Scholar] [CrossRef]
  40. Colombi, P.; D’Antino, T. Analytical assessment of the stress-transfer mechanism in FRCM composites. Compos. Struct. 2019, 220, 961–970. [Google Scholar] [CrossRef]
  41. Calabrese, A.S.; Colombi, P.; D’Antino, T. Analytical solution of the bond behavior of FRCM composites using a rigid-softening cohesive material law. Compos. Part B Eng. 2019, 174, 107051. [Google Scholar] [CrossRef]
  42. Wu, Z.; Yuan, H.; Niu, H.; Zhishen, W.; Hong, Y.; Hedong, N. Stress transfer and fracture propagation in different kinds of adhesive joints. J. Eng. Mech. 2002, 128, 562–573. [Google Scholar] [CrossRef]
  43. Dai, J.; Ueda, T.; Sato, Y. Development of the Nonlinear Bond Stress–Slip Model of Fiber Reinforced Plastics Sheet–Concrete Interfaces with a Simple Method. J. Compos. Constr. 2005, 9, 52–62. [Google Scholar] [CrossRef] [Green Version]
  44. Focacci, F.; Carloni, C. Periodic variation of the transferable load at the FRP-masonry interface. Compos. Struct. 2015, 129, 90–100. [Google Scholar] [CrossRef]
  45. Yuan, H.; Teng, J.G.; Seracino, R.; Wu, Z.S.; Yao, J. Full-range behavior of FRP-to-concrete bonded joints. Eng. Struct. 2004, 26, 553–565. [Google Scholar] [CrossRef]
  46. Dai, J.; Ueda, T.; Sato, Y. Unified analytical approaches for determining shear bond characteristics of FRP-concrete interfaces through pullout tests. J. Adv. Concr. Technol. 2006, 4, 133–145. [Google Scholar] [CrossRef] [Green Version]
  47. Carrara, P.; Ferretti, D. A finite-difference model with mixed interface laws for shear tests of FRP plates bonded to concrete. Compos. Part B Eng. 2013, 54, 329–342. [Google Scholar] [CrossRef]
Figure 1. Fiber-reinforced cementitious matrix (FRCM) textiles: (a) carbon; (b) PBO (polyparaphenylene benzobisoxazole); (c) alkali-resistant (AR)-glass; (d) stainless steel.
Civileng 02 00005 g001
Figure 2. (a) Sketch of the single-lap shear test set-up (dimensions in mm); (b) photo of specimen DS_300_50_C_1.
Civileng 02 00005 g002
Figure 3. Failure modes observed: (a) debonding at the matrix–fiber interface (Dmf); (b) debonding at the matrix–substrate interface (Dms); (c) mixed debonding at the matrix–fiber interface and fiber rupture (MDmfR); (d) mixed debonding at the matrix–substrate and matrix–fiber interfaces (MDmsDmf).
Civileng 02 00005 g003
Figure 4. Failure modes of carbon FRCM: (a) interlaminar matrix crack in specimen DS_300_50_C_3; (b) mixed debonding failure (MDmsDmf) of specimen DS_300_50_C_1.
Civileng 02 00005 g004
Figure 5. Carbon FRCM-masonry joints: (a) applied load P—global slip g response; (b) load response of specimen DS_300_50_C_1.
Civileng 02 00005 g005
Figure 6. Failure of specimen DS_300_50_P_3.
Civileng 02 00005 g006
Figure 7. PBO FRCM-masonry joints: (a) applied load P—global slip g response; (b) load response of specimen DS_300_50_P_1.
Civileng 02 00005 g007
Figure 8. Failure mode of glass FRCM-masonry joints.
Civileng 02 00005 g008
Figure 9. AR-glass FRCM-masonry joints: (a) applied load P—global slip g response and (b) load response of specimen DS_300_50_G_1.
Civileng 02 00005 g009
Figure 10. (a) Detachment of the entire steel-reinforced grout (SRG) strip in specimen DS_300_50_S_1; (b) rupture of steel cords and slippage of the remaining cords in specimen DS_300_50_S_3.
Civileng 02 00005 g010
Figure 11. SRG-masonry joints: (a) applied load P—global slip g response and (b) load response of specimen DS_300_50_S_3.
Civileng 02 00005 g011
Figure 12. Comparison of the (a) average bond capacity and (b) average peak load per unit width for the composites studied.
Civileng 02 00005 g012
Figure 13. (a) Trilinear CML; (b) representative fiber applied stress σ-global slip g response for long bonded length.
Civileng 02 00005 g013
Figure 14. Comparison between the CMLs calibrated for carbon and PBO FRCM and the non-linear CML measured on PBO FRCM-concrete joints by [21].
Civileng 02 00005 g014
Figure 15. Comparison of analytical and experimental (envelope) load responses for (a) carbon and (b) PBO FRCM.
Civileng 02 00005 g015
Table 1. Mechanical properties of textiles and matrices.
CompositeTextile PropertiesMatrix Properties
d*
[mm]
b*
[mm]
t*
[mm]
ff [MPa]Ef [GPa]εffc [MPa]fr
[MPa]
Ec
[GPa]
Carbon FRCM-50.09419442030.009525.06.1>7.5
PBO FRCM-50.09230142060.014525.06.2>7.5
Glass FRCM1.11--874650.013422.06.0~7.6
SRG 1.01-->2000210-10.0--
Provided by the manufacturer; b*: width of a fiber yarn; d*: diameter of a fiber yarn; t*: thickness of a fiber yarn; ff: tensile strength of the textile; Ef: textile elastic modulus; εf: textile ultimate strain; fc: mean matrix compressive strength; fr: mean matrix flexural strength; Ec: mean matrix elastic modulus.
Table 2. Direct shear test results for the FRCM.
Specimen NameP*
[kN]
P ¯ *
[kN]
σ* [MPa] σ ¯ *   [ MPa ] P b *   [ kN / m ] P ¯ b *   [ kN / m ] FM
DS_300_50_C_12.422.37
(8.70)
10301010 (8.70)48.447.5 (8.70)MDmsDmf
DS_300_50_C_22.46104749.2Dmf
DS_300_50_C_32.58109851.6Dmf
DS_300_50_C_42.0386440.6Dmf
DS_300_50_P_15.674.80
(13.68)
24652086 (13.68)113.496.0 (13.68)Dmf
DS_300_50_P_24.66202693.2Dmf
DS_300_50_P_35.012178100.2Dmf
DS_300_50_P_43.85167477.0Dmf
DS_300_50_G_11.771.85
(6.43)
617643 (6.43)35.436.9 (6.43)MDmfR
DS_300_50_G_21.6958933.8MDmfR
DS_300_50_G_31.9567939.0MDmfR
DS_300_50_G_41.9768639.4MDmfR
DS_300_50_S_14.365.14
(9.47)
778916 (9.47)87.2102.7 (9.47)Dms
DS_300_50_S_25.28942105.6Dms
DS_300_50_S_35.2928104MRDmf
DS_300_50_S_45.71017114MRDmf
Note: Coefficient of variation (CoV) is reported as a percentage within parentheses.
Table 3. Solution of Equation (2) for the different stages of Figure 13b.
Elastic stage (i)
s ( y ) = σ t * λ 2 k 1 cosh ( λ y ) sinh ( λ ) ; ε ( y ) = σ t * λ 2 2 k 1 sinh ( λ y ) sinh ( λ ) ; τ ( y ) = σ t * λ 2 cosh ( λ y ) sinh ( λ ) 0 y
Elastic-softening stage (ii)
s ( y ) = s 0 { λ ω tanh [ λ ( l ) ] sin [ ω ( y + l ) ] k 1 k 2 cos [ ω ( y + l ) ] + k 1 + k 2 k 2 }
ε ( y ) = ω s 0 { λ ω tanh [ λ ( l ) ] cos [ ω ( y + l ) ] + k 1 k 2 sin [ ω ( y + l ) ] }
τ ( y ) = τ m a x { ω λ tanh [ λ ( l ) ] sin [ ω ( y + l ) ] cos [ ω ( y + l ) ] }
l y
Elastic-softening-debonding stage (iii)
s ( y ) = τ f E f t * ( y 2 2 y + l 2 d 2 ) + σ E f ( y + d ) + s f
ε ( y ) = 2 τ f E f t * ( y ) + σ E f ;   τ ( x ) = τ f
d y
Softening-debonding stage (iv)
s ( y ) = ω k 2 ( τ f d σ t * 2 ) cos ( ω y ) sin [ ω ( d ) ] + τ m a x k 1 + k 2 k 1 k 2
ε ( y ) = ω 2 k 2 ( σ t * 2 τ f d ) sin ( ω y ) sin [ ω ( d ) ]
τ ( y ) = ω ( σ t * 2 τ f d ) cos ( ω y ) sin [ ω ( d ) ]
0 y d
Fully debonded stage (v)
s ( y ) = τ f E f t * ( y 2 2 y ) + σ E f y + s f
ε ( y ) = 2 τ f E f t * ( y ) + σ E f
τ ( y ) = τ f
0 y
Note: ω = 2 k 2 / ( E f t * ) ; λ = 2 k 1 / ( E f t * ) ; Ef = textile Young’s modulus; t* = thickness of a yarn; k1, k2, sf, and τf are parameters of the CML (see Figure 13b).
Table 4. Parameters of the trilinear cohesive material laws (CMLs) for carbon and PBO FRCM.
s0
[mm]
τmax [MPa]sf [mm]τf [MPa]GF [N/mm3]leff [Equation (3)] [mm]l [Equation (4)] [mm]
Carbon FRCM0.120.540.360.040.10217670
PBO FRCM0.300.800.980.070.41620386
Publisher’s Note: MDPI stays neutral with regard to jurisdictional claims in published maps and institutional affiliations.