Abstract
Perforations adversely affect the structural response of unreinforced masonry walls (UMW) by reducing the wall’s load bearing capacity, which can cause serious structural damage. In the absence of a reliable procedure to accurately predict the load bearing capacity and stiffness of perforated masonry walls subjected to in-plane loadings, this study presents a novel approach to measure these parameters by developing simple but practical equations. In this regard, the Multi-Pier (MP) method as a numerical approach was employed along with the application of an Artificial Neural Network (ANN). The simulated responses of centrally perforated UMW by the MP method were validated utilizing full-scale experimental walls. The validated MP model was used to generate a simulated database. The simulated database includes results of analyses for 49 different configurations of perforated masonry walls and their corresponding solid masonry walls. The effect of the area and shape of the perforations on the UMW’s behavior was evaluated by the MP method. Following the outcomes of the verified MP method, the ANN is trained to develop empirical equations to accurately predict the reduction in the load bearing capacity and initial stiffness due to the perforation of UMW. The results of this study indicate that the perforations have a significant effect on the structural capacity of the UMW subjected to in-plane loadings.
1. Introduction
The accessibility of materials, unavailability of skilled experts, and ease of construction, along with geometric versatility and durability, allow masonry structures to be found all around the world. However, these types of structures absorb strong forces during earthquakes due to their high range of mass and stiffness values. Moreover, low tensile and shear strength, and low ductility to resist seismic forces, along with the high variability of masonry material properties, cause these types of structures to be vulnerable to damage in even moderate earthquakes, which confirms the need for further investigation of their behavior. Masonry is categorized as a non-homogeneous anisotropic material and requires robust analysis to determine the masonry structure response [1]. Numerical modeling is commonly employed to analyze the behavior of masonry structures using different load applications. It is generally accepted that the presence of an opening in a masonry wall, due to functional or ventilation requirements, changes the response of the wall, and consequently affects the structure’s behavior. The impact of openings on masonry walls and infills have been studied using numerous analytical simulations [2,3,4,5,6,7,8,9,10]. However, new sophisticated numerical models are required in order to overcome several fundamental issues such as the inherent complexity of non-linear masonry response subjected to both low- and high-level external load applications [11,12]. Thus, a robust, time-saving, and reliable approach is required to analyze the response of masonry walls with openings. However, the reported findings regarding the effects of openings on the behavior of masonry walls have conflicting results. To achieve the greatest performance, Kakaletsis and Karayannis [13] recommended the location of the wall openings being adjacent to the edges, while others concluded that the wall openings should be located at the center of the wall [14,15]. In addition, Chen and Liu indicated that openings offset far from the loaded side have a slight reduction effect not only on the strength, but also the stiffness of a masonry wall compared to openings placed in the direction of the loaded side [7]. Moreover, provisions for masonry walls with openings are not included in the current American and Canadian masonry design specifications [7,16,17].
In many studies, numerical analysis has been conducted to evaluate the in-plane behavior of perforated masonry walls. Kato et al. [18] proposed a seismic-based method for designing shear walls with openings in accordance with the ultimate capacity approach. Qamaruddin [19,20] suggested a new in-plane approach to evaluate the stiffness of a shear wall with openings by assuming a flexible response of spandrels such as rotation and translation subjected to lateral loads. Zhang et al. [21] simulated the performance of reinforced masonry walls by applying out-of-plane seismic loads. Based on the test outcomes, the load capacities of the openings considerably depend on their size and location. Ghobarah and Galal [22] used strengthened unreinforced masonry walls (UMW) with openings to enhance the wall capacity subjected to high-range out-of-plane loads. In accordance with this finding, the wall capacity located adjacent to an opening can be improved by strengthening the walls with carbon fiber-reinforced polymer strips. The in-plane response of post-tensioned concrete masonry walls with an opening was researched by Wight et al. [23] by applying lateral loads. In this study, the effects of openings in the walls were analyzed using two single-story in-plane walls. The assessed damages on the wall were cracks occurring below the openings, along with vertical bond beam cracks. However, the reduction in the lateral strength was not reported. Augenti et al. [24] researched the lateral in-plane performance of UMW with openings in a full-scale test. The load bearing strength of the wall was controlled under the influence of a spandrel panel, and the rocking of piers was controlled by the lateral wall stiffness. In-plane loading experiments on masonry walls including a central opening were conducted by Vanin and Foraboschi [25]. It was shown that the geometrical and mechanical properties, along with the brick arrangement and loading conditions, play an important role in the structural behavior of masonry walls.
A parametric study on multi-story perforated masonry walls was done by Chavez [26]. The results show that the lateral load bearing capacity of masonry wall is governed by the opening width compared to the opening height. It is also recommended to conduct further investigation to secure a relationship between the load bearing capacity of the wall and its opening shape. Howlader et al. [27] evaluated the in-plane response of the UMW subjected to the cyclic loadings. Their results indicate that the in-plane capacity and the failure modes were significantly affected by changes in wall geometry and the imposed vertical pre-compression loading. The same models were investigated numerically using the simplified micro-modelling approach by Howlader et al. [28]. The results of finite element modeling agree well with experimental results. However, the finite element models overestimated the peak lateral loads by an error margin of about 15%. Moreover, the numerical analysis of specimens illustrated higher values of initial stiffness compared to the experimental outcomes in all the models. Finite element analyses were not able to show pier diagonal shear cracking, which was observed in some of the tested walls. The results of numerical tests indicate an enhancement in load bearing capacity by improving the pre-compression level. Considerable damage was reported in the piers and spandrel associated with the increased load levels. Sandoli et al. [29] proposed a strut and tie scheme to model the spandrel panels in a full-scale masonry wall. In this method, the mechanical behavior of spandrels is modeled with a more realistic representation, since the model considers the axial force and the flexural and shear stiffness. An easy, although approximate, procedure for the evaluation of the seismic safety index of Italian building heritage was suggested by Guadagnuolo et al. [30]. This procedure was also used to optimize the strengthening interventions. The ability of the proposed method was assessed by its implementation to two buildings representative of a large number of residential buildings in Caserta, Italy.
2. Adopted Methodology
2.1. Proposed Discrete Element Method Approach
The prime objective of this study is to develop an innovative empirical approach to anticipate the load-bearing capacity and initial stiffness of perforated UMW. To the best knowledge of the authors, no reliable study has been performed to estimate the load bearing capacity of the perforated UMW. Presently, just a few numerical and experimental research studies have been conducted to analyze the effect of openings on the behavior of UMW, which requires further robust analysis.
In this research study, the multi-pier (MP) approach, as a discrete element method (DEM), was employed and the results were compared using the outcomes of the previous studies. The MP was originally developed by Pirsaheb et al. [31,32]. This approach can determine both the in-plane and out-of-plane non-linear general responses of masonry walls, regardless of their shape, subjected to various loading conditions with acceptable accuracy and simplicity. A specified assemblage of vertical and diagonal trusses, which substitute for a real masonry wall, are able to exhibit the non-linear behavior of structures through one-dimensional elements. The effect of the area and shape of the opening on UMW behavior was determined using the MP method. The results of the applied MP method were used to train the artificial neural network (ANN) to achieve more accurate results, along with developing a practical equation for predicting the effects of the opening. This paper combines two different branches of science (i.e., numerical modeling and soft computing) to address a complex problem. Figure 1 is a flow chart of the activities/tasks performed in this study.
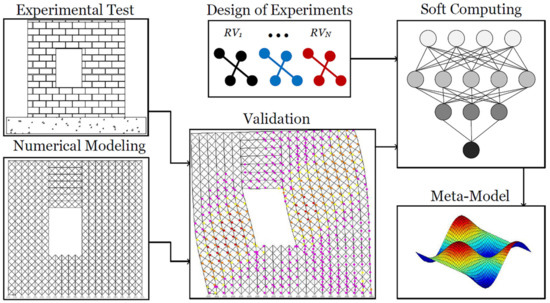
Figure 1.
Flow chart of the activities/tasks performed in this study.
2.2. Theoretical Basis of the MP Method
The truss method is a simple, practical, and time-saving approach which replaces the macro method. This procedure is in accordance with the Holmes diagonal tension concept [33] and has been analyzed in a few previous research studies [34,35,36,37,38,39,40,41,42,43], has attracted the attention of practitioners. The idea of this method is, basically, to rely on simplifying the problem of a masonry wall, which is basically two dimensional, to the assemblages of axial members. This method can be utilized with less effort and provides the capability to implement a simple one-dimensional failure criterion for truss elements, leading to its appeal in standard practice. This method is applicable for the design and analysis of retrofitted masonry buildings by determining the required global responses of the structure (e.g., post-peak response, patterns of local cracks, maximum displacement, and load-bearing capacity) [31].
The method was validated with various ranges of experimental masonry walls, including low and high levels of pre-comparisons and various height-length (H/L) ratios in [24]. The obtained results from the MP method, compared with experimental and FE approaches, are satisfactory in both the entire pushover curve and the failure mechanism. In the research of Pirsaheb et al. [24], a sensitivity scenario was carried out on piers with different pre-compression and H/L ratios to show how the method is capable of predicting the tensile, shear and compressive behavior of URM walls. [24].
In this method, the failure criterion is based on Mohr–Coulomb law, while the relationship between shear strength and precompression was discussed in detail in [24]. In this case, it should be mentioned that the effect of compressive stresses on shear strength is in two parts; the first is gravity loads and the second is compressive stresses due to lateral loads. These two stages are discussed as follows:
a. Gravity loads:
Regarding the gravity loads, braces in the MP approach provide shear stiffness and transfer shear stresses due to lateral loads in the equivalent truss assemblage of the masonry wall. These shear stresses are converted to axial tension and compression in the braces. The tensile strength of the braces is also calculated according to shear strength of the bed joints of the masonry wall, according to the FEMA equation [44,45]:
where is the bed joint shear strength of the masonry unit, stands for the pure shear strength of the masonry unit, and indicates the vertical compressive stress due to gravity loads. It is obvious the shear strength has a direct relationship with compressive stresses due to gravity loads (Figure 2a).
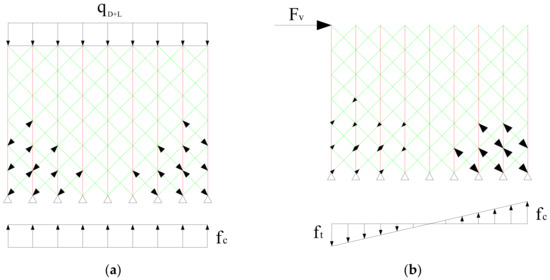
Figure 2.
Axial stresses distribution in braces. (a) Gravity loads. (b) Lateral load (shown in some elements).
b. Lateral loads:
For considering the effect of lateral loads, Figure 2b shows how the lateral loads divide a masonry wall into two tensile and compression regions. The compression stresses will appear in the braces due to the application of gravity loads. The tensile stress due to the lateral load in the tensile region decreases as shown in Figure 2a, because of the pre-compression in the wall. On the contrary, the pre-compression causes an increase in the compression stress of the braces in the compression region. The tensile stresses in the left hand side of the wall in Figure 2b induce tensile cracks in a masonry wall. Toe crush may be seen in the right hand side due to the compression stresses and an increase in these stresses due to lateral loads. The active mechanism which arises in the equivalent system due to distribution of the aforementioned stresses in the braces enriches Mohr–Coulomb’s law.
In the MP method, the masonry building model is analyzed using separated arbitrary vertical axial piers connected to cross-linking brace members. The flexural and shear response of the masonry structure is simulated using vertical and diagonal members, respectively. The various components of wall stiffness and its equivalent system must be assessed and assigned to the piers and braces. The axial stiffness values of the analyzed wall are the summation of all piers’ axial stiffness. The moment of inertia of the wall can be expressed as Equation (2).
where Iw, tw, Lw, and dn are the moment of inertia, thickness, length, and nth pier’s distance in respect to the center of the simulated wall, respectively. The shear behavior of the wall is considered by diagonal braces in the MP method, which are assumed to accurately take into account the shear force transfers within the model piers. The shear stiffness values of the bracing system along with the masonry wall are measured based on Equations (3) and (4), according to Milani et al. [46].
where Ap, G, hp, Ab, and E are the cross-section of a pier, the shear modulus, the height of a pier, the cross-section of a brace, and the modulus of elasticity. lb is the length of a brace, which can be calculated as . θ is the brace angle and is equal to lp/lb. The equal values of shear stiffness in the trusses’ assemblage and in the real masonry are used in the analysis. In this respect, the gross cross section is determined according to Equation (5). For a shear masonry wall, a common equivalent system with trusses is replotted in Figure 3.
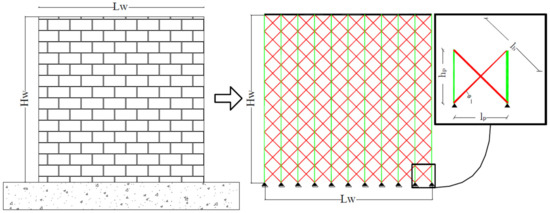
Figure 3.
Masonry wall and equivalent system.
2.3. Multi-Pier Algorithm for Perforated and Unreinforced Masonry Wall
The milestones for the sound practical implementation of the MP method are as follows, according to Pirsaheb et al. [24]:
- Split the wall into nearly square cells.
- Create continuous vertical piers with an equal thickness of the wall section for the middle and side piers equal to Equations (6) and (7), respectively.
- Determine the cross-section area of the braces and assign it to the brace elements in the proposed equivalent system, using the Equation (5).
- Evaluate the material characteristics in the non-linear phase and assign them to the members.
- Analyze the load-control static nonlinear behavior of the wall subjected to the gravity loads.
- Analyze displacement-control static nonlinear response of the wall by applying lateral loads.
- Extract the ultimate load capacity and the related displacement values using the pushover curve. Some correction needs to be implemented in order to utilize the MP method for perforated masonry walls. The equivalent truss system of braces and piers, in which there are spandrels, should be rotated and placed horizontally to sustain horizontal stresses.
2.4. Validation of MP Modeling with Experimental Data
Two experimental masonry wall specimens with and without a central opening were simulated and analyzed to ensure the reliability of the MP method to assess the global load-displacement response of the walls. The experimental specimens were selected based on their accessibility, which is an important factor for conducting a more reliable numerical simulation. The predicted global response using pushover analyses is discussed. In this regard, the effect of peak load, initial stiffness and the displacement related to the peak load are considered. Table 1 presents the characteristics of these parameters. In this table, D donates the displacement related to the peak load. In the following experimental specimens, descriptions are presented. In the MP method, a displacement control approach was conducted for the global non-linear static analyses in the softening phase by applying lateral loads up to the failure criteria.

Table 1.
Comparison of experimental and numerical results (units are kN and mm).
The JD specimen (Figure 4) is a masonry wall with 1000 × 990 × 100 mm dimensions, which was made of 10 mm thick mortar along with 210 × 52 × 100 mm wire-cut solid clay bricks, without any opening [47]. A constant 0.3 MPa compression load is applied to the top surface of the wall in vertical direction using a rigid steel beam during the experiments. The wall was completely fixed on a rigid foundation using specifically conceived connectors [48].
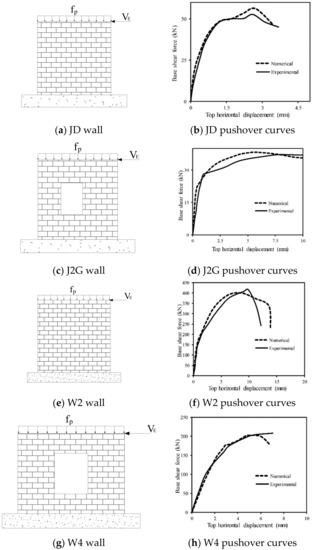
Figure 4.
Validation of multi-pier (MP) modeling with experimental data.
Experimentally, another masonry wall was tested, labeled as J2G, with dimensions of 1000 × 990 × 100 mm, containing a rectangular central opening and a width/height ratio of 0.99 [49]. During the loading procedure, a similar 0.3 MPa compression load was applied in the vertical direction on the top of the wall. Rotations of the top were fixed using a stiff steel beam, and subsequently, the top of the wall was subjected to an incremental compression load in the horizontal direction. The central opening includes two relatively small weak piers and forces the compressive strut that develops by the loading in horizontal direction to extend over either side of the opening.
Two different masonry walls of 240 mm thickness constructed using Chinese codes were selected to verify the MP method results. The dimensions of the walls were 1990 × 1490 × 240 mm and a constant vertical pre-compression of 0.3 fcm was applied on the top edges using a rigid concrete beam. fcm is the compressive strength of the masonry unit and was equal to 10 MPa the in study of Peng et al. [48]. Therefore, the pre-compression of these models was 3 MPa, which is a relatively high pre-compression. W2 (Figure 4e) is a masonry wall without an opening and W4 (Figure 4g) is the same wall with a central opening of 630 × 760 mm, representing an opening area ratio of 16% [48].
The results of the numerical and experimental analyses indicate that the suggested method can precisely evaluate the maximum load, despite its ease and simple theoretical basis, as listed in Table 1. Moreover, the MP method is able to cover a wide range of pre-compression values, from low, which is correspondent to tensile failure, to high pre-compression, indicating shear and compressive failure. The proposed method considers initial wall stiffness in the elastic phase based on the introduced approximations. The global numerical results can also be estimated using the MP method with reasonable accuracy. The key advantage of the proposed method is that all these capabilities, requiring very limited material properties, expertise, or time to make and analyze the model, compared with other methods, can predict such results [31].
2.5. Generating Database by Numerical Simulation for ANN Application
The suitable accuracy of the MP method in predicting the load-bearing capacity and the initial stiffness of a perforated masonry wall was determined. As previously stated, the MP method is capable of predicting the peak load, initial stiffness, displacement corresponding to the peak load, general behavior of the load-displacement of UMW, and crack pattern of UMW with less time and effort in both the pre-processing along with the computational phase with high accuracy in results. These capabilities make this approach more favorable than other methods, such as finite element modeling. In this regard, the effect of the opening area and aspect ratio on the global response of a masonry wall was investigated. The masonry wall has dimensions of 1000 × 990 × 100 mm and is assumed to have constant mechanical properties and pre-compression (as listed in Table 2). A set of appropriately designed experiments were used to generate a handful of numerical simulations. They were used as the input in a soft computing algorithm [50,51], i.e., ANN, and further developed the meta-models related to the experimental test.

Table 2.
Mechanical properties of unreinforced masonry walls (UMW) to generate database based on MP method.
The results obtained from the numerical study using the MP method were used to estimate the response of a perforated masonry wall containing a central opening. The database included 49 distinctive UMW with different opening areas and aspect ratios. To generalize the numerical results to other masonry walls, the results were expressed relatively: (e.g., the ratios of the opening height to wall height and opening width to wall width were considered as inputs, and the load bearing capacity and stiffness of the masonry wall with an opening to the similar wall without an opening were determined as outputs). The selection of these two inputs was based on the fact that the results of this study may be used for creating a new opening in an existing wall owing to architectural or functional purposes. Table 3 presents the parameters for the masonry wall dataset. In this table, h, l, H, L, P0, P, K0, and K are the height of the opening, the width of the opening, the height of the masonry walls, the width of the walls, the wall load bearing capacities of the perforated wall and solid masonry wall, the stiffness of the perforated wall, and the stiffness of the solid masonry wall, respectively. As mentioned in Section 2.3, the distance between each pier is equal to the thickness of the wall. Therefore, the increase in the size of the opening is limited by the masonry wall thickness, which was 100 mm in this study (results in h/H and l/L equal to 0.1). The simulated database is given in Table 4.

Table 3.
Parameters of perforated masonry wall containing central opening and their ranges.

Table 4.
Simulated database in this study.
3. Artificial Neural Network Analysis
3.1. ANN Background
Neural networks can simplify complex models to a practical and accurate system. Neural networks consist of straightforward elements that function in parallel to each other. These systems are information manager models developed based on the human brain’s function. The functionality of the neural networks in nature is assessed by the way in which the components are interconnected [52]. Therefore, it is possible to construct an artificial structure in accordance with natural networks [53], and determine the relationship between its components by adapting the values of each connection, as the weight of the connection. After adjusting or training the neural network, applying a specific input results in a particular outcome as an output. The most important part of training is minimizing the error. This is done by changing the weights during the learning step and continuing this until the error function, e.g., the mean square error (MSE), becomes less than the specified limit. The error is determined as follows:
where N denotes the number of analyzed samples, and and are the target and anticipated results, respectively. This is a repetitious operation performed by initializing the value of w, predicting , and calculating the corresponding MSE. In the initial step, the error is high because weights are randomly selected. The challenge of network learning is to detect weights that cause the minimum possible error for all data sets. In most artificial networks, finding a direct method to detect is impossible due to the high number of weights. Estimating weights by trial and error would be time consuming and would require considerable effort. The gradient descent method is an effective approach in network training to quickly identify the lowest sets of error. Error gradient is used in the gradient descent method to minimize the error [54]. Such an error is related to the network output and depends on the weighted output of the hidden neurons and on the weights. Thus, the chain rule of differentiation can be extended from the error to the weight of the first layer, . This method was initially introduced by Werbos [55] as the backpropagation method, and then developed by Rumelhart [56]. In backpropagation, as a gradient descent algorithm, network weights move in the direction opposite to the slope of the performance function. It has been shown that this type of network is more accurate and faster than other networks and is also suitable for engineering purposes [57,58,59,60].
A neural network functions according to the following assumptions:
- Information process using simple members named neurons.
- Signal transmission from neurons to connection links.
- Assigned specific weight values to each connection
- Each neuron transmits inputs from the activation function and determines the outputs.
A neural network is known based on its learning algorithm, architecture, and the activation function. Using neural networks reduces the number of experiments and saves time [58,61].
3.2. ANN Analysis
Abiodun et al. [62] defined modeling the network as presenting a real-life object or phenomenon using mathematical-based expressions. It is important to determine the optimum configuration of a network that provides well-set and high accuracy at the same time. Considering the fact that there is no equation to specify the number of hidden layers or neurons located on a specified layer, such a number was determined with trial and error. The best possible architecture was selected using the presented ANN model according to the test results of various types of structures containing different neuron and hidden layer numbers attributed to a specified layer [63]. It was observed that the network with a single hidden layer containing seven neurons had the best performance for anticipating the load-bearing and stiffness of the perforated masonry wall containing a central opening. The optimal architecture of the networks is shown in Figure 5.
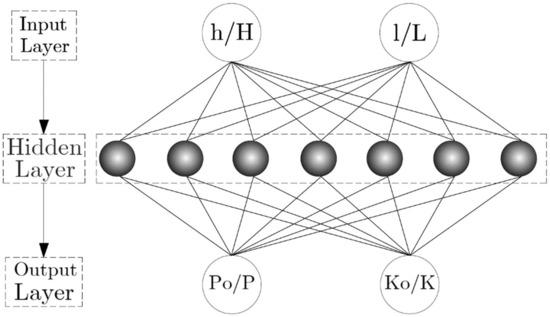
Figure 5.
The architecture of the proposed artificial neural network (ANN).
To train the network, the Levenberg–Marquardt (LM) algorithm was used due to its suitable convergence, high precision, and low time consumption [64,65]. This algorithm randomly divided the data into three parts: 70% for training, 15% for validation, and 15% for testing. The activation functions in both the output and hidden layers were chosen as tansig (Equation (9)) and purlin (Equation (10)), respectively. The learning process ended whenever the desired performance of the network was accomplished.
3.3. ANN Model Performance
The ratio of the load-bearing capacity of a perforated masonry wall to a solid wall, and its stiffness ratio, can be predicted once the network is trained. In addition, the complex relationship between the input parameters can be determined. The performance of the networks in evaluating the response of masonry walls is shown in Figure 6. The best validation performance was obtained as 1.55 × 10 × 5 at the 22nd epoch. The occurrence of overfitting is ruled out because the validation curve remains constant. Thus, no changes need to be made to the training process, network architecture, or the dataset. Figure 7 shows a strong correlation between the target (numerical results) and ANN output according to the correlation coefficient (R) for all data. The total response with R values close to 1 confirmed that the network calculated the outcomes with good accuracy.
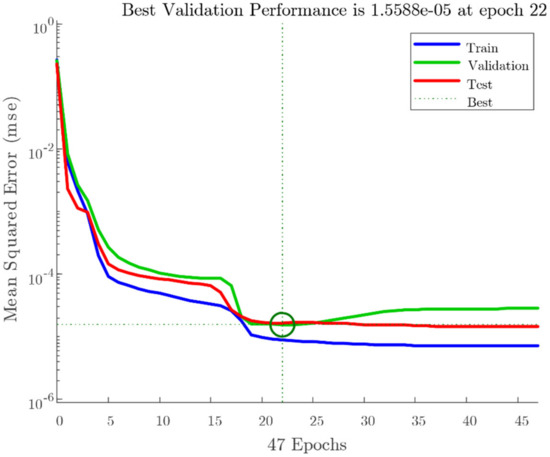
Figure 6.
The performance of the proposed ANN.
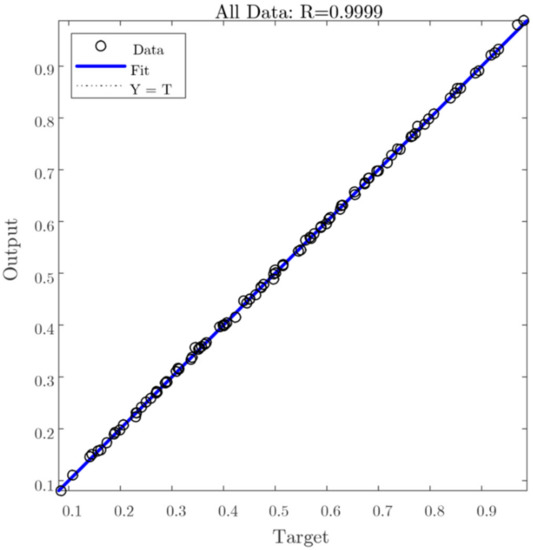
Figure 7.
The regression of the proposed ANN.
4. Results and Discussion
4.1. ANN Design of Experiments
The design of the experiments refers to a systematic method to regulate the relation between the input and output parameters in a process (i.e., cause-and-effect concept) [66]. This is an important step to optimize the output by managing the input parameters of the process. In this section, the parameters that control the response of a perforated masonry wall are further evaluated using the MP method.
The ratio of the opening height to the wall height and the opening width to the wall width ratio were considered as affecting parameters on the global behavior of a perforated masonry wall with a central opening. Subsequently, several discrete values were assumed for each parameter, as listed in Table 3. The full combination of all those parameters results in 7 × 7 = 49 unique numerical models. Those models were analyzed, and all the results, i.e., peak load and initial stiffness, were used as the inputs of the ANN network. Figure 8 plotted some of the masonry walls with various opening areas and shapes which were analyzed using the MP method.

Figure 8.
Masonry wall with different opening areas and shapes.
The summary of the numerical results based on the MP method is listed in Table 3, which is used as the dataset for the ANN network. For each response, the minimum, maximum, mean, and standard deviation (STD) were extracted. These results were considered as targets of the networks. It should be mentioned that in order to make the results comprehensive, the inputs, which are the opening area ratio and aspect ratio, were considered as dimensionless parameters. The same procedure was done for the targets. The results are represented as a reduction in the peak load and initial stiffness in the perforated masonry wall compared with a masonry wall without an opening.
4.2. Meta-Model Based on ANN
The ANN technique was applied to the dataset. In this soft-computing method, 70% of the data are included in the training procedure of the meta-model, while the rest are used equally for validation and testing. Several metrics are used for error evaluation: mean absolute percentage error (MAPE), mean square error (MSE), Nash–Sutcliffe efficiency (NSE) coefficient, root mean square error (RMSE), mean absolute error (MAE), along with the coefficient of determination (R2) (see Equation (11)). These metrics are listed in Table 4 for the ANN soft-computing technique. The ideal value for MSE, RMSE, MAE, and MAPE is zero, while its unit for NSE and R2, where , and are individual outputs, the estimated output, and the mean value, respectively. The predicted results using the ANN model are compared with those produced by the MP method in Figure 9. As can be seen, the results of the network are in accordance with the analytical results. The error of the prediction for both the load bearing capacity and initial stiffness are listed in Table 5, based on six different statistical measurements. The MSE of the ANN for predicting the load bearing and initial stiffness ratio are 1.58 × 10⁻⁵ and 6.05 × 10⁻⁶, respectively.
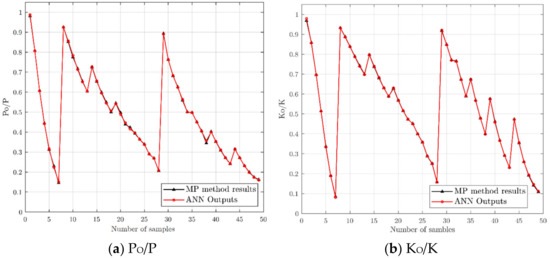
Figure 9.
The comparison of the predicted result and numerical data.

Table 5.
Mean square error (MSE), root mean square error (RMSE), mean absolute error (MAE), mean absolute percentage error (MAPE), Nash–Sutcliffe efficiency (NSE), and the coefficient of determination (R2) for all data in the ANN network.
4.3. Stability Analysis of the ANN Model
The ratios of the predicted to experimental results versus the affecting parameters, which indicate the stability in anticipating the load bearing capacity and initial stiffness ratio, are shown in Figure 10. The affecting parameters are the opening height to wall height ratio and the opening width to wall width ratio. The variation of data about the horizontal line starting from the ratio of 1 (the bold line in black color) shows the stability of the parameters, and the closer the data are to this line, the greater stability of the parameters. As seen in Figure 10, the values of initial stiffness were more stable. However, the network could predict the results with acceptable accuracy for both responses.
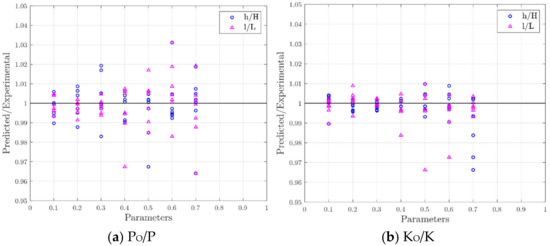
Figure 10.
Stability of (a) load bearing and (b) initial stiffness.
4.4. Sensitivity Analysis of the ANN Model
As discussed earlier in Section 4, the weight of each neuron indicates its importance. In order to analyze the relative significance of parameters in the network, Garson’s factor [67] was considered. The relative significance of a network’s inputs as a single hidden layer can be calculated using Equation (12).
where equals the sum of the connection weights between the N input neurons and the hidden neuron j, and vjk is the connection weight between the hidden neuron j and the output neuron k [68].The results of sensitivity analysis indicate that the opening width ratio (l/L), and opening height ratio (h/H) have 58.02% and 41.97% influence on the initial stiffness ratio along with peak load of the perforated masonry wall, respectively. As can be seen, the effect of the opening’s width is more dominant than the opening’s height. This can be attributed to the effect of rectangular opening in reducing the width of adjacent piers and interrupting the resistance of piers, and consequently, the reduction in initial stiffness and load bearing capacity compared to the square opening with the same area.
4.5. Development of Predictive Equations for Perforated UMW Behavior
The suitable accuracy of the results, as well as the similar contribution of the input parameters in the network, allow the implementation of the ANN models to predict the numerical results, and at a higher level, propose a formula for the estimation of the reduction in load-bearing capacity and initial stiffness due to implementing a central opening. For this purpose, the number of network inputs was increased to 1308 to cover all possible situations in creating a central opening in the masonry wall. The formula uses the biases and weight values of the ANN model to evaluate the response of the analyzed masonry wall. The generation of empirical equations can reduce the limitations of neural network use. The pattern formula applied here for anticipating the behavior of a masonry wall was introduced by Leung et al. [69]. To determine an empirical formula, the most effective parameter on the output was kept constant in its reference value, i.e., its median, and outputs of the network for the variation of other inputs were obtained. Using the curve fitting tools in MATLAB, a line of best fit in the least square error method can be determined. It is assumed that the variation of the load-bearing capacity and initial stiffness with each parameter is independent of the other parameters, and can be expressed as Equations (13) and (14), respectively. In Equation (13), PO/P is the ratio of the load bearing capacity of a perforated masonry wall to a solid masonry wall, h is the opening height, l is the opening length, H is the wall height, and L is the wall length. In Equation (14), KO/K is the reduction in the initial stiffness of the perforated masonry wall compared to the solid wall.
The error distribution between the empirical and network results following the empirical method in terms of the percentage difference is presented in Table 6. The MSE, RMSE, MAE, MAPE, NSE, and correlation coefficient of the network, R2, for anticipating the reduction in the load bearing capacity of a perforated masonry wall compared to a solid wall are 0.016, 0.126, 0.117, 0.27, 0.688, and 0.954, respectively. The statistical metrics for initial stiffness reduction are 0.015, 0.124, 0.105, 0.453, 0.719, and 0.892, respectively. The empirical formula considered 51% and 61.7% of samples in the error range of ±20% for PO/P and KO/K, respectively. The empirical approach can estimate 92.4% of data for both responses in the error range of ±40%. The empirical approach proposed in this paper is not only practical and easy to use, but also shows good correlation and low MSE error. In Figure 11, a decline in the response of the masonry wall obtained from the empirical approach is higher than the predicted value when a point lies under the 45° line. As can be seen, quite a few values are conservative, i.e., under the 45° line, which indicates a conservative approach in practice.

Table 6.
Precision of proposed formulae and data distribution in the error range.
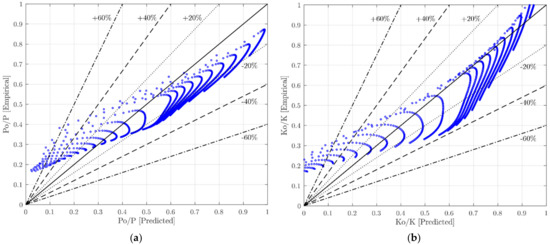
Figure 11.
Predictions of (a) PO/P and (b) KO/K in proposed formula.
The utilization of the neural network to generate empirical design charts is a practical approach to make the results more intelligible. In Figure 12, the variation of masonry walls’ responses versus opening area and the aspect ratio is plotted. As can be seen, an increase in the relative opening area, i.e., A0/Awall, leads to a decrease in load bearing capacity and initial stiffness of the perforated masonry wall. However, the reduction in the masonry wall’s response due to an increase in the opening area is more severe in the lower aspect ratio. This can be attributed to the low width of adjacent piers, which are responsible for lateral load bearing capacity. The high aspect ratio of the piers adjoining the opening leads to the pure rocking failure in the masonry wall. This is in accordance with the results of Rai and Goel [70]. It was concluded that the response of a substructure as a whole was largely dependent on the pier failure mechanism [71]. In addition, for a constant relative opening area, an increase in the opening aspect ratio greater than one has a negligible effect on the response of a masonry wall. An increase in the opening aspect ratio, i.e., height/width, causes the piers to remain wide, and causes the reduction in strength and stiffness of the adjacent piers to be less, and therefore the perforated masonry wall is able to resist the lateral load more appropriately. It can be concluded that the suitable shape for openings in masonry walls with a constant area is standing rectangular with an aspect ratio greater than 1.
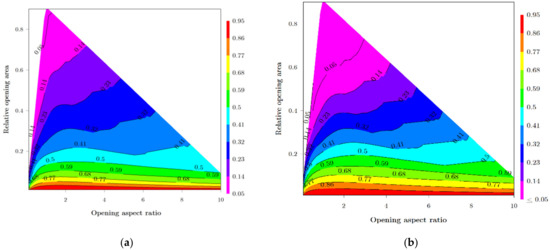
Figure 12.
Reduction factors based on opening area and aspect ratio for (a) load-bearing capacity and (b) initial stiffness.
5. Conclusions
In this study, the effect of central perforation on the load bearing resistance and the stiffness of the masonry unreinforced walls is investigated by conducting a numerical analysis using the MP method and adopting the generated outcomes in an ANN.
The results of this research are summarized as follows:
- Increasing the relative opening area in the wall leads to a reduction in the load bearing strength and initial stiffness of a perforated masonry wall. Such a decrease is reported as more considerable in lower aspect ratios of perforated area to the total area of the wall.
- It was observed that the presence of opening areas with aspect ratios greater than 1 does not have a significant effect of the masonry wall’s structural capacity.
- The suitable shape of incorporating openings in the masonry walls is reported as vertical rectangular with aspect ratios greater than 1. This opening arrangement leads to further structural capacity compared to other opening arrangements with similar opening area.
- For practical purposes, simple and empirical equations are developed to predict the reduction in the load bearing capacity and initial stiffness of the perforated masonry walls. The equations are introduced based on the ratios of height and width of the existing perforations to the total dimensions of the wall.
- Useful charts are presented to predict the reductions in the wall’s load bearing resistance and stiffness based on the opening aspect ratios and relative opening areas.
Author Contributions
Conceptualization, M.K. (Mohsen Khaleghi), V.F. and M.J.M.; data curation, M.J.M.; formal analysis, M.K. (Mohsen Khaleghi), V.F., M.J.M. and M.K. (Moses Karakouzian); funding acquisition, M.K. (Moses Karakouzian); investigation, J.S., V.F. and M.J.M.; methodology, J.S., V.F. and M.J.M.; project administration, M.K. (Moses Karakouzian); resources, M.K. (Mohsen Khaleghi), J.S. and M.J.M.; software, V.F. and M.J.M.; supervision, M.K. (Moses Karakouzian); validation, M.K. (Mohsen Khaleghi) and J.S.; writing—original draft, J.S., V.F., M.J.M. and M.K. (Moses Karakouzian); writing—review and editing, V.F. and M.J.M. All authors have read and agreed to the published version of the manuscript.
Funding
This research received no external funding.
Institutional Review Board Statement
Not applicable.
Informed Consent Statement
Not applicable.
Data Availability Statement
The data presented in this study are available on request from the corresponding author.
Conflicts of Interest
The authors declare no conflict of interest.
References
- Abdulla, K.F.; Cunningham, L.S.; Gillie, M. Simulating masonry wall behaviour using a simplified micro-model approach. Eng. Struct. 2017, 151, 349–365. [Google Scholar] [CrossRef]
- Al-Chaar, G.; Lamb, G.E. Effect of openings on structural performance of unreinforced masonry infilled frames. ACI Spec. Publ. 2003, 211–212, 247–261. [Google Scholar]
- Mondal, G.; Jain, S.K. Lateral stiffness of masonry infilled reinforced concrete (RC) frames with central opening. Earthq. Spectra 2008, 24, 701–723. [Google Scholar] [CrossRef]
- Tasnimi, A.A.; Mohebkhah, A. Investigation on the behavior of brick-infilled steel frames with openings, experimental and analytical approaches. Eng. Struct. 2011, 33, 968–980. [Google Scholar] [CrossRef]
- Asteris, P.G.; Giannopoulos, I.P.; Chrysostomou, C.Z. Modeling of Infilled Frames with Openings. Open Constr. Build. Technol. J. 2012, 6, 81–91. [Google Scholar] [CrossRef]
- Mohammadi, M.; Nikfar, F. Strength and Stiffness of Masonry-Infilled Frames with Central Openings Based on Experimental Results. J. Struct. Eng. 2013, 139, 974–984. [Google Scholar] [CrossRef]
- Chen, X.; Liu, Y. Numerical study of in-plane behaviour and strength of concrete masonry infills with openings. Eng. Struct. 2015, 82, 226–235. [Google Scholar] [CrossRef]
- Berti, M.; Salvatori, L.; Orlando, M.; Spinelli, P. Unreinforced masonry walls with irregular opening layouts: Reliability of equivalent-frame modelling for seismic vulnerability assessment. Bull. Earthq. Eng. 2017, 15, 1213–1239. [Google Scholar] [CrossRef]
- Parisi, F.; Augenti, N. Seismic capacity of irregular unreinforced masonry walls with openings. Earthq. Eng. Struct. Dyn. 2013, 42, 101–121. [Google Scholar] [CrossRef]
- Ganapathi, S.C.; Murthy, A.R.C.; Iyer, N.R.; Lakshmanan, N.; Bhagavan, N.G. Experimental and numerical study on in-plane behavior of brick masonry wall panels. Int. J. Struct. Stab. Dyn. 2011, 11, 431–450. [Google Scholar] [CrossRef]
- Oliveira, D.V. Experimental and Numerical Analysis of Blocky Masonry Structures under Cyclic Loading. 2003, 221. Available online: https://repositorium.sdum.uminho.pt/handle/1822/180 (accessed on 5 January 2021).
- Morandi, P.; Albanesi, L.; Graziotti, F.; Li Piani, T.; Penna, A.; Magenes, G. Development of a dataset on the in-plane experimental response of URM piers with bricks and blocks. Constr. Build. Mater. 2018, 190, 593–611. [Google Scholar] [CrossRef]
- Kakaletsis, D.J.; Karayannis, C.G. Influence of masonry strength and openings on infilled R/C frames under cycling loading. J. Earthq. Eng. 2008, 12, 197–221. [Google Scholar] [CrossRef]
- Mallick, D.V.; Garg, R.P. Effect of openings on the lateral stiffness of infilled frames. Proc. Inst. Civ. Eng. 1971, 49, 193–209. [Google Scholar] [CrossRef]
- Dawe, J.L.; Seah, C.K. Behaviour of masonry infilled steel frames. Can. J. Civ. Eng. 1989, 16, 865–876. [Google Scholar] [CrossRef]
- ACI A 530. ASCE 5/TMS 402-Building Code Requirements for Masonry Structures; American Concrete Institute International: Farmington Hills, MI, USA, 2011. [Google Scholar]
- Canadian Standards Association, Mississauga. CAN/CSA S304. 1-04—Design of Masonry Structures; Canadian Standards As-sociation, Mississauga: Mississauga, ON, Canada, 2005. [Google Scholar]
- Kato, D.; Kabeyasawa, T.; Otani, S.; Aoyama, H. Earthquake-resistant design of shearwalls with one opening. ACI Mater. J. 1995, 92, 495–500. [Google Scholar] [CrossRef]
- Qamaruddin, M. In-plane stiffness of shearwallswith openings. Build. Environ. 1998, 34, 109–127. [Google Scholar] [CrossRef]
- Qamaruddin, M.; Al-Oraimi, S.; Hago, A.W. Mathematical Model for Lateral Stiffness of ShearWall with Openings. In Proceedings of the Seventh North American Masonry Conference; University of Notre Dame: South Bend, IN, USA, 1996; pp. 605–617. [Google Scholar]
- Zhang, X.; Singh, S.; Bull, D.K.; Cooke, N. Out-of-Plane Performance of Reinforced Masonry Walls with Openings. J. Struct. Eng. 2001, 127, 51–57. [Google Scholar] [CrossRef]
- Ghobarah, A.; El Mandooh Galal, K. Out-of-Plane Strengthening of Unreinforced Masonry Walls with Openings. J. Compos. Constr. 2004, 8, 298–305. [Google Scholar] [CrossRef]
- Wight, G.D.; Kowalsky, M.J.; Ingham, J.M. Shake Table Testing of Posttensioned Concrete Masonry Walls with Openings. J. Struct. Eng. 2007, 133, 1551–1559. [Google Scholar] [CrossRef]
- Augenti, N.; Parisi, F.; Prota, A.; Manfredi, G. In-Plane Lateral Response of a Full-Scale Masonry Subassemblage with and without an Inorganic Matrix-Grid Strengthening System. J. Compos. Constr. 2011, 15, 578–590. [Google Scholar] [CrossRef]
- Vanin, A.; Foraboschi, P. In-plane behavior of perforated brick masonry walls. Mater. Struct./Mater. Constr. 2012, 45, 1019–1034. [Google Scholar] [CrossRef]
- Chavez, K.H. Parametric Study on Multi-Story, Partially Grouted, Perforated, Masonry Shear Walls by Finite Element Analysis. Master’s Thesis, Brigham Young University, Provo, UT, USA, 2018. [Google Scholar]
- Howlader, M.K.; Masia, M.J.; Griffith, M.C. In-Plane Response of Perforated Unreinforced Masonry Walls under Cyclic Loading: Experimental Study. J. Struct. Eng. 2020, 146, 04020106. [Google Scholar] [CrossRef]
- Howlader, M.K.; Masia, M.J.; Griffith, M.C. Numerical analysis and parametric study of unreinforced masonry walls with arch openings under lateral in-plane loading. Eng. Struct. 2020, 208. [Google Scholar] [CrossRef]
- Sandoli, A.; Musella, C.; Piero Lignola, G.; Calderoni, B.; Prota, A. Spandrel panels in masonry buildings: Effectiveness of the diagonal strut model within the equivalent frame model. Structures 2020, 27, 879–893. [Google Scholar] [CrossRef]
- Guadagnuolo, M.; Aurilio, M.; Faella, G. Retrofit assessment of masonry buildings through simplified structural analysis. Frat. Integrita Strutt. 2020, 14, 398–409. [Google Scholar] [CrossRef]
- Pirsaheb, H.; Javad Moradi, M.; Milani, G. A Multi-Pier MP procedure for the non-linear analysis of in-plane loaded masonry walls. Eng. Struct. 2020, 212. [Google Scholar] [CrossRef]
- Pirsaheb, H.; Javad Moradi, M.; Milani, G. A Multi-Pier MP method for the non-linear static analysis of out-of-plane loaded masonry walls. Eng. Struct. 2020, 223. [Google Scholar] [CrossRef]
- Dizhur, D.; Ingham, J.M. Diagonal tension strength of vintage unreinforced clay brick masonry wall panels. Constr. Build. Mater. 2013, 43, 418–427. [Google Scholar] [CrossRef]
- Ganz, H.R.; Thürlimann, B. Strength of brick walls under normal force and shear. In Proceedings of the 8th International Sympo-sium on Load Bearing Brickwork, London, UK, November 1983; pp. 27–29. [Google Scholar]
- White, D. Unified plastic analysis for infilled frames. Comput.-Aided Des. 1986, 18, 108. [Google Scholar] [CrossRef]
- Saneinejad, A.; Hobbs, B. Inelastic Design of Infilled Frames. J. Struct. Eng. 1995, 121, 634–650. [Google Scholar] [CrossRef]
- Roca, P. Assessment of masonry shear-walls by simple equilibrium models. Constr. Build. Mater. 2006, 20, 229–238. [Google Scholar] [CrossRef]
- Roca, P.; Lobato, M.; Viviescas, Á.; Villalba, V. Limit analysis of shear walls by simple equilibrium models. In Proceedings of the 8th International Masonry Conference, Dresden, Germany, 4–7 July 2010. [Google Scholar]
- Roca, P.; Viviescas, Á.; Lobato, M.; Díaz, C.; Serra, I. Capacity of shear walls by simple equilibrium models. Int. J. Archit. Herit. 2011, 5, 412–435. [Google Scholar] [CrossRef]
- Rodrigues, H.; Varum, H.; Costa, A. Simplified macro-model for infill masonry panels. J. Earthq. Eng. 2010, 14, 390–416. [Google Scholar] [CrossRef]
- Nolph, S.M.; Elgawady, M.A. In-Plane Shear Performance of Partially Grouted Masonry Shear Walls. Ph.D. Thesis, Washington State University, Pullman, WA, USA, 2010. [Google Scholar]
- Adukadukam, A.; Sengupta, A.K. Equivalent Strut Method for the Modelling of Masonry Infill Walls in the Nonlinear Static Analysis of Buildings. J. Inst. Eng. (India) Ser. A 2013, 94, 99–108. [Google Scholar] [CrossRef]
- Mojsilović, N.; Kostić, N.; Schwartz, J. Modelling of the behaviour of seismically strengthened masonry walls subjected to cyclic in-plane shear. Eng. Struct. 2013, 56, 1117–1129. [Google Scholar] [CrossRef]
- Beyer, K.; Mangalathu, S. Review of strength models for masonry spandrels. Bull. Earthq. Eng. 2013, 11, 521–542. [Google Scholar] [CrossRef]
- Applied Technology Council; Partnership for Response. Evaluation of Earthquake Damaged Concrete and Masonry Wall Buildings: Basic Procedures Manual; FEMA: Washington, DC, USA, 1998.
- Milani, G.; Lourenço, P.B.; Tralli, A. Homogenised limit analysis of masonry walls, Part I: Failure surfaces. Comput. Struct. 2006, 84, 166–180. [Google Scholar] [CrossRef]
- Lourenço, P. Computational Strategy for Masonry Structures. 1996. Available online: https://www.researchgate.net/publication/27344834_Computational_Strategy_for_Masonry_Structures (accessed on 5 January 2021).
- Peng, B.; Wang, D.; Zong, G.; Zhang, Y. Homogenization strategy for brick masonry walls under in-plane loading. Constr. Build. Mater. 2018, 163, 656–667. [Google Scholar] [CrossRef]
- Raijmakers, T.M.J.; Vermeltfoort, A.T. Deformation Controlled Tests in Masonry Shear Walls; TNO-Bouw: Delft, The Netherlands, 1992. [Google Scholar]
- Rezaiee-Pajand, M.; Rezaiee-Pajand, A.; Karimipour, A.; Mohebbi Najm Abad, J. A Particle Swarm optimization algorithm to suggest formulas for the behaviour of the recycled materials reinforced concrete beams. Int. J. Optim. Civ. Eng. 2020, 10, 451–479. [Google Scholar]
- Shahmansouri, A.A.; Akbarzadeh Bengar, H.; Ghanbari, S. Compressive strength prediction of eco-efficient GGBS-based geopolymer concrete using GEP method. J. Build. Eng. 2020, 31. [Google Scholar] [CrossRef]
- Moradi, M.J.; Roshani, M.M.; Shabani, A.; Kioumarsi, M. Prediction of the load-bearing behavior of spsw with rectangular opening by RBF network. Appl. Sci. 2020, 10. [Google Scholar] [CrossRef]
- Rezaiee-Pajand, M.; Karimipour, A.; Abad, J.M.N. Crack Spacing Prediction of Fibre-Reinforced Concrete Beams with Lap-Spliced Bars by Machine Learning Models. Iran. J. Sci. Technol. -Trans. Civ. Eng. 2020. [Google Scholar] [CrossRef]
- Bradley, J.B. Neural networks: A comprehensive foundation. Inf. Process. Manag. 1995, 31, 786. [Google Scholar] [CrossRef]
- Werbos, P.J. An Overview of Neural Networks for Control. IEEE Control Syst. 1991, 11, 40–41. [Google Scholar] [CrossRef]
- Rumelhart, D.E.; Widrow, B.; Lehr, M.A. The Basic Ideas in Neural Networks. Commun. ACM 1994, 37, 87–92. [Google Scholar] [CrossRef]
- Daneshvar, K.; Moradi, M.J.; Amooie, M.; Chen, S.; Mahdavi, G.; Hariri-Ardebili, M.A. Response of low-percentage FRC slabs under impact loading: Experimental, numerical, and soft computing methods. Structures 2020, 27, 975–988. [Google Scholar] [CrossRef]
- Moradi, M.J.; Hariri-Ardebili, M.A. Developing a library of shear walls database and the neural network based predictive meta-model. Appl. Sci. 2019, 9. [Google Scholar] [CrossRef]
- Nitze, I.; Schulthess, U.; Asche, H. Comparison of machine learning algorithms random forest, artificial neuronal network and support vector machine to maximum likelihood for supervised crop type classification. In Proceedings of the 4th Conference on GEographic Object-Based Image Analysis—GEOBIA 2012, Rio de Janeiro, Brazil, 7–9 May 2012; pp. 35–40. [Google Scholar]
- Korotcov, A.; Tkachenko, V.; Russo, D.P.; Ekins, S. Comparison of Deep Learning with Multiple Machine Learning Methods and Metrics Using Diverse Drug Discovery Data Sets. Mol. Pharm. 2017, 14, 4462–4475. [Google Scholar] [CrossRef] [PubMed]
- Naderpour, H.; Mirrashid, M. An innovative approach for compressive strength estimation of mortars having calcium inosilicate minerals. J. Build. Eng. 2018, 19, 205–215. [Google Scholar] [CrossRef]
- Abiodun, O.I.; Jantan, A.; Omolara, A.E.; Dada, K.V.; Mohamed, N.A.E.; Arshad, H. State-of-the-art in artificial neural network applications: A survey. Heliyon 2018, 4. [Google Scholar] [CrossRef] [PubMed]
- Shahmansouri, A.A.; Yazdani, M.; Ghanbari, S.; Akbarzadeh Bengar, H.; Jafari, A.; Farrokh Ghatte, H. Artificial neural network model to predict the compressive strength of eco-friendly geopolymer concrete incorporating silica fume and natural zeolite. J. Clean. Prod. 2021, 279. [Google Scholar] [CrossRef]
- Roshani, G.H.; Feghhi, S.A.H.; Mahmoudi-Aznaveh, A.; Nazemi, E.; Adineh-Vand, A. Precise volume fraction prediction in oil-water-gas multiphase flows by means of gamma-ray attenuation and artificial neural networks using one detector. Meas. J. Int. Meas. Confed. 2014, 51, 34–41. [Google Scholar] [CrossRef]
- Hagan, M.T.; Menhaj, M.B. Training feedforward networkswith theMarquardt algorithm. IEEE Trans. Neural Netw. 1994, 5, 989–993. [Google Scholar] [CrossRef] [PubMed]
- Hariri-Ardebili, M.A. MCS-based response surface metamodels and optimal design of experiments for gravity dams. Struct. Infrastruct. Eng. 2018, 14, 1641–1663. [Google Scholar] [CrossRef]
- Garson, D.G. Interpreting neural network connection weights. Artif. Intell. Expert 1991, 6, 47–51. [Google Scholar]
- Goh, A.T.C. Back-propagation neural networks for modeling complex systems. Artif. Intell. Eng. 1995, 9, 143–151. [Google Scholar] [CrossRef]
- Leung, C.K.; Ng, M.Y.; Luk, H.C. Empirical Approach for Determining Ultimate FRP Strain in FRP-Strengthened Concrete Beams. J. Compos. Constr. 2006, 10, 125–138. [Google Scholar] [CrossRef]
- Rai, D.C.; Goel, S.C. Seismic Strengthening of Rocking-Critical Masonry Piers. J. Struct. Eng. 2007, 133, 1445–1452. [Google Scholar] [CrossRef]
- Knox, C. Assessment of Perforated Unreinforced Masonry Walls Responding in Plane. Ph.D. Thesis, The University of Auckland, Auckland, New Zealand, 2012. [Google Scholar]
Publisher’s Note: MDPI stays neutral with regard to jurisdictional claims in published maps and institutional affiliations. |
© 2021 by the authors. Licensee MDPI, Basel, Switzerland. This article is an open access article distributed under the terms and conditions of the Creative Commons Attribution (CC BY) license (http://creativecommons.org/licenses/by/4.0/).