
Slowly Expanding Lesions in Multiple Sclerosis: A Systematic Review and Meta-Analysis
 , , ,
, , ,
Abstract
1. Introduction
2. Methods
2.1. Search Strategy
2.2. Study Selection
2.3. Eligibility Criteria
2.4. Data Extraction
2.5. Risk of Bias Assessment
2.6. Data Analysis
3. Results
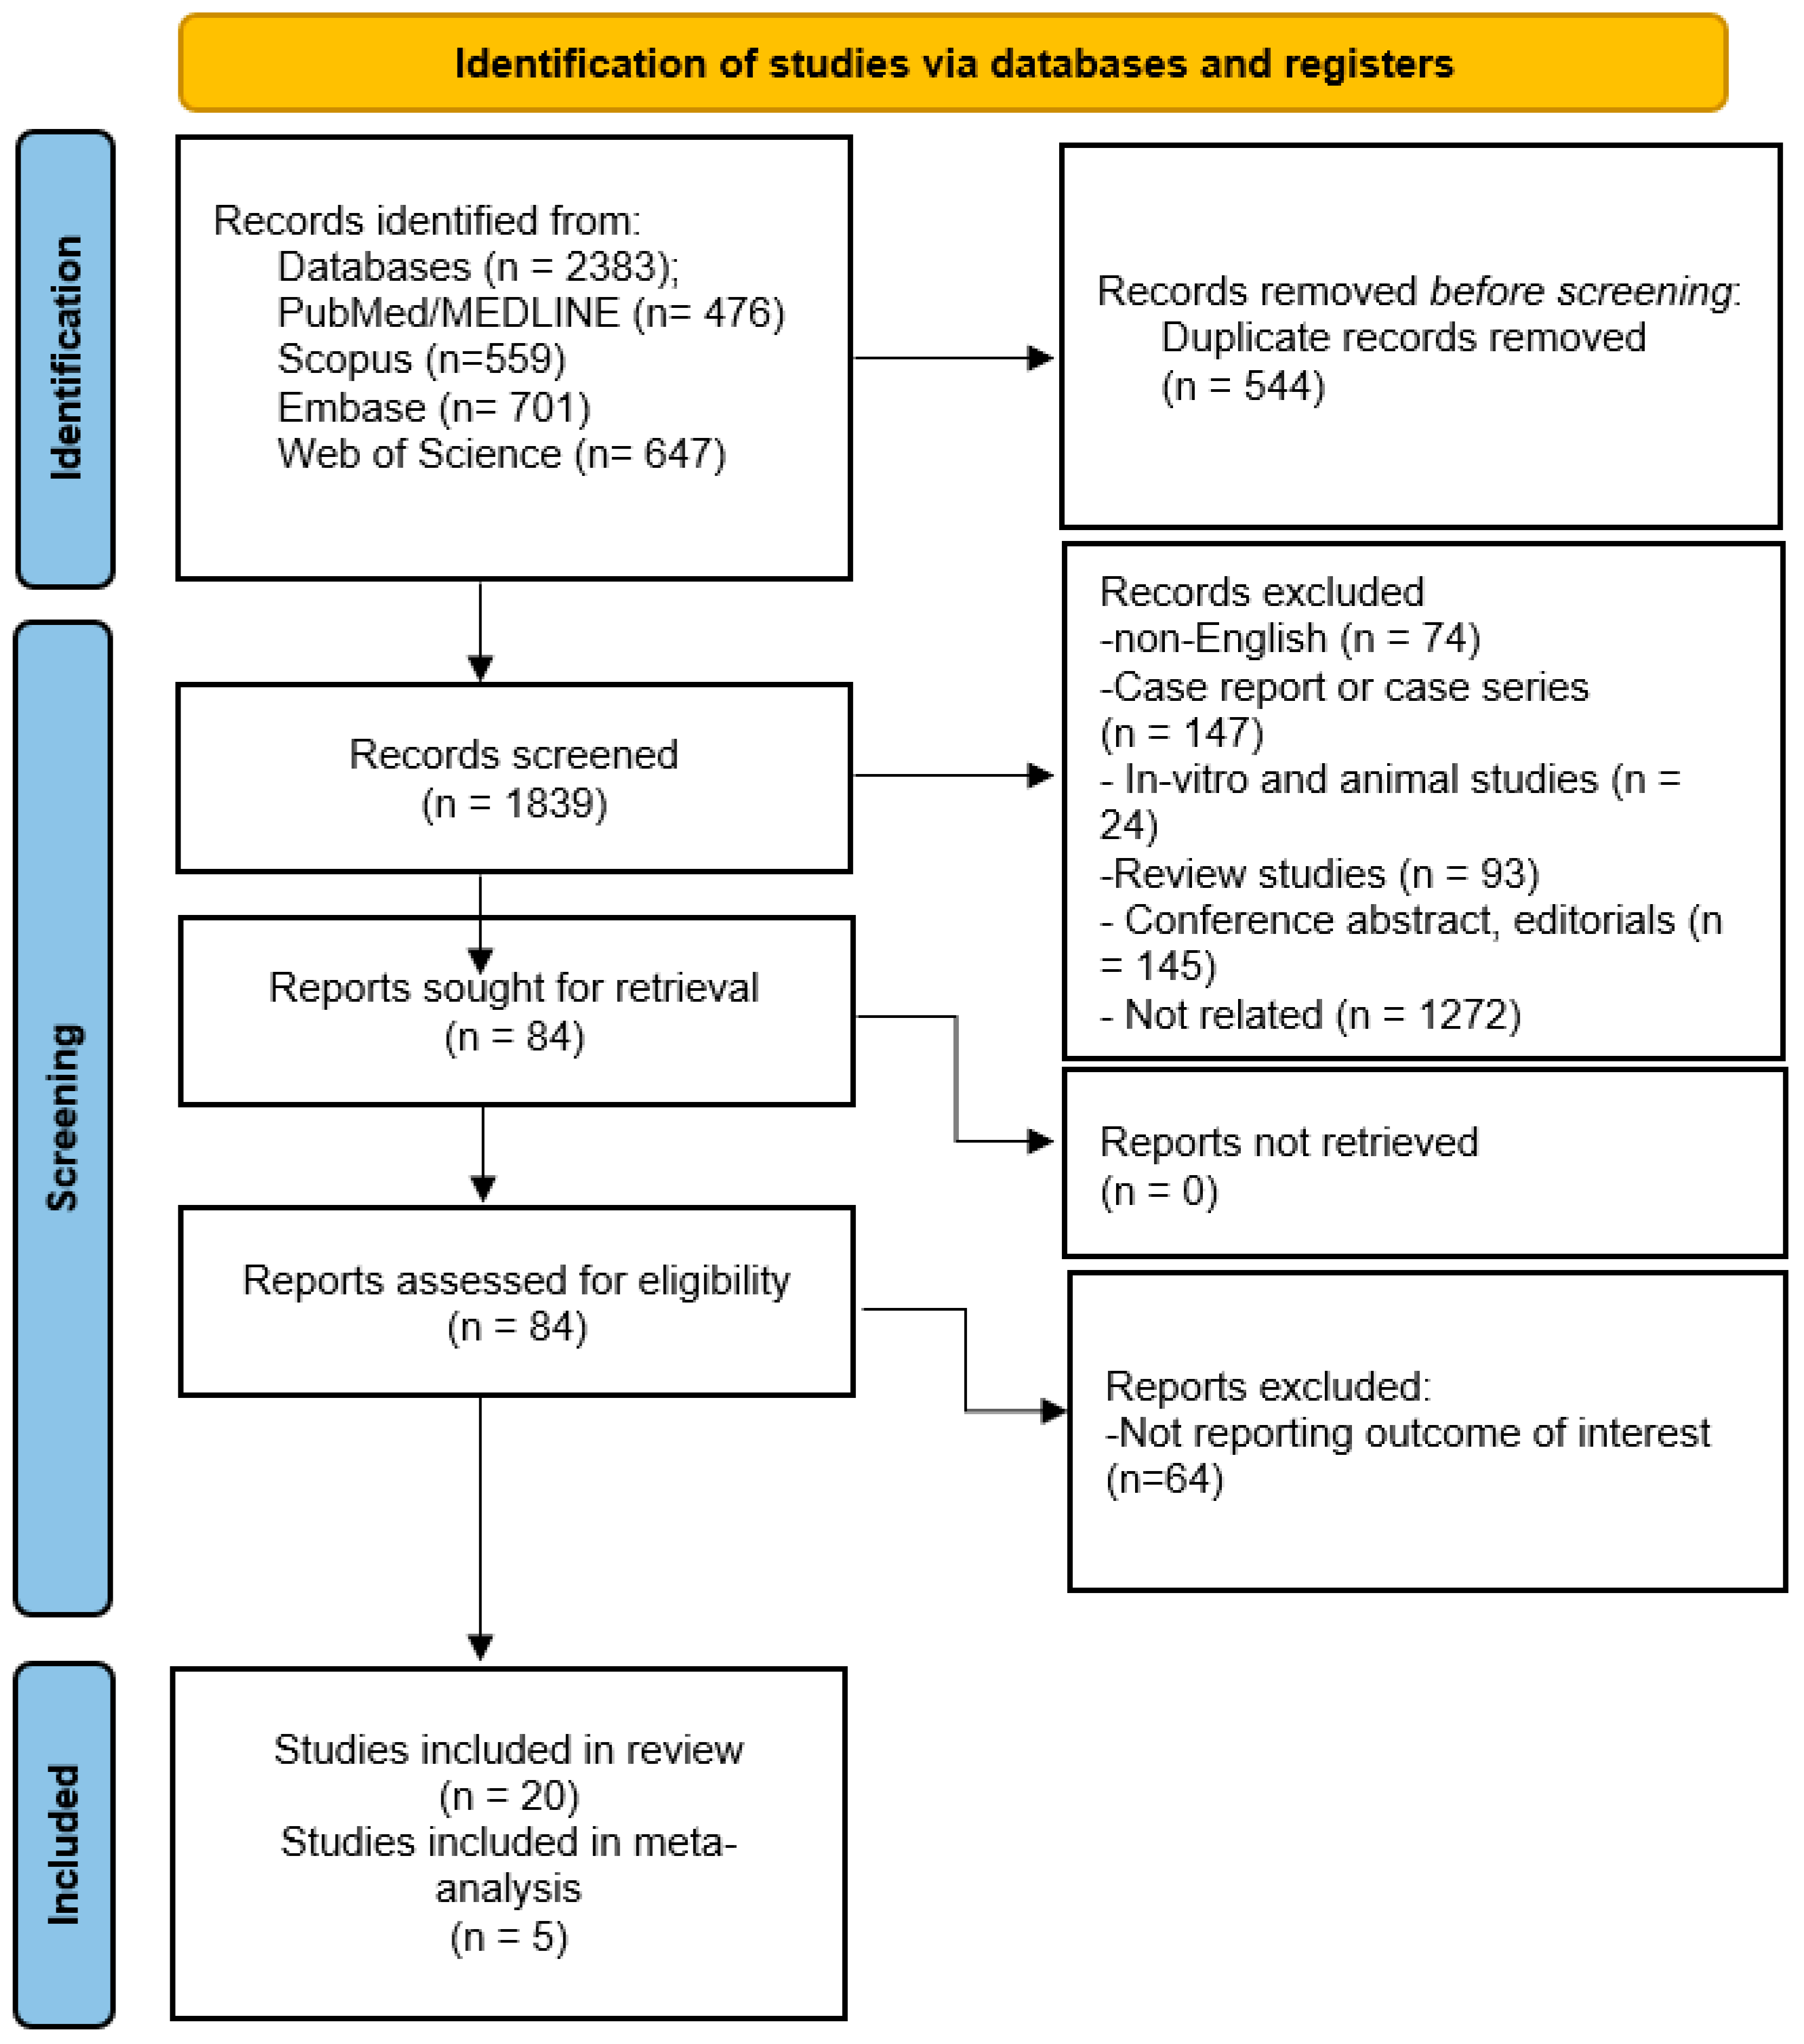
3.1. Literature Search and Study Selection
3.2. Characteristics of the Included Studies
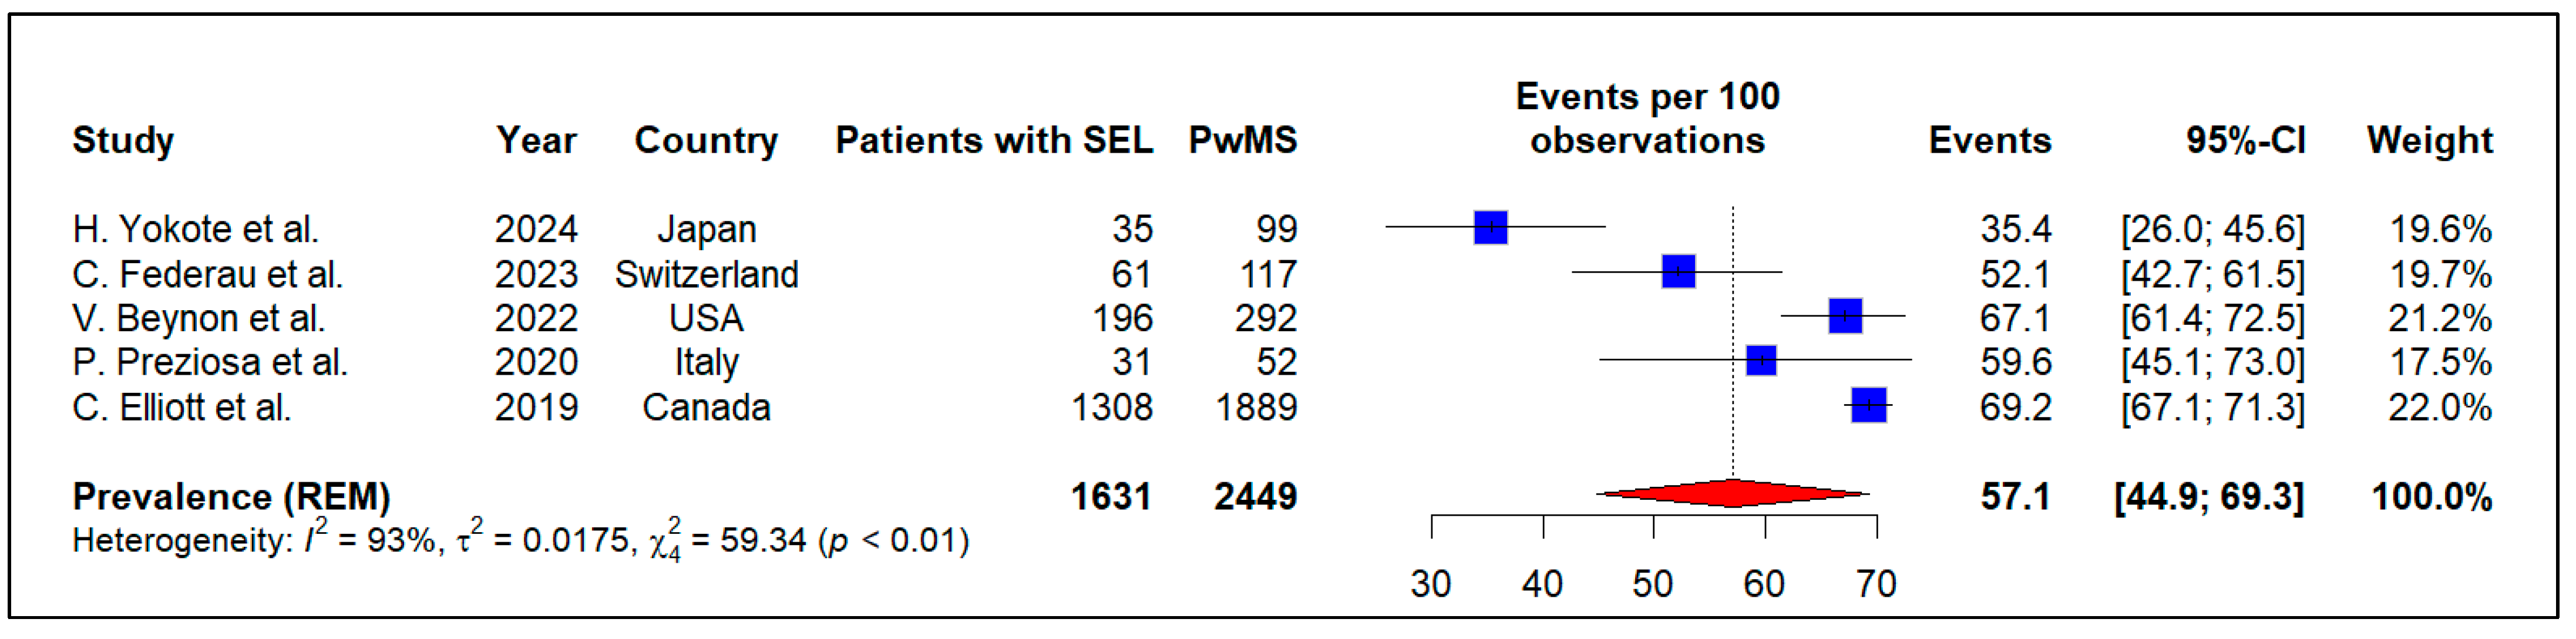
3.3. Data Synthesis
3.4. Narrative Synthesis of Findings
3.5. Risk of Bias Assessment
4. Discussion
4.1. Pathobiology and Cellular Mechanisms of SELs in MS
4.2. Clinical Consequences of SELs in MS
4.3. SELs and Disease-Modifying Therapies in MS
4.4. Prognostic Biomarkers in Multiple Sclerosis
5. Limitations and Directions for Future Research
6. Conclusions
Supplementary Materials
Author Contributions
Funding
Data Availability Statement
Acknowledgments
Conflicts of Interest
References
- Batran, R.A.; Kamel, M.; Bahr, A.; Waheb, J.; Khalil, A.; Elsokary, M. Multiple sclerosis: Economic burden, therapeutic advances, and future forecasts in the Middle East and North Africa region. Expert Rev. Pharmacoecon. Outcomes Res. 2024, 24, 873–882. [Google Scholar] [CrossRef] [Scilit] [PubMed]
- Koriem, K.M.M. Multiple sclerosis: New insights and trends. Asian Pac. J. Trop. Biomed. 2016, 6, 429–440. [Google Scholar] [CrossRef] [Scilit]
- Montalban, X.; Lebrun-Frénay, C.; Oh, J.; Arrambide, G.; Moccia, M.; Amato, M.P.; Amezcua, L.; Banwell, B.; Bar-Or, A.; Barkhof, F. Diagnosis of multiple sclerosis: 2024 revisions of the McDonald criteria. Lancet Neurol. 2025, 24, 850–865. [Google Scholar] [CrossRef] [Scilit] [PubMed]
- Barkhof, F.; Reich, D.S.; Oh, J.; Rocca, M.A.; Li, D.K.; Sati, P.; Azevedo, C.J.; Bagnato, F.; Calabresi, P.A.; Ciccarelli, O. 2024 MAGNIMS–CMSC–NAIMS consensus recommendations on the use of MRI for the diagnosis of multiple sclerosis. Lancet Neurol. 2025, 24, 866–879. [Google Scholar] [CrossRef] [Scilit]
- Weidauer, S.; Wagner, M.; Hattingen, E. White matter lesions in adults—A differential diagnostic approach. In RöFo-Fortschritte auf dem Gebiet der Röntgenstrahlen und der Bildgebenden Verfahren; Georg Thieme Verlag KG: Stuttgart, Germany, 2020; pp. 1154–1173. [Google Scholar]
- Elkady, A.M.; Elliott, C.; Fetco, D.; Araujo, D.; Karimaghaloo, Z.; Ganzetti, M.; Clayton, D.; Craveiro, L.; Kazlauskaite, A.; Narayanan, S. Longitudinal multiparametric quantitative MRI evaluation of acute and chronic multiple sclerosis paramagnetic rim lesions. J. Magn. Reson. Imaging 2025, 61, 1812–1828. [Google Scholar] [CrossRef] [Scilit]
- Sormani, M.P.; Bruzzi, P. MRI lesions as a surrogate for relapses in multiple sclerosis: A meta-analysis of randomised trials. Lancet Neurol. 2013, 12, 669–676. [Google Scholar] [CrossRef] [Scilit]
- Prineas, J.W. Pathology of multiple sclerosis. In Handbook of Multiple Sclerosis; CRC Press: Boca Raton, FL, USA, 2001; pp. 306–341. [Google Scholar]
- Bagnato, F.; Sati, P.; Hemond, C.C.; Elliott, C.; Gauthier, S.A.; Harrison, D.M.; Mainero, C.; Oh, J.; Pitt, D.; Shinohara, R.T. Imaging chronic active lesions in multiple sclerosis: A consensus statement. Brain 2024, 147, 2913–2933. [Google Scholar] [CrossRef] [Scilit]
- Dal-Bianco, A.; Oh, J.; Sati, P.; Absinta, M. Chronic active lesions in multiple sclerosis: Classification, terminology, and clinical significance. Ther. Adv. Neurol. Disord. 2024, 17, 17562864241306684. [Google Scholar] [CrossRef] [Scilit]
- Calvi, A. Chronic Active Lesions in Multiple Sclerosis: Novel MRI Markers. Ph.D. Thesis, UCL (University College London), London, UK, 2023. [Google Scholar]
- Martire, M.S.; Moiola, L.; Rocca, M.A.; Filippi, M.; Absinta, M. What is the potential of paramagnetic rim lesions as diagnostic indicators in multiple sclerosis? Expert Rev. Neurother. 2022, 22, 829–837. [Google Scholar] [CrossRef] [Scilit]
- Klistorner, S.; Barnett, M.H.; Yiannikas, C.; Barton, J.; Parratt, J.; You, Y.; Graham, S.L.; Klistorner, A. Expansion of chronic lesions is linked to disease progression in relapsing–remitting multiple sclerosis patients. Mult. Scler. J. 2021, 27, 1533–1542. [Google Scholar] [CrossRef] [Scilit]
- Anicăi, R.-C.; Ciubotaru, A.; Grosu, C.; Alexa, D.; Covali, R.; Păvăleanu, I.; Cucu, A.I.; Bobu, A.M.; Ghiciuc, C.M.; Leon, M.M. The Role of MRI Lesions in Identifying Secondary Progressive Multiple Sclerosis: A Comprehensive Review. J. Clin. Med. 2025, 14, 4114. [Google Scholar] [CrossRef] [Scilit] [PubMed]
- Rocca, M.A.; Preziosa, P.; Barkhof, F.; Brownlee, W.; Calabrese, M.; De Stefano, N.; Granziera, C.; Ropele, S.; Toosy, A.T.; Vidal-Jordana, À. Current and future role of MRI in the diagnosis and prognosis of multiple sclerosis. Lancet Reg. Health–Eur. 2024, 44, 100978. [Google Scholar] [CrossRef] [Scilit]
- Simmons, S.B.; Ontaneda, D. Slowly expanding lesions: A new target for progressive multiple sclerosis trials? Neurology 2022, 98, 699–700. [Google Scholar] [CrossRef] [Scilit]
- Nakamura, K.; Thoomukuntla, B.; Bena, J.; Cohen, J.A.; Fox, R.J.; Ontaneda, D. Ibudilast reduces slowly enlarging lesions in progressive multiple sclerosis. Mult. Scler. J. 2024, 30, 369–380. [Google Scholar] [CrossRef] [Scilit]
- Calvi, A.; Mendelsohn, Z.; Hamed, W.; Chard, D.; Tur, C.; Stutters, J.; MacManus, D.; Kanber, B.; Wheeler-Kingshott, C.A.G.; Barkhof, F. Treatment reduces the incidence of newly appearing multiple sclerosis lesions evolving into chronic active, slowly expanding lesions: A retrospective analysis. Eur. J. Neurol. 2024, 31, e16092. [Google Scholar] [CrossRef] [Scilit]
- Elliott, C.; Wolinsky, J.S.; Hauser, S.L.; Kappos, L.; Barkhof, F.; Bernasconi, C.; Wei, W.; Belachew, S.; Arnold, D.L. Slowly expanding/evolving lesions as a magnetic resonance imaging marker of chronic active multiple sclerosis lesions. Mult. Scler. J. 2019, 25, 1915–1925. [Google Scholar] [CrossRef] [Scilit]
- Page, M.J.; McKenzie, J.E.; Bossuyt, P.M.; Boutron, I.; Hoffmann, T.C.; Mulrow, C.D.; Shamseer, L.; Tetzlaff, J.M.; Akl, E.A.; Brennan, S.E. The PRISMA 2020 statement: An updated guideline for reporting systematic reviews. BMJ 2021, 372, n71. [Google Scholar] [CrossRef] [Scilit]
- Wells, G.A.; Shea, B.; O’Connell, D.; Peterson, J.; Welch, V.; Losos, M.; Tugwell, P. The Newcastle-Ottawa Scale (NOS) for Assessing the Quality of Nonrandomised Studies in Meta-Analyses. Ottawa Hospital Research Institute. Available online: https://ohri.ca/en/who-we-are/core-facilities-and-platforms/ottawa-methods-centre/newcastle-ottawa-scale (accessed on 2 March 2026).
- Balduzzi, S.; Rücker, G.; Schwarzer, G. How to perform a meta-analysis with R: A practical tutorial. BMJ Ment. Health 2019, 22, 153–160. [Google Scholar] [CrossRef] [Scilit]
- Huedo-Medina, T.B.; Sánchez-Meca, J.; Marin-Martinez, F.; Botella, J. Assessing heterogeneity in meta-analysis: Q statistic or I2 index? Psychol. Methods 2006, 11, 193. [Google Scholar] [CrossRef] [Scilit]
- Begg, C.B.; Mazumdar, M. Operating characteristics of a rank correlation test for publication bias. Biometrics 1994, 50, 1088–1101. [Google Scholar] [CrossRef] [Scilit]
- Egger, M.; Smith, G.D.; Schneider, M.; Minder, C. Bias in meta-analysis detected by a simple, graphical test. BMJ 1997, 315, 629–634. [Google Scholar] [CrossRef] [Scilit]
- Vavasour, I.; Elliott, C.; Arnold, D.L.; Gaetano, L.; Clayton, D.; Magon, S.; Bonati, U.; Bernasconi, C.; Traboulsee, A.; Kolind, S. Presence of slowly expanding lesions in multiple sclerosis predicts progressive demyelination within lesions and normal-appearing tissue over time. Mult. Scler. J. 2025, 31, 418–432. [Google Scholar] [CrossRef] [Scilit]
- Arnold, D.L.; Elliott, C.; Martin, E.C.; Hyvert, Y.; Tomic, D.; Montalban, X. Effect of evobrutinib on slowly expanding lesion volume in relapsing multiple sclerosis: A post hoc analysis of a phase 2 trial. Neurology 2024, 102, e208058. [Google Scholar] [CrossRef] [Scilit]
- Elliott, C.; Arnold, D.; Chen, H.; Ke, C.; Zhu, L.; Chang, I.; Cahir-McFarland, E.; Fisher, E.; Zhu, B.; Gheuens, S. Patterning chronic active demyelination in slowly expanding/evolving white matter MS lesions. Am. J. Neuroradiol. 2020, 41, 1584–1591. [Google Scholar] [CrossRef] [Scilit]
- Elliott, C.; Belachew, S.; Wolinsky, J.S.; Hauser, S.L.; Kappos, L.; Barkhof, F.; Bernasconi, C.; Fecker, J.; Model, F.; Wei, W. Chronic white matter lesion activity predicts clinical progression in primary progressive multiple sclerosis. Brain 2019, 142, 2787–2799. [Google Scholar] [CrossRef] [Scilit]
- Calvi, A.; Pascual, F.V.; Solana, E.; Lopez-Soley, E.; Kanber, B.; Alba-Arbalat, S.; Sepulveda, M.; Martínez-Hernández, E.; Cabrera-Maqueda, J.M.; Fonseca, E. Diffusivity anisotropy signature of the slowly expanding lesions predicts progression independent of relapse activity in multiple sclerosis. J. Neurol. Neurosurg. Psychiatry 2025, ahead of print. [Google Scholar] [CrossRef] [Scilit]
- Calvi, A.; Clarke, M.A.; Prados, F.; Chard, D.; Ciccarelli, O.; Alberich, M.; Pareto, D.; Rodríguez Barranco, M.; Sastre-Garriga, J.; Tur, C. Relationship between paramagnetic rim lesions and slowly expanding lesions in multiple sclerosis. Mult. Scler. J. 2023, 29, 352–362. [Google Scholar] [CrossRef] [Scilit]
- Calvi, A.; Tur, C.; Chard, D.; Stutters, J.; Ciccarelli, O.; Cortese, R.; Battaglini, M.; Pietroboni, A.; De Riz, M.; Galimberti, D. Slowly expanding lesions relate to persisting black-holes and clinical outcomes in relapse-onset multiple sclerosis. NeuroImage Clin. 2022, 35, 103048. [Google Scholar] [CrossRef] [Scilit]
- Calvi, A.; Carrasco, F.P.; Tur, C.; Chard, D.T.; Stutters, J.; De Angelis, F.; John, N.; Williams, T.; Doshi, A.; Samson, R.S. Association of slowly expanding lesions on MRI with disability in people with secondary progressive multiple sclerosis. Neurology 2022, 98, e1783–e1793. [Google Scholar] [CrossRef] [Scilit]
- Cross, A.H.; Gelfand, J.M.; Thebault, S.; Bennett, J.L.; Von Büdingen, H.C.; Cameron, B.; Carruthers, R.; Edwards, K.; Fallis, R.; Gerstein, R. Emerging cerebrospinal fluid biomarkers of disease activity and progression in multiple sclerosis. JAMA Neurol. 2024, 81, 373–383. [Google Scholar] [CrossRef] [Scilit]
- Huerta, M.M.; Conway, D.S.; Planchon, S.M.; Thoomukuntla, B.; Se-Hong, O.; Sakaie, K.E.; Ontaneda, D.; Nakamura, K. Longitudinal myelin content measures of slowly expanding lesions using 7T MRI in multiple sclerosis. J. Neuroimaging 2024, 34, 451–458. [Google Scholar] [CrossRef] [Scilit]
- Beynon, V.; George, I.C.; Elliott, C.; Arnold, D.L.; Ke, J.; Chen, H.; Zhu, L.; Ke, C.; Giovannoni, G.; Scaramozza, M. Chronic lesion activity and disability progression in secondary progressive multiple sclerosis. BMJ Neurol. Open 2022, 4, e000240. [Google Scholar] [CrossRef] [Scilit]
- Sethi, V.; Nair, G.; Absinta, M.; Sati, P.; Venkataraman, A.; Ohayon, J.; Wu, T.; Yang, K.; Shea, C.; Dewey, B.E. Slowly eroding lesions in multiple sclerosis. Mult. Scler. J. 2017, 23, 464–472. [Google Scholar] [CrossRef] [Scilit]
- Preziosa, P.; Pagani, E.; Meani, A.; Moiola, L.; Rodegher, M.; Filippi, M.; Rocca, M.A. Slowly expanding lesions predict 9-year multiple sclerosis disease progression. Neurol. Neuroimmunol. Neuroinflamm. 2022, 9, e1139. [Google Scholar] [CrossRef] [Scilit]
- Preziosa, P.; Pagani, E.; Moiola, L.; Rodegher, M.; Filippi, M.; Rocca, M.A. Occurrence and microstructural features of slowly expanding lesions on fingolimod or natalizumab treatment in multiple sclerosis. Mult. Scler. J. 2021, 27, 1520–1532. [Google Scholar] [CrossRef] [Scilit]
- Yokote, H.; Miyazaki, Y.; Fujimori, J.; Nishida, Y.; Toru, S.; Niino, M.; Nakashima, I.; Miura, Y.; Yokota, T. Slowly expanding lesions are associated with disease activity and gray matter loss in relapse-onset multiple sclerosis. J. Neuroimaging 2024, 34, 758–765. [Google Scholar] [CrossRef] [Scilit]
- Federau, C.; Hainc, N.; Edjlali, M.; Zhu, G.; Mastilovic, M.; Nierobisch, N.; Uhlemann, J.-P.; Paganucci, S.; Granziera, C.; Heinzlef, O. Improved Multiple Sclerosis Lesion Detection using an Intelligent Automation Software. medRxiv 2022. [Google Scholar] [CrossRef] [Scilit]
- Klistorner, S.; Klistorner, A. Modelling axonal loss caused by chronic demyelination and slow-burning inflammation at the rim of chronic lesions in MS patients. medRxiv 2023. [Google Scholar] [CrossRef] [Scilit]
- Weber, C.E.; Wittayer, M.; Kraemer, M.; Dabringhaus, A.; Bail, K.; Platten, M.; Schirmer, L.; Gass, A.; Eisele, P. Long-term dynamics of multiple sclerosis iron rim lesions. Mult. Scler. Relat. Disord. 2022, 57, 103340. [Google Scholar] [CrossRef] [Scilit]
- Pukoli, D.; Vécsei, L. Smouldering lesion in MS: Microglia, lymphocytes and pathobiochemical mechanisms. Int. J. Mol. Sci. 2023, 24, 12631. [Google Scholar] [CrossRef] [Scilit]
- Machado-Santos, J.; Saji, E.; Tröscher, A.R.; Paunovic, M.; Liblau, R.; Gabriely, G.; Bien, C.G.; Bauer, J.; Lassmann, H. The compartmentalized inflammatory response in the multiple sclerosis brain is composed of tissue-resident CD8+ T lymphocytes and B cells. Brain 2018, 141, 2066–2082. [Google Scholar] [CrossRef] [Scilit]
- Giovannoni, G.; Popescu, V.; Wuerfel, J.; Hellwig, K.; Iacobaeus, E.; Jensen, M.B.; García-Domínguez, J.M.; Sousa, L.; De Rossi, N.; Hupperts, R. Smouldering multiple sclerosis: The ‘real MS’. Ther. Adv. Neurol. Disord. 2022, 15, 17562864211066751. [Google Scholar] [CrossRef] [Scilit]
- Calvi, A.; Haider, L.; Prados, F.; Tur, C.; Chard, D.; Barkhof, F. In vivo imaging of chronic active lesions in multiple sclerosis. Mult. Scler. J. 2022, 28, 683–690. [Google Scholar] [CrossRef] [Scilit]
- Kwong, K.C.N.K.; Mollison, D.; Meijboom, R.; York, E.N.; Kampaite, A.; Thrippleton, M.J.; Chandran, S.; Waldman, A.D. The prevalence of paramagnetic rim lesions in multiple sclerosis: A systematic review and meta-analysis. PLoS ONE 2021, 16, e0256845. [Google Scholar] [CrossRef] [Scilit]
- Müller, J.; Cagol, A.; Lorscheider, J.; Tsagkas, C.; Benkert, P.; Yaldizli, Ö.; Kuhle, J.; Derfuss, T.; Sormani, M.P.; Thompson, A. Harmonizing definitions for progression independent of relapse activity in multiple sclerosis: A systematic review. JAMA Neurol. 2023, 80, 1232–1245. [Google Scholar] [CrossRef] [Scilit]
- Jiang, F.; Zhang, F.; Su, Y.; Zhang, C.; Chang, T. Knowledge mapping of disease-modifying therapy (DMT) in multiple sclerosis (MS): A bibliometrics analysis. Heliyon 2024, 10, e31744. [Google Scholar] [CrossRef] [Scilit]
- Oh, J.; Fox, R.J.; Arnold, D.L.; Syed, S.; Dukovic, D.; Vargas, W.S.; Turner, T.J.; Underwood, C.F.; Long, T.M.; Traboulsee, A.L. Tolebrutinib Phase 2b Long-Term Extension Study: Two-Year Safety, MRI, and Clinical Efficacy Outcomes in Patients with Relapsing Multiple Sclerosis. Neurol. Open Access 2025, 1, e000028. [Google Scholar] [CrossRef] [Scilit]
- Cronin, M.J.; Wharton, S.; Al-Radaideh, A.; Constantinescu, C.; Evangelou, N.; Bowtell, R.; Gowland, P.A. A comparison of phase imaging and quantitative susceptibility mapping in the imaging of multiple sclerosis lesions at ultrahigh field. Magn. Reson. Mater. Phys. Biol. Med. 2016, 29, 543–557. [Google Scholar] [CrossRef] [Scilit]
- Wenzel, N.; Wittayer, M.; Weber, C.E.; Platten, M.; Gass, A.; Eisele, P. Multiple sclerosis iron rim lesions are linked to impaired cervical spinal cord integrity using the T1/T2-weighted ratio. J. Neuroimaging 2022, 33, 240–246. [Google Scholar] [CrossRef] [Scilit]
- Okar, S.V.; Dieckhaus, H.B.; Beck, E.S.; Gaitán, M.I.; Norato, G.S.; Pham, D.L.; Absinta, M.; Cortese, I.C.; Fletcher, A.; Jacobson, S.; et al. Highly Sensitive 3-Tesla Real Inversion Recovery MRI Detects Leptomeningeal Contrast Enhancement in Chronic Active Multiple Sclerosis. Investig. Radiol. 2024, 59, 243–251. [Google Scholar] [CrossRef] [Scilit]
- Valizadeh, A.; Moassefi, M.; Barati, E.; Sahraian, M.A.; Aghajani, F.; Fattahi, M. Correlation between the clinical disability and T1 hypointense lesions’ volume in cerebral magnetic resonance imaging of multiple sclerosis patients: A systematic review and meta-analysis. CNS Neurosci. Ther. 2021, 27, 1268–1280. [Google Scholar] [CrossRef] [Scilit]
- Freedman, M.S.; Gnanapavan, S.; Booth, R.A.; Calabresi, P.A.; Khalil, M.; Kuhle, J.; Lycke, J.; Olsson, T. Guidance for use of neurofilament light chain as a cerebrospinal fluid and blood biomarker in multiple sclerosis management. EBioMedicine 2024, 101, 104970. [Google Scholar] [CrossRef] [Scilit] [PubMed]
- Meier, S.; Willemse, E.A.; Schaedelin, S.; Oechtering, J.; Lorscheider, J.; Melie-Garcia, L.; Cagol, A.; Barakovic, M.; Galbusera, R.; Subramaniam, S.; et al. Serum Glial Fibrillary Acidic Protein Compared With Neurofilament Light Chain as a Biomarker for Disease Progression in Multiple Sclerosis. JAMA Neurol. 2023, 80, 287–297. [Google Scholar] [CrossRef] [Scilit]
- Dobson, R.; Ramagopalan, S.; Davis, A.; Giovannoni, G. Cerebrospinal fluid oligoclonal bands in multiple sclerosis and clinically isolated syndromes: A meta-analysis of prevalence, prognosis and effect of latitude. J. Neurol. Neurosurg. Psychiatry 2013, 84, 909–914. [Google Scholar] [CrossRef] [Scilit]
- Fonderico, M.; Portaccio, E.; Razzolini, L.; Pastò, L.; Bellinvia, A.; Addazio, I.; Betti, M.; Aprea, M.G.; Ballerini, C.; Biagioli, T.; et al. Cerebrospinal Fluid IgM and Oligoclonal IgG Bands in Multiple Sclerosis: A Meta-Analysis of Prevalence and Prognosis. Brain Sci. 2021, 11, 1444. [Google Scholar] [CrossRef] [Scilit]
- Karrenbauer, V.D.; Bedri, S.K.; Hillert, J.; Manouchehrinia, A. Cerebrospinal fluid oligoclonal immunoglobulin gamma bands and long-term disability progression in multiple sclerosis: A retrospective cohort study. Sci. Rep. 2021, 11, 14987. [Google Scholar] [CrossRef] [Scilit] [PubMed]
- Ziccardi, S.; Tamanti, A.; Ruggieri, C.; Guandalini, M.; Marastoni, D.; Camera, V.; Montibeller, L.; Mazziotti, V.; Rossi, S.; Calderone, M.; et al. CSF Parvalbumin Levels at Multiple Sclerosis Diagnosis Predict Future Worse Cognition, Physical Disability, Fatigue, and Gray Matter Damage. Neurol.–Neuroimmunol. Neuroinflamm. 2024, 11, e200301. [Google Scholar] [CrossRef] [Scilit]
- Rosenstein, I.; Axelsson, M.; Novakova, L.; Malmeström, C.; Blennow, K.; Zetterberg, H.; Lycke, J. Intrathecal kappa free light chain synthesis is associated with worse prognosis in relapsing–remitting multiple sclerosis. J. Neurol. 2023, 270, 4800–4811. [Google Scholar] [CrossRef] [Scilit]
- Huss, A.; Otto, M.; Senel, M.; Ludolph, A.C.; Abdelhak, A.; Tumani, H. A Score Based on NfL and Glial Markers May Differentiate Between Relapsing–Remitting and Progressive MS Course. Front. Neurol. 2020, 11, 608. [Google Scholar] [CrossRef] [Scilit] [PubMed]
- Moases Ghaffary, E.; Foroughi, E.; Fekri, M.; Shaygannejad, V.; Mirmosayyeb, O. Transforming Multiple Sclerosis Management through Artificial Intelligence: A Comprehensive Narrative Review of Clinical, Imaging, Digital, and Molecular Applications. Appl. Med. Inform. 2025, 47, 4. [Google Scholar]
- Magliozzi, R.; Howell, O.W.; Nicholas, R.; Cruciani, C.; Castellaro, M.; Romualdi, C.; Rossi, S.; Pitteri, M.; Benedetti, M.D.; Gajofatto, A.; et al. Inflammatory intrathecal profiles and cortical damage in multiple sclerosis. Ann. Neurol. 2018, 83, 739–755. [Google Scholar] [CrossRef] [Scilit]
- E Leurs, C.; Podlesniy, P.; Trullas, R.; Balk, L.; Steenwijk, M.D.; Malekzadeh, A.; Piehl, F.; Uitdehaag, B.M.; Killestein, J.; van Horssen, J.; et al. Cerebrospinal fluid mtDNA concentration is elevated in multiple sclerosis disease and responds to treatment. Mult. Scler. J. 2017, 24, 472–480. [Google Scholar] [CrossRef] [Scilit] [PubMed]
- Albanese, M.; Zagaglia, S.; Landi, D.; Boffa, L.; Nicoletti, C.G.; Marciani, M.G.; Mandolesi, G.; Marfia, G.A.; Buttari, F.; Mori, F.; et al. Cerebrospinal fluid lactate is associated with multiple sclerosis disease progression. J. Neuroinflamm. 2016, 13, 36. [Google Scholar] [CrossRef] [Scilit] [PubMed]
- Guerra, T.; Copetti, M.; Achille, M.; Ferri, C.; Simone, M.; D’alfonso, S.; Pugliatti, M.; Iaffaldano, P. Refining Prognostic Factors in Adult-Onset Multiple Sclerosis: A Narrative Review of Current Insights. Int. J. Mol. Sci. 2025, 26, 7756. [Google Scholar] [CrossRef] [Scilit] [PubMed]



| First Author | Year | Country | Study Design | Sample Size, F:M, Age; Mean (SD) | MS Subtype (n) | EDSS; Mean (SD) | Disease Duration (Years); Mean (SD) | MRI Device | Software of MRI Analysis | SEL Definition | Major Findings | QA |
|---|---|---|---|---|---|---|---|---|---|---|---|---|
| I. Vavasour [26] | 2025 | Canada | Cohort | 50 31:19 40.1 (9.2) | RRMS: 50 | 2 (0–4.5) * | NR | Philips 3T | NR | Persistent, concentric expanding lesions. | SEL showed ongoing demyelination and MS progression. | 8 |
| A. Calvi [30] | 2025 | UK | Cohort | 130 93:37 41.5 (34.6–49.2) ** | RRMS: 117 PMS: 13 | 1.5 (1–2) ** | 6.8 (2.8–13.5) ** | Siemens 3T | Jim 7 | Lesions that gradually expand radially over time. | Definite SELs exhibit greater microstructural damage and are linked to PIRA. | 8 |
| D. L. Arnold [27] | 2024 | Canada | Cross-sectional | 53 36:17 42.2 (11.5) | RRMS: 47 SPMS: 6 | NR | NR | NR | NR | Progressive expansile T2 lesions detected on MRI. | NR | 7 |
| A. Cross [34] | 2024 | USA | Cohort | 131 84:47 38.5 (9.6) | RRMS: 100 PPMS: 31 | NR | NR | NR | NR | Lesions that gradually expand radially over time, representing chronic active lesions. | Higher SEL count is related to the elevation of Neurodegeneration. | 8 |
| H. Yokote [40] | 2024 | Japan | Cohort | 99 72:27 40.2 (8.5) | NR | 2 (1.7) | 9.5 (7) | GE 3T | FreeSurfer 7.1.1 (Boston, MA, US) | Progressive expansile T2 lesions detected on MRI. | The number of SELs could be a biomarker of disease activity in PwMS. | 8 |
| K. Nakamura [17] | 2024 | USA | RCT | 195 112:83 55.9 (7) | SPMS: 88 PPMS: 107 | 6 (4–6) ** | NR | Siemens 3T | ANTs NR | Progressive expansile T2 lesions detected on MRI. | Ibudilast significantly reduced SEL volume. | 8 |
| A. Calvi [18] | 2023 | UK | Cohort | 170 95:75 48 (27–64) * | PPMS: 170 | 4 (3–6.5) ** | NR | Siemens 3T | Jim 7 | Progressive expansile T2 lesions detected on MRI. | . Fingolimod treatment was linked to reduced SEL volume. | 7 |
| C. Federau [41] | 2023 | Switzerland | Cross-sectional | 117 81:36 51.9 (11.7) | SPMS: 117 | NR | NR | NR | Jazz NR | Preexisting white matter lesions showing expansion between prior and current examinations. | NR | 7 |
| S. Klistorner [42] | 2023 | Australia | Cohort | 52 32:20 41.7 (9.1) | RRMS: 52 | 1 (0–4) * | 5.5 (4.1) | GE 3T | Jim 9 (Xinapse Systems, Essex, UK) | Lesions reflecting ongoing low-grade demyelination activity. | Slow-burning inflammation at the lesion rim takes role in axonal irritation. | 7 |
| A. Calvi [31] | 2022 | UK | Cross-sectional | 61 42:19 34.4 (14.1–64.9) * | RRMS: 61 | 1.5 (0–5.5) * | 0.4 (0.1–16.6) * | Siemens 3T | Jim 7 | Progressive expansile lesions detected on MRI. | Increasing SEL volume, indicating a possible link between chronic inflammation and global neuroaxonal damage. | 8 |
| P. Preziosa [38] | 2022 | Italy | Cohort | 52 30:22 36.8 (9.7) | RRMS: 52 | 2 (1–4) ** | 9.8 (6.5) | Philips 3T | Jim 7 | Lesions that gradually expand radially over time. | This study showed an increased risk of EDSS progression associated with SEL during follow-up. | 7 |
| M. Huerta [35] | 2022 | USA | Cohort | 15 12:3 42.4 (5.6) | RRMS: 15 | 3 (1.5–3.5) ** | 8.5 (4.1) | Siemens 7T | In house method | Concentric expansile lesions over time on MRI. | PwMS with SELs showed more extensive demyelination than without one. | 6 |
| V. Beynon [36] | 2022 | USA | Cohort | 600 NR | SPMS: 600 | NR | NR | NR 3T | NR | Concentric expansile lesions over time on MRI. | Natalizumab reduced the prevalence of SELs. | 8 |
| A. Calvi [32] | 2022 | UK | Cohort | 135 99:36 35.5 (9) | RRMS: 135 | 1.5 (0–5.5) ** | 5.5 (0–32.5) α | Siemens 3T | Jim 7 | Lesions that gradually expand over time. | Higher SEL volumes are associated with clinical progression, while lower ones are associated with stability in relapse-onset MS. | 8 |
| A. Calvi [33] | 2022 | UK | Cohort | 345 230:115 55.9 (50–60.4) ** | SPMS: 345 | 6 (5.5–6.5) ** | 21 (15–22) ** | Siemens 3T | Jim 7 | Progressive expansile lesions detected on MRI. | Definite SELs comprise about one-third of T2 lesions in SPMS. | 8 |
| C. Elliott [28] | 2020 | Canada | Cohort | 299 194:105 NR | RRMS:242 SPMS:57 | NR | NR | NR | NR | SELs lack a standardized definition across centers, limiting cross-study comparisons. | SELs exhibited reduced magnetization transfer ratios and increased radial diffusivity on DTR. | 9 |
| P. Preziosa [39] | 2020 | Italy | Cohort | 52 30:22 36.8 (9.6) | RRMS: 52 | NR | 2.2 (1.7) | Philips 3T | Jim 7 | Lesions with ≥10 voxels growing ≥12.5% annually over 2 years. | In PwMS, SELs showed reduced MTR and T1 signal intensity compared to non-SELs. | 7 |
| C. Elliott [19] | 2019 | Canada | Cohort | 1889 1149:740 39.5 (8.8) | RRMS: 1334 PMS: 555 | 3.2 (1.3) | 6.5 (5.3) | NR | NR | T2 lesions with slow, continuous outward expansion. | The number of SELs was greater in patients with PPMS. | 9 |
| C. Elliott [29] | 2019 | Canada | Cohort | 555 276:279 45 (7.9) | PPMS: 555 | 4.6 (1.2) | 6.1 (3.7) | NR | NR | Lesions with ≥10 voxels expanding ≥12.5% per year over 2 years. | The proportion of patients with “all SEL candidates” was similar between the ocrelizumab and placebo groups. | 8 |
| V. Sethi [37] | 2016 | USA | Cohort | 22 14:8 32 (9) | RRMS:12 SPMS:10 | NR | NR | GE Siemens Philips 3T 1.5T | Jim 7 | SELs with minimal edge inflammation and microglial activity. | Gradual erosion of existing lesions alone does not fully explain tissue loss. | 6 |
Disclaimer/Publisher’s Note: The statements, opinions and data contained in all publications are solely those of the individual author(s) and contributor(s) and not of MDPI and/or the editor(s). MDPI and/or the editor(s) disclaim responsibility for any injury to people or property resulting from any ideas, methods, instructions or products referred to in the content. |
© 2026 by the authors. Licensee MDPI, Basel, Switzerland. This article is an open access article distributed under the terms and conditions of the Creative Commons Attribution (CC BY) license.
Share and Cite
Yazdan Panah, M.; Fekri, M.; Zahedi, Z.; Bagheri, H.; Vaheb, S.; Mahmoudi, F.; Shaygannejad, V.; Mirmosayyeb, O. Slowly Expanding Lesions in Multiple Sclerosis: A Systematic Review and Meta-Analysis. NeuroSci 2026, 7, 34. https://doi.org/10.3390/neurosci7020034
Yazdan Panah M, Fekri M, Zahedi Z, Bagheri H, Vaheb S, Mahmoudi F, Shaygannejad V, Mirmosayyeb O. Slowly Expanding Lesions in Multiple Sclerosis: A Systematic Review and Meta-Analysis. NeuroSci. 2026; 7(2):34. https://doi.org/10.3390/neurosci7020034
Chicago/Turabian StyleYazdan Panah, Mohammad, Mehra Fekri, Zahra Zahedi, Hossein Bagheri, Saeed Vaheb, Farhad Mahmoudi, Vahid Shaygannejad, and Omid Mirmosayyeb. 2026. "Slowly Expanding Lesions in Multiple Sclerosis: A Systematic Review and Meta-Analysis" NeuroSci 7, no. 2: 34. https://doi.org/10.3390/neurosci7020034
APA StyleYazdan Panah, M., Fekri, M., Zahedi, Z., Bagheri, H., Vaheb, S., Mahmoudi, F., Shaygannejad, V., & Mirmosayyeb, O. (2026). Slowly Expanding Lesions in Multiple Sclerosis: A Systematic Review and Meta-Analysis. NeuroSci, 7(2), 34. https://doi.org/10.3390/neurosci7020034