
How Do We Connect Brain Areas with Cognitive Functions? The Past, the Present and the Future


Abstract
:1. Introduction
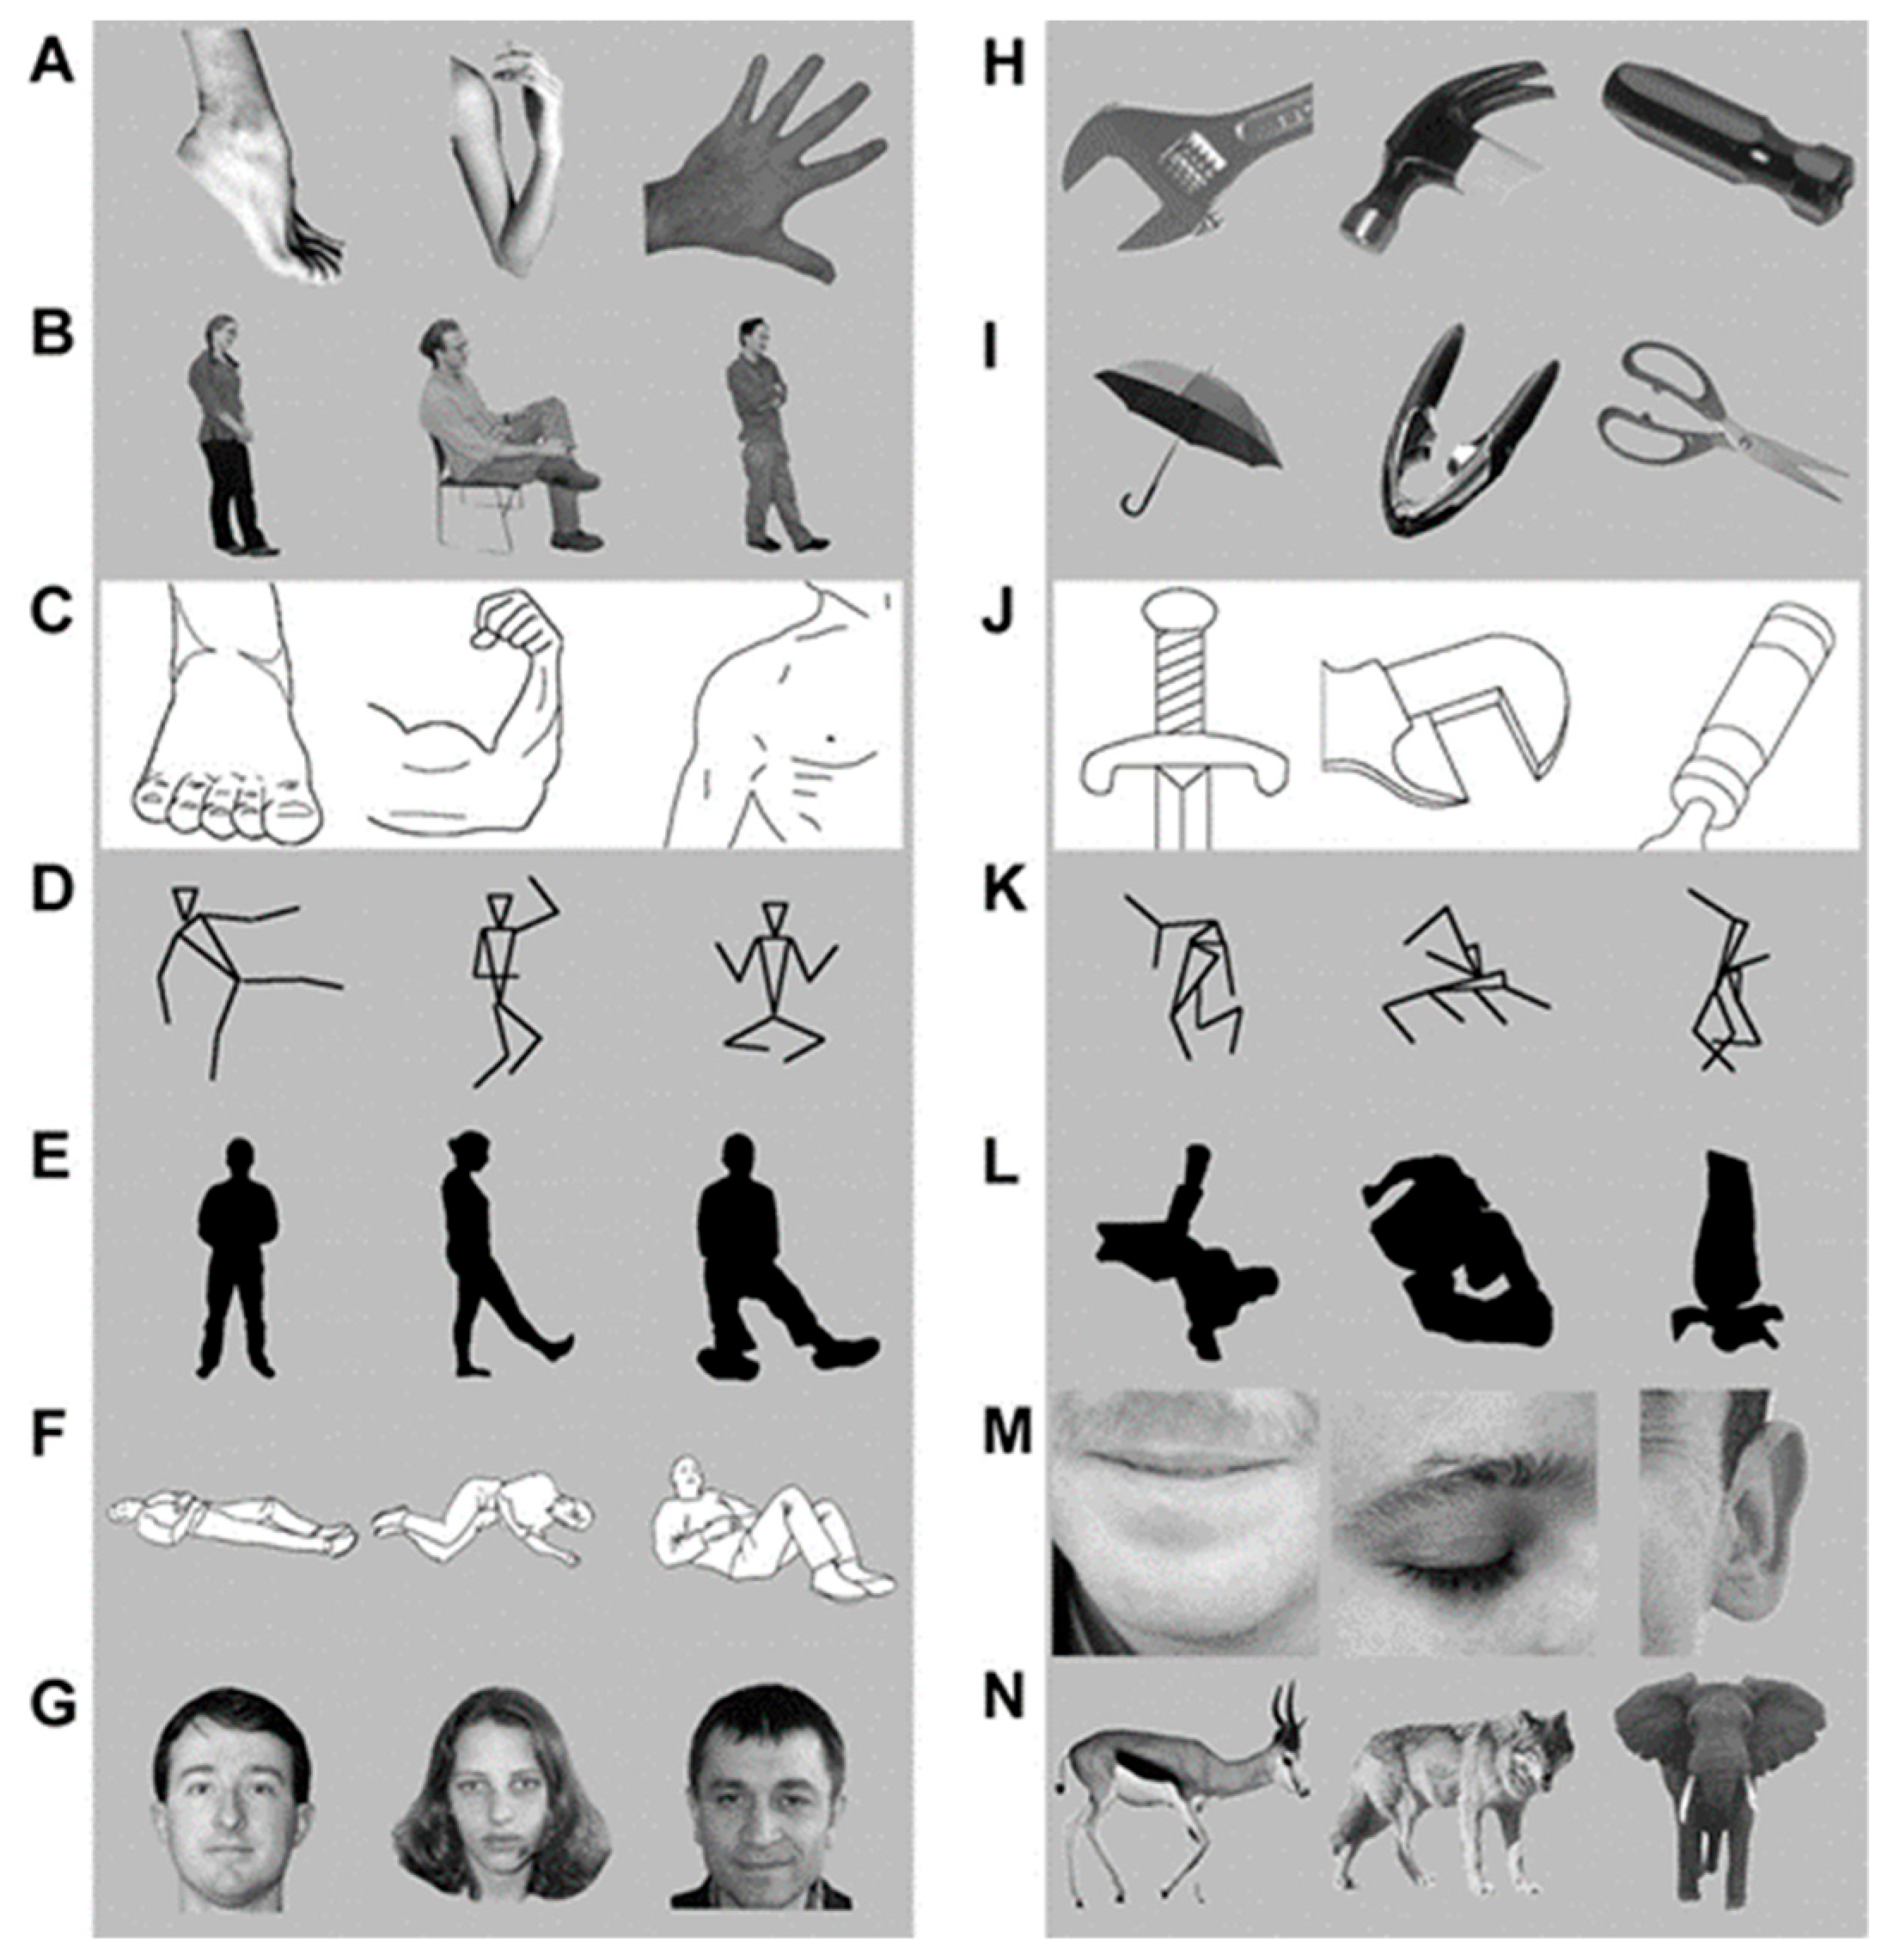
1.1. Characterizing Cognition
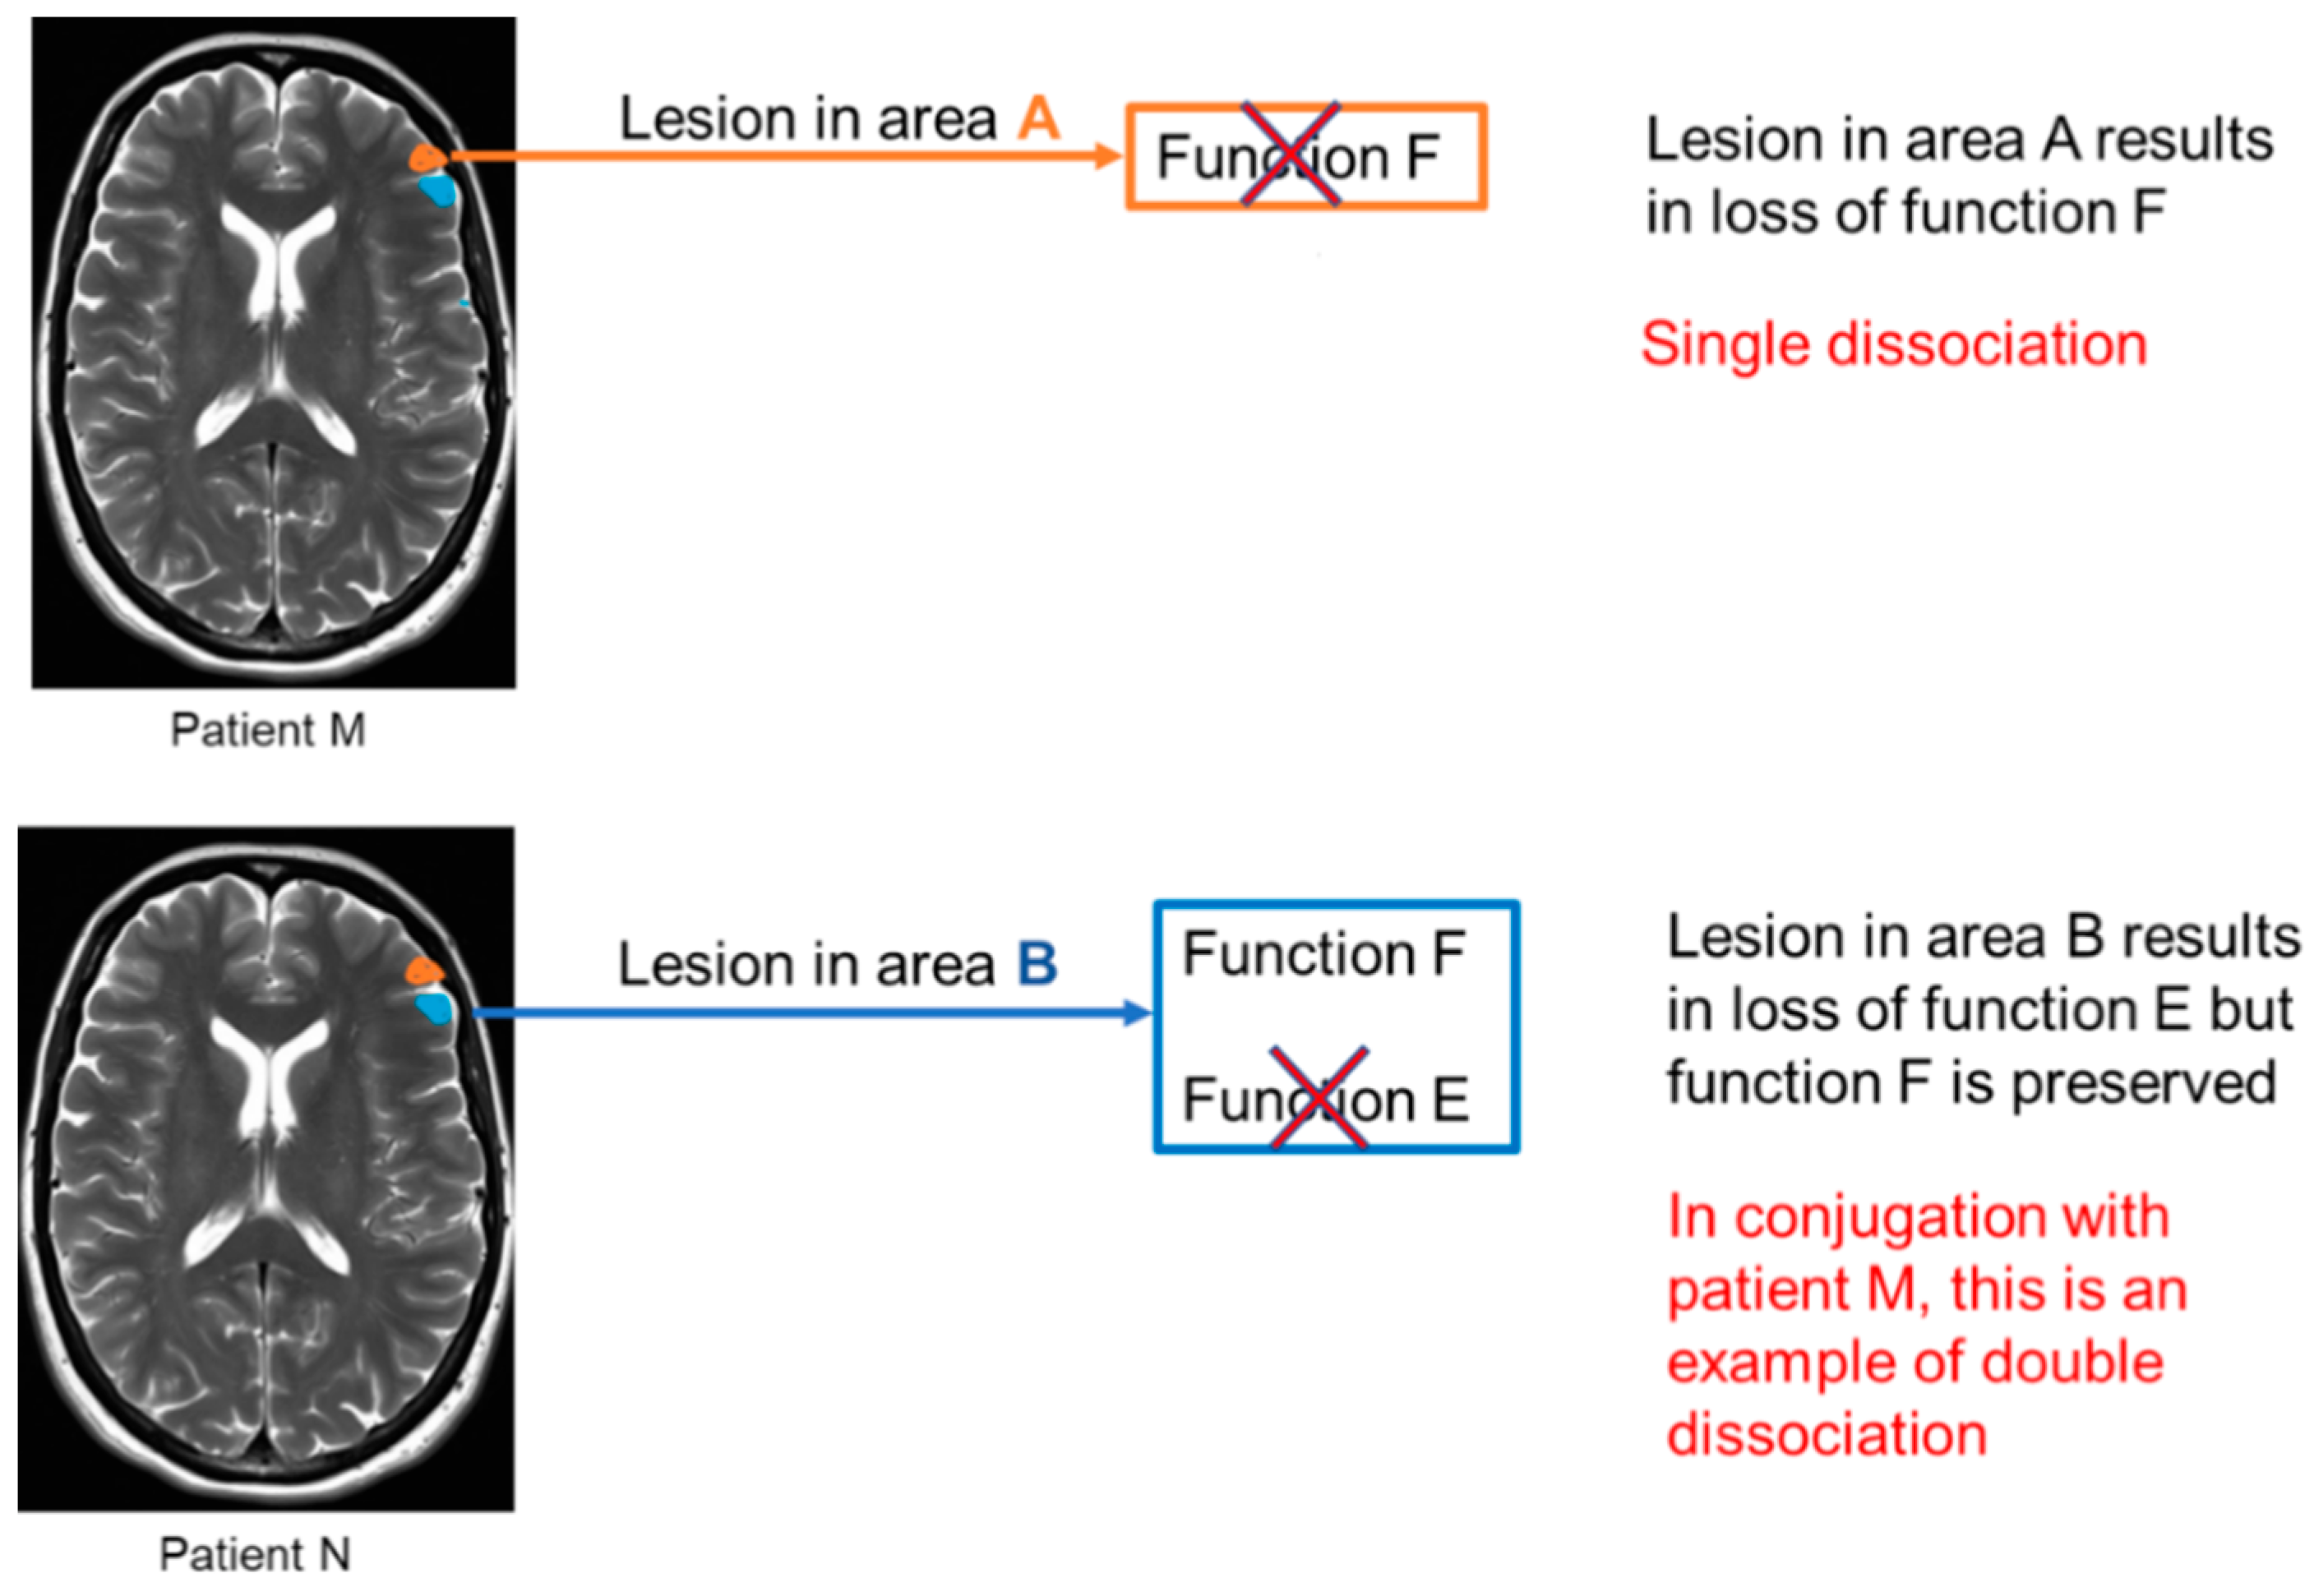
1.2. Theoretical Model
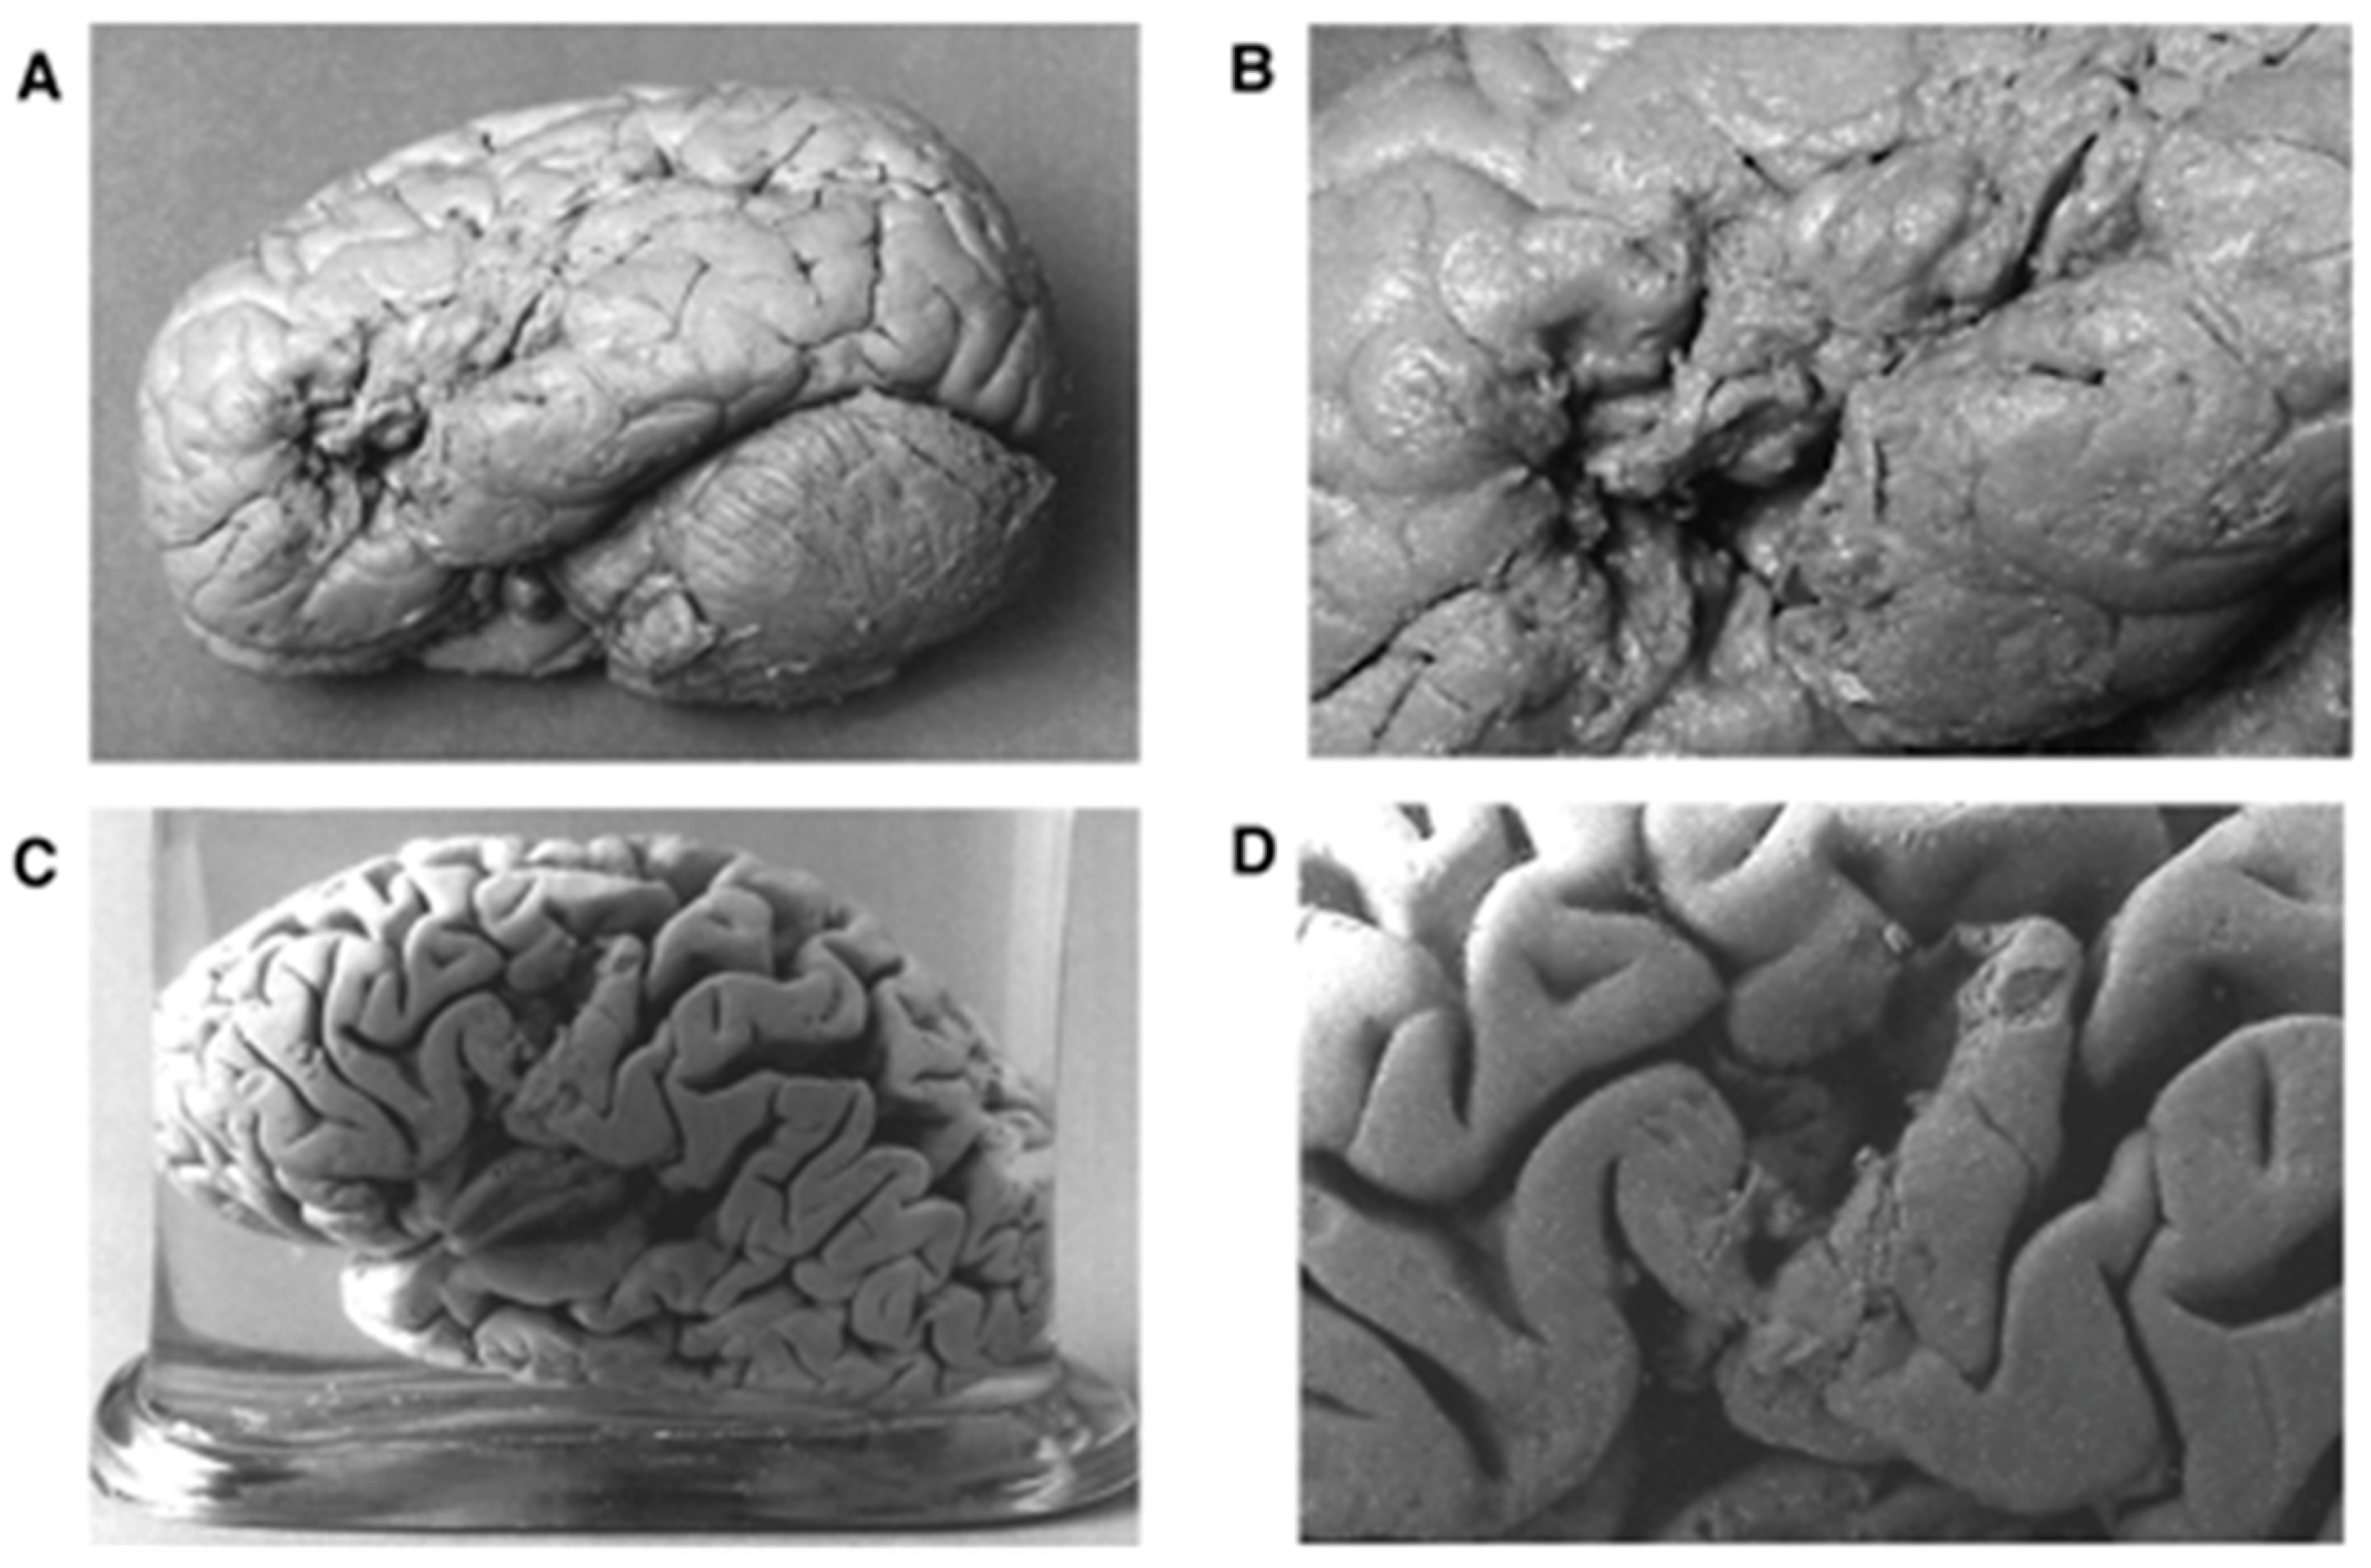
2. The Past
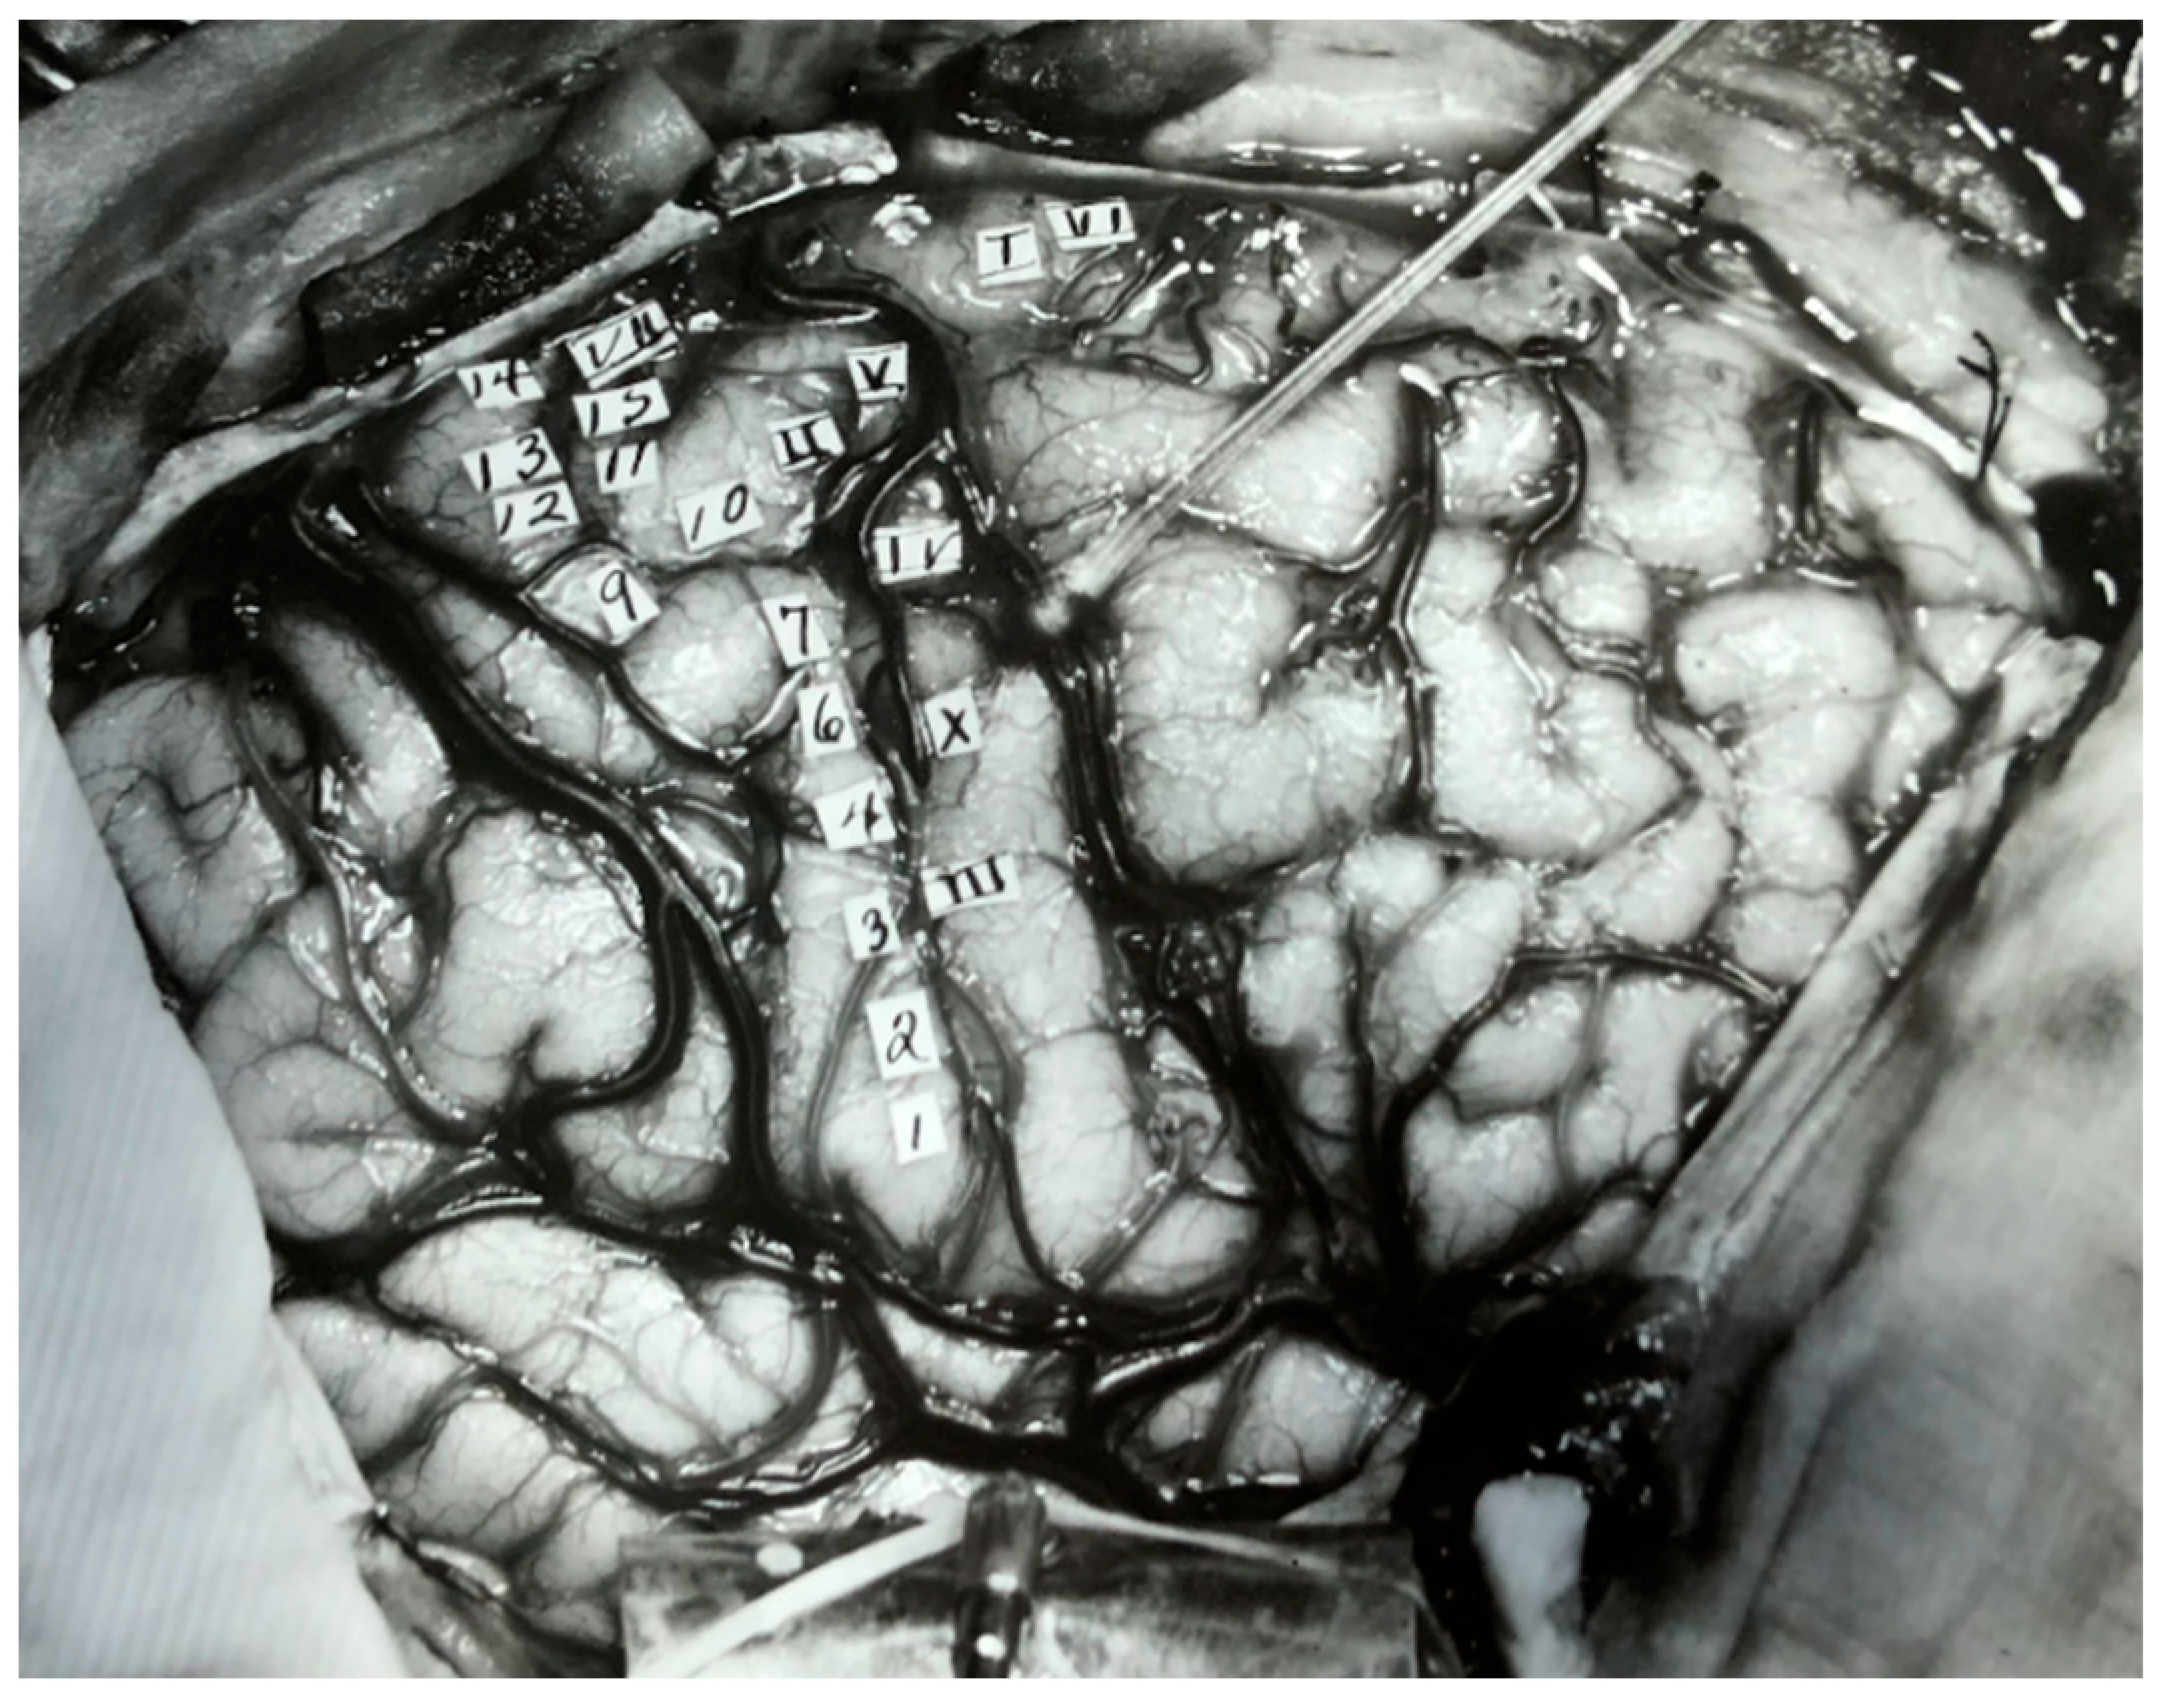
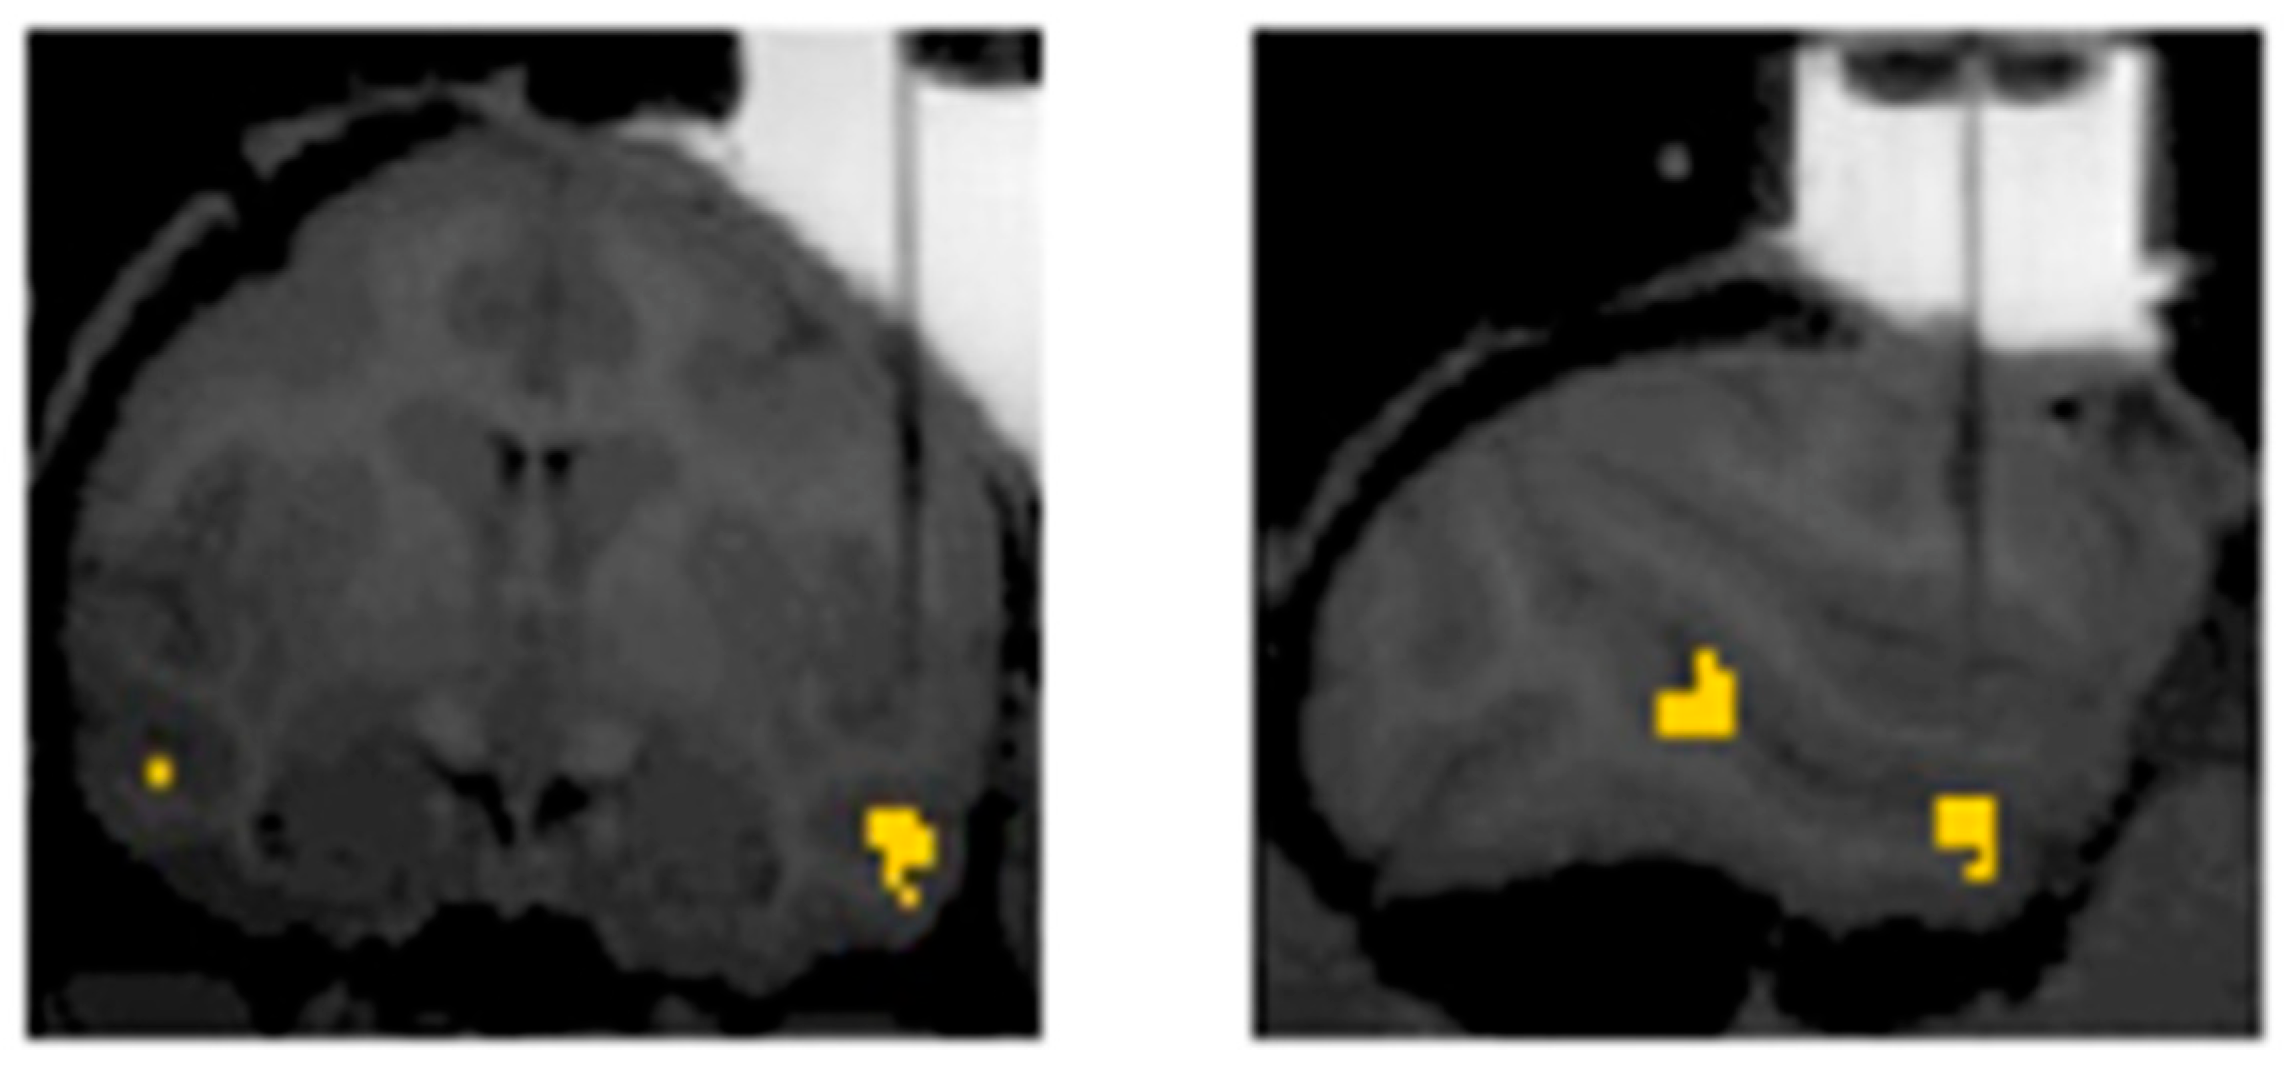
3. The Present
4. The Future: Clinical and Basic Neuroscience Implications
Author Contributions
Funding
Institutional Review Board Statement
Informed Consent Statement
Data Availability Statement
Acknowledgments
Conflicts of Interest
References
- Jurado, M.B.; Rosselli, M. The Elusive Nature of Executive Functions: A Review of Our Current Understanding. Neuropsychol. Rev. 2007, 17, 213–233. [Google Scholar] [CrossRef] [PubMed]
- Teuber, H.L. Unity and Diversity of Frontal Lobe Functions. Acta Neurobiol. Exp. 1972, 32, 615–656. [Google Scholar]
- Miyake, A.; Friedman, N.P.; Emerson, M.J.; Witzki, A.H.; Howerter, A.; Wager, T.D. The Unity and Diversity of Executive Functions and Their Contributions to Complex “Frontal Lobe” Tasks: A Latent Variable Analysis. Cogn. Psychol. 2000, 41, 49–100. [Google Scholar] [CrossRef] [PubMed]
- Marr, D. Vision: A Computational Investigation into the Human Representation and Processing of Visual Information; The MIT Press: Cambridge, MA, USA, 2010. [Google Scholar]
- Glennerster, A. Computational Theories of Vision. Curr. Biol. 2002, 12, R682–R685. [Google Scholar] [CrossRef]
- Teuber, H.L. Physiological Psychology. Annu. Rev. Psychol. 1955, 6, 267–296. [Google Scholar] [CrossRef] [PubMed]
- Ramsey, R. Neural Integration in Body Perception. J. Cogn. Neurosci. 2018, 30, 1442–1451. [Google Scholar] [CrossRef] [PubMed]
- Eling, P.; Finger, S. Gall and Phrenology: New Perspectives. J. Hist. Neurosci. 2020, 29, 1–4. [Google Scholar] [CrossRef]
- Pearce, J.M.S. Marie-Jean-Pierre Flourens (1794–1867) and Cortical Localization. Eur. Neurol. 2009, 61, 311–314. [Google Scholar] [CrossRef]
- Lorch, M. Re-Examining Paul Broca’s Initial Presentation of M. Leborgne: Understanding the Impetus for Brain and Language Research. Cortex 2011, 47, 1228–1235. [Google Scholar] [CrossRef]
- Rorden, C.; Karnath, H.O. Using Human Brain Lesions to Infer Function: A Relic from a Past Era in the FMRI Age? Nat. Rev. Neurosci. 2004, 5, 812–819. [Google Scholar] [CrossRef]
- Hagner, M. The Electrical Excitability of the Brain: Toward the Emergence of an Experiment. J. Hist. Neurosci. 2012, 21, 237–249. [Google Scholar] [CrossRef]
- Leblanc, R. Wilder Penfield and Academic Neurosurgery in North America: 1934–1945. Can. J. Neurol. Sci. 2021, 1–10. [Google Scholar] [CrossRef]
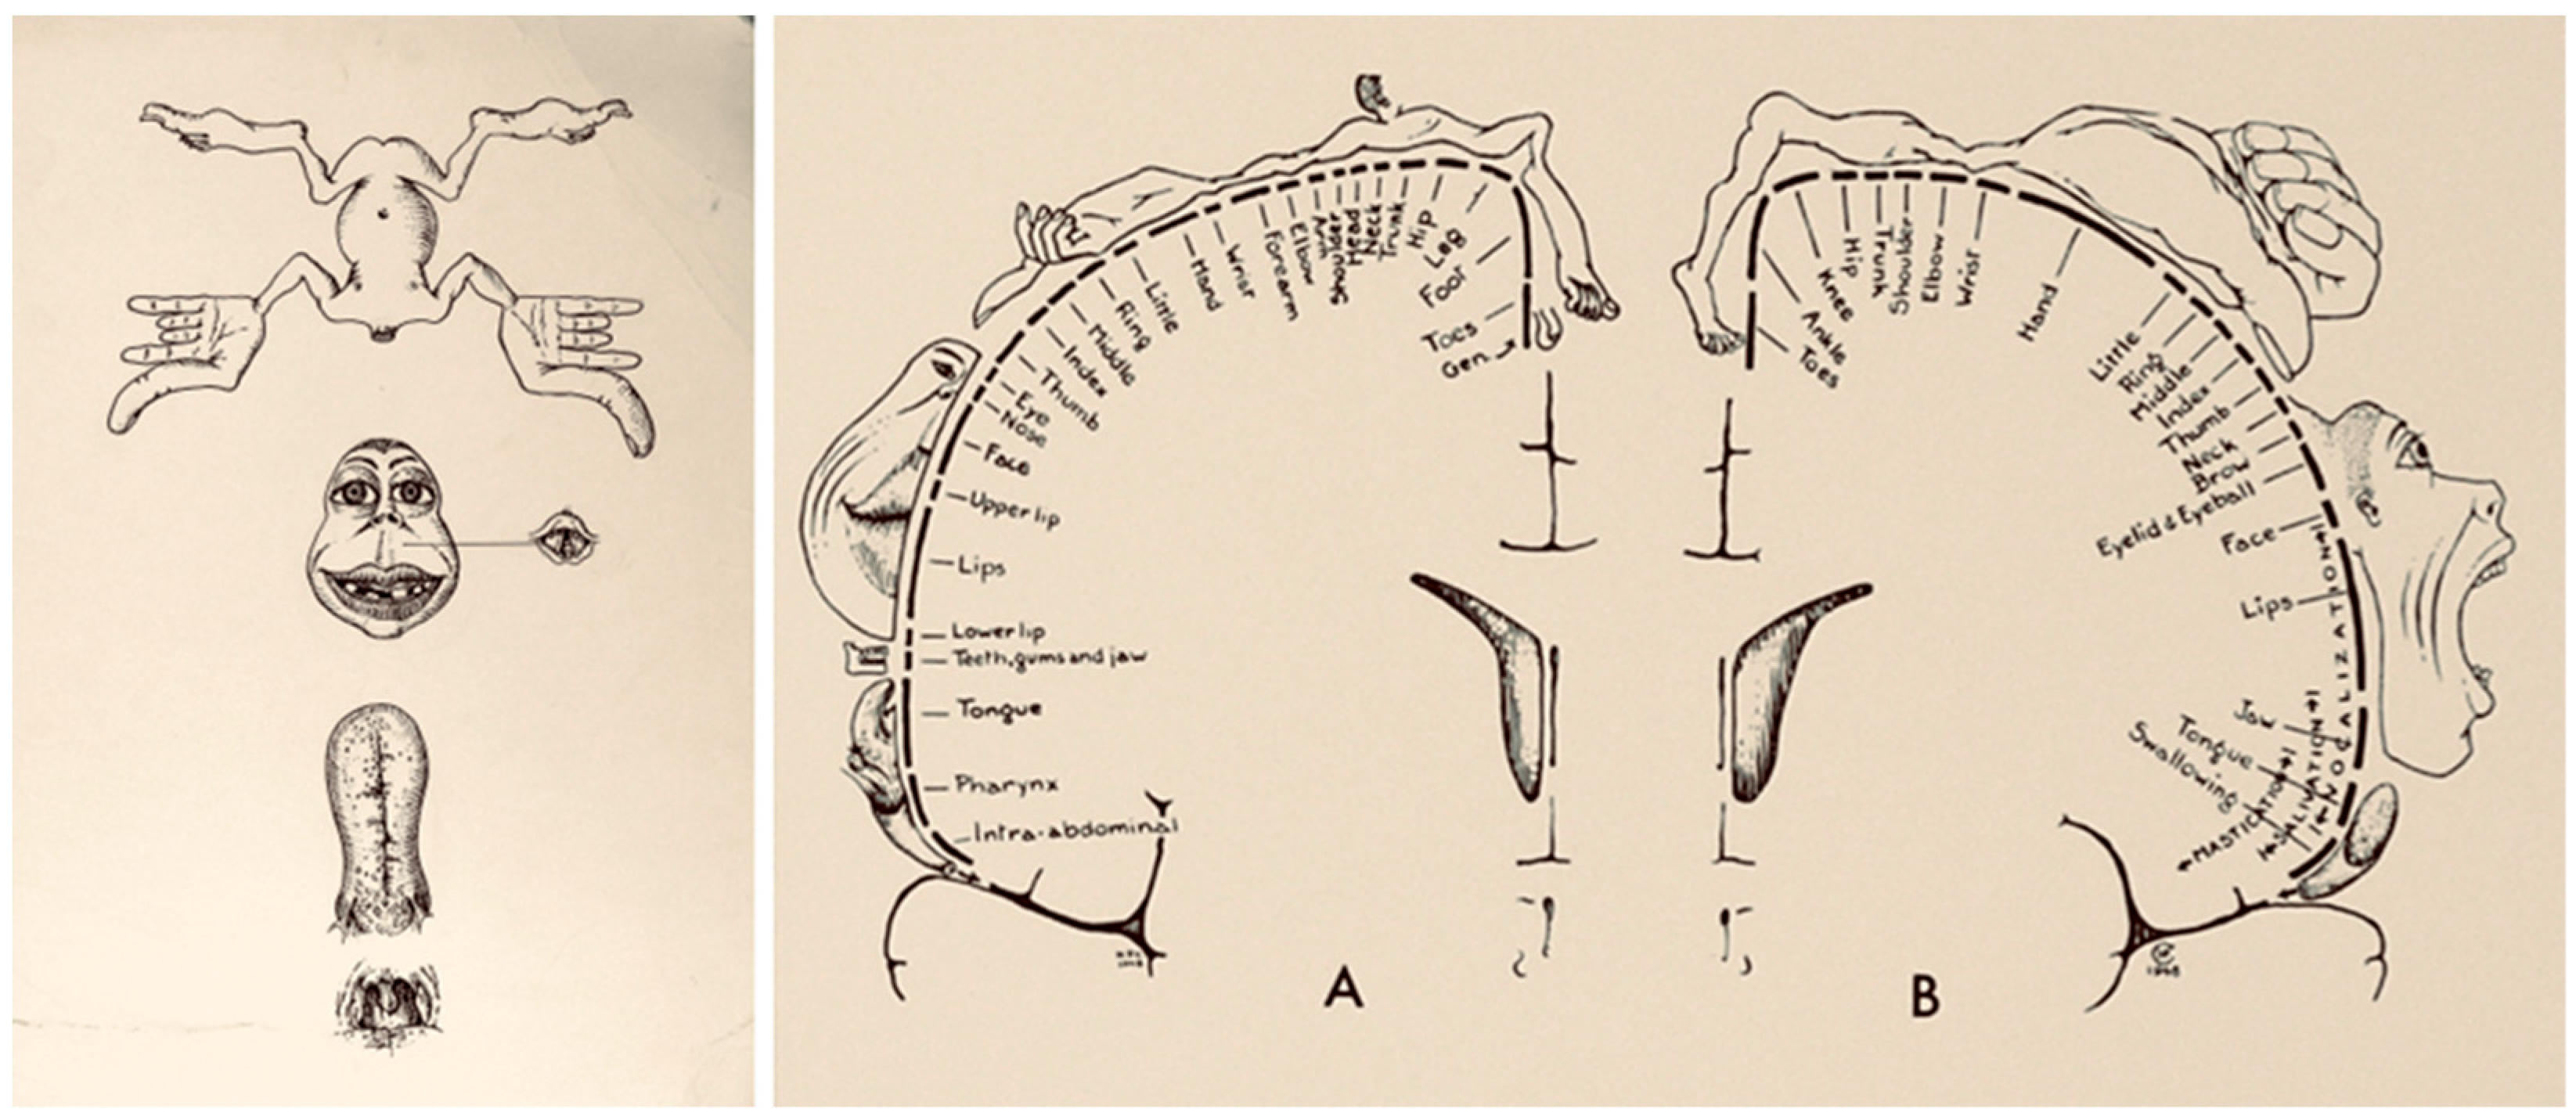
- Schieber, M.H. Constraints on Somatotopic Organization in the Primary Motor Cortex. J. Neurophysiol. 2001, 86, 2125–2143. [Google Scholar] [CrossRef]
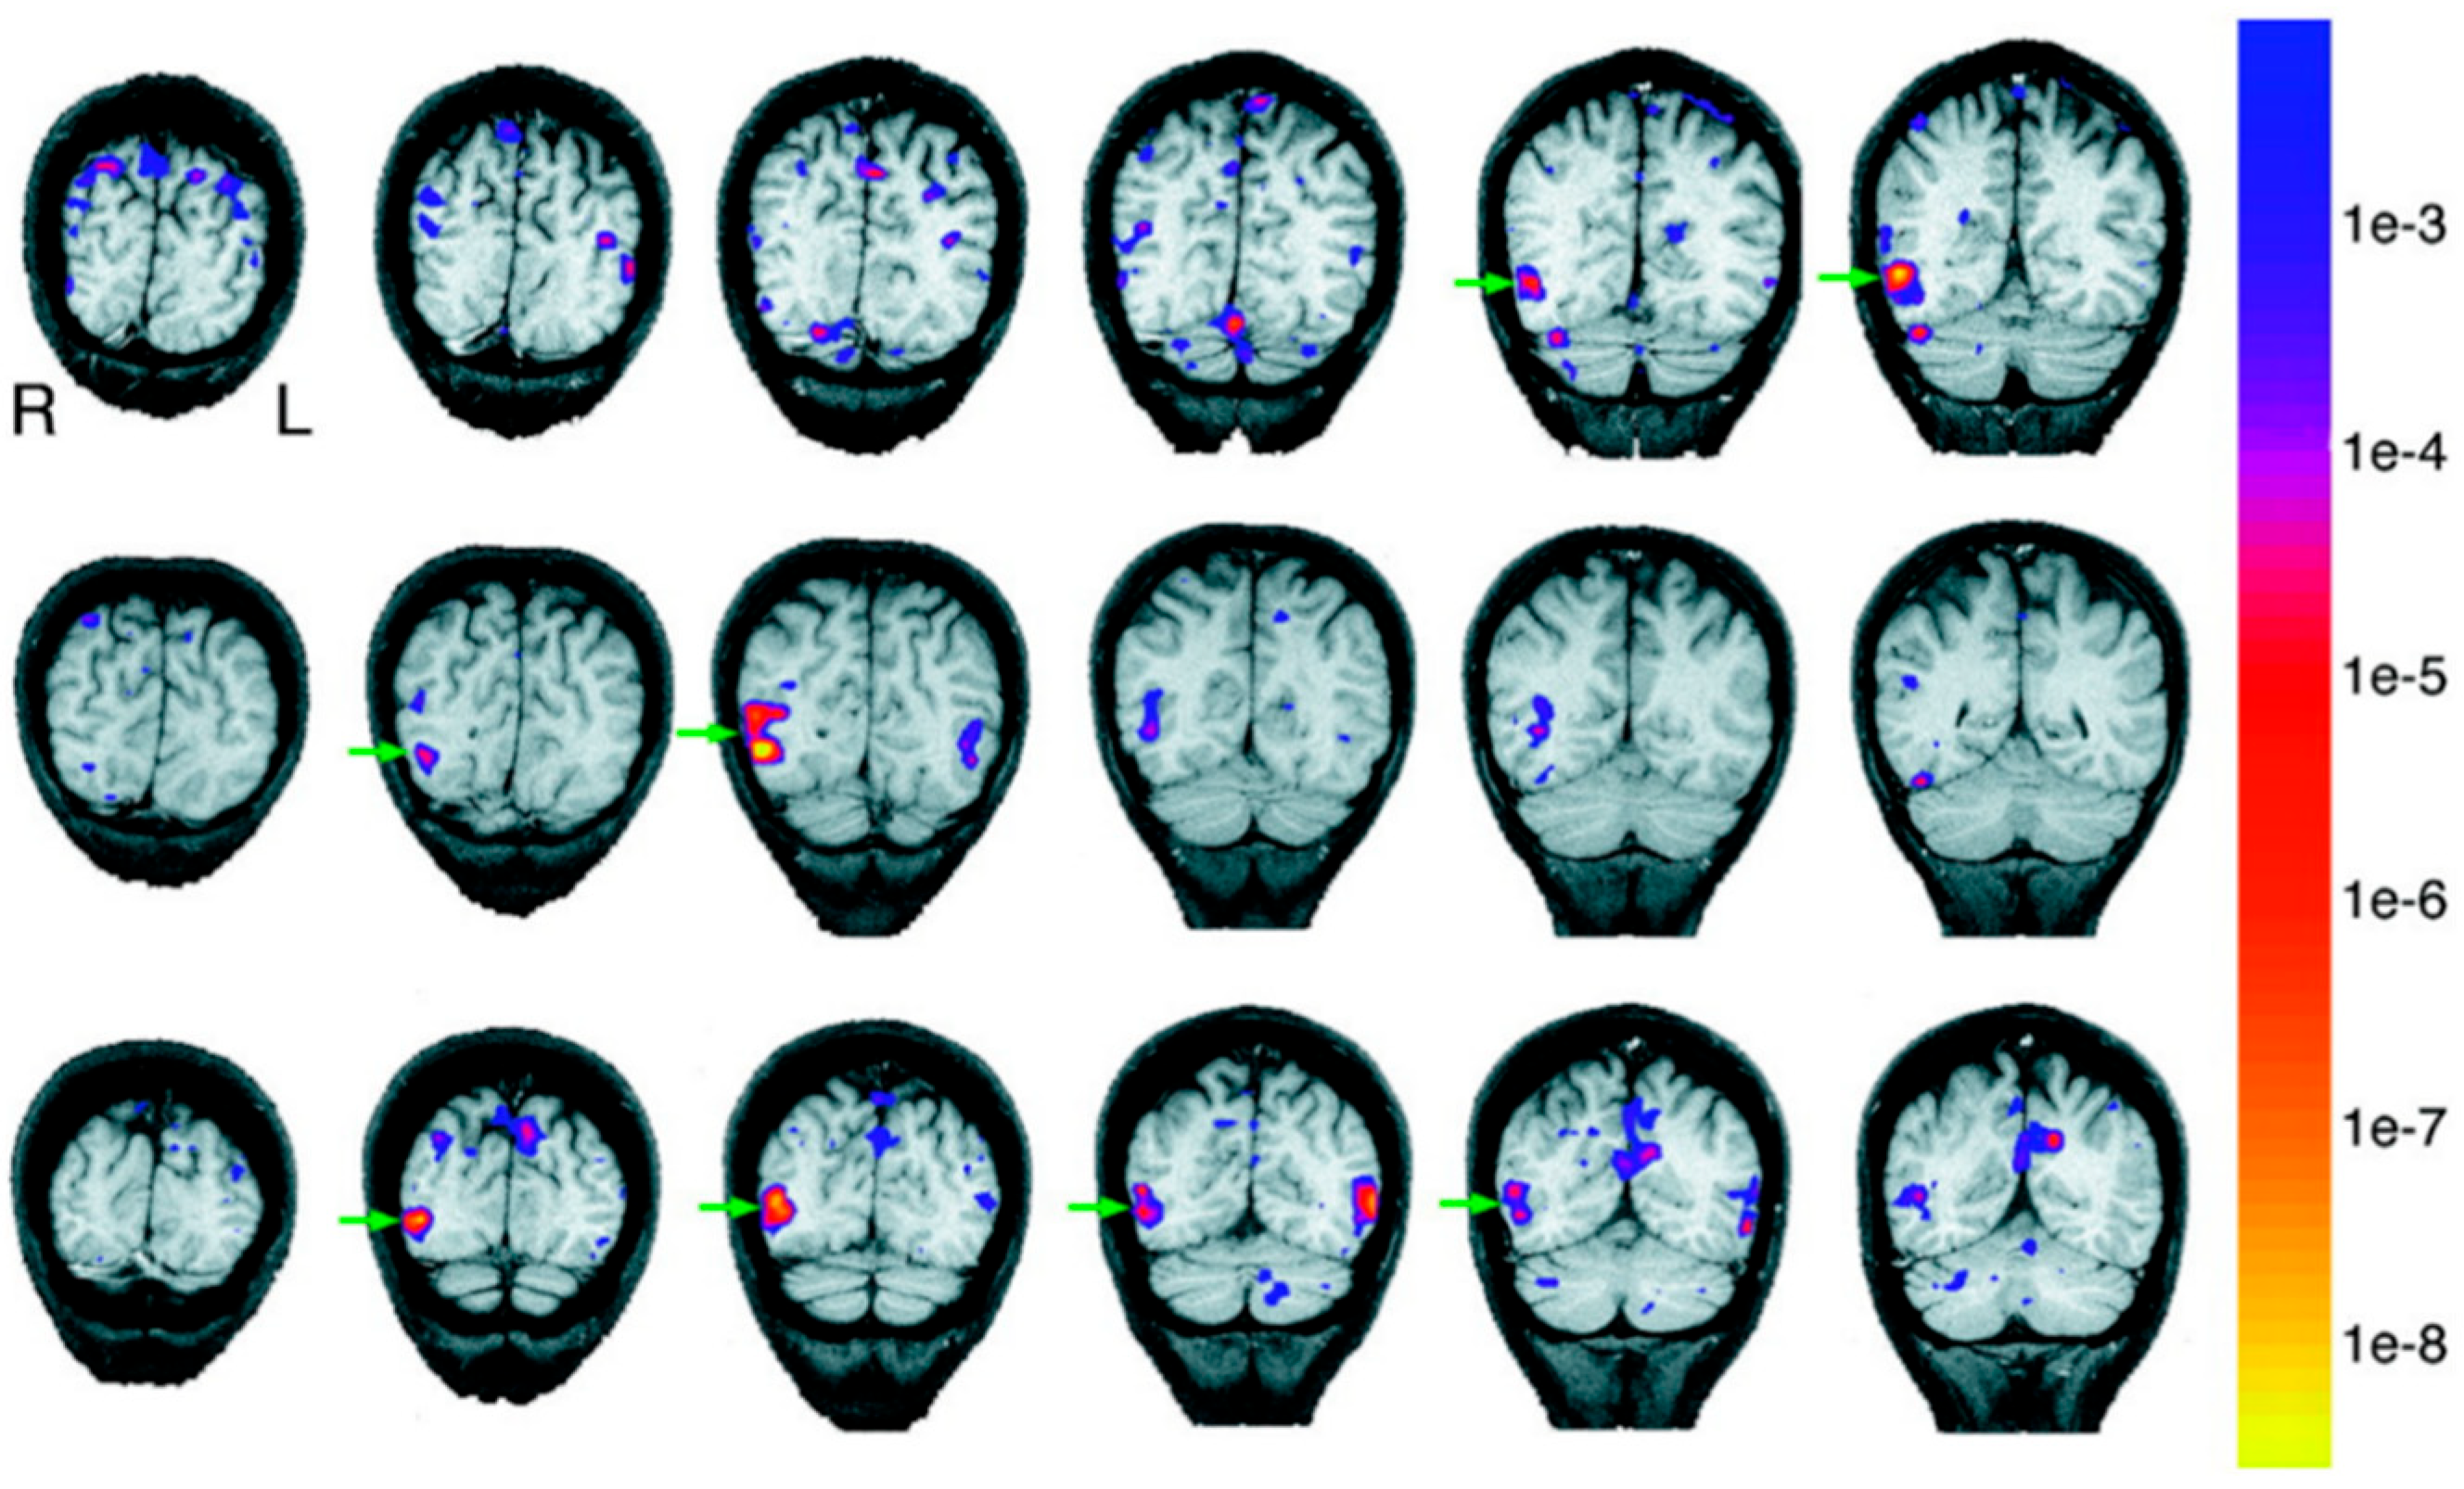
- Rech, F.; Herbet, G.; Gaudeau, Y.; Mézières, S.; Moureau, J.-M.; Moritz-Gasser, S.; Duffau, H. A Probabilistic Map of Negative Motor Areas of the Upper Limb and Face: A Brain Stimulation Study. Brain 2019, 142, 952–965. [Google Scholar] [CrossRef]
- Downing, P.; Kanwisher, N. A Cortical Area Specialized for Visual Processing of the Human Body. J. Vis. 2001, 1, 341. [Google Scholar] [CrossRef]
- Logothetis, N.K. What We Can Do and What We Cannot Do with FMRI. Nature 2008, 453, 869–878. [Google Scholar] [CrossRef]
- Kanwisher, N. Functional Specificity in the Human Brain: A Window into the Functional Architecture of the Mind. Proc. Natl. Acad. Sci. USA 2010, 107, 11163–11170. [Google Scholar] [CrossRef]
- Adolphs, R. Human Lesion Studies in the 21st Century. Neuron 2016, 90, 1151–1153. [Google Scholar] [CrossRef]
- Verma, K.; Kumar, S.; Paydarfar, D. Automatic Segmentation and Quantitative Assessment of Stroke Lesions on MR Images. Diagnostics 2022, 12, 2055. [Google Scholar] [CrossRef]
- Zihl, J.; von Cramon, D.; Mai, N. Selective Disturbance of Movement Vision after Bilateral Brain Damage. Brain 1983, 106, 313–340. [Google Scholar] [CrossRef]
- Parvizi, J.; Kastner, S. Human Intracranial EEG: Promises and Limitations. Nat. Neurosci. 2018, 21, 474. [Google Scholar] [CrossRef] [PubMed]
- Histed, M.H.; Ni, A.M.; Maunsell, J.H.R. Insights into Cortical Mechanisms of Behavior from Microstimulation Experiments. Prog. Neurobiol. 2013, 103, 115–130. [Google Scholar] [CrossRef] [PubMed]
- Mukamel, R.; Fried, I. Human Intracranial Recordings and Cognitive Neuroscience. Annu. Rev. Psychol. 2012, 63, 511–537. [Google Scholar] [CrossRef] [PubMed]
- Raccah, O.; Block, N.; Fox, K.C.R. Does the Prefrontal Cortex Play an Essential Role in Consciousness? Insights from Intracranial Electrical Stimulation of the Human Brain. J. Neurosci. 2021, 41, 2076–2087. [Google Scholar] [CrossRef]
- Kumar, S.; Mergan, E.; Vogels, R. It Is Not Just the Category: Behavioral Effects of FMRI-Guided Electrical Microstimulation Result from a Complex Interplay of Factors. Cereb. Cortex Commun. 2022, 3, tgac010. [Google Scholar] [CrossRef]
- Barker, A.T.; Jalinous, R.; Freeston, I.L. Non-invasive magnetic stimulation of human motor cortex. Lancet 1985, 325, 1106–1107. [Google Scholar] [CrossRef]
- Faraday, M.V. Experimental Researches in Electricity. Philos. Trans. R Soc. Lond 1832, 122, 125–162. [Google Scholar] [CrossRef]
- Pascual-Leone, A.; Walsh, V.; Rothwell, J. Transcranial Magnetic Stimulation in Cognitive Neuroscience—Virtual Lesion, Chronometry, and Functional Connectivity. Curr. Opin. Neurobiol. 2000, 10, 232–237. [Google Scholar] [CrossRef]
- Siebner, H.R.; Hartwigsen, G.; Kassuba, T.; Rothwell, J.; Siebner, H. How Does Transcranial Magnetic Stimulation Modify Neuronal Activity in the Brain?-Implications for Studies of Cognition Europe PMC Funders Group. Cortex 2009, 45, 1035–1042. [Google Scholar] [CrossRef]
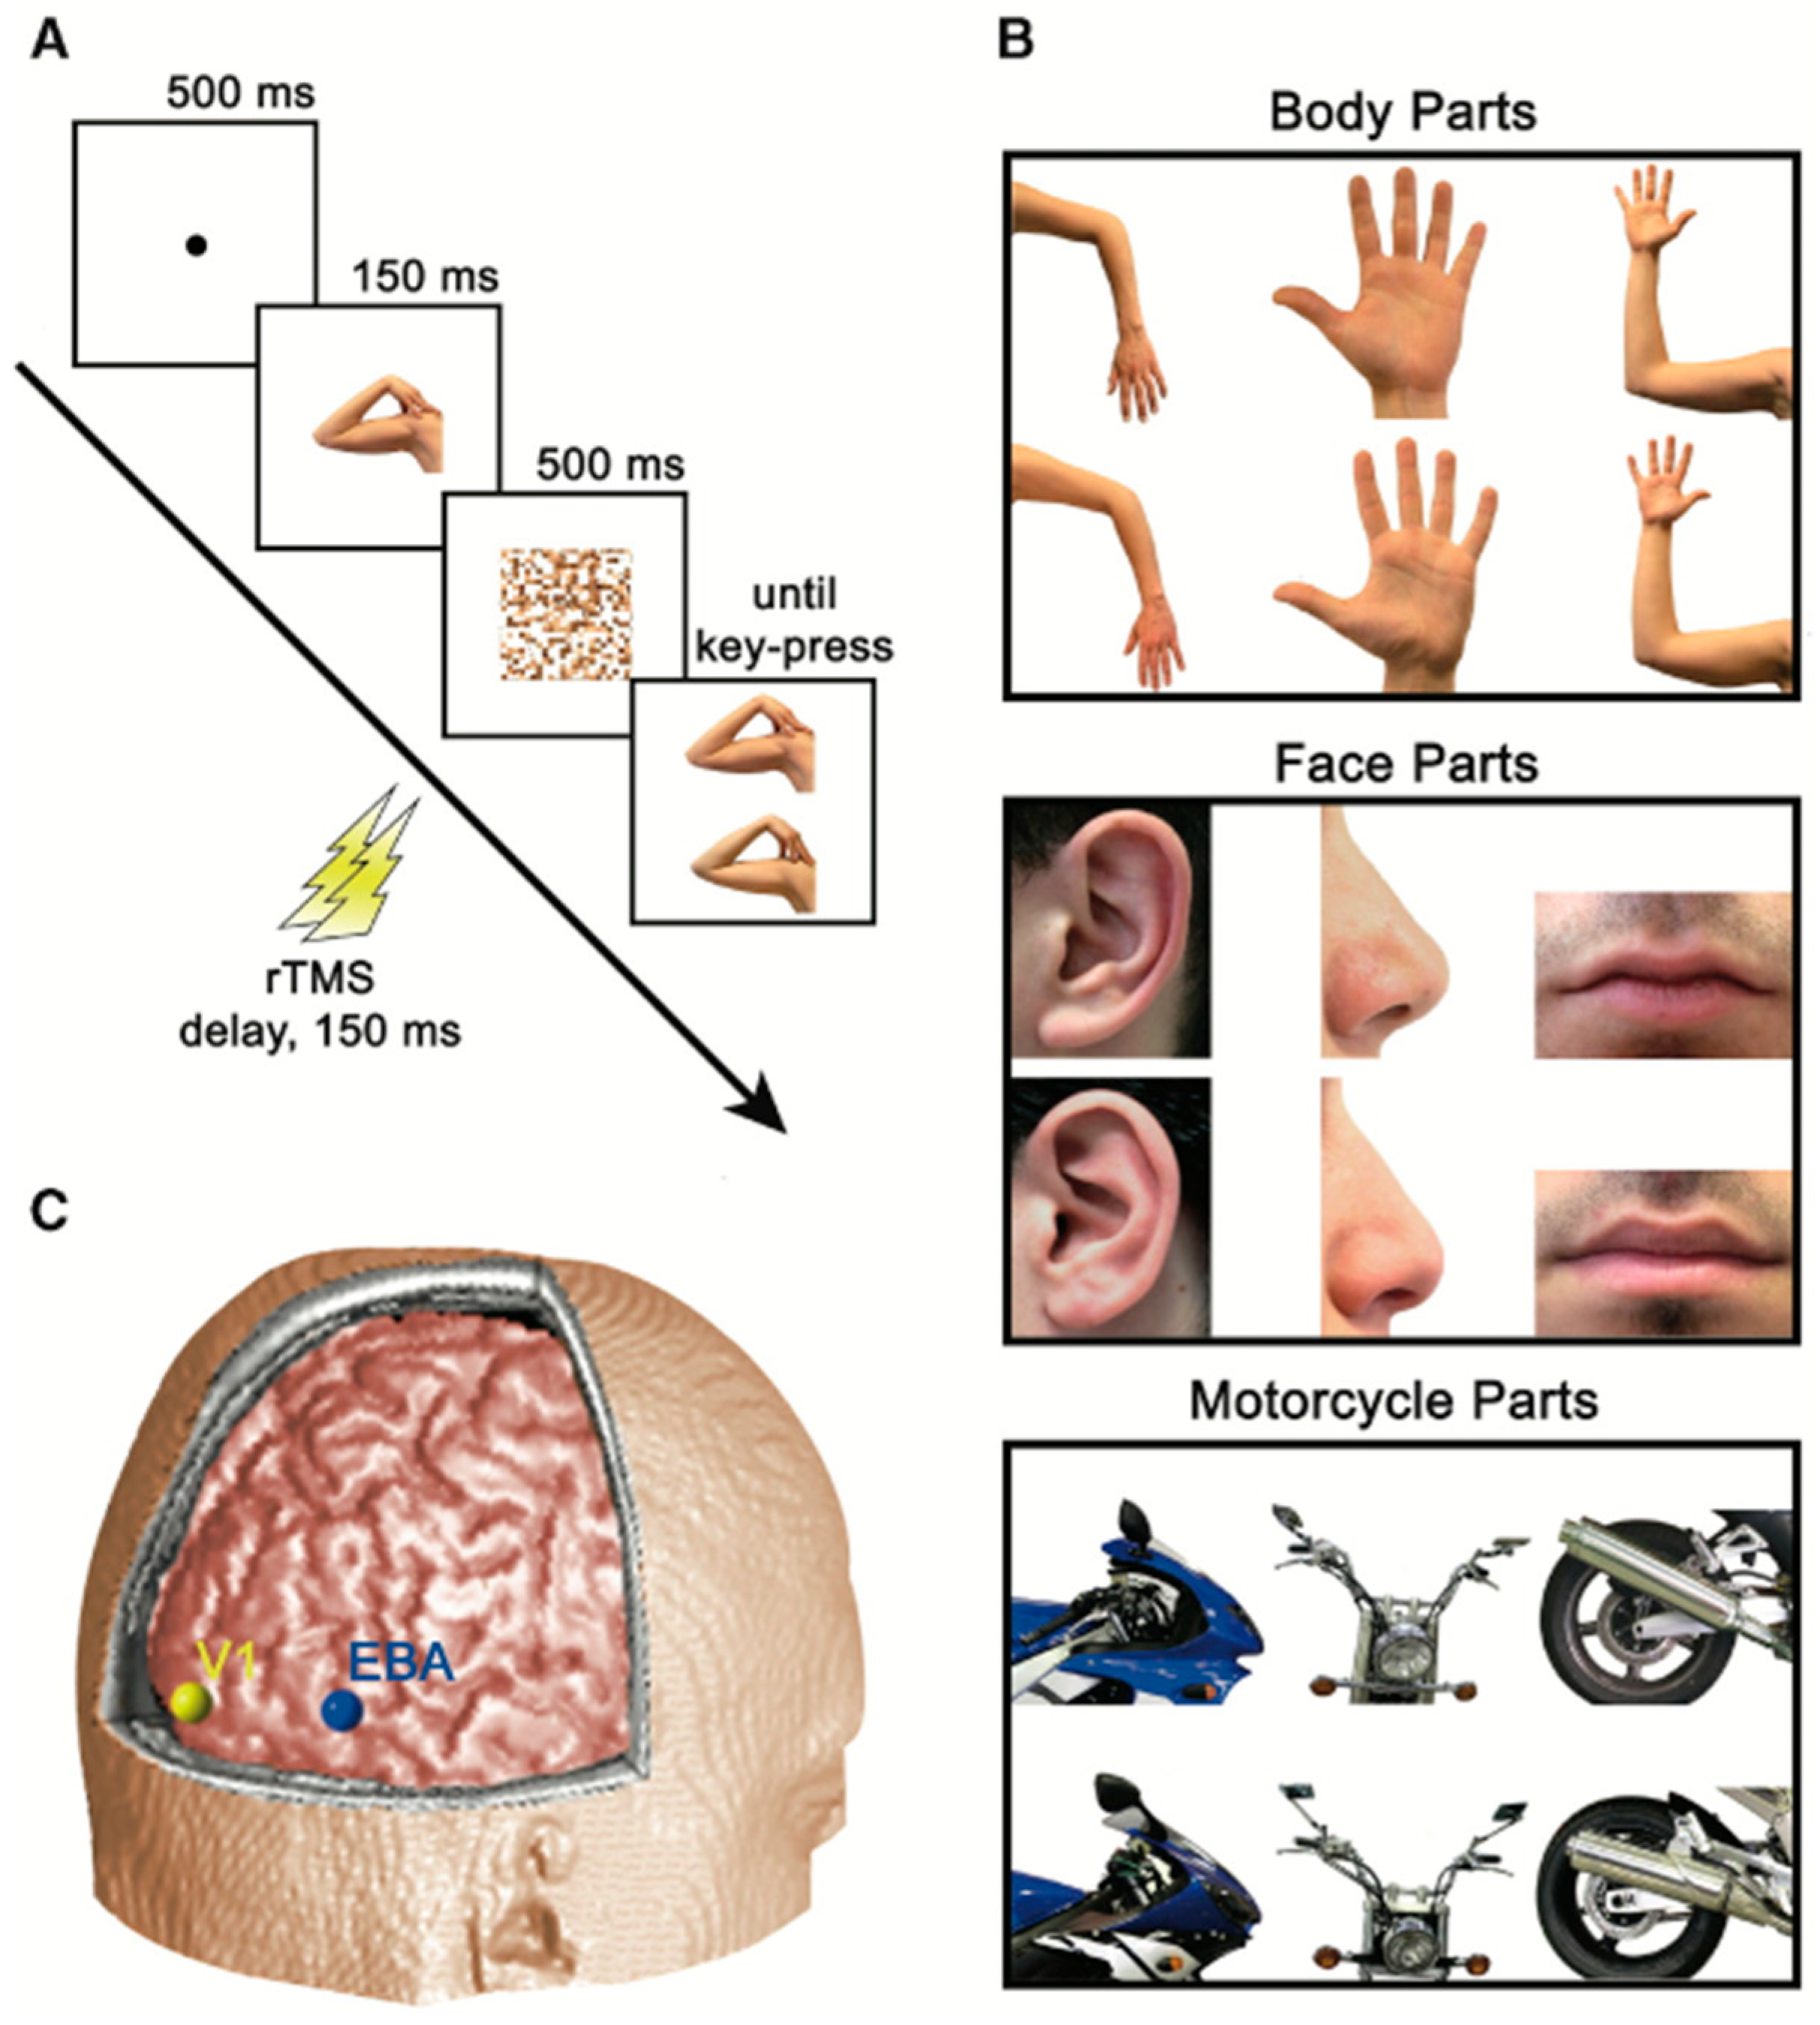
- Urgesi, C.; Berlucchi, G.; Aglioti, S.M. Magnetic Stimulation of Extrastriate Body Area Impairs Visual Processing of Nonfacial Body Parts. Curr. Biol. 2004, 14, 2130–2134. [Google Scholar] [CrossRef]
- Hobot, J.; Klincewicz, M.; Sandberg, K.; Wierzchoń, M. Causal Inferences in Repetitive Transcranial Magnetic Stimulation Research: Challenges and Perspectives. Front. Hum. Neurosci. 2021, 14, 574. [Google Scholar] [CrossRef]
- Kumar, S.; Popivanov, I.D.; Vogels, R. Transformation of Visual Representations Across Ventral Stream Body-Selective Patches. Cerebral. Cortex 2019, 29, 215–229. [Google Scholar] [CrossRef]
- Popivanov, I.D.; Jastorff, J.; Vanduffel, W.; Vogels, R. Stimulus Representations in Body-Selective Regions of the Macaque Cortex Assessed with Event-Related FMRI. Neuroimage 2012, 63, 723–741. [Google Scholar] [CrossRef]
- Mitzdorf, U. Current Source-Density Method and Application in Cat Cerebral Cortex: Investigation of Evoked Potentials and EEG Phenomena. Physiol. Rev. 1985, 65, 37–100. [Google Scholar] [CrossRef]
- Burns, S.P.; Xing, D.; Shapley, R.M. Comparisons of the Dynamics of Local Field Potential and Multiunit Activity Signals in Macaque Visual Cortex. J. Neurosci. 2010, 30, 13739–13749. [Google Scholar] [CrossRef]
- Kumar, S.; Vogels, R. Body Patches in Inferior Temporal Cortex Encode Categories with Different Temporal Dynamics. J. Cogn. Neurosci. 2018, 31, 1699–1709. [Google Scholar] [CrossRef]
- Herlitze, S.; Landmesser, L.T. New Optical Tools for Controlling Neuronal Activity. Curr. Opin. Neurobiol. 2007, 17, 87–94. [Google Scholar] [CrossRef]
- Shirai, F.; Hayashi-Takagi, A. Optogenetics: Applications in Psychiatric Research. Psychiatry Clin. Neurosci. 2017, 71, 363–372. [Google Scholar] [CrossRef]
- Häusser, M. Optogenetics: The Age of Light. Nat. Methods 2014, 11, 1012–1014. [Google Scholar] [CrossRef]
- Krueger, D.; Izquierdo, E.; Viswanathan, R.; Hartmann, J.; Cartes, C.P.; de Renzis, S. Principles and Applications of Optogenetics in Developmental Biology. Development 2019, 146. [Google Scholar] [CrossRef]
- Chen, S.C.Y.; Benvenuti, G.; Chen, Y.; Kumar, S.; Ramakrishnan, C.; Deisseroth, K.; Geisler, W.S.; Seidemann, E. Similar Neural and Perceptual Masking Effects of Low-Power Optogenetic Stimulation in Primate V1. Elife 2022, 11. [Google Scholar] [CrossRef]
- Hinderer, C.; Katz, N.; Buza, E.L.; Dyer, C.; Goode, T.; Bell, P.; Richman, L.K.; Wilson, J.M. Severe Toxicity in Nonhuman Primates and Piglets Following High-Dose Intravenous Administration of an Adeno-Associated Virus Vector Expressing Human SMN. Hum. Gene Ther. 2018, 29, 285–298. [Google Scholar] [CrossRef]
- Chen, X.; Ravindra Kumar, S.; Adams, C.D.; Yang, D.; Wang, T.; Wolfe, D.A.; Arokiaraj, C.M.; Ngo, V.; Campos, L.J.; Griffiths, J.A.; et al. Engineered AAVs for Non-Invasive Gene Delivery to Rodent and Non-Human Primate Nervous Systems. Neuron 2022, 110, 2242–2257. [Google Scholar] [CrossRef]
- Bargmann, C.; Newsome, W.; Anderson, D.; Brown, E.; Deisseroth, K.; Donoghue, J.; MacLeish, P.; Marder, E.; Normann, R.; Sanes, J.; et al. BRAIN 2025: A Scientific Vision: Brain Research through Advancing Innovative Neurotechnologies (BRAIN) Working Group Report to the Advisory Committee to the Director, NIH. Available online: https://braininitiative.nih.gov/strategic-planning/brain-2025-report (accessed on 20 July 2022).
- Kaiser, T.; Zhou, Y.; Feng, G. Animal Models for Neuropsychiatric Disorders: Prospects for Circuit Intervention. Curr. Opin. Neurobiol. 2017, 45, 59–65. [Google Scholar] [CrossRef]
- Chao, L.L.; Knight, R.T. Contribution of Human Prefrontal Cortex to Delay Performance. J. Cogn. Neurosci. 1998, 10, 167–177. [Google Scholar] [CrossRef]
- Bates, E.; Wilson, S.M.; Saygin, A.P.; Dick, F.; Sereno, M.I.; Knight, R.T.; Dronkers, N.F. Voxel-Based Lesion–Symptom Mapping. Nat. Neurosci. 2003, 6, 448–450. [Google Scholar] [CrossRef]
- Munsch, F.; Sagnier, S.; Asselineau, J.; Bigourdan, A.; Guttmann, C.R.; Debruxelles, S.; Poli, M.; Renou, P.; Perez, P.; Dousset, V. Stroke Location Is an Independent Predictor of Cognitive Outcome. Stroke 2016, 47, 66–73. [Google Scholar] [CrossRef]
- Biesbroek, J.M.; van Zandvoort, M.J.E.; Kappelle, L.J.; Velthuis, B.K.; Biessels, G.J.; Postma, A. Shared and Distinct Anatomical Correlates of Semantic and Phonemic Fluency Revealed by Lesion-Symptom Mapping in Patients with Ischemic Stroke. Brain Struct. Funct. 2016, 221, 2123–2134. [Google Scholar] [CrossRef]
- Biesbroek, J.M.; van Zandvoort, M.J.E.; Kappelle, L.J.; Schoo, L.; Kuijf, H.J.; Velthuis, B.K.; Biessels, G.J.; Postma, A.; Utrecht VCI Study Group. Study Distinct Anatomical Correlates of Discriminability and Criterion Setting in Verbal Recognition Memory Revealed by Lesion-symptom Mapping. Hum. Brain Mapp. 2015, 36, 1292–1303. [Google Scholar] [CrossRef]
- Kalénine, S.; Shapiro, A.D.; Buxbaum, L.J. Dissociations of Action Means and Outcome Processing in Left-Hemisphere Stroke. Neuropsychologia 2013, 51, 1224–1233. [Google Scholar] [CrossRef]
- Quaglio, G.; Toia, P.; Moser, E.I.; Karapiperis, T.; Amunts, K.; Okabe, S.; Poo, M.; Rah, J.-C.; De Koninck, Y.; Ngai, J.; et al. The International Brain Initiative: Enabling Collaborative Science. Lancet Neurol. 2021, 20, 985–986. [Google Scholar] [CrossRef]


Publisher’s Note: MDPI stays neutral with regard to jurisdictional claims in published maps and institutional affiliations. |
© 2022 by the authors. Licensee MDPI, Basel, Switzerland. This article is an open access article distributed under the terms and conditions of the Creative Commons Attribution (CC BY) license (https://creativecommons.org/licenses/by/4.0/).
Share and Cite
Verma, K.; Kumar, S. How Do We Connect Brain Areas with Cognitive Functions? The Past, the Present and the Future. NeuroSci 2022, 3, 521-532. https://doi.org/10.3390/neurosci3030037
Verma K, Kumar S. How Do We Connect Brain Areas with Cognitive Functions? The Past, the Present and the Future. NeuroSci. 2022; 3(3):521-532. https://doi.org/10.3390/neurosci3030037
Chicago/Turabian StyleVerma, Khushboo, and Satwant Kumar. 2022. "How Do We Connect Brain Areas with Cognitive Functions? The Past, the Present and the Future" NeuroSci 3, no. 3: 521-532. https://doi.org/10.3390/neurosci3030037
APA StyleVerma, K., & Kumar, S. (2022). How Do We Connect Brain Areas with Cognitive Functions? The Past, the Present and the Future. NeuroSci, 3(3), 521-532. https://doi.org/10.3390/neurosci3030037