Article

Evaluation of Green Solvents for Soybean Oil Extraction Through Integration of COSMO-RS Screening, Accelerated Solvent Extraction, and Diffusion Kinetics


by
Shanmugapriya Dharmarajan
*,
Saravanan Ramasamy
*,
Dakota Hoffman
and
Sonika Ketyarath
Department of Chemistry and Biochemistry, College of Science and Engineering, Angelo State University, San Angelo, TX 76909, USA
*
Authors to whom correspondence should be addressed.
Sustain. Chem. 2026, 7(3), 34; https://doi.org/10.3390/suschem7030034
Submission received: 27 May 2026 / Revised: 4 July 2026 / Accepted: 8 July 2026 / Published: 10 July 2026

Abstract

The replacement of n-hexane in vegetable oil extraction remains a significant challenge due to environmental and health concerns. This study integrates thermodynamic modeling and kinetic analysis to evaluate green solvents for soybean oil extraction. Solvent–triglyceride interactions were predicted using Conductor-like Screening Model for Real Solvents (COSMO-RS), employing σ-surfaces, σ-profiles, σ-potentials, activity coefficients at infinite dilution (γ∞), and relative solubility descriptors ( x R S and w R S ). Representative triglycerides were modeled using DFT-optimized structures. Based on these predictions and sustainability criteria, cyclopentyl methyl ether (CPME), 2-methyltetrahydrofuran (2-MeTHF), tert-butyl methyl ether (TBME), and ethyl acetate were experimentally evaluated against n-hexane using accelerated solvent extraction (ASE) at 100 °C. CPME and 2-MeTHF achieved the highest extraction yields, exceeding n-hexane, while TBME showed comparable performance and ethyl acetate underperformed. Kinetic analysis using the hot-ball diffusion model revealed a two-stage mechanism: an initial solvation-controlled stage followed by a diffusion-controlled regime. COSMO-RS predictions correlated strongly with early-stage extraction behavior, whereas diffusion coefficients highlighted the influence of mass transfer properties at later stages. The proposed COSMO-RS, experimental extraction, and kinetic modeling framework, validated here for soybean oil, offers a transferable and resource-efficient platform for designing sustainable solvent-based extraction processes across diverse oilseed and natural product matrices.

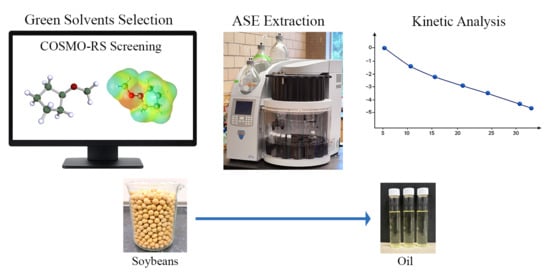
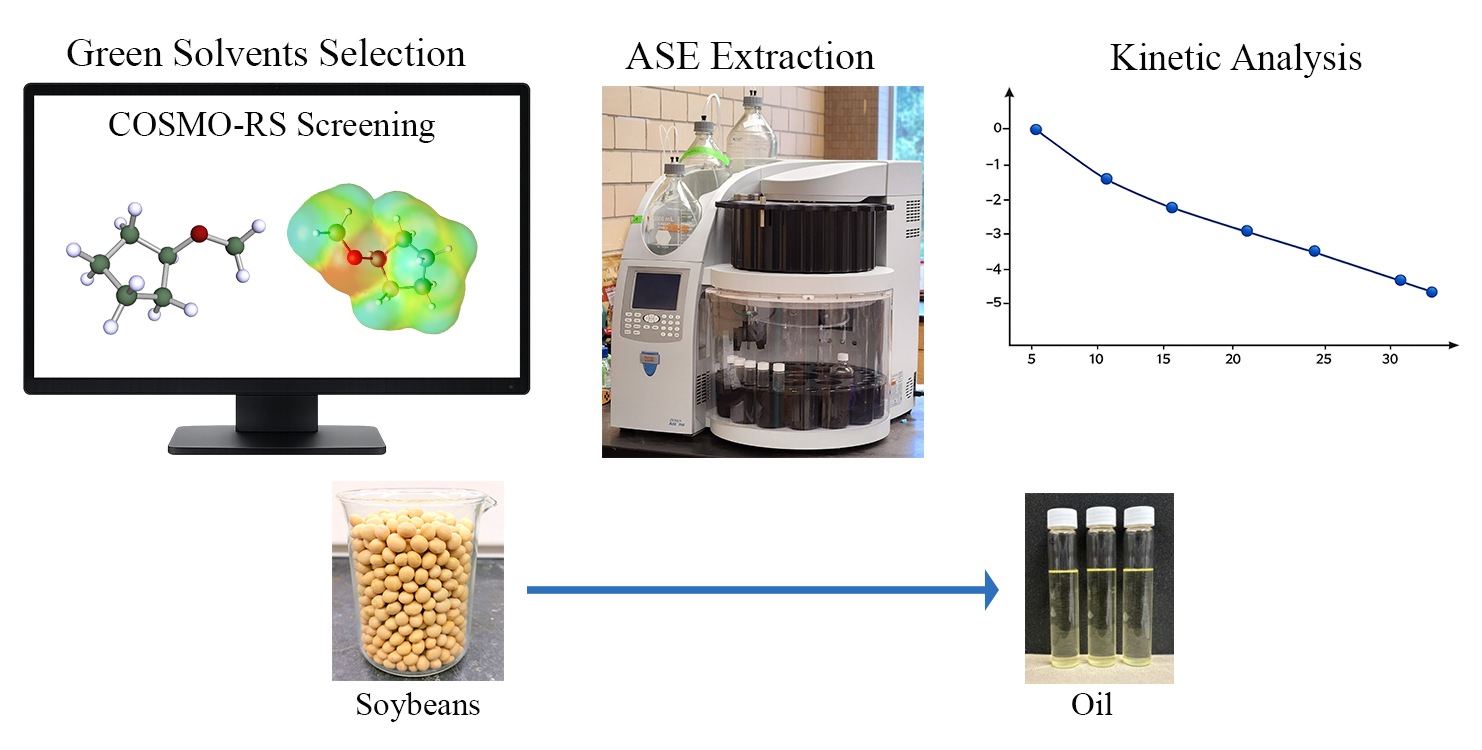
Graphical Abstract

1. Introduction

Vegetable oil extraction from oilseeds such as soybean is dominated industrially by mechanical pressing (expeller or hydraulic) followed by solvent extraction, with n-hexane being the de facto benchmark on account of its high selectivity for triglycerides, low boiling point, and ease of recovery [1,2]. Despite this performance, n-hexane is a Hazardous Air Pollutant under the U.S. Clean Air Act and has been associated with peripheral neuropathy in chronically exposed workers [3]. Regulatory reviews in the EU and elsewhere are actively reassessing its continued use in food-contact extractions [4,5]. The need for a viable substitute is amplified by demand: global soybean oil output exceeded 63 million metric tons in 2025/26 [6], with the OECD-FAO Agricultural Outlook projecting world soybean production to reach 415 Mt and crush volume to expand by 44 Mt by 2032 [7]. These factors drive interest in greener extraction solvents and processes.
Alternative solvents have been explored across multiple chemical classes, including alcohols, esters, ketones, and ether-based bio-solvents, as well as intensified extraction technologies such as supercritical CO2, microwave-assisted, and ultrasound-assisted extraction [2,8,9]. For soybean specifically, 2-methyltetrahydrofuran (2-MeTHF, also known as 2-methyloxolane) has been shown to deliver oil yields equivalent to n-hexane while simultaneously producing a higher-quality defatted meal [4], and switchable and gas-expanded solvents have been demonstrated for the same matrix at laboratory scale [10]. Beyond 2-MeTHF, cyclopentyl methyl ether (CPME), first proposed as a process solvent on the basis of its low peroxide-formation tendency and favorable physicochemical profile [11], and tert-butyl methyl ether (TBME) have emerged as candidates whose ether functionality matches the polarity range of triglycerides while offering improved safety and recyclability relative to hexane [2,12].
The rational selection of these candidates increasingly relies on computational tools rather than purely empirical screening. The Conductor-like Screening Model for Real Solvents (COSMO-RS) combines quantum-chemical surface-charge densities with a statistical thermodynamic treatment of the resulting interactions, allowing prediction of activity coefficients, mixture phase behavior, and relative solubilities [13]. COSMO-RS has been benchmarked against experimental solubility data for rapeseed and other vegetable oils and shown to discriminate effectively among candidate green solvents for triglyceride extraction [14,15], establishing it as a useful pre-screen prior to experimental validation. Comprehensive solvent-selection guides, most prominently the GlaxoSmithKline (GSK) guide [12,16], evaluate solvents against environmental, health, and safety (EHS) and life-cycle metrics, and can be used alongside computational descriptors, such as those from COSMO-RS, to enable balanced trade-offs among solvation power, sustainability, and process compatibility.
Accelerated solvent extraction (ASE), also known as pressurized liquid extraction, has also transformed laboratory- and pilot-scale lipid recovery. Originally introduced to dramatically reduce solvent consumption and extraction time relative to Soxhlet [17], ASE operates at elevated temperatures (typically 100–200 °C) and pressures (up to approximately 1500 psi) that maintain the solvent in the liquid state above its atmospheric boiling point, enhancing analyte solubility, mass-transfer rates, and matrix penetration while reducing solvent demand by up to 90% [17,18]. ASE has been deployed across diverse matrices, including oils, polyphenolic extracts, and environmental contaminants, and is increasingly paired with bio-based solvents to combine the kinetic advantages of pressurized extraction with the EHS advantages of greener fluids [18,19]. For soybean oil specifically, high triglyceride loading and rigid cellular matrices benefit from both improved solvation thermodynamics and faster intra-particle transport.
Characterizing extraction performance requires not only thermodynamic descriptors of solvent affinity but also quantitative kinetic data. The hot-ball diffusion model, first proposed by Bartle et al. for supercritical fluid extraction, provides a physically grounded framework for interpreting extraction curves [20]. The model treats the solid matrix as a collection of homogeneous spherical particles from which the analyte diffuses radially outward into a well-mixed external phase. When external mass-transfer resistance is negligible and transport follows Fick’s diffusion model, the solution links fractional extraction yield at any time to a single lumped parameter, the effective intra-particle diffusion coefficient ( D ) [20,21]. The model was subsequently extended to account for the additional resistance imposed by finite analyte solubility in the extracting fluid [22]. Its theoretical foundations and applications across a range of matrices and extraction techniques have been reviewed in depth [23]. Because D integrates the combined effects of solvent viscosity, matrix tortuosity, and analyte–solvent affinity into a single experimentally accessible quantity, fitting extraction curves to the hot-ball model provides a rigorous, mechanism-based basis for comparing solvents under identical ASE conditions, directly complementing the thermodynamic ranking obtained from COSMO-RS. The model has been applied to soybean oil extraction with green solvents [24,25] and, more recently, to pressurized liquid extraction of soybean, sunflower, and rice-bran oils, where measured D values discriminated effectively between extraction conditions [26].
Despite this progress, replacing n-hexane at industrial scale poses real engineering challenges: candidate solvents must match hexane’s volatility for energy-efficient recovery, leave acceptably low residues in the recovered oil, perform reproducibly across feedstock batches, and remain compatible with downstream refining and meal use [5]. Systematic validation of COSMO-RS as a predictive tool for green solvent selection in oilseed extraction remains limited, however. Although COSMO-RS has been applied successfully to rapeseed oil and broader bio-based extraction systems [13,14,15], published studies that directly compare its solubility predictions with experimental ASE outcomes, using a matched panel of candidate green solvents tested on soybean oil under identical conditions, remain scarce. Head-to-head comparisons that couple thermodynamic prediction (COSMO-RS), kinetic modeling, and controlled experimental ASE conditions for a set of candidate solvents on a single oil matrix are still uncommon, and their absence has limited the evidence base for deploying COSMO-RS as a routine pre-screening tool in green extraction workflows. This study addresses that gap directly, with validation of COSMO-RS predictions against experimental extraction results as a central contribution.
This work evaluates a panel of green solvents, specifically 2-MeTHF, CPME, TBME, and ethyl acetate, as substitutes for n-hexane in the accelerated solvent extraction of soybean oil. Solvent–triglyceride affinity is first screened and rationalized computationally using COSMO-RS (σ-surfaces, σ-profiles, σ-potentials, activity coefficients at infinite dilution, and relative solubilities) [13,14]. Predicted rankings are then tested experimentally under matched ASE conditions, and the resulting kinetic curves are interpreted with the hot-ball diffusion model to recover effective intra-particle diffusion coefficients. The combined thermodynamic-plus-kinetic analysis identifies green-solvent candidates that match or exceed n-hexane’s performance on soybean oil while improving on its EHS profile, and thereby supports the rational design of more sustainable extraction protocols consistent with the principles of green chemistry [1].

2. Materials and Methods

2.1. Chemicals and Reagents

Organic, non-GMO soybeans were obtained from a local market and used as the raw material for oil extraction. n-Hexane (≥95%; CAS 110-54-3) was obtained from Fisher Chemical (Thermo Fisher Scientific, Waltham, MA, USA). Green solvents were selected on the basis of sustainability metrics and thermodynamic compatibility with soybean oil triglycerides, and included ethyl acetate (>99.5%; CAS 141-78-6), 2-methyltetrahydrofuran (2-MeTHF; CAS 96-47-9), and cyclopentyl methyl ether (CPME; ≥99%; CAS 5614-37-9), all purchased from Thermo Fisher Scientific. tert-Butyl methyl ether (TBME; CAS 1634-04-4) was obtained from TCI Chemicals (Portland, OR, USA). All reagents were used as received without further purification. Pure soybean oil (Nutrioli brand, Woodlands, TX, USA), purchased from Walmart, was used as a commercial reference for IR and GC-MS analysis.

2.2. Experimental and Computational Workflow

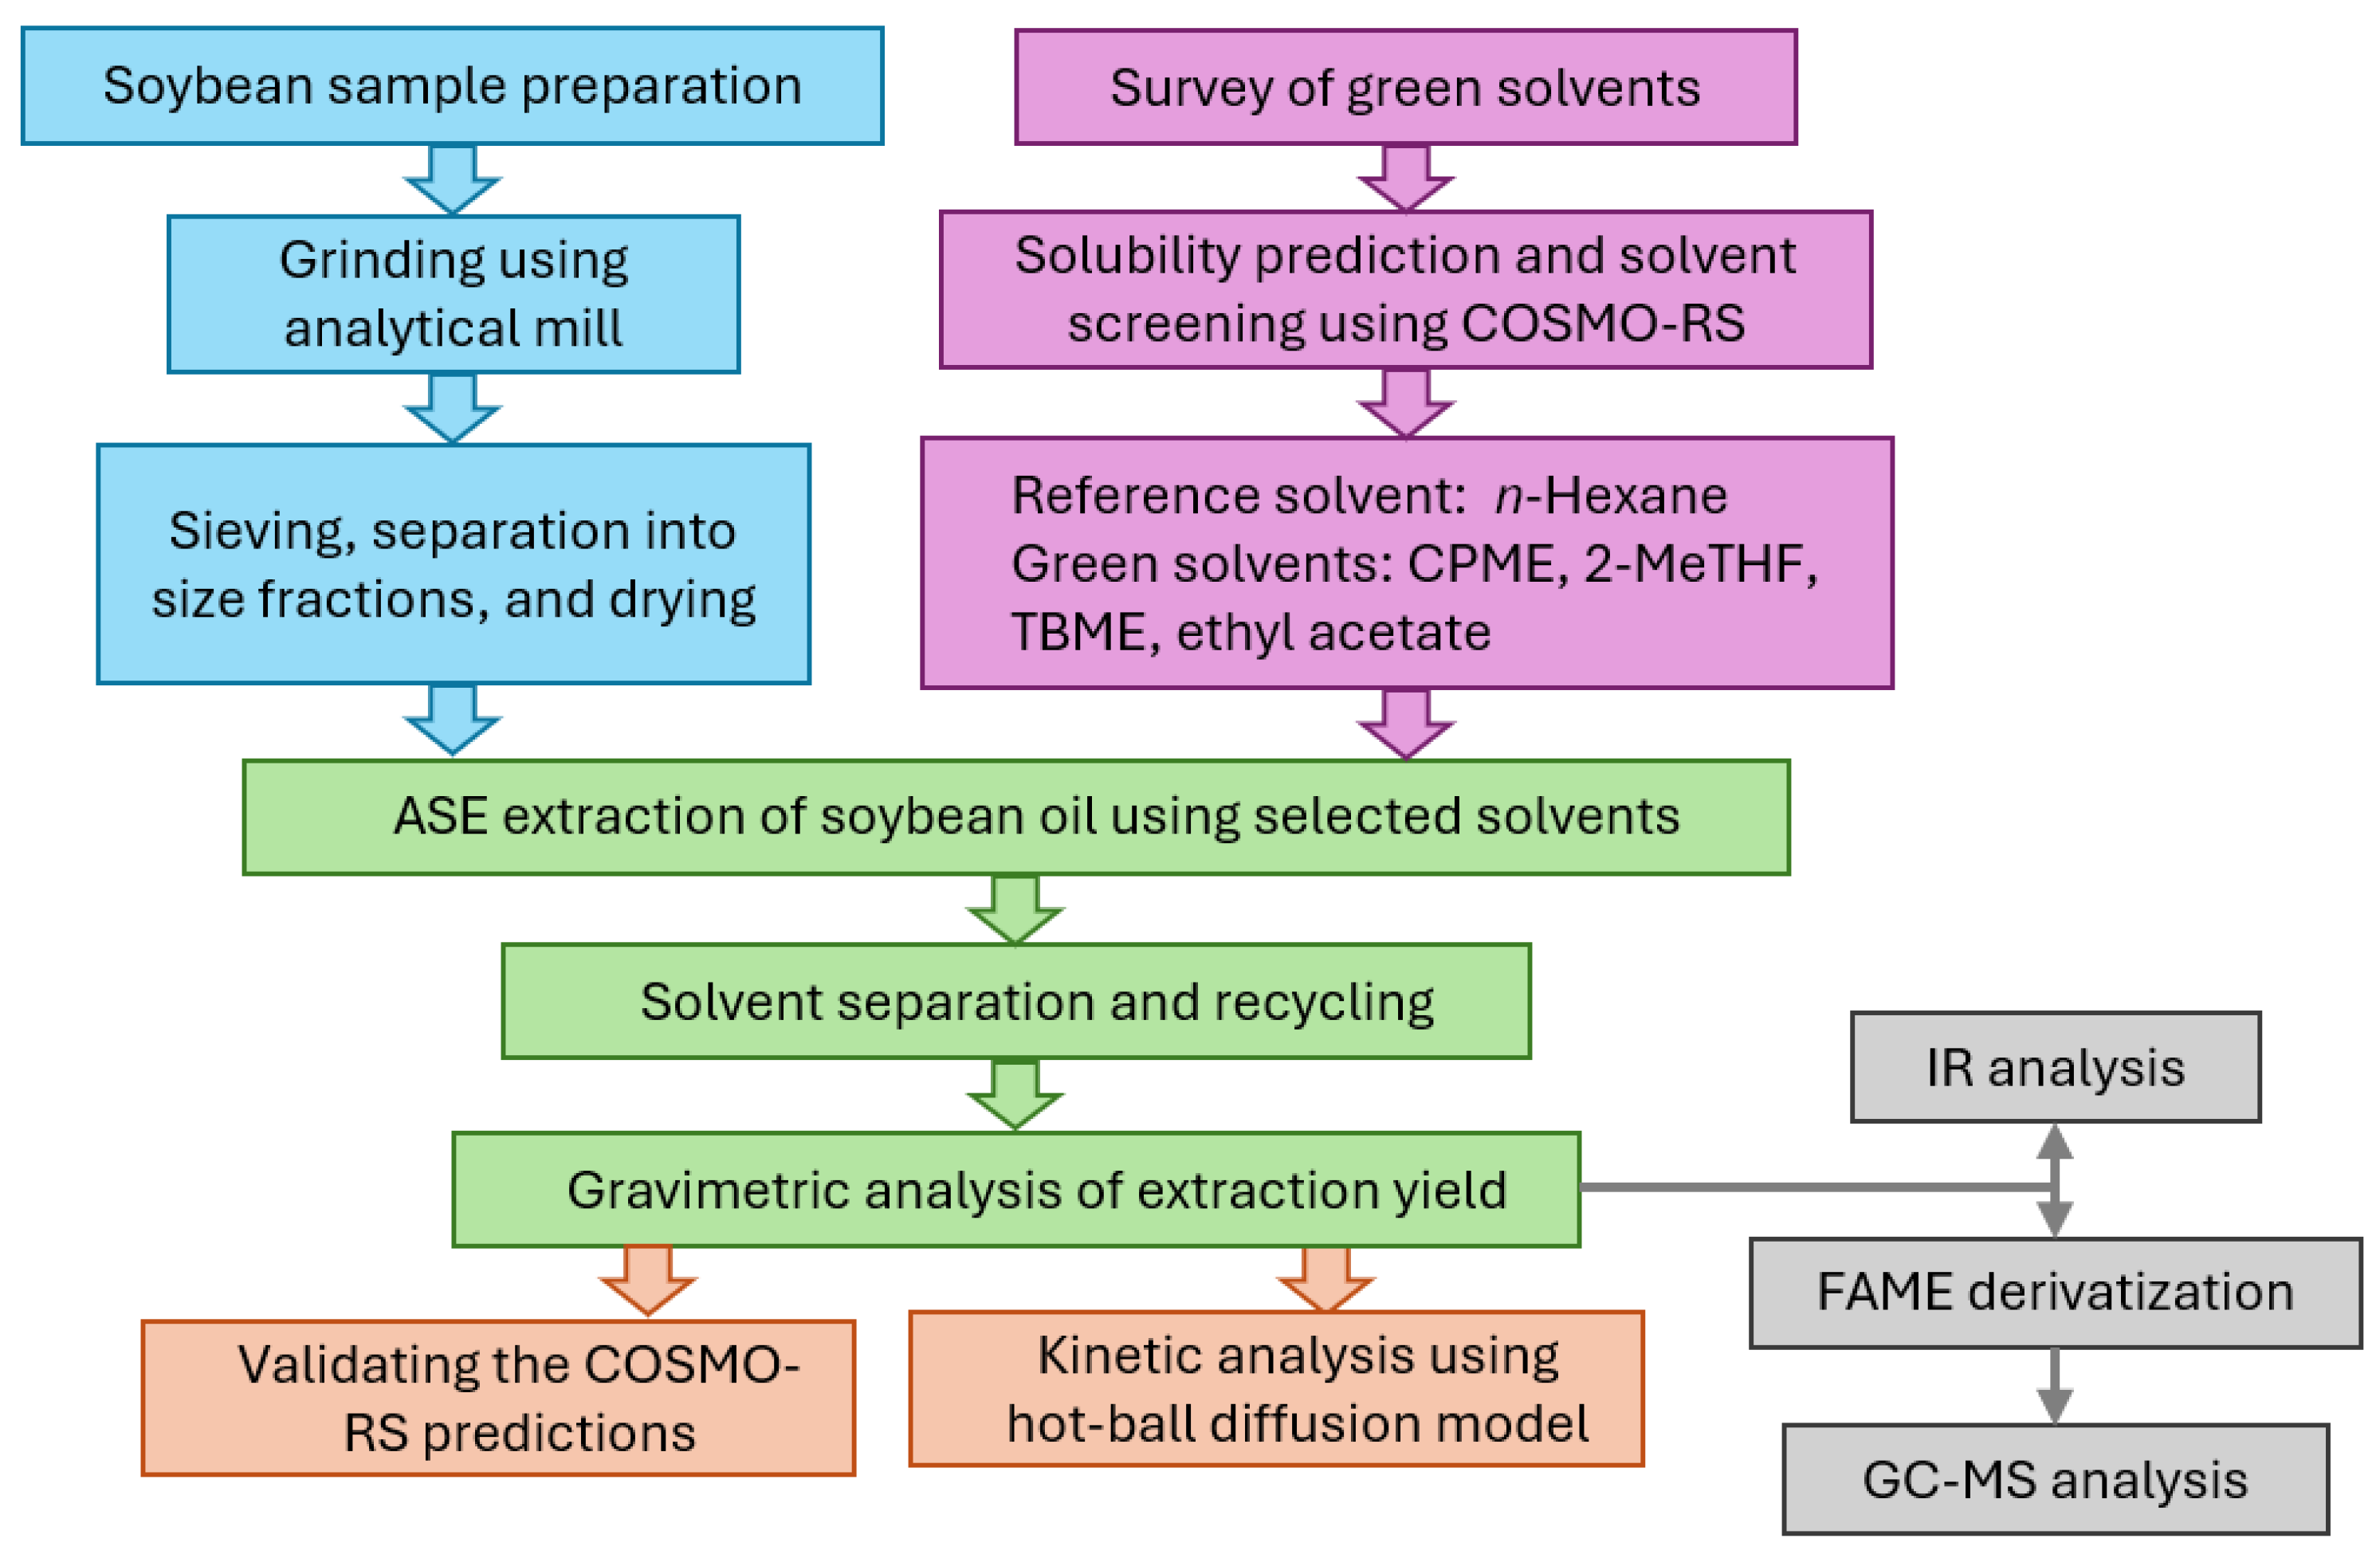
The experimental workflow integrated three components: computational screening of green solvents using COSMO-RS; accelerated solvent extraction (ASE) of soybean oil with the selected green solvents and n-hexane as a reference; and mechanistic kinetic analysis using the hot-ball diffusion model. Soybean samples were ground, sieved, and dried prior to extraction, and recovered oils were characterized by FT-IR and GC-MS. Experimental extraction yields were correlated with COSMO-RS predictions to validate the computational screening framework, and time-resolved extraction profiles were analyzed to estimate effective intraparticle diffusion coefficients (Figure 1).

2.3. Sample Preparation

Organic, non-GMO soybeans were visually inspected to remove damaged seeds and foreign material, then dried in a vacuum oven at 65 °C for 24 h to reduce moisture content prior to grinding. Approximately 500 g of dried soybeans were coarsely ground in successive batches of 50–100 g using an analytical grain mill to ensure uniformity and minimize thermal degradation of the oil.
The resulting powder was fractionated by particle size using a stack of U.S. standard stainless-steel sieves (mesh sizes: 1000 µm, 710 µm, 500 µm, and 250 µm). Collected fractions were characterized, and the fraction with a median particle diameter of approximately 337.5 µm, which produced the highest oil recovery in preliminary trials, was selected for all subsequent extractions.
Prior to extraction, the selected fraction was subjected to a second drying step in a vacuum oven at 65 °C for 24 h to minimize residual moisture, which can impair solvent-based extraction efficiency. Prepared samples were stored in airtight amber glass containers at room temperature, protected from light.

2.4. Solvent Selection and Green Metrics

Solvent selection was guided by sustainability criteria aligned with green chemistry principles, particularly those addressing safer solvents and auxiliaries (Principle 5), use of renewable feedstocks (Principle 7), and design for degradation (Principle 10). Four green solvents were evaluated as alternatives to n-hexane for ASE: 2-MeTHF, CPME, ethyl acetate, and TBME. Selection was based on a combination of COSMO-RS thermodynamic predictions (Section 2.7), literature precedent, and quantitative sustainability metrics from the GlaxoSmithKline (GSK) Solvent Selection Guide [12]. Key physicochemical and environmental properties of the selected solvents are summarized in Table 1.
GSK scores were obtained from Henderson et al. [12] and aggregate life-cycle assessments of waste generation, environmental toxicity, and process safety. Ethyl acetate and 2-MeTHF ranked highest in overall sustainability, reflecting their high biodegradability, low toxicity, and availability from renewable feedstocks. CPME and 2-MeTHF exhibit favorable process recyclability owing to their volatility and chemical stability under ASE conditions.

2.5. Extraction Procedure

2.5.1. Accelerated Solvent Extraction (ASE) Setup and Conditions

Accelerated solvent extraction was performed using a Dionex™ ASE™ system (Thermo Fisher Scientific, Waltham, MA, USA). For each extraction, 1.000 g of sieved soybean material was accurately weighed (analytical balance, ±0.1 mg) and combined with 2.000 g of diatomaceous earth, used as an inert dispersing agent to promote homogeneous cell packing and consistent solvent percolation. Extraction cells were assembled by placing a cellulose filter at the base, loading the soybean–diatomaceous earth mixture, positioning a second cellulose filter above the mixture, and filling the remaining void volume with glass beads to reduce dead space and improve solvent flow uniformity. Cells were sealed with end caps. All extractions were performed in triplicate.
ASE operating parameters were as follows: temperature, 100 °C; pressure, 1500 psi (automatically regulated to maintain the solvent in the liquid phase); one static extraction cycle; and static extraction times of 5, 10, 15, 20, and 30 min. Nitrogen was used as the pressurizing and purge gas. Solvent volume was automatically dispensed by the instrument (approximately 30 mL per cell).

2.5.2. Solvent Evaporation and Oil Recovery

Solvent removal was performed using a Multivapor™ (BUCHI Corporation, New Castle, DE, USA) parallel evaporation system capable of processing up to 12 vials per batch under controlled temperature and reduced-pressure conditions. Evaporation temperature and pressure were optimized for each solvent according to its boiling point to ensure complete solvent removal while minimizing thermal degradation of the extracted oil.
After apparent solvent evaporation, vials were transferred to a vacuum oven at 60 °C for 1 h to eliminate residual solvent traces. Samples were subsequently cooled to room temperature in a desiccator and weighed gravimetrically. Oil mass was determined by subtracting the pre-recorded empty vial mass, and extraction yield was expressed as the percentage of recovered oil relative to the initial soybean dry mass. Recovered solvents were collected, distilled, and reused in subsequent extraction runs, consistent with solvent waste-reduction principles [1].

2.5.3. Statistical Analysis

Extraction yield data are reported as mean ± standard deviation (n = 3 extractions). One-way analysis of variance (ANOVA) was performed to assess whether extraction yield at 5 min (the early, solvation-dominant stage) differed significantly among the five solvents, followed by Tukey’s honestly significant difference (HSD) post hoc test for pairwise comparisons. Differences were considered statistically significant at p < 0.05.

2.6. Characterization Techniques

2.6.1. Infrared (IR) Spectroscopy

FT-IR spectra of the extracted soybean oils were recorded using a PerkinElmer Spectrum 100 FT-IR spectrometer. Samples were analyzed directly without derivatization. Spectra obtained from oils extracted with n-hexane and each green solvent were compared with those of commercially available soybean oil. Characteristic absorption bands corresponding to the ester carbonyl (C=O stretch), aliphatic C-H stretching, and C-O stretching vibrations of triglycerides were evaluated across all samples [4]. Spectral consistency was used as evidence for preservation of triglyceride structure and the absence of significant solvent residues or thermal degradation products.

2.6.2. GC-MS Analysis of Fatty Acid Methyl Esters (FAMEs)

Fatty acid composition was determined by conversion of triglycerides to fatty acid methyl esters (FAMEs) via base-catalyzed transesterification using methanolic KOH [8]. Approximately 0.5 g of extracted soybean oil was combined with 5 mL of methanol and 0.5 mL of 0.5 M KOH in methanol. The mixture was vortexed for 30 s and heated at 55 °C for 10 min. After cooling to room temperature, 5 mL of saturated NaCl solution and 5 mL of n-hexane were added to induce phase separation. The mixture was vortexed and allowed to settle. The upper n-hexane layer containing FAMEs was collected and dried over anhydrous sodium sulfate. Approximately 1 mL of the extract diluted in n-hexane was transferred to a GC-MS vial.
GC-MS analysis was conducted on a Thermo Scientific TRACE 1310 Gas Chromatograph coupled to an ISQ QD Single Quadrupole Mass Spectrometer (Thermo Electron North America LLC, West Palm Beach, FL, USA) equipped with a Rtx-5 (Restek Corporation, Bellefonte, PA, USA) capillary column (30 m × 0.25 mm i.d.; 0.10 µm film thickness). Helium was used as the carrier gas at 1.2 mL min−1. The injection volume was 1 µL in split mode (split ratio, 100:1) with an injector temperature of 250 °C. The oven temperature program was as follows: initial hold at 160 °C for 0.5 min, ramp at 40 °C min−1 to 185 °C, 1 °C min−1 to 195 °C, 40 °C min−1 to 280 °C, and final hold at 280 °C for 0.5 min. The mass spectrometer was operated in electron ionization (EI) mode at 70 eV over an m/z scan range of 30–500. FAMEs were identified by comparison with mass spectral library data and by evaluation of characteristic fragmentation patterns [15].

2.7. Theoretical Model: COSMO-RS Solvent Screening

The thermodynamic compatibility between representative soybean oil triglycerides and candidate solvents was evaluated using the Conductor-like Screening Model for Real Solvents (COSMO-RS) implemented in BIOVIA COSMOthermX_2026 (Dassault Systèmes, Waltham, MA, USA). COSMO-RS integrates quantum chemical calculations with statistical thermodynamics to predict intermolecular interactions and phase behavior from molecular surface charge distributions, without requiring experimental data for individual solvent–solute pairs [27,28].
Four triglycerides were selected as structurally representative model compounds for soybean oil: trilinolein (C18:2), triolein (C18:1), tripalmitin (C16:0), and tristearin (C18:0). A broad solvent panel was evaluated comprising the primary green solvent candidates (2-MeTHF, CPME, TBME, ethyl acetate, diethyl ether, tetrahydrofuran (THF), and ethyl L(−)-lactate) as well as a set of conventional reference solvents (n-hexane, chloroform, dichloromethane, acetone, methanol, ethanol, 2-propanol, acetonitrile, toluene, benzene, dimethyl sulfoxide (DMSO), dimethylformamide (DMF), and water), included to benchmark green solvent performance against the established solvent landscape.
Three-dimensional triglyceride geometries were constructed in TURBOMOLE (TmoleX_2026, BIOVIA Dassault Systèmes, Waltham, MA, USA) and energy-minimized using density functional theory at the BP86/TZVP level under conductor boundary conditions (COSMO, ideal dielectric screening, ε = ∞), a level of theory well-established for COSMO-RS geometry optimization and electronic surface generation [27,29]. Optimizations used the default TmoleX convergence criteria: total energy converged to within 1 × 10⁻⁶ Hartree and the maximum norm of the Cartesian gradient converged to within 1 × 10⁻³ atomic units; no custom thresholds were applied [30]. Vibrational frequency calculations were not performed on the optimized triglyceride structures. For the selected triglycerides (>100 atoms per molecule, with multiple long, flexible acyl chains), frequency verification was impractical due to the computational time and cost. The lowest-energy conformers were subsequently used to generate the molecular surface charge density (COSMO) files required for COSMO-RS analysis. Solvent COSMO files and molecular descriptors were obtained from the COSMObase database distributed with COSMOthermX_2026, with Boltzmann-weighted conformer averaging applied automatically for solvents represented by multiple conformers. All COSMO-RS calculations employed the BP_TZVP_26 parameterization.
In the COSMO framework, the molecular surface charge density distribution (σ-surface) encodes the three-dimensional polarization charge density at the molecular surface, providing a visual and quantitative representation of hydrogen-bond-donating, hydrogen-bond-accepting, and nonpolar (dispersive) regions. Negative σ values correspond to electron-rich regions (hydrogen-bond acceptors); positive σ values indicate electron-deficient regions (hydrogen-bond donors). The σ-profile, p ( σ ) , is the probability-weighted histogram of surface segment charge densities, expressed as:
p ( σ ) = A ( σ ) A t o t a l
where A ( σ ) is the surface area associated with screening charge density σ and A t o t a l is the total molecular surface area. Comparison of σ-profiles between solvents and solutes provides qualitative insight into polarity matching and surface complementarity. The σ-potential, µ ( σ ) , describes the chemical potential of a surface segment of charge density σ in contact with the molecular surface ensemble of the solvent, providing a quantitative measure of the energetic favorability of surface interactions and hydrogen-bonding tendencies.
Initial attempts to obtain absolute mole-fraction solubility values yielded uniformly high predicted solubilities that were insufficiently sensitive to discriminate among the candidate solvents. Solvent ranking was therefore based primarily on activity coefficients at infinite dilution (γ∞), which provide a more sensitive thermodynamic descriptor of solute–solvent affinity. Lower γ∞ values indicate stronger intermolecular interactions and greater thermodynamic compatibility between solvent and triglyceride solute. The activity coefficient is related to the chemical potential difference between real and ideal solution states by:
γ i = l i m x i 0 γ i
Average γ values were calculated across the four triglycerides for each solvent to obtain a composite ranking of thermodynamic compatibility with soybean oil. In addition to γ∞, two complementary relative solubility descriptors were evaluated: the relative solubility mole fraction ( x R S ) and the relative solubility mass ratio ( w R S ), as given by Equation (4), where M W s o l u t e and M W s o l v e n t are the molecular weights of the respective species. These three descriptors, γ , x R S , and w R S , collectively capture complementary aspects of thermodynamic solvent–solute affinity and were used together to rank solvent performance. All COSMO-RS calculations were performed at 100 °C to match ASE operating conditions. The predicted thermodynamic descriptors were correlated with experimental extraction yields to evaluate the predictive utility of COSMO-RS for green solvent selection in soybean oil extraction. In addition, infinite-dilution molecular diffusion coefficients ( D m ) of the four triglycerides in each solvent were estimated at 100 °C using the DIFFCOEFF option of COSMOthermX_2026, which relates D to COSMO-RS descriptors of the solute and solvent through a quantitative structure–property relationship (QSPR). Diffusion coefficients were averaged across the four triglycerides to obtain a representative molecular diffusivity for each solvent.

3. Results and Discussion

3.1. COSMO-RS Solvent Screening for Soybean Oil Components

The Conductor-like Screening Model for Real Solvents (COSMO-RS) was employed to evaluate the thermodynamic compatibility between representative soybean oil triglycerides and a panel of conventional and green solvents, providing a computationally guided basis for sustainable solvent selection [27,28]. COSMO-RS combines quantum mechanical (QM) calculations with a statistical thermodynamics treatment of molecular surface interactions, enabling the prediction of activity coefficients, solvation free energies, and solubility without requiring experimental data for each solvent–solute pair [31]. Four structurally representative triglycerides, namely trilinolein (C18:2), triolein (C18:1), tripalmitin (C16:0), and tristearin (C18:0), were selected on the basis of the relative abundance of their corresponding fatty acid methyl esters, as determined by GC-MS analysis of extracted soybean oil. Three-dimensional molecular geometries were optimized at the BP86/TZVP level of DFT under COSMO conductor boundary conditions using TURBOMOLE (TmoleX_2026), well-established for generating reliable COSMO cavity descriptions [27,29]. Computational details, including convergence criteria and the treatment of frequency verification, are given in Section 2.7. The lowest-energy conformers were subsequently used as input structures for COSMO-RS calculations in COSMOThermX_2026. The combined descriptor set, comprising molecular surface charge density maps (σ-surfaces), charge density distributions (σ-profiles), surface interaction energy profiles (σ-potentials), activity coefficients at infinite dilution (γ∞), mole fraction solubility ( x R S ), and relative mass solubility ( w R S ), provides a multi-scale evaluation of solute–solvent interactions spanning molecular recognition to bulk thermodynamic affinity.
Green solvent candidates were identified from the literature and evaluated against established sustainability criteria, with particular reference to the GlaxoSmithKline (GSK) Solvent Selection Guide, which scores solvents across environmental, health, and safety (EHS) dimensions [12]. CPME, 2-MeTHF, TBME, and ethyl acetate were prioritized due to their favorable EHS profiles relative to conventional solvents such as hexane and chlorinated alternatives [2,8]. Reference solvents, including chloroform, THF, diethyl ether, dichloromethane, toluene, benzene, hexane, acetone, carbon tetrachloride, and a series of polar solvents, were included to benchmark the green candidates against the established solvent performance landscape.

3.1.1. Molecular Surface Charge Density: σ-Surfaces and σ-Profiles

In the COSMO-RS framework, the σ-surface encodes the three-dimensional distribution of polarization charge density at the molecular surface, providing a visual and quantitative representation of the electrostatic character of each molecule. Regions of near-zero charge density (σ ≈ 0 e2) indicate nonpolar, dispersive surfaces, while pronounced negative σ regions correspond to electron-rich hydrogen-bond-accepting sites and positive σ regions to electron-deficient hydrogen-bond-donating sites [27].
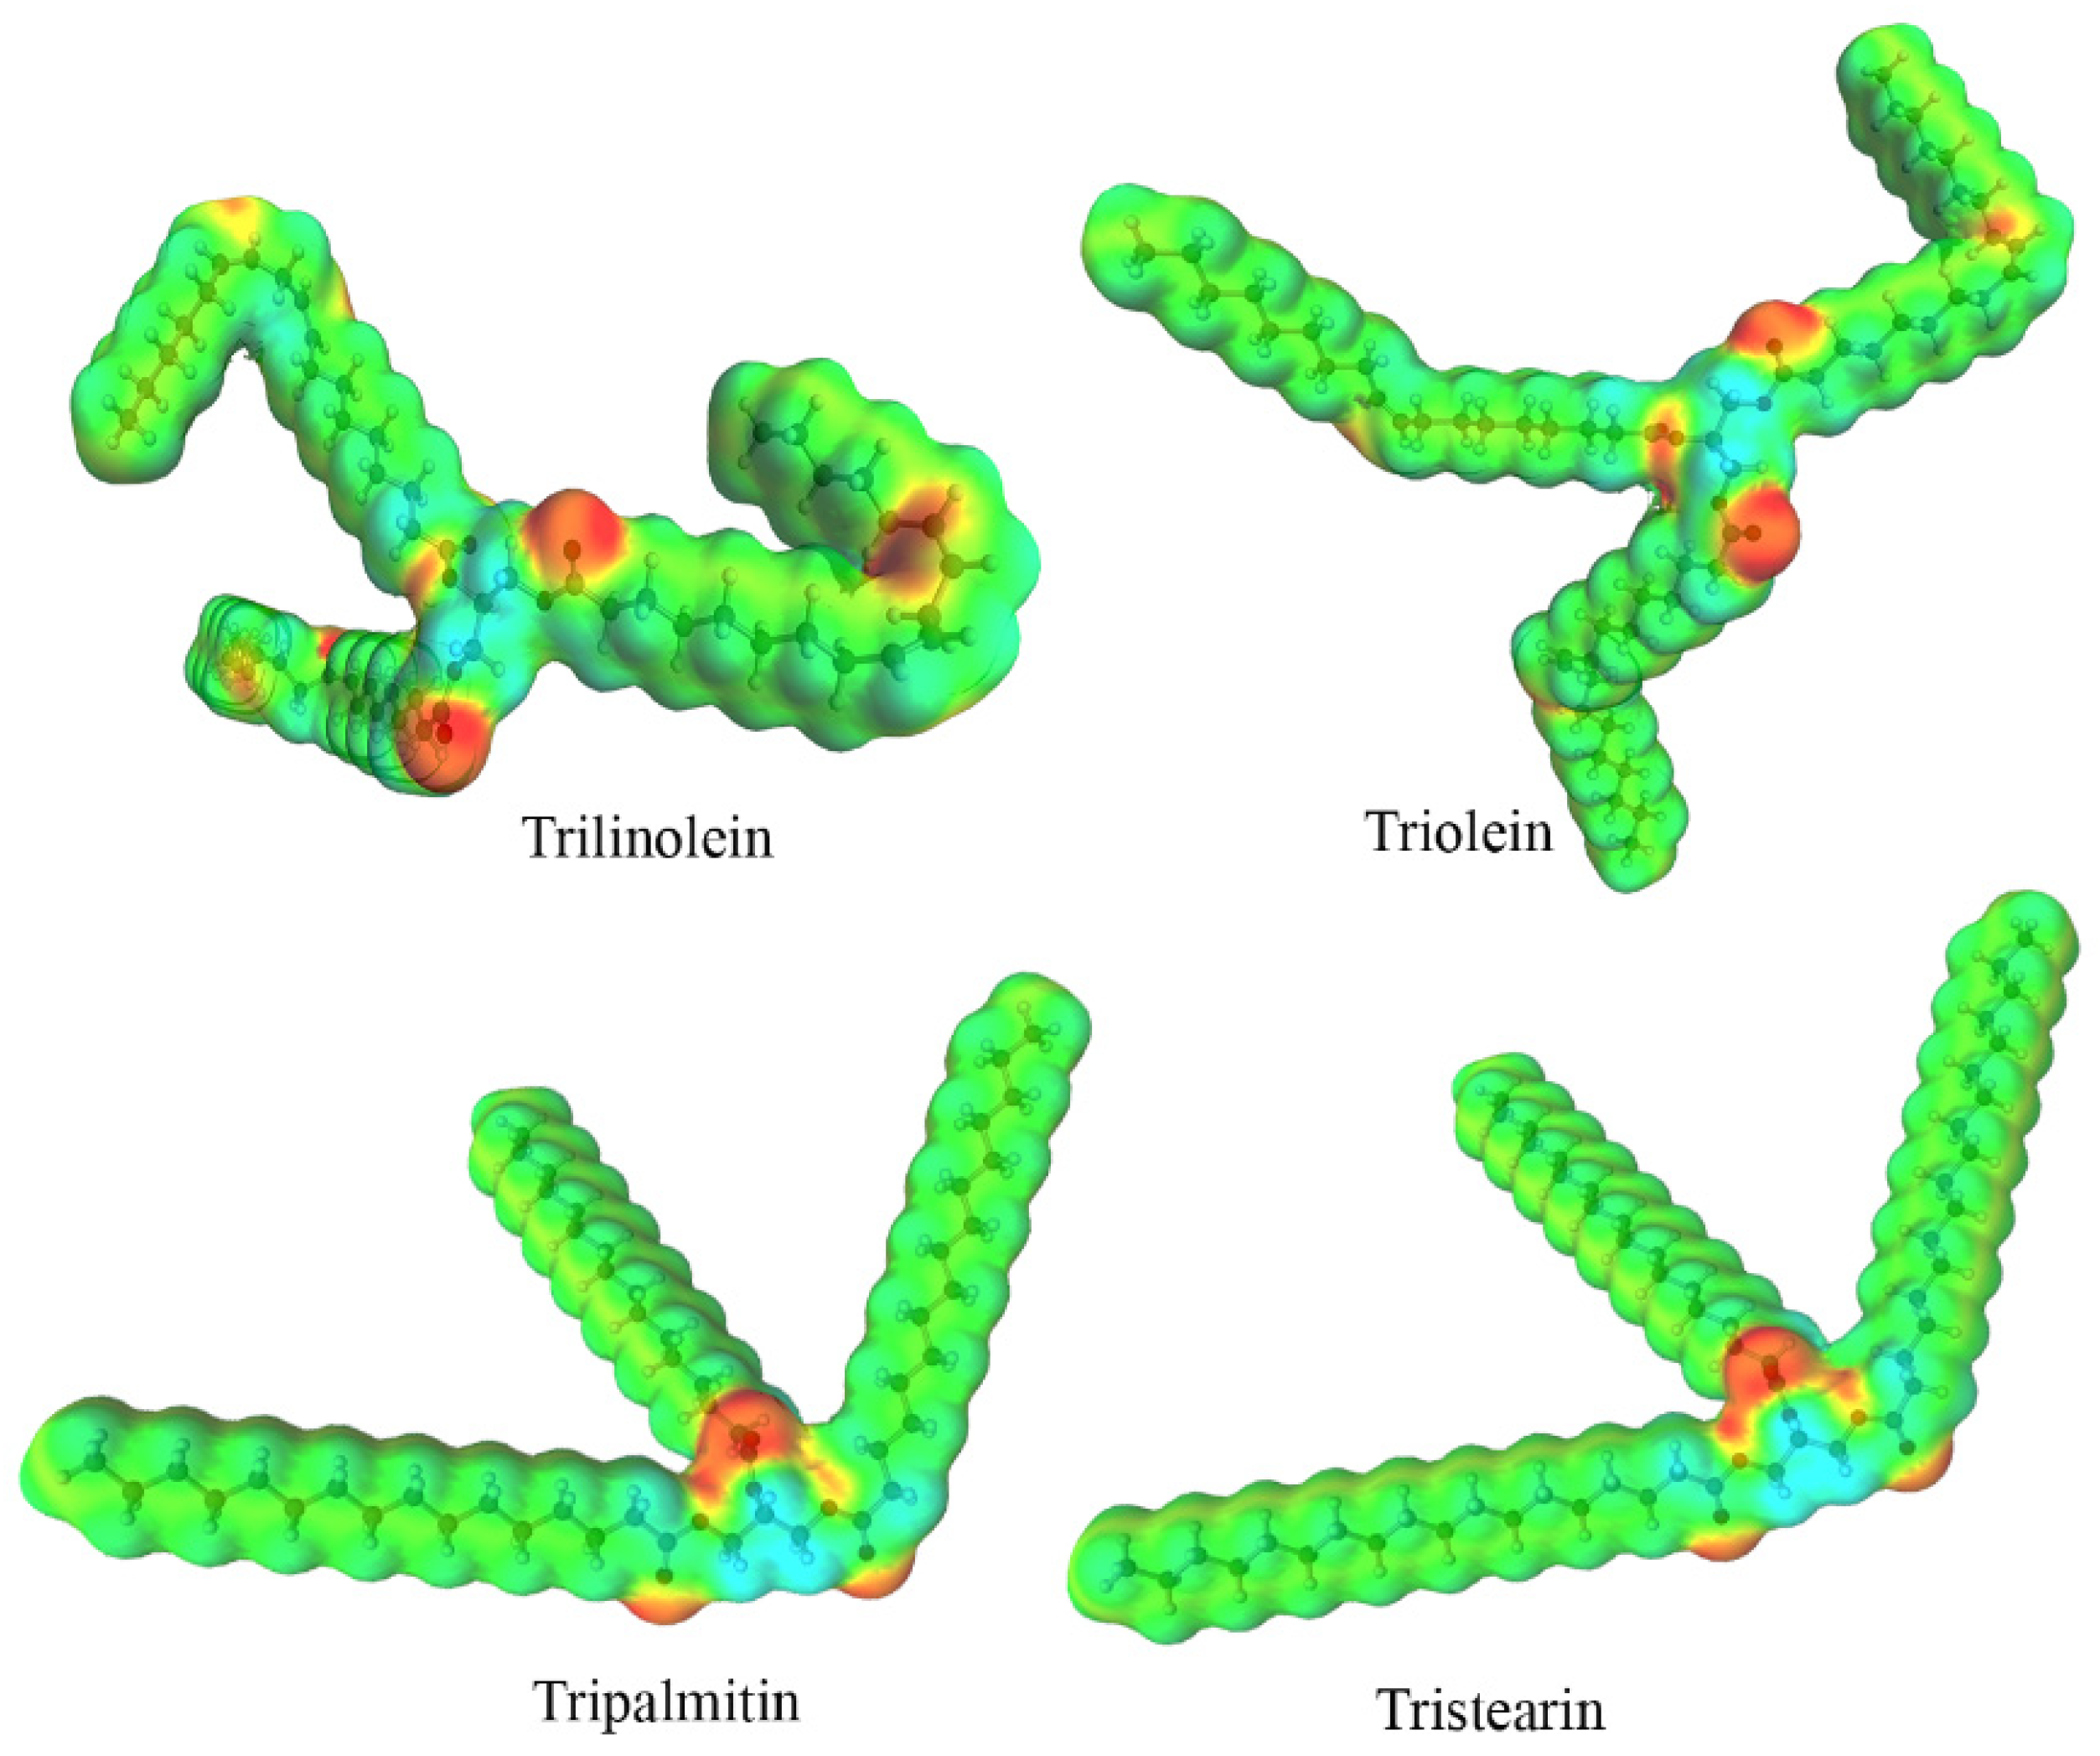
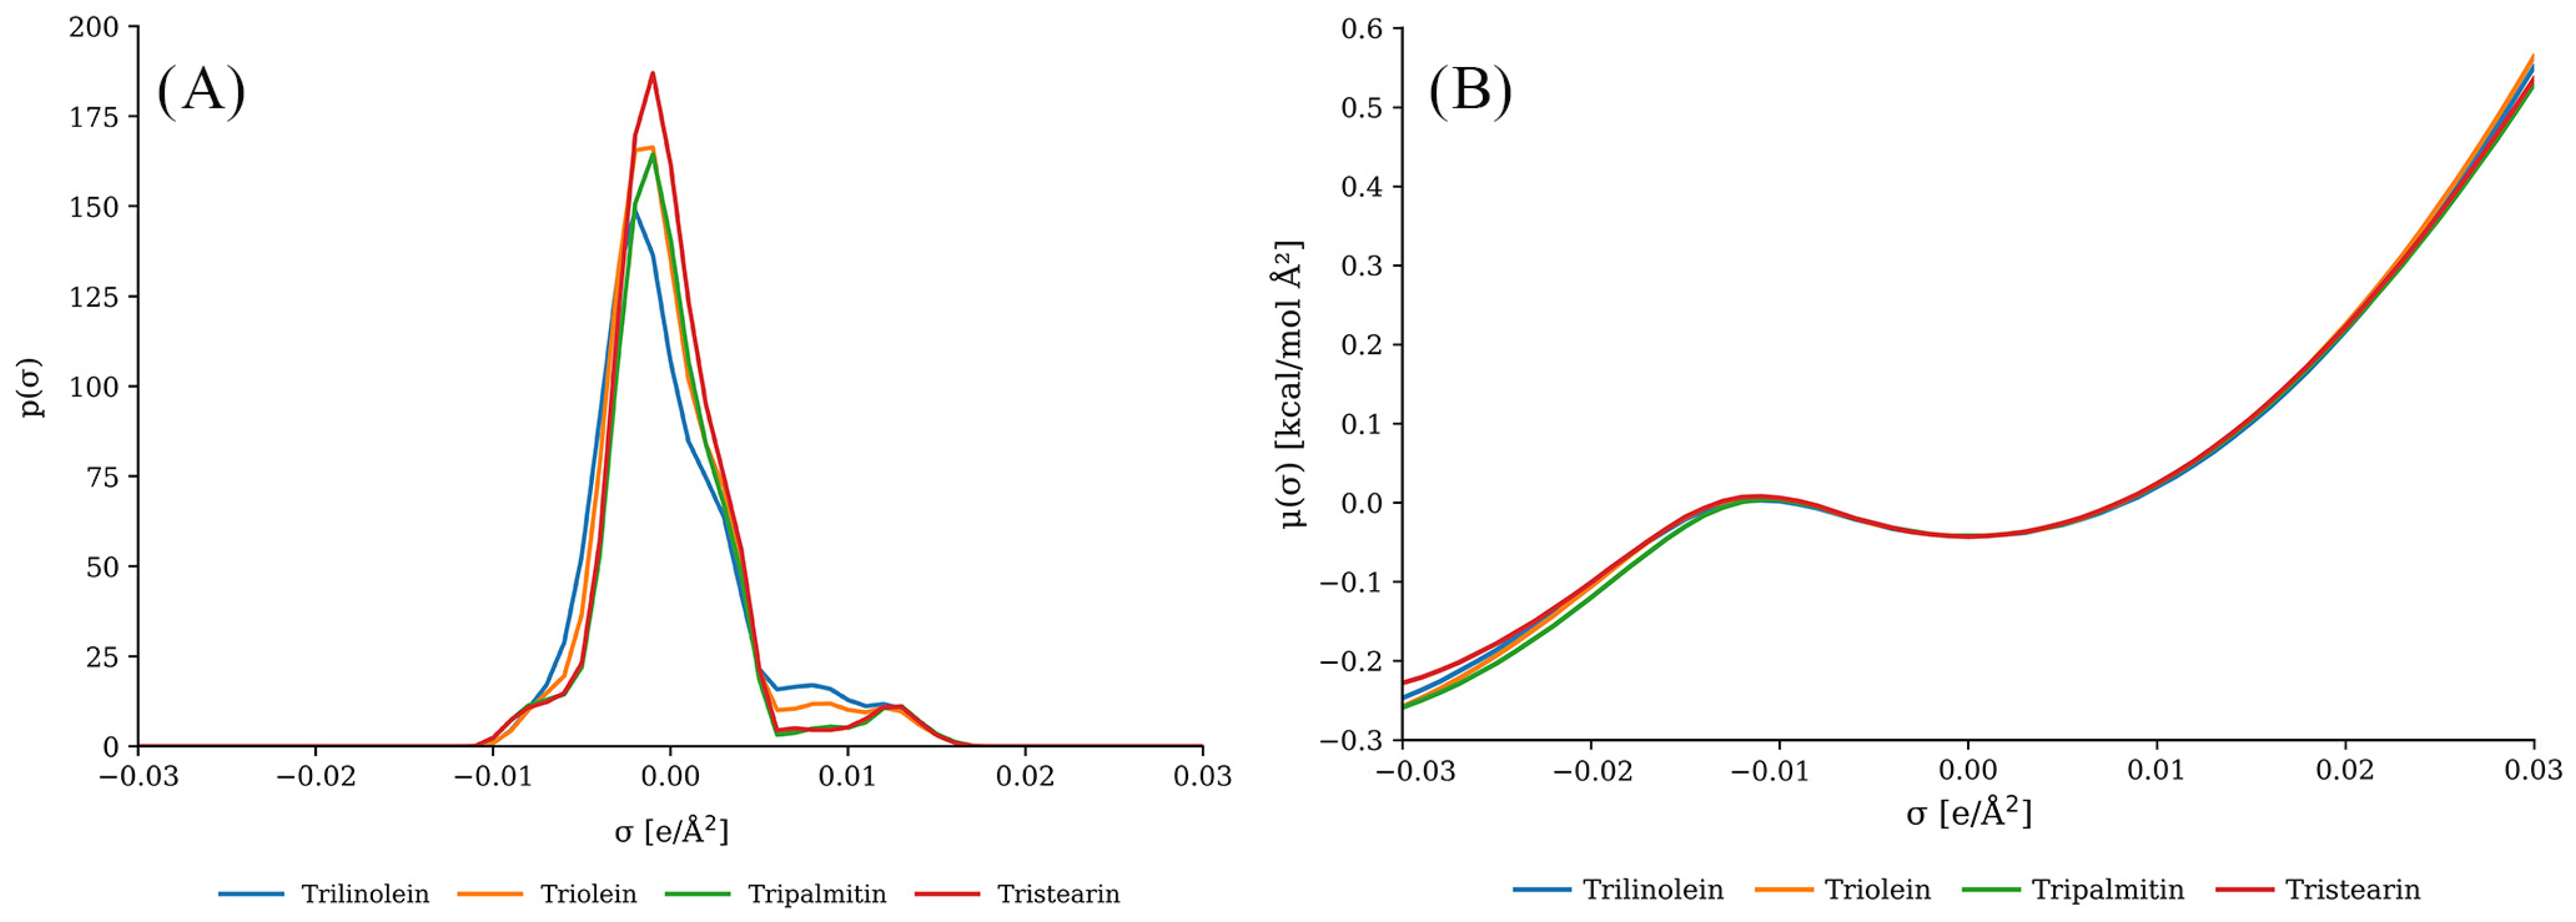
The σ-surfaces of the four triglycerides (Figure 2) reveal a molecular architecture dominated by extended, nonpolar acyl chains, which collectively account for the overwhelming majority of the accessible molecular surface area. Localized regions of elevated charge density are restricted to the glycerol ester linkages, reflecting the moderate polarity of the carbonyl and ether oxygen moieties. The σ-profiles (Figure 3A), which represent the probability-weighted histogram of surface segment charge densities, corroborate this observation: all four triglycerides exhibit pronounced peaks in the nonpolar window (−0.01 ≤ σ ≤ +0.01 e2) with negligible contributions in the hydrogen-bond donor (σ > +0.01 e2) and acceptor (σ < −0.01 e2) regions. These σ-profile signatures confirm that solvation of triglycerides is governed primarily by dispersive van der Waals interactions, with hydrogen bonding playing a negligible thermodynamic role [15,29].
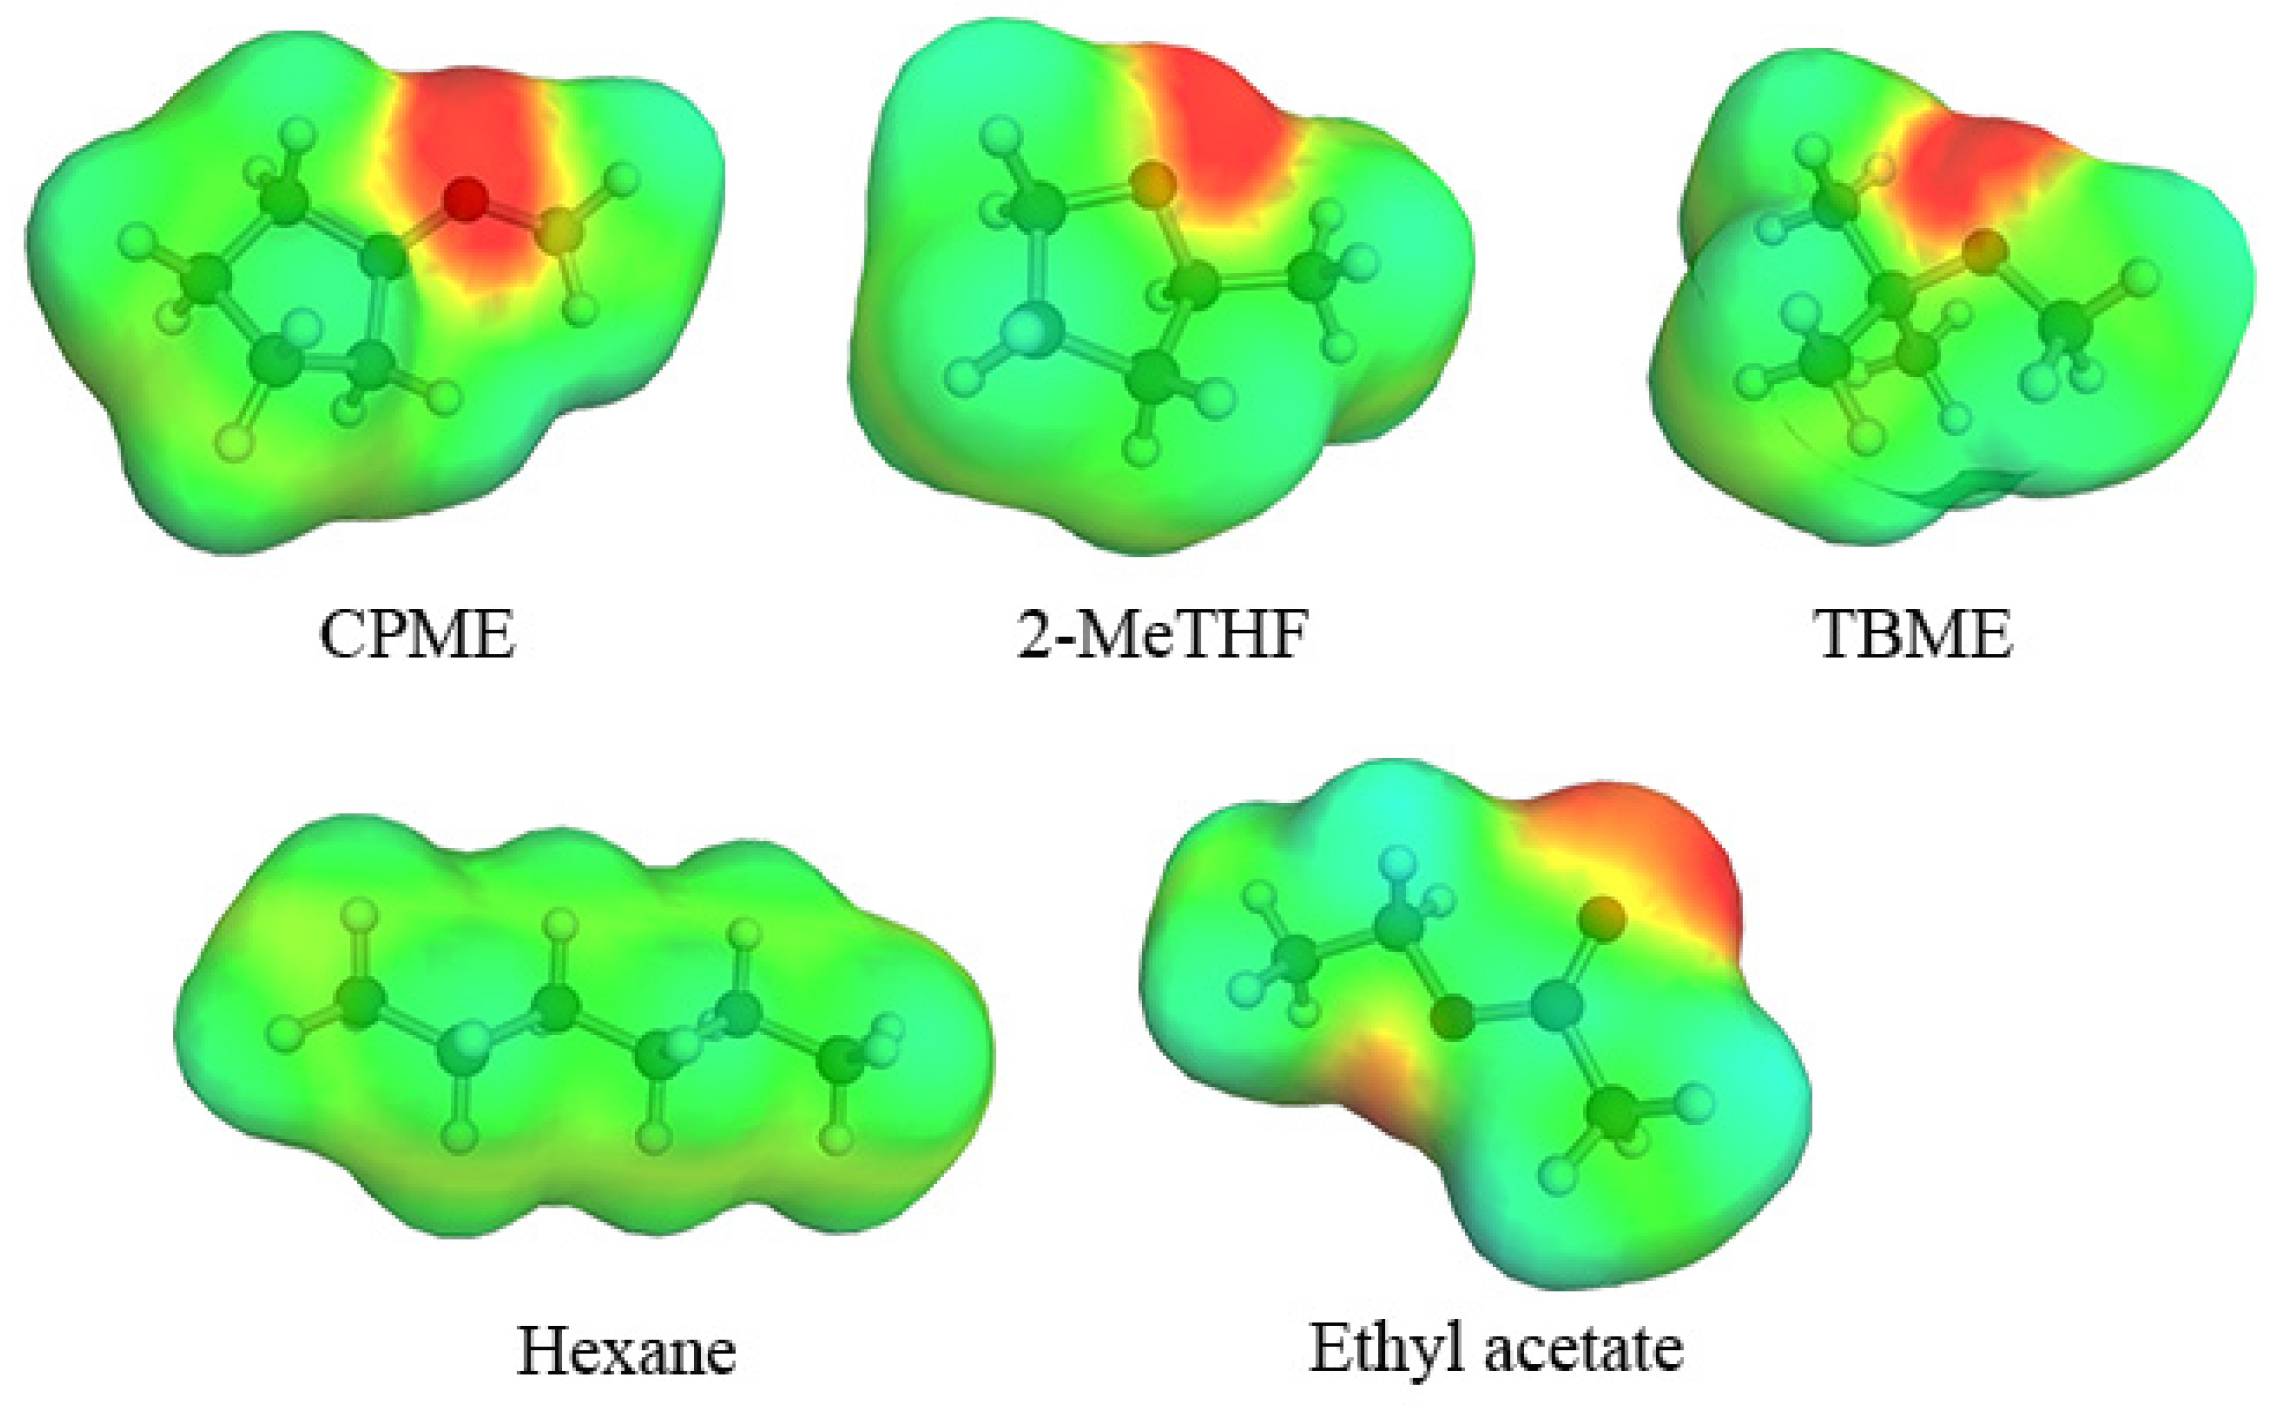
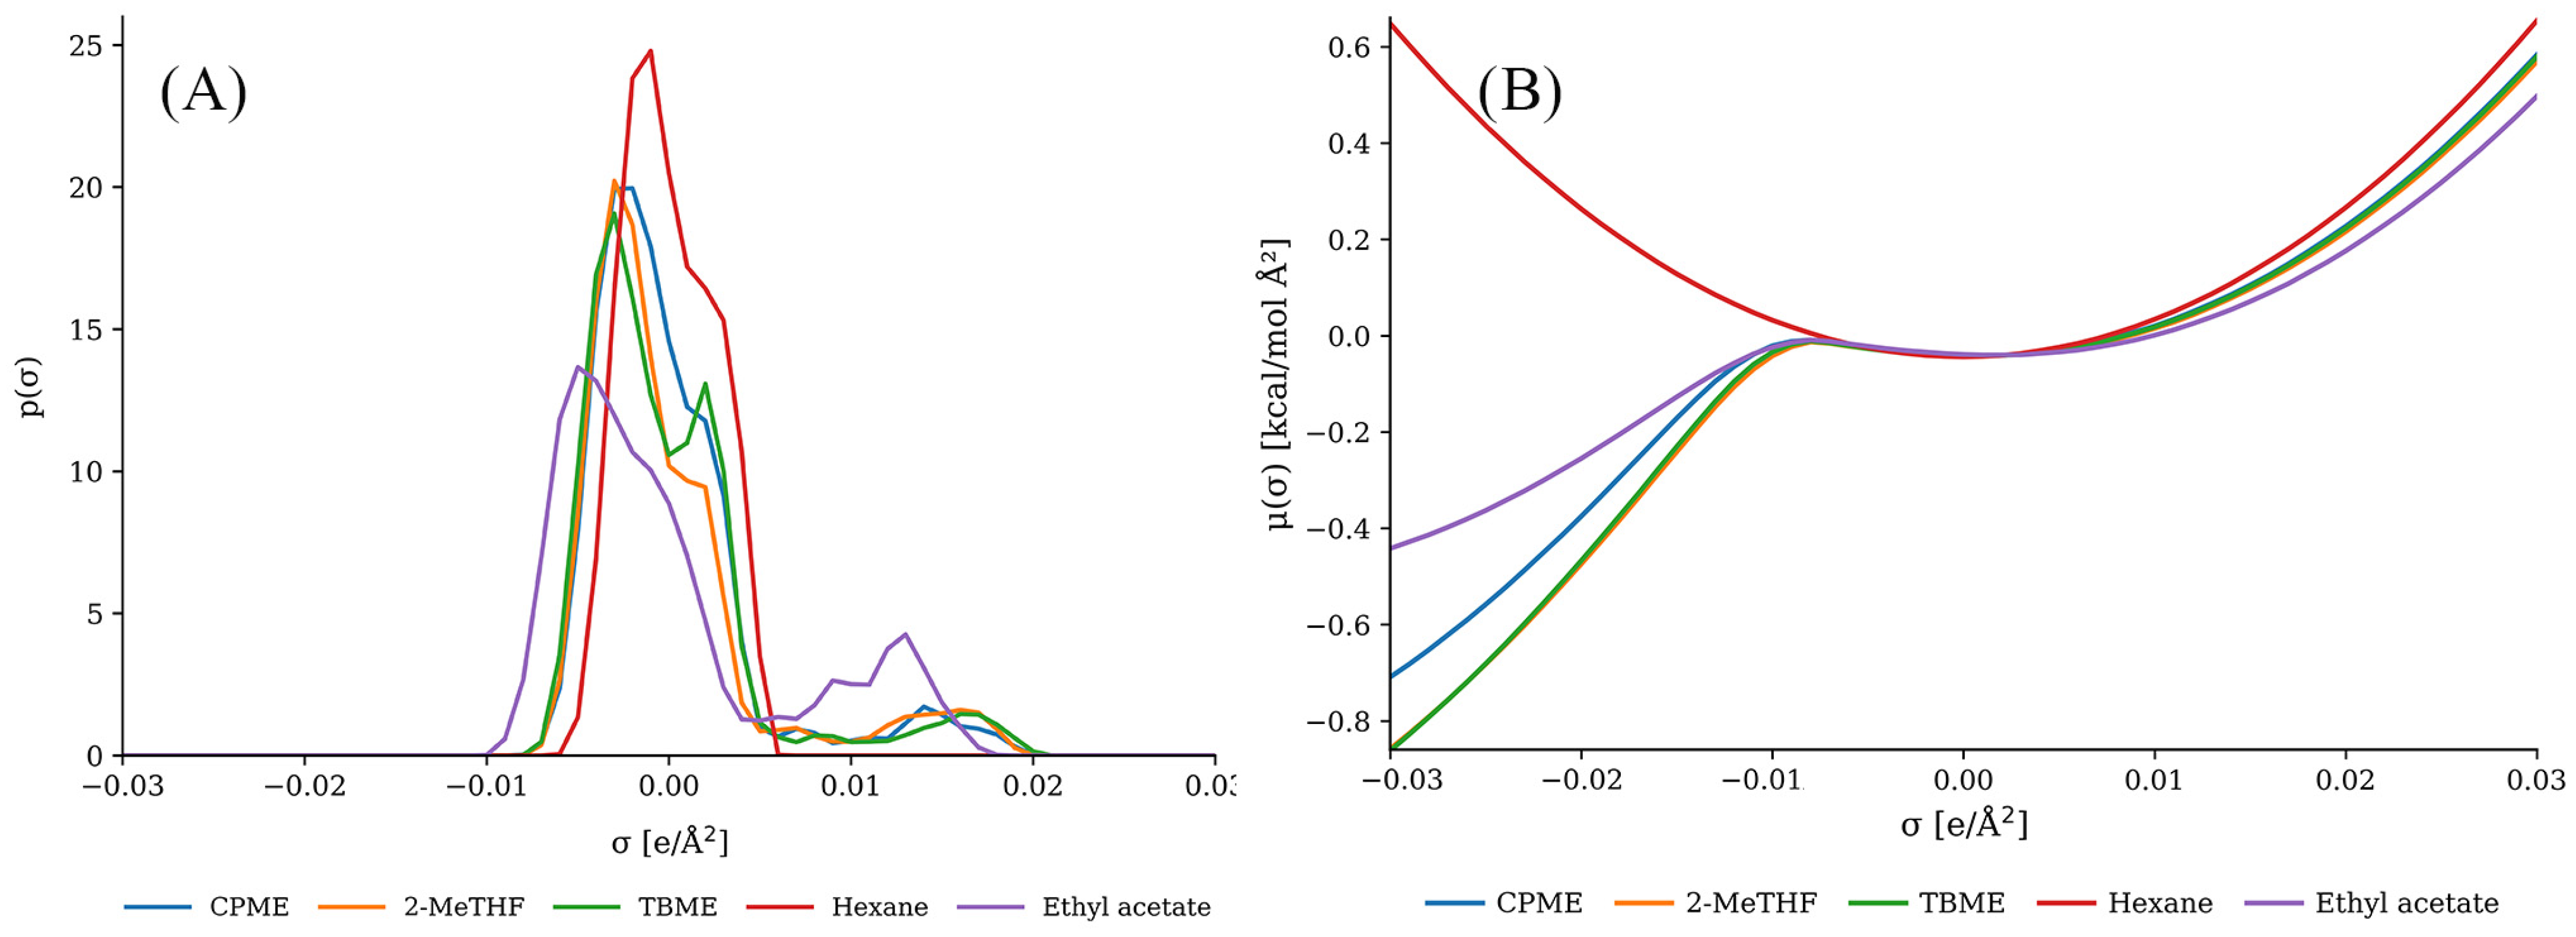
Among the solvents evaluated, ether-based candidates (2-MeTHF, CPME, and TBME) display σ-surfaces (Figure 4) characterized by predominantly nonpolar regions with a moderate, localized negative-σ contribution from the ether oxygen lone pairs. This profile closely mirrors that of the triglycerides, indicating favorable surface complementarity. The σ-profiles of these green ethers (Figure 5A) show substantial overlap with those of the triglycerides in the nonpolar region, and their moderate hydrogen-bond-accepting capacity does not introduce significant polarity mismatch. Hexane, by contrast, presents a purely nonpolar σ-profile but lacks the ether oxygen’s weak polar interaction capacity, which results in comparatively weaker overall solute–solvent affinity. Ethyl acetate shows a broader σ-profile extending toward the acceptor region, reflecting its higher polarity and the presence of the carbonyl group, which partially reduces compatibility with the nonpolar triglyceride surface.

3.1.2. σ-Potentials: Surface Interaction Energetics

The σ-potential, μ(σ), quantifies the chemical potential that a surface segment of charge density σ experiences when interacting with the molecular surface ensemble of a solvent or solute [27]. It is a key descriptor for assessing the energetic driving force for solute–solvent surface interactions: a negative μ(σ) at a given σ value indicates that segments of that polarity are energetically stabilized in the system, whereas a positive value indicates destabilization [31].
The σ-potentials of the triglycerides (Figure 3B) display characteristic shallow minima in the nonpolar region, consistent with a surface that is most readily accommodated by nonpolar solvents through dispersion interactions. The absence of pronounced extrema at donor or acceptor σ values further confirms that hydrogen bonding contributes negligibly to the energetics of triglyceride solvation. The σ-potential curves of 2-MeTHF, CPME, and TBME (Figure 5B) closely track those of the triglycerides in the nonpolar and weakly polar regions, demonstrating strong energetic compatibility and the absence of significant unfavorable polar interactions. Ethyl acetate displays a greater offset in the acceptor region due to its higher surface polarity, while hexane, though occupying the nonpolar region, exhibits a less favorable σ-potential at moderate negative-σ values compared to ether solvents, indicating a reduced capacity for interaction with the weakly polar ester moieties of the triglycerides. The convergence of σ-surface, σ-profile, and σ-potential analyses thus provides internally consistent, multi-level evidence that green ether solvents are thermodynamically well-matched to soybean oil triglycerides.

3.1.3. Quantitative Thermodynamic Descriptors: γ∞, x R S , and w R S

The thermodynamic affinity between solvent and solute is quantified by the activity coefficient at infinite dilution (γ∞), which reflects the excess chemical potential of the solute in an infinitely dilute solution and is related to the Gibbs free energy of solvation by:
Δ G s o l v =   R T   l n   γ
Values of γ∞ < 1 indicate that the solute–solvent interactions are more favorable than solute-solute interactions, corresponding to a negative excess Gibbs energy of mixing and a strong thermodynamic driving force for dissolution [15,27]. Conversely, γ∞ > 1 reflects unfavorable solvation, associated with positive excess Gibbs energy. COSMOThermX additionally provides mole fraction solubility estimates in logarithmic form, log10( x R S ), and the relative mass solubility ( w R S ), derived as:
w R S = x R S × M W s o l u t e M W s o l v e n t
These three descriptors (γ∞, log10( x R S ), and w R S ) are used collectively to rank solvent performance, as each captures a complementary aspect of thermodynamic compatibility: γ∞ reflects the molecular-level interaction quality, x R S quantifies the mole-fraction-based thermodynamic solubility, and w R S provides a practically relevant, mass-normalized measure of solvent capacity. It is important to note that COSMOThermX-derived solubility descriptors represent relative, comparative values computed under idealized conditions and may exceed physically attainable concentrations; they are therefore interpreted as thermodynamic affinity rankings rather than absolute solubility limits [31,32].
Table 2 provides the average thermodynamic ranking across the full panel of solvents based on γ∞, log10( x R S ), and w R S values of triglycerides at 100 °C, a temperature representative of ASE operating conditions. A clear monotonic correlation is observed: solvents with lower γ∞ exhibit proportionally higher log10( x R S ) and w R S values, confirming that activity coefficient minimization is the primary thermodynamic driver of increased solubility. This internal consistency across three independently calculated descriptors reinforces the reliability of the COSMO-RS predictions.
Among all solvents evaluated, chloroform, tetrahydrofuran, and diethyl ether rank highest in thermodynamic affinity; however, their use is precluded or strongly discouraged for food-grade and sustainable extraction applications due to toxicity, volatility, and environmental persistence concerns [8].
Within the green solvent subset, 2-MeTHF (γ∞ = 0.047), TBME (γ∞ = 0.065), and CPME (γ∞ = 0.081) demonstrate uniformly low activity coefficients that rank above hexane (γ∞ = 0.318) by a factor of approximately 4–7, and achieve higher relative solubility ( w R S = 4.22 × 10¹², 3.13 × 10¹², and 2.26 × 10¹², respectively) than hexane ( w R S = 8.94 × 10¹¹). These results are consistent with previous COSMO-RS-based assessments of ether solvents for vegetable oil extraction [4,15,29] and can be rationalized by the ether oxygen’s capacity to engage in weak but favorable polar interactions with the ester groups of the triglyceride backbone, augmenting the dominant dispersive contribution and yielding a net solvation free energy advantage over purely nonpolar hexane. The lower γ∞ of 2-MeTHF relative to TBME and CPME likely reflects its smaller molecular volume, which reduces the energetic cost of cavity formation in the solvent, a key determinant of solvation thermodynamics for large solutes such as triglycerides.
Moderately polar solvents, including ethyl acetate (γ∞ = 0.494) and acetone (γ∞ = 0.921), display intermediate affinity, with the polarity mismatch between their carbonyl groups and the predominantly nonpolar triglyceride surface reducing thermodynamic compatibility. Highly polar and protic solvents, including 2-propanol (γ∞ = 6.81), ethanol (γ∞ = 55.1), methanol (γ∞ = 3.06 × 10³), acetonitrile (γ∞ = 3.27 × 10⁵), and water (γ∞ = 5.78 × 1024), exhibit orders-of-magnitude higher activity coefficients, reflecting the profound thermodynamic incompatibility between strongly hydrogen-bonding solvents and the nonpolar triglyceride matrix. The negligible computed solubility of triglycerides in water (log10( x R S ) = −14.1) is consistent with their known hydrophobicity and validates the predictive framework.
The COSMO-RS screening identifies green ether solvents, particularly 2-MeTHF, TBME, and CPME, as the optimal sustainable alternatives to hexane for soybean oil extraction, combining strong thermodynamic affinity with favorable EHS profiles [8,12]. The preferential solvation of triglycerides by ether-based solvents over hexane, despite both being predominantly nonpolar, highlights the thermodynamic contribution of weak but non-negligible polar interactions that COSMO-RS captures through its surface charge density framework. These predictions provide the thermodynamic rationale for the experimental extraction study described in Section 3.2.

3.2. Extraction Performance of Green Solvents and Correlation with COSMO-RS Predictions

To validate the thermodynamic predictions from COSMO-RS screening (Section 3.1), soybean oil extraction was carried out experimentally using accelerated solvent extraction (ASE) under standardized conditions. The extraction yield, expressed as mass of oil recovered per gram of dry soybean material (mg/g), was measured at five time intervals (5, 10, 15, 20, and 30 min) for five solvents: CPME, 2-MeTHF, and TBME as green ether candidates; ethyl acetate as a polar green reference; and n-hexane as the conventional industrial benchmark. All results are reported as mean ± standard deviation (n = 3) and are summarized in Table 3.
It is important to note that COSMO-RS predictions were computed for four representative triglyceride components of soybean oil (trilinolein, triolein, tripalmitin, and tristearin), and therefore describe thermodynamic affinity with respect to the major glycerolipid fraction. The experimental extraction yield reflects the total extractable mass recovered under ASE conditions, which may include minor co-extracted components such as free fatty acids, tocopherols, plant sterols, and other lipophilic species. Based on the established fatty acid profile of soybean oil, triglycerides constitute the overwhelming majority (>95%) of the extractable lipid fraction [4,8]. The contribution of minor co-extracts to the total yield is therefore assumed negligible for the purposes of comparing predicted and experimental solvent performance trends, though this assumption is acknowledged as an inherent limitation of direct quantitative comparison.

3.2.1. Extraction Yield and Solvent Ranking

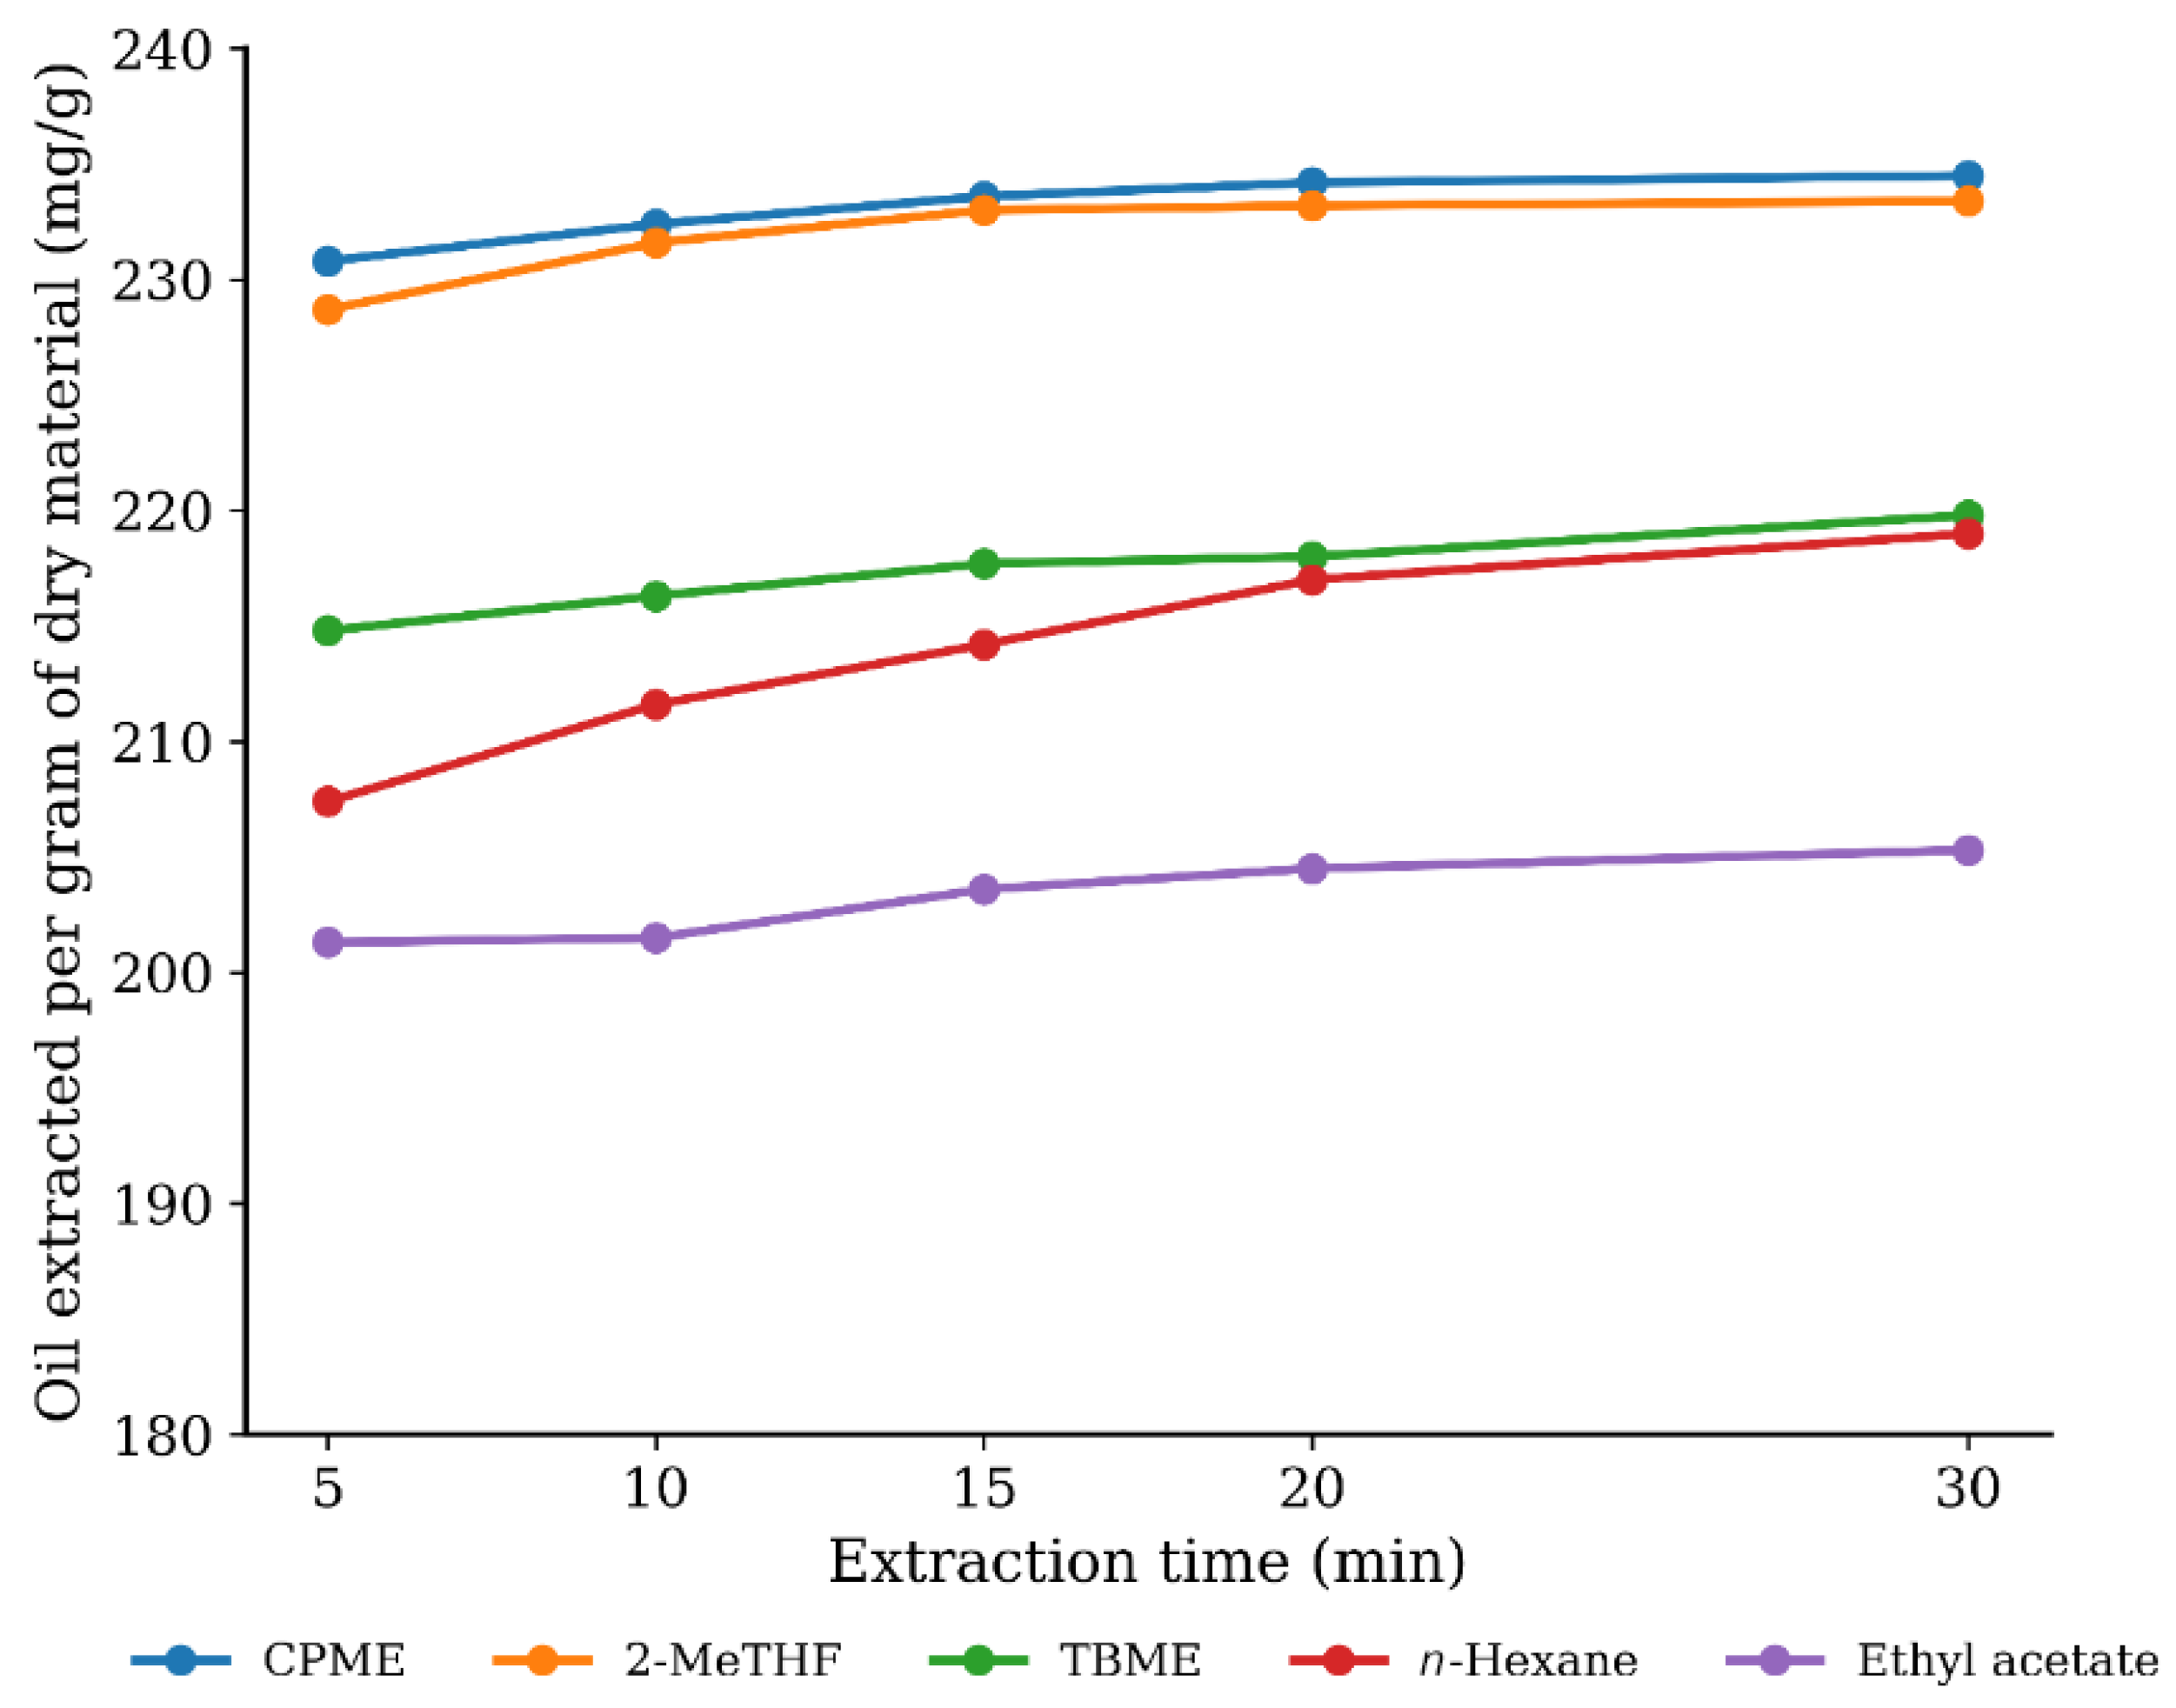
All five solvents produced a characteristic rapid initial extraction followed by a progressive approach to a plateau (Figure 6), consistent with solid–liquid extraction behavior commonly observed for oilseeds under pressure-assisted conditions [4,33]. Among the solvents evaluated, CPME and 2-MeTHF achieved the highest total extraction yields at 30 min, surpassing n-hexane by approximately 7%. TBME closely matched n-hexane at this stage, while ethyl acetate produced the lowest recovery of all tested solvents despite its classification as a green alternative.
Inter-solvent differences were most pronounced during the early extraction phase, where solvation thermodynamics rather than mass transfer resistance governs the extraction rate. As extraction progressed beyond 15 min, these differences diminished and yields converged toward a plateau, reflecting a shift to diffusion-limited behavior.

3.2.2. Thermodynamic Basis for Observed Extraction Trends

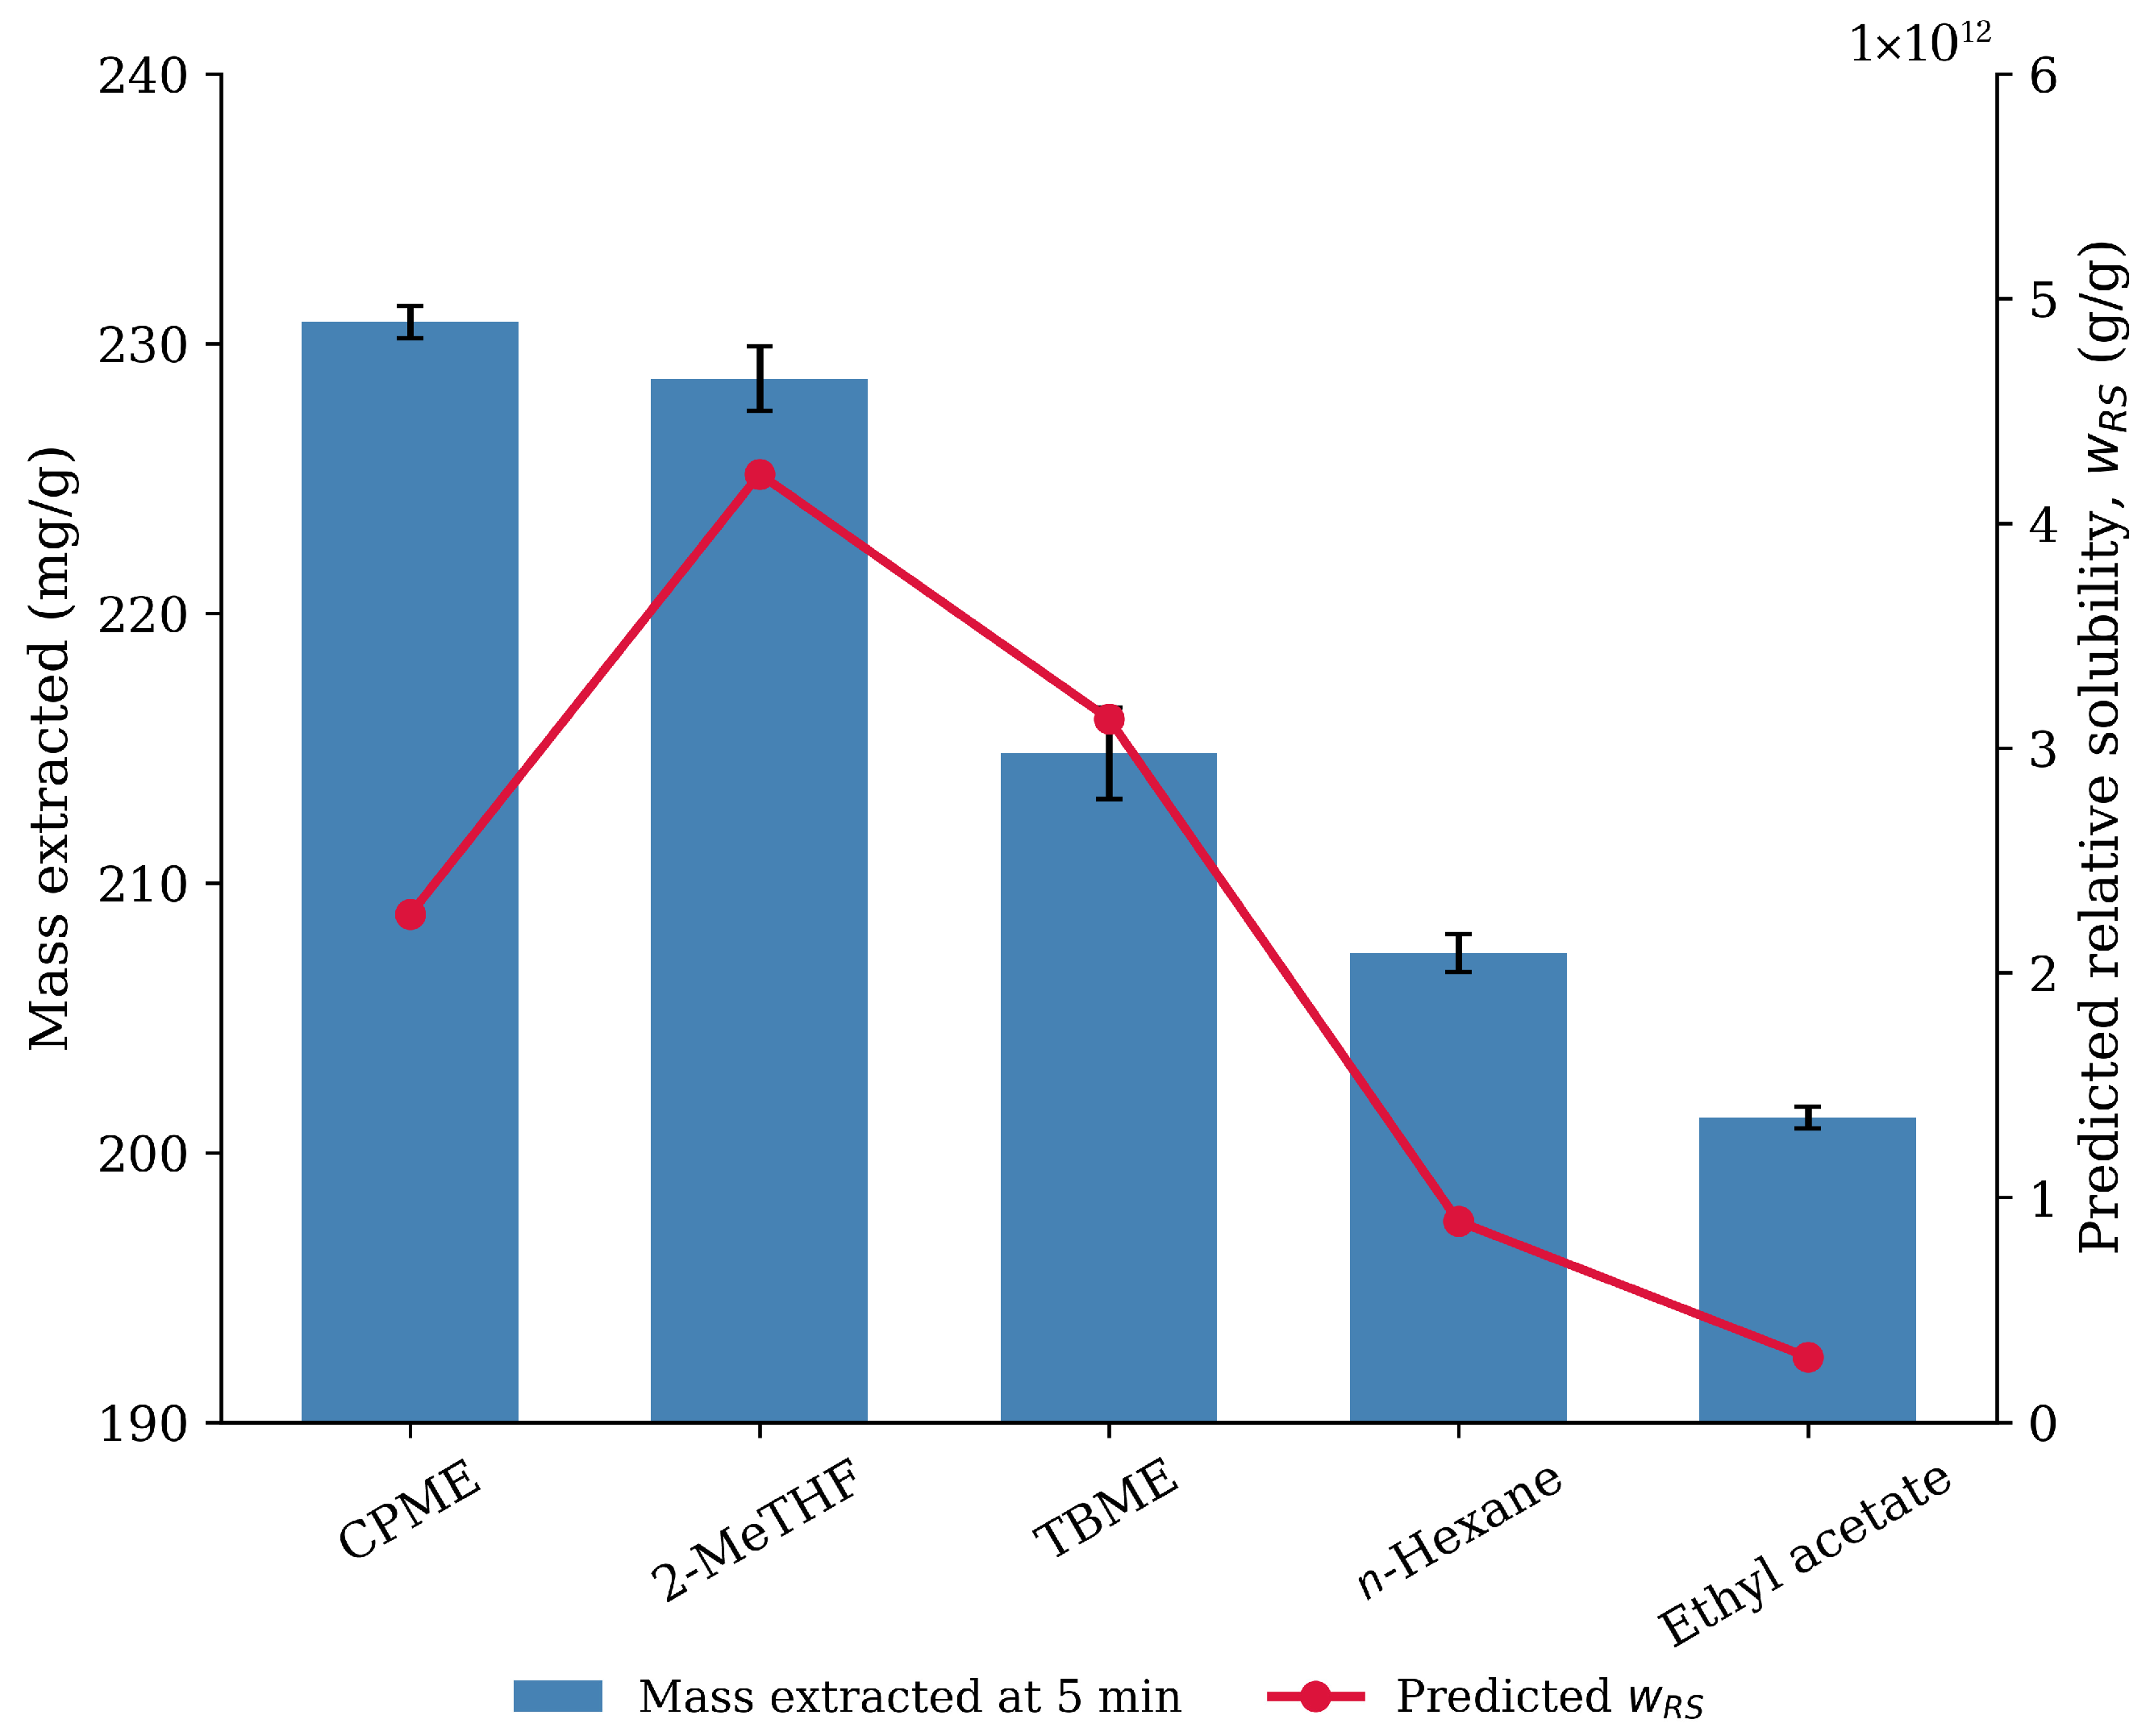
The overall trend in experimental extraction yields is broadly consistent with the thermodynamic affinity predictions from COSMO-RS (Section 3.1). Agreement is most evident during the early extraction phase, where solvent–triglyceride thermodynamic affinity, rather than intra-particle mass transfer resistance, governs the extraction rate. The close correspondence between the COSMO-RS-predicted w R S values and the early-stage experimental yields is illustrated in Figure 7. One-way ANOVA confirmed that extraction yield at 5 min differed significantly among the five solvents (F(4,10) = 459.3). Tukey’s HSD post hoc test showed that all pairwise differences were statistically significant (p < 0.05) except between CPME and 2-MeTHF (p = 0.186), indicating these two solvents achieved statistically indistinguishable early-stage extraction performance and both significantly outperformed TBME, n-hexane, and ethyl acetate at this time point.
Performance of green ether solvents relative to hexane: COSMO-RS predicted that CPME, 2-MeTHF, and TBME collectively exhibit higher relative mass solubility ( w R S ) relative to n-hexane (Section 3.1, Table 2), reflecting favorable thermodynamic compatibility with the nonpolar triglyceride surface. The ether oxygen present in each of these solvents contributes a moderate polar-dispersive complementarity with the ester moieties of the triglyceride backbone, augmenting the dominant dispersive interactions that govern solvation and yielding a thermodynamic advantage over purely aliphatic solvents such as hexane [4,14,34,35]. The enhanced extraction performance of these solvents under ASE conditions is consistent with this predicted thermodynamic advantage, particularly in the solvation-controlled early stage (Figure 7).
Underperformance of ethyl acetate: The lower extraction efficiency of ethyl acetate relative to n-hexane is consistent with its weaker predicted thermodynamic affinity for triglycerides (Section 3.1, Table 2). Although ethyl acetate is partially miscible with lipophilic media, the polarity mismatch between its carbonyl group and the predominantly nonpolar triglyceride surface, reflected in its σ-profile and σ-potential deviating toward the electron-acceptor region (Figure 3 and Figure 4), creates a net thermodynamic penalty that limits solvation efficiency [15,34]. Furthermore, while ethyl acetate may co-extract polar lipid species in some oilseed systems, its yield in the present study remained consistently below that of hexane, indicating that such co-extraction does not meaningfully compensate for its weaker triglyceride solvation capacity. Thermodynamic compatibility, as quantified by COSMO-RS, is therefore a necessary predictor of extraction efficacy. Green classification alone does not guarantee performance.

3.2.3. Oil Composition and Quality Verification

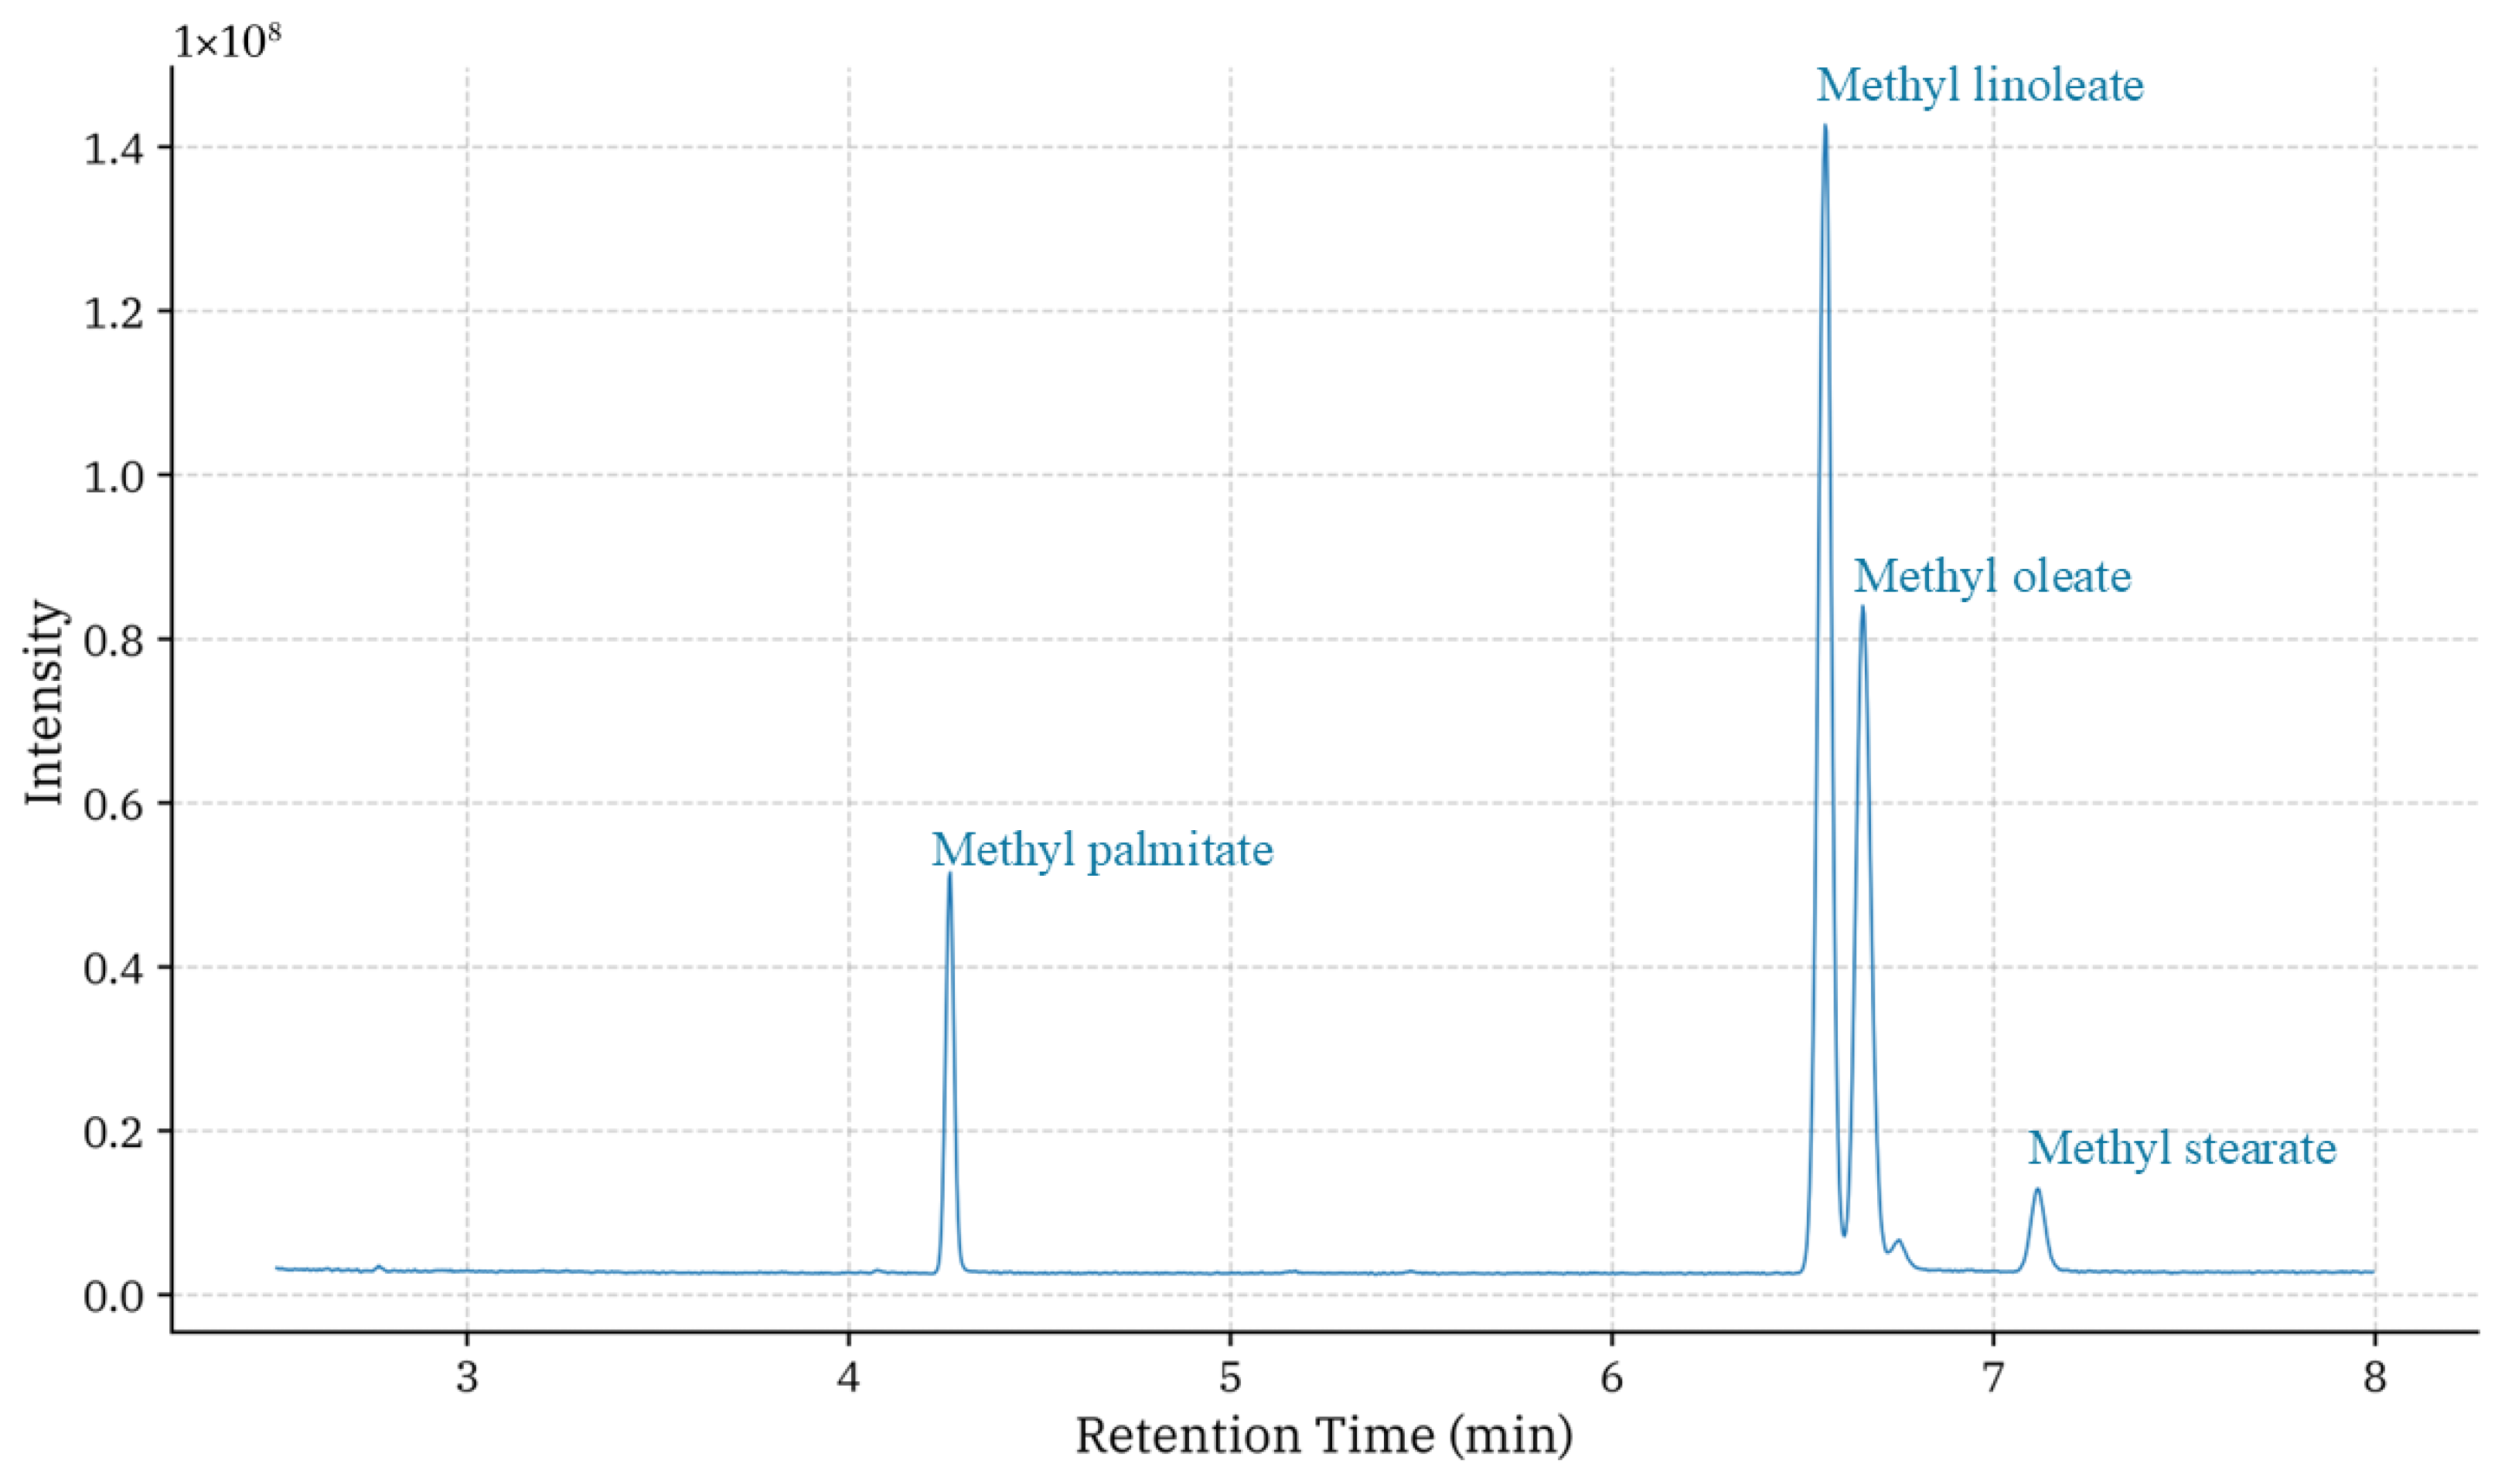
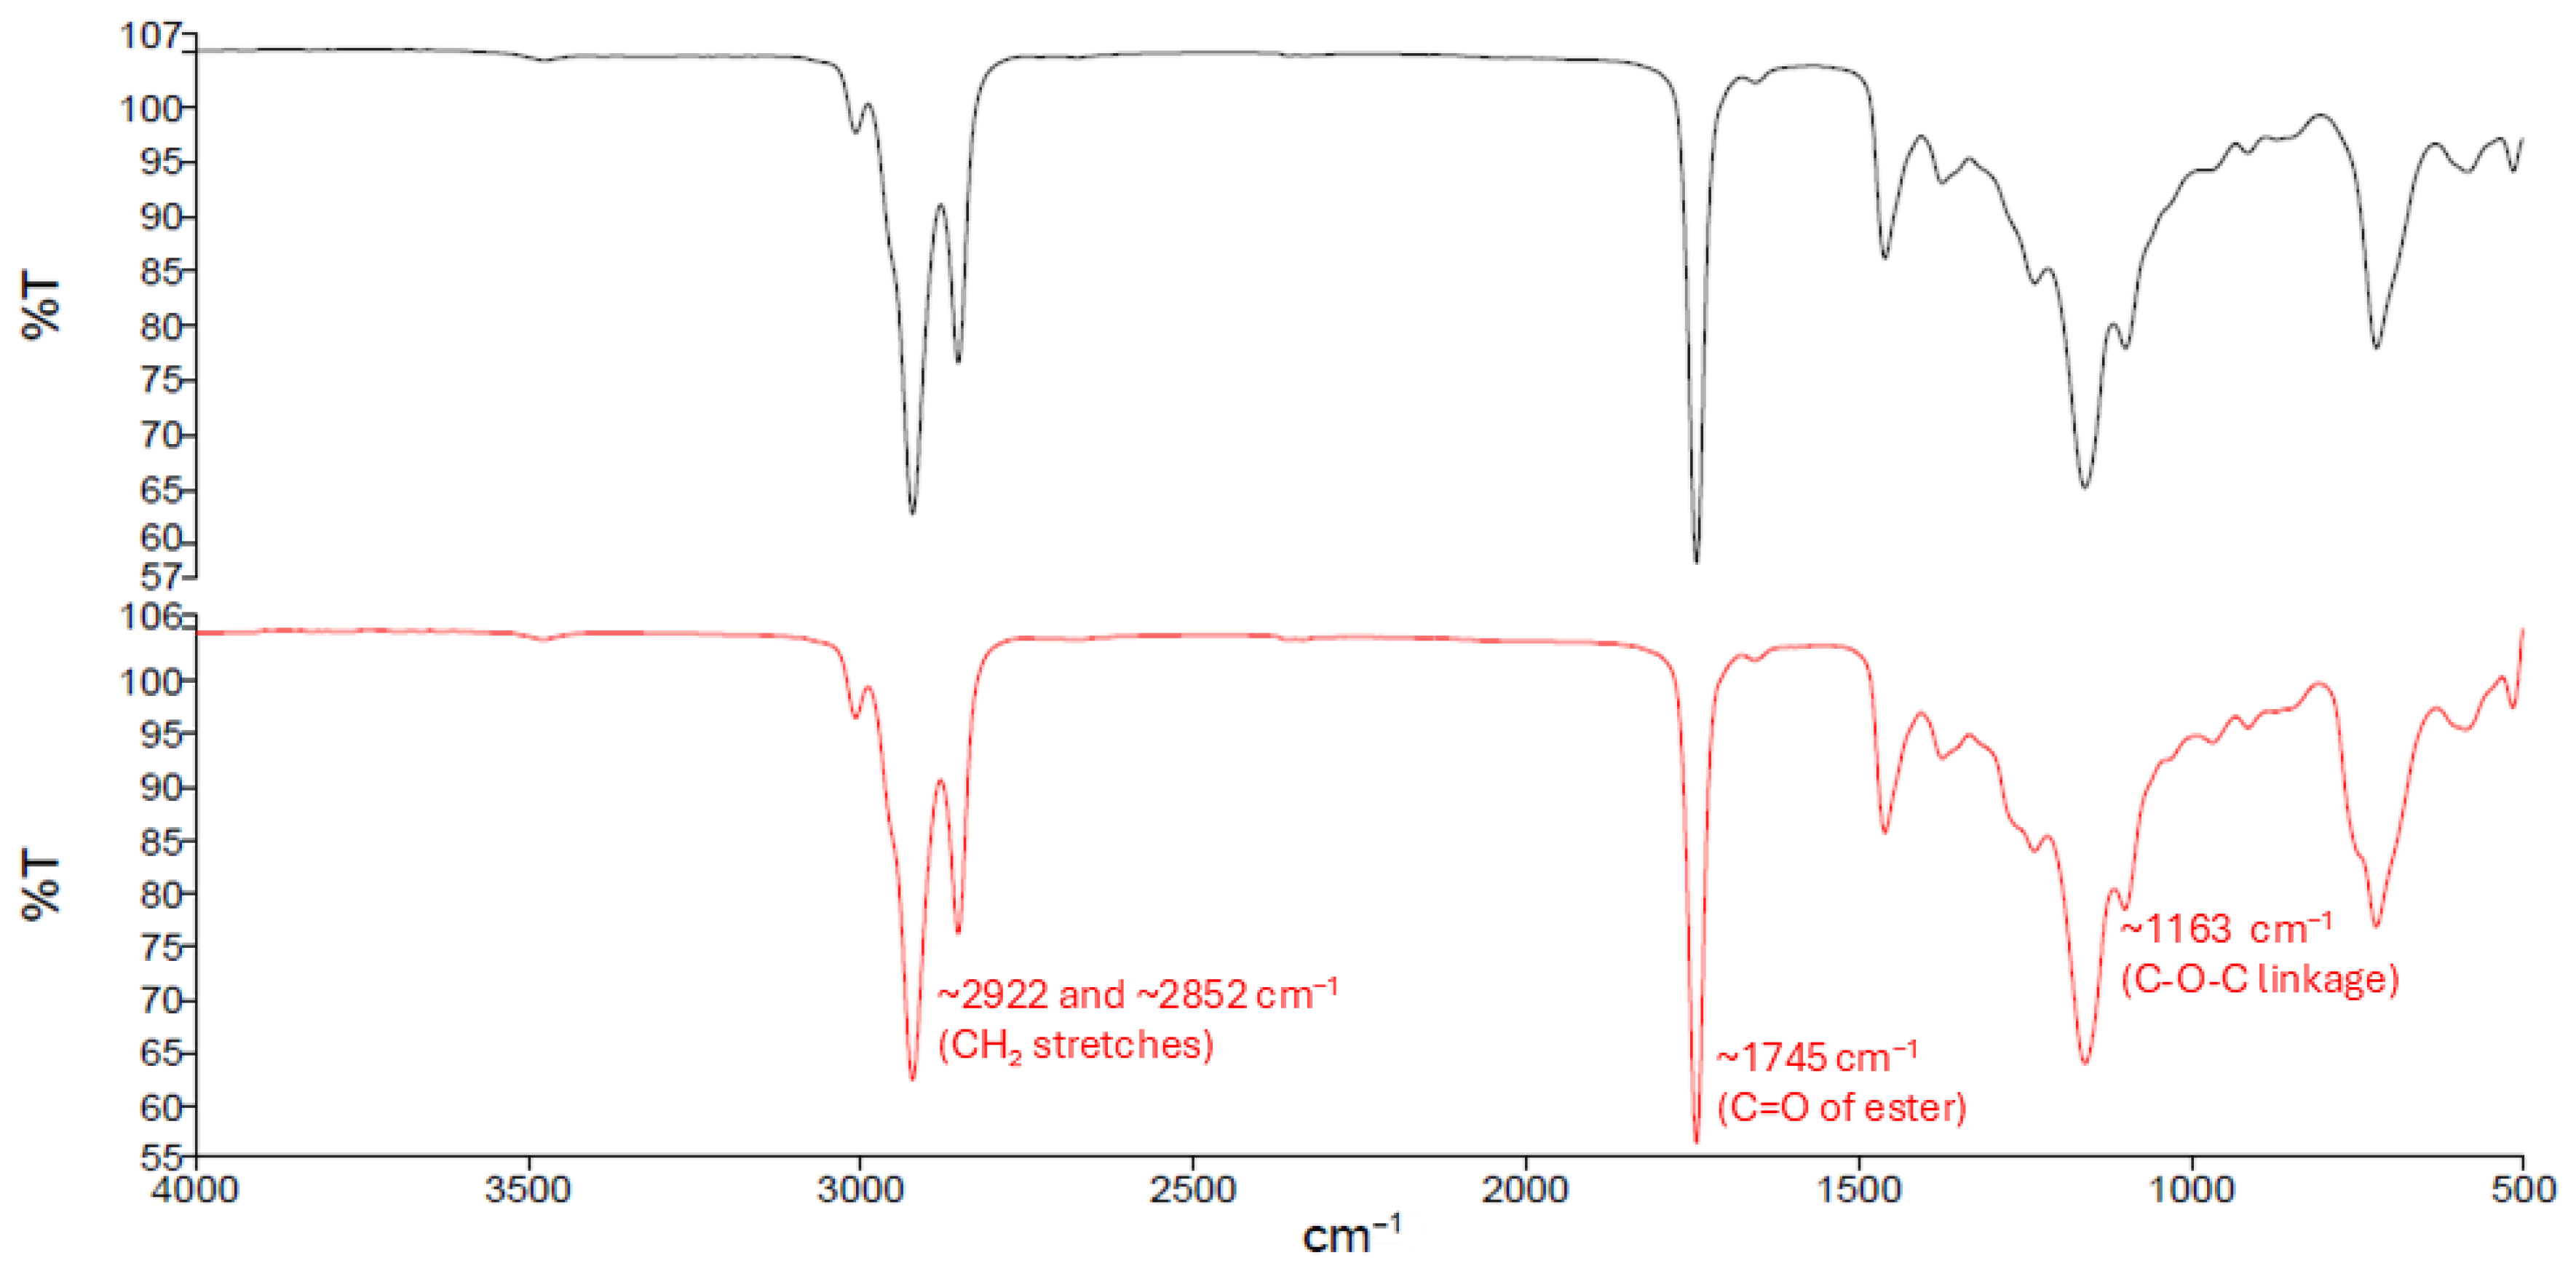
To confirm that the extracted material is representative of soybean triglycerides and that the green ether solvents do not introduce compositional artefacts, GC-MS and FT-IR analyses were performed on the extracted oils (Figure 7 and Figure 8). GC-MS chromatograms of the fatty acid methyl ester (FAME) profiles (Figure 8) confirm that oils extracted with CPME, 2-MeTHF, and TBME possess fatty acid compositions consistent with commercial soybean oil, with linoleic (C18:2), oleic (C18:1), palmitic (C16:0), and stearic (C18:0) acids as the dominant components. FT-IR spectra (Figure 9) of all extracted oils closely match the reference spectrum of commercial soybean oil, with characteristic absorptions at ~1745 cm−1 (C=O ester stretch), ~2922 and ~2852 cm−1 (CH2 stretches), and ~1163 cm−1 (C-O-C ester linkage). The absence of anomalous absorption bands in any of the green-solvent-extracted samples confirms that solvent residues or non-lipid co-extracts are not present at detectable levels, supporting the assumption that minor co-extracts contribute negligibly to the measured yield and oil composition.
The ASE data, compositional analysis, and COSMO-RS predictions are consistent in showing that CPME and 2-MeTHF are effective replacements for n-hexane, while ethyl acetate is limited by its thermodynamic incompatibility with the nonpolar triglyceride surface.

3.3. Kinetic Study–Hot-Ball Diffusion Model

The extraction kinetics of soybean oil were further evaluated using the hot-ball diffusion model, originally developed by Bartle and co-workers for supercritical fluid extraction systems and subsequently applied to accelerated solvent extraction (ASE) [4,20,22,33]. The kinetic analysis was carried out to characterize the mass-transfer behavior governing soybean oil extraction and to complement the COSMO-RS thermodynamic predictions described in Section 3.1. The model rests on four key assumptions: (i) the extractable solute is initially distributed uniformly throughout the solid particle; (ii) particles can be approximated as spheres of uniform average radius; (iii) external mass-transfer resistance is negligible relative to intraparticle diffusion; and (iv) intraparticle diffusion becomes the dominant rate-limiting process during the later stages of extraction. Under these conditions, the extraction kinetics are described by the diffusion solution derived from Fick’s second law for a sphere, expressed as:
m m 0 = 6 π 2 n = 1 1 n 2 e x p n 2 π 2 D t r 2
where m is the mass of oil remaining unextracted in the solid matrix at time t , m 0 is the initial total extractable oil mass, D is the effective intraparticle diffusion coefficient (m2 s−1), t is the extraction time (in seconds), and r is the average particle radius (in meters).

3.3.1. Two-Stage Kinetic Behavior

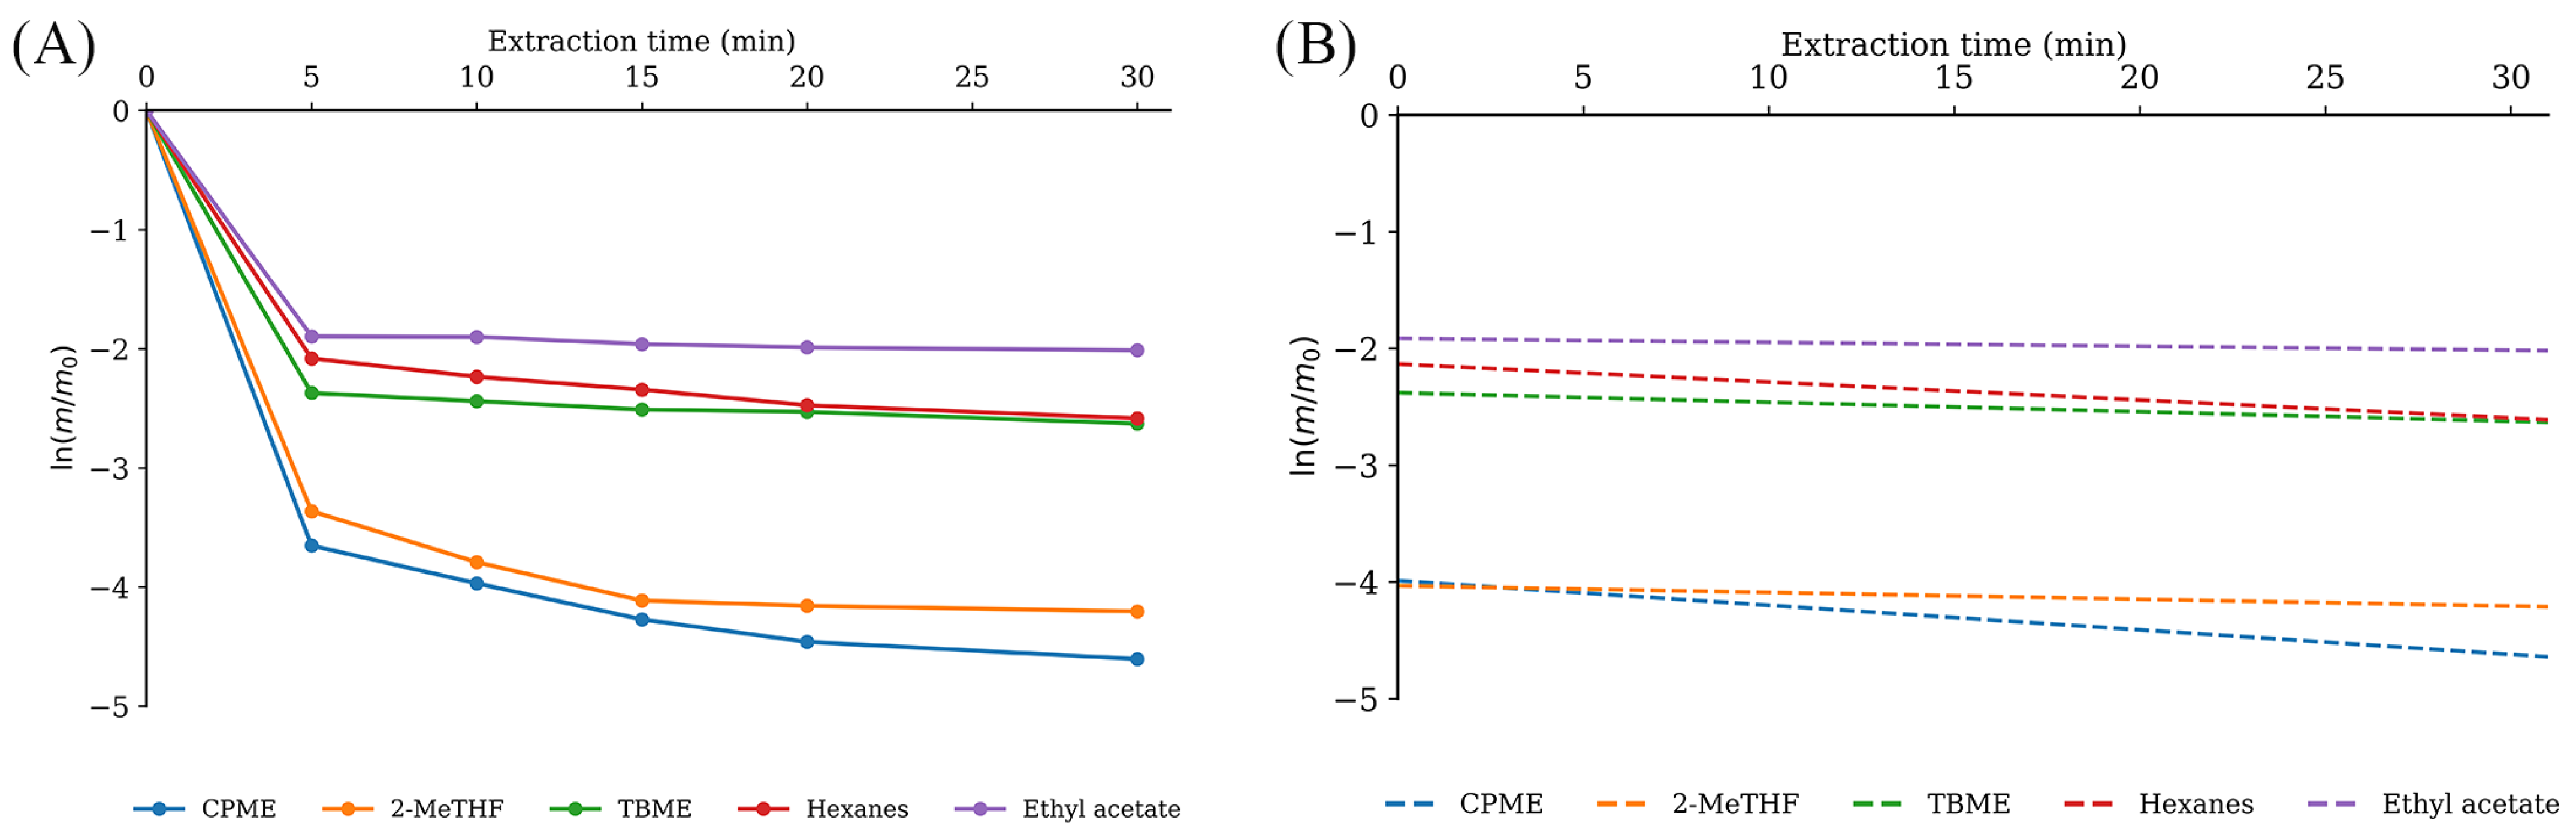
The l n ( m / m 0 ) profiles generated from experimental data exhibited the characteristic two-stage behavior predicted by the hot-ball model (Figure 10) [20,33].
Figure 10. Hot-ball diffusion model analysis of soybean oil extraction kinetics under ASE conditions. (A) l n ( m / m 0 ) versus time for all solvents, showing the solvation-controlled stage (0–15 min) and diffusion-controlled stage (>15 min). (B) Linear regression fits in the diffusion-controlled region (15–30 min) used to estimate the effective intraparticle diffusion coefficient D from Equation (7); a steeper slope corresponds to a larger D (Table 4).
Suschem 07 00034 g010
Table 4. Effective intraparticle diffusion coefficients (D), linear regression slopes, and coefficients of determination (R2) estimated from the linearized hot-ball model (Equations (6) and (7)) for ASE soybean oil extraction. Slopes were determined from ln(m/m0) versus time in the diffusion-controlled region (15–30 min) with average particle radius r = 256.25 μm.
SolventSlope (min−1)D (m2 s−1)R2 (Linear Fit)
CPME−0.02102.333 × 10−120.9304
2-MeTHF−0.00586.438 × 10−130.9690
TBME−0.00819.006 × 10−130.9679
n-Hexane−0.01541.707 × 10−120.9433
Ethyl acetate−0.00333.696 × 10−130.9439
Stage I: Solvation-controlled stage (0–15 min): During the initial phase, extraction proceeded rapidly, driven primarily by solvent penetration and dissolution of readily accessible lipid fractions at the particle surface and within disrupted seed cells. Solvent–triglyceride thermodynamic affinity governed the extraction rate in this stage, and the performance hierarchy predicted by COSMO-RS (Section 3.1) was most clearly reflected in the kinetic profiles. CPME and 2-MeTHF exhibited the steepest initial declines in l n ( m / m 0 ) , consistent with their lower infinite-dilution activity coefficients and higher relative mass solubility values ( w R S ), which reflect stronger solvent–triglyceride thermodynamic compatibility [4,14]. TBME and n-hexane showed intermediate behavior, while ethyl acetate displayed the slowest initial extraction rate, in accord with its weaker predicted thermodynamic affinity for the nonpolar triglyceride surface (Section 3.1). The agreement between COSMO-RS predictions and the Stage I kinetic behavior confirms that thermodynamic solvent–solute affinity significantly governs the solvation-controlled extraction regime.
Stage II: Diffusion-controlled stage (>15 min): Beyond approximately 15 min, the ln(m/m0) plots transitioned progressively toward near-linear behavior for all solvents, signaling a shift to a diffusion-limited extraction regime. In this stage, the rate-limiting step became the migration of residual triglycerides from the interior pore network and intact cell structures of the soybean matrix to the solvent interface, governed by the effective intraparticle diffusion coefficient rather than by solvent–triglyceride thermodynamic affinity [20,22]. The transition between stages was gradual rather than abrupt, reflecting the progressive depletion of surface-accessible oil fractions. Similar solvation-to-diffusion transitions have been reported for pressurized solvent and supercritical fluid extraction of vegetable oils and lipid-rich matrices [4].

3.3.2. Estimation of Effective Diffusion Coefficients

Once the readily accessible surface oil is depleted, the higher-order exponential terms in Equation (5) become negligible, and the model simplifies to the linearized form:
l n m m 0 π 2 D t r 2
which follows the general straight-line relationship y   =   m x , where y   =   l n ( m / m 0 ) , x   =   t , and the slope m   =   π 2 D / r 2 . The slope of the linear regression in the diffusion-controlled region is therefore directly proportional to D . Linear regression was applied to the 15–30 min interval of the l n ( m / m 0 ) versus time plots, and D was recovered from the slope according to
D = m r 2 π 2
The magnitude of the slope directly reflects the intraparticle mass transfer efficiency: a steeper negative slope corresponds to a larger effective diffusion coefficient and faster transport of residual triglycerides through the soybean matrix. Among the solvents evaluated, CPME yielded the steepest slope and the highest diffusion coefficient, followed in order by n-hexane, TBME, 2-MeTHF, and ethyl acetate (Table 4). Notably, this ordering does not follow the COSMO-RS predicted thermodynamic affinity ranking from Section 3.1, in which 2-MeTHF ranked ahead of CPME and n-hexane based on w R S . This divergence indicates that intraparticle mass transfer in the diffusion-controlled regime is not determined solely by solvent–solute thermodynamic affinity, but also reflects physicochemical solvent properties such as viscosity, wettability, and pore penetration capacity under ASE conditions. Small deviations from ideal linearity across all solvents were attributed to the heterogeneous pore structure of the soybean matrix, nonuniform triglyceride distribution, and partial overlap between the two kinetic stages, as similarly noted by Bartle and co-workers for real extraction systems [20,22].

3.3.3. Relationship with COSMO-RS Thermodynamic Predictions

The diffusion-controlled kinetic analysis provides a complementary perspective to the thermodynamic characterization presented in Section 3.1. COSMO-RS activity coefficients and w R S values quantify the thermodynamic driving force for solvent–triglyceride interactions and are most predictive of extraction behavior during the solvation-controlled stage. The effective diffusion coefficients from the hot-ball model, by contrast, quantify the rate of intraparticle mass transfer during the diffusion-controlled stage, a process governed by matrix pore architecture and solvent transport properties rather than thermodynamic affinity alone. These two sets of descriptors therefore address distinct physical phenomena: thermodynamics governs solvent affinity and the partitioning of triglycerides at the solid-solvent interface, whereas intraparticle diffusion governs the transport of solubilized triglycerides through the pore network and cell wall structures of the soybean matrix.
The diminishing correspondence between COSMO-RS solvent rankings and extraction yields at extended extraction times (Section 3.2) is mechanistically consistent with this framework. As extraction progresses into the diffusion-limited stage, thermodynamic affinity becomes a secondary determinant of yield, and solvents with similar diffusion characteristics converge toward comparable final yields despite differences in predicted thermodynamic affinity [4,22]. The COSMO-RS thermodynamic descriptors and hot-ball diffusion coefficients thus address distinct but complementary aspects of solvent performance across the full time course of ASE.

3.3.4. Comparison with COSMO-RS-Predicted Molecular Diffusivity

To determine whether the solvent-dependent effective diffusion coefficients, D in Table 4 reflect differences in intrinsic solute–solvent diffusivity or in matrix-specific transport resistance, molecular diffusion coefficients, D m of the four triglycerides were estimated in each solvent at 100 °C (Section 2.7) and averaged to obtain a representative value per solvent (Table 5) [36]. The two diffusivities were compared using the obstruction factor f = D / D m , which quantifies the transport resistance imposed by a porous matrix relative to free solution and is widely used to interpret restricted intraparticle diffusion in porous chromatographic and adsorbent media [37].
The predicted D m varies by only ~6% across the five solvents (7.23–7.64 × 10⁻¹¹ m2 s−1), reflecting the dominant influence of solute size on free-solution diffusivity. By contrast, the experimental D spans a 6.3-fold range across the same solvents (0.370–2.333 × 10⁻¹² m2 s−1). Because molecular diffusivity is nearly solvent-independent, this variation cannot be explained by differences in intrinsic solute–solvent diffusivity. The hindrance factor f , ranging from 0.50% (ethyl acetate) to 3.23% (CPME), instead quantifies the transport resistance imposed by the soybean matrix, and its solvent ranking (CPME > n-hexane > TBME > 2-MeTHF > ethyl acetate) reproduces the experimental D ranking. This supports the interpretation in Section 3.3.3 that the diffusion-controlled stage is governed by solvent-specific physicochemical properties, such as viscosity and matrix wettability, rather than by intrinsic molecular diffusivity or thermodynamic affinity.
To confirm that external (film-side) mass transfer does not limit the extraction kinetics, a mass-transfer Biot number of B i = D m / D was estimated for each solvent from the same COSMO-RS-predicted molecular diffusivities, using the theoretical stagnant-film limit of the Ranz–Marshall correlation (Sh = 2), appropriate for the static ASE protocol used here [38,39]. Bi, reported in Table 5, ranged from 31.0 (CPME) to 198 (ethyl acetate), well above the Bi >> 1 threshold generally used to indicate that internal (intraparticle) diffusion, not external film diffusion, controls the overall mass-transfer rate [40]. This confirms, quantitatively rather than by assumption, that external mass-transfer resistance is negligible relative to intraparticle diffusion under the ASE conditions used in this study, supporting assumption (iii) of the hot-ball model (Section 3.3).

4. Conclusions

This study combined COSMO-RS screening, accelerated solvent extraction, and diffusion-based kinetic modeling to evaluate green solvents for soybean oil extraction. COSMO-RS identified 2-MeTHF, CPME, and TBME as thermodynamically favorable for triglyceride solvation, driven by nonpolar surface complementarity with moderate polar interactions at the ester groups. Experimentally, CPME and 2-MeTHF exceeded n-hexane in extraction yield and TBME performed comparably, while ethyl acetate underperformed due to polarity mismatch with the triglyceride surface.
Kinetic analysis revealed a two-stage mechanism: an initial solvation-controlled phase, where COSMO-RS rankings correlated well with observed extraction yields, followed by a diffusion-controlled phase where intraparticle mass transfer properties became the primary determinant of recovery.
The results support CPME and 2-MeTHF as practical, sustainable alternatives to n-hexane in soybean oil extraction. The three-component approach, COSMO-RS pre-screening, ASE validation, and kinetic modeling, is directly applicable to other oilseed and natural product matrices, and provides a resource-efficient path for green extraction process design.

Supplementary Materials

The following supporting information can be downloaded at https://www.mdpi.com/article/10.3390/suschem7030034/s1, Figures S1–S6: FT-IR spectra of commercial soybean oil and of oils extracted with each of the five solvents evaluated in this study; Figures S7–S12: GC-MS chromatograms of fatty acid methyl esters (FAMEs) prepared from commercial soybean oil and from oils extracted with each of the five solvents evaluated in this study.

Author Contributions

Conceptualization, S.D.; methodology, S.D.; software, S.D. and S.R.; validation, S.D., S.R., D.H. and S.K.; formal analysis, S.D., D.H. and S.K.; investigation, S.D., D.H. and S.K.; resources, S.D. and S.R.; data curation, S.D., S.R., D.H. and S.K.; writing—original draft preparation, S.D.; writing—review and editing, S.R.; visualization, S.D.; supervision, S.D.; project administration, S.D.; funding acquisition, S.D. All authors have read and agreed to the published version of the manuscript.

Funding

The research was funded in part by a grant from the Welch Foundation, Grant No. AJ-0029-20221023, and a grant from Angelo State University’s Faculty Research Enhancement Program (FREP), Grant No. 0010-45594.

Institutional Review Board Statement

Not applicable.

Informed Consent Statement

Not applicable.

Data Availability Statement

The data presented in this study are included in the article/Supplementary Materials. Further inquiries can be directed to the corresponding authors.

Acknowledgments

The authors acknowledge the support of the Provost Scholar Program at Angelo State University.

Conflicts of Interest

The authors declare no conflicts of interest.

Abbreviations

The following abbreviations are used in this manuscript:
OECDOrganization for Economic Co-operation and Development
FAOFood and Agriculture Organization of the United Nations
EUEuropean Union
MtMillion metric tons
COSMO-RSConductor-like Screening Model for Real Solvents
CPMECyclopentyl methyl ether
2-MeTHF2-Methyltetrahydrofuran
TBMEtert-Butyl methyl ether
ASEaccelerated solvent extraction
DEffective diffusion coefficient, experimentally calculated
DmMolecular diffusion coefficient, COSMO-RS predicted
BiMass transfer Biot number
fObstruction factor
EHSEnvironmental, health, and safety
GSKGlaxoSmithKline
DFTDensity functional theory
σ-surfacesMolecular surface charge density maps
σ-profilesCharge density distributions
σ-potentials, μ(σ)Surface interaction energy profile
γActivity coefficients at infinite dilution (γ∞)
( x R S ) Mole fraction solubility ( x R S )
( w R S )Relative mass solubility ( w R S )
BP/TZVPA DFT methods used in TMoleX and COSMOthermX programs
ΔGsolvGibbs free energy of solvation
FAMEFatty acid methyl ester
GC-MSGas Chromatography–Mass Spectrometry
A(σ)Surface area associated with screening charge density σ
AtotalTotal molecular surface area
mMass of oil remaining unextracted in the dry matrix at time t
m0Initial total extractable oil mass in soybean dry matrix
rRadius of the ground soybean particles
tTime in seconds
ShSherwood number

References

  1. Anastas, P.; Warner, J. Green Chemistry: Theory and Practice; Oxford University Press: Oxford, UK, 1998. [Google Scholar]
  2. Chemat, F.; Abert Vian, M.; Ravi, H.K.; Khadhraoui, B.; Hilali, S.; Perino, S.; Fabiano Tixier, A.S. Tixier Review of Alternative Solvents for Green Extraction of Food and Natural Products: Panorama, Principles, Applications and Prospects. Molecules 2019, 24, 3007. [Google Scholar] [CrossRef] [PubMed]
  3. Bates, M.N.; Pope, K.; So, Y.T.; Liu, S.; Eisen, E.A.; Hammond, S.K. Hexane Exposure and Persistent Peripheral Neuropathy in Automotive Technicians. Neurotoxicology 2019, 75, 24–29. [Google Scholar] [CrossRef] [PubMed]
  4. Claux, O.; Rapinel, V.; Goupy, P.; Patouillard, N.; Vian, M.A.; Jacques, L.; Chemat, F. Dry and Aqueous 2-Methyloxolane as Green Solvents for Simultaneous Production of Soybean Oil and Defatted Meal. ACS Sustain. Chem. Eng. 2021, 9, 7211–7223. [Google Scholar] [CrossRef]
  5. Rapinel, V.; Claux, O.; Abert-Vian, M.; McAlinden, C.; Bartier, M.; Patouillard, N.; Jacques, L.; Chemat, F. 2-Methyloxolane (2-MeOx) as Sustainable Lipophilic Solvent to Substitute Hexane for Green Extraction of Natural Products. Properties, Applications, and Perspectives. Molecules 2020, 25, 3417. [Google Scholar] [CrossRef] [PubMed]
  6. US Department of Agriculture Foreign Agricultural Service. Oilseeds: World Markets and Trade; USDA FAS: Washington, DC, USA.
  7. OECD-FAO. Agricultural Outlook; OECD Publishing: Paris, France, 2023; ISBN 978-92-64-61933-3. [Google Scholar]
  8. Kumar, S.P.J.; Prasad, S.R.; Banerjee, R.; Agarwal, D.K.; Kulkarni, K.S.; Ramesh, K.V. Green Solvents and Technologies for Oil Extraction from Oilseeds. Chem. Cent. J. 2017, 11, 9. [Google Scholar] [CrossRef] [PubMed]
  9. Fornari, T.; Vicente, G.; Vázquez, E.; García-Risco, M.R.; Reglero, G. Isolation of Essential Oil from Different Plants and Herbs by Supercritical Fluid Extraction. J. Chromatogr. A 2012, 1250, 34–48. [Google Scholar] [CrossRef] [PubMed]
  10. Phan, L.; Brown, H.; White, J.; Hodgson, A.; Jessop, P.G. Soybean Oil Extraction and Separation Using Switchable or Expanded Solvents. Green Chem. 2009, 11, 53–59. [Google Scholar] [CrossRef]
  11. Watanabe, K.; Yamagiwa, N.; Torisawa, Y. Cyclopentyl Methyl Ether as a New and Alternative Process Solvent. Org. Process Res. Dev. 2007, 11, 251–258. [Google Scholar] [CrossRef]
  12. Henderson, R.K.; Jiménez-González, C.; Constable, D.J.C.; Alston, S.R.; Inglis, G.G.A.; Fisher, G.; Sherwood, J.; Binks, S.P.; Curzons, A.D. Expanding GSK’s Solvent Selection Guide—Embedding Sustainability into Solvent Selection Starting at Medicinal Chemistry. Green Chem. 2011, 13, 854–862. [Google Scholar] [CrossRef]
  13. Al-Maari, M.A.; Hizaddin, H.F.; Salleh, M.Z.M.; Hayyan, A. COSMO-RS-Based Assessment of Thermodynamic Tools in Predicting the Polar and Non-Polar Solvents Efficiency in Vegetable Oil Extraction. J. Mol. Model. 2024, 30, 73. [Google Scholar] [CrossRef]
  14. Sicaire, A.-G.; Vian, M.A.; Fine, F.; Carré, P.; Tostain, S.; Chemat, F. Experimental Approach versus COSMO-RS Assisted Solvent Screening for Predicting the Solubility of Rapeseed Oil. OCL 2015, 22, D404. [Google Scholar] [CrossRef]
  15. Sicaire, A.-G.; Vian, M.; Fine, F.; Joffre, F.; Carré, P.; Tostain, S.; Chemat, F. Alternative Bio-Based Solvents for Extraction of Fat and Oils: Solubility Prediction, Global Yield, Extraction Kinetics, Chemical Composition and Cost of Manufacturing. Int. J. Mol. Sci. 2015, 16, 8430–8453. [Google Scholar] [CrossRef] [PubMed]
  16. Byrne, F.P.; Jin, S.; Paggiola, G.; Petchey, T.H.M.; Clark, J.H.; Farmer, T.J.; Hunt, A.J.; Robert McElroy, C.; Sherwood, J. Tools and Techniques for Solvent Selection: Green Solvent Selection Guides. Sustain. Chem. Process. 2016, 4, 7. [Google Scholar] [CrossRef]
  17. Richter, B.E.; Jones, B.A.; Ezzell, J.L.; Porter, N.L.; Avdalovic, N.; Pohl, C. Accelerated Solvent Extraction: A Technique for Sample Preparation. Anal. Chem. 1996, 68, 1033–1039. [Google Scholar] [CrossRef]
  18. Richter, B.E.; Raynie, D. 2.06—Accelerated Solvent Extraction (ASE) and High-Temperature Water Extraction. In Comprehensive Sampling and Sample Preparation; Pawliszyn, J., Ed.; Academic Press: Oxford, UK, 2012; pp. 105–115. ISBN 978-0-12-381374-9. [Google Scholar]
  19. Del Pilar Sánchez-Camargo, A.; Pleite, N.; Herrero, M.; Cifuentes, A.; Ibáñez, E.; Gilbert-López, B. New Approaches for the Selective Extraction of Bioactive Compounds Employing Bio-Based Solvents and Pressurized Green Processes. J. Supercrit. Fluids 2017, 128, 112–120. [Google Scholar] [CrossRef]
  20. Bartle, K.D.; Clifford, A.A.; Hawthorne, S.B.; Langenfeld, J.J.; Miller, D.J.; Robinson, R. A Model for Dynamic Extraction Using a Supercritical Fluid. J. Supercrit. Fluids 1990, 3, 143–149. [Google Scholar] [CrossRef]
  21. Mgoma, S.T.; Basitere, M.; Mshayisa, V.V. Kinetics and Thermodynamics of Oil Extraction from South African Hass Avocados Using Hexane as a Solvent. S. Afr. J. Chem. Eng. 2021, 37, 244–251. [Google Scholar] [CrossRef]
  22. Bartle, K.D.; Boddington, T.; Clifford, A.A.; Hawthorne, S.B. The Effect of Solubility on the Kinetics of Dynamic Supercritical-Fluid Extraction. J. Supercrit. Fluids 1992, 5, 207–212. [Google Scholar] [CrossRef]
  23. Huang, Z.; Shi, X.; Jiang, W. Theoretical Models for Supercritical Fluid Extraction. J. Chromatogr. A 2012, 1250, 2–26. [Google Scholar] [CrossRef]
  24. Dharmarajan, S. Comparison of Green Solvents during Chemical Extraction by Diffusion Studies. In Proceedings of the 245th ACS National Meeting & Exposition, New Orleans, LA, USA, 7–11 April 2013; American Chemical Society: Washington, DC, USA, 2013; p. MWRM-242. [Google Scholar]
  25. Comerlatto, A.; Voll, F.A.; Daga, A.L.; Fontana, É. Mass Transfer in Soybean Oil Extraction Using Ethanol/Isopropyl Alcohol Mixtures. Int. J. Heat Mass Transf. 2021, 165, 120630. [Google Scholar] [CrossRef]
  26. Ramos, P.R.; Sponchiado, J.; Echenique, J.V.F.; Dacanal, G.C.; Oliveira, A.L.D. Kinetics of Vegetable Oils (Rice Bran, Sunflower Seed, and Soybean) Extracted by Pressurized Liquid Extraction in Intermittent Process. Processes 2024, 12, 1107. [Google Scholar] [CrossRef]
  27. Klamt, A. Conductor-like Screening Model for Real Solvents: A New Approach to the Quantitative Calculation of Solvation Phenomena. J. Phys. Chem. 1995, 99, 2224–2235. [Google Scholar] [CrossRef]
  28. Loschen, C.; Klamt, A. COSMO Quick: A Novel Interface for Fast σ-Profile Composition and Its Application to COSMO-RS Solvent Screening Using Multiple Reference Solvents. Ind. Eng. Chem. Res. 2012, 51, 14303–14308. [Google Scholar] [CrossRef]
  29. Zheng, H.; Liu, C.; Cai, S.; Yang, T.; Feng, Y.; Li, X.; Wang, Z.; Yang, E. Investigation of the Palm Oil-Solubility in Naphthenic Insulating Oil Using Density Functional Theory and COSMO-RS. Comput. Theor. Chem. 2021, 1198, 113184. [Google Scholar] [CrossRef]
  30. Balasubramani, S.G.; Chen, G.P.; Coriani, S.; Diedenhofen, M.; Frank, M.S.; Franzke, Y.J.; Furche, F.; Grotjahn, R.; Harding, M.E.; Hättig, C.; et al. TURBOMOLE: Modular Program Suite for Ab Initio Quantum-Chemical and Condensed-Matter Simulations. J. Chem. Phys. 2020, 152, 184107. [Google Scholar] [CrossRef] [PubMed]
  31. Eckert, F.; Klamt, A. Fast Solvent Screening via Quantum Chemistry: COSMO-RS Approach. AIChE J. 2002, 48, 369–385. [Google Scholar] [CrossRef]
  32. Lorenzo-Llanes, J.; Palomar, J.; Escalona, N.; Canales, R.I. COSMO-RS-Based Solvent Screening and Experimental Analysis for Recovering Added-Value Chemicals from the Bio-Oil Aqueous Phase. Sep. Purif. Technol. 2025, 369, 133104. [Google Scholar] [CrossRef]
  33. Vandenburg, H.J.; Clifford, A.A.; Bartle, K.D.; Zhu, S.A.; Carroll, J.; Newton, I.D.; Garden, L.M. Factors Affecting High-Pressure Solvent Extraction (Accelerated Solvent Extraction) of Additives from Polymers. Anal. Chem. 1998, 70, 1943–1948. [Google Scholar] [CrossRef] [PubMed]
  34. Breil, C.; Meullemiestre, A.; Vian, M.; Chemat, F. Bio-Based Solvents for Green Extraction of Lipids from Oleaginous Yeast Biomass for Sustainable Aviation Biofuel. Molecules 2016, 21, 196. [Google Scholar] [CrossRef] [PubMed]
  35. Moity, L.; Durand, M.; Benazzouz, A.; Pierlot, C.; Molinier, V.; Aubry, J.-M. Panorama of Sustainable Solvents Using the COSMO-RS Approach. Green Chem. 2012, 14, 1132. [Google Scholar] [CrossRef]
  36. Miyabe, K.; Isogai, R. Estimation of Molecular Diffusivity in Liquid Phase Systems by the Wilke–Chang Equation. J. Chromatogr. A 2011, 1218, 6639–6645. [Google Scholar] [CrossRef] [PubMed]
  37. Richard, D.J.; Striegel, A.M. The Obstruction Factor in Size-Exclusion Chromatography. 1. The Intraparticle Obstruction Factor. J. Chromatogr. A 2010, 1217, 7131–7137. [Google Scholar] [CrossRef] [PubMed]
  38. Kumar, A.; Hartland, S. Correlations for Prediction of Mass Transfer Coefficients in Single Drop Systems and Liquid–Liquid Extraction Columns. Chem. Eng. Res. Des. 1999, 77, 372–384. [Google Scholar] [CrossRef]
  39. Montagnaro, F. Sherwood (Sh) Number in Chemical Engineering Applications—A Brief Review. Energies 2024, 17, 4342. [Google Scholar] [CrossRef]
  40. Inglezakis, V.J.; Balsamo, M.; Montagnaro, F. Liquid–Solid Mass Transfer in Adsorption Systems—An Overlooked Resistance? Ind. Eng. Chem. Res. 2020, 59, 22007–22016. [Google Scholar] [CrossRef]
Figure 1. Flowchart of the integrated experimental workflow.
Suschem 07 00034 g001
Figure 2. σ-surfaces of representative soybean oil triglycerides (trilinolein C18:2, triolein C18:1, tripalmitin C16:0, tristearin C18:0) computed by COSMO-RS (COSMOThermX_2026). Blue = electron-rich regions (hydrogen-bond acceptors); red = electron-deficient regions (hydrogen-bond donors); green = nonpolar dispersive surface character.
Suschem 07 00034 g002
Figure 3. (A) σ-profiles and (B) σ-potentials of the four representative soybean oil triglycerides predicted by COSMO-RS. Peaks concentrated in the nonpolar window (−0.01 ≤ σ ≤ +0.01 e/Å2) of the σ-profiles confirm that dispersive interactions dominate triglyceride solvation.
Suschem 07 00034 g003
Figure 4. σ-surfaces of the selected solvent panel, including green candidates (2-MeTHF, CPME, TBME, ethyl acetate), and the conventional benchmark (hexane), as predicted by COSMO-RS. Surface coloring follows the convention defined in Figure 2.
Suschem 07 00034 g004
Figure 5. (A) σ-profiles and (B) σ-potentials of the evaluated solvent panel predicted by COSMO-RS. The nonpolar-region overlap between green ether solvents and the triglycerides (Figure 3) indicates favorable surface complementarity.
Suschem 07 00034 g005
Figure 6. Soybean oil extraction yield (mg/g dry soybean material) as a function of extraction time for CPME, 2-MeTHF, TBME, ethyl acetate, and n-hexane under ASE conditions (mean ± SD, n = 3).
Suschem 07 00034 g006
Figure 7. ASE yield (bar chart, left axis) at 5 min (early solvation-dominant stage) compared against the COSMO-RS-predicted average relative mass solubility ( w R S , line graph, right axis) for each solvent. The ether-based green solvents CPME, 2-MeTHF, and TBME showed higher extraction performance than n-hexane as predicted. Bars sharing the same letter are not significantly different (one-way ANOVA with Tukey’s HSD post hoc test, p > 0.05).
Suschem 07 00034 g007
Figure 8. GC-MS chromatograms of FAME profiles for soybean oil extracted with CPME. Major peaks correspond to methyl esters of linoleic (C18:2), oleic (C18:1), palmitic (C16:0), stearic (C18:0), and linolenic (C18:3) acids. Chromatograms of FAME from other solvents are provided in the Supplementary Materials.
Suschem 07 00034 g008
Figure 9. FT-IR spectra of soybean oil extracted with CPME (red), compared against a commercial soybean oil (black) reference. Characteristic bands at ~1745 cm−1 (C=O ester), ~2922 and ~2852 cm−1 (CH2 stretches), and ~1163 cm−1 (C-O-C linkage) are consistent across the two samples. FT-IR spectra of soybean oil extracted with other solvents are given in the Supplementary Materials.
Suschem 07 00034 g009
Table 1. Selected green solvents for ASE and key green chemistry metrics, including boiling point, flash point, biodegradability, GSK sustainability score, recyclability, and toxicity classification.
SolventSourceBoiling Point (°C)Flash Point (°C)BiodegradabilityGSK Score (1–10)RecyclabilityToxicity
n-HexaneNon-renewable 69−22Low3.0GoodHigh
2-MeTHFRenewable 78−11High6.0GoodLow
CPMENon-renewable106−1Moderate6.0HighLow
Ethyl acetateRenewable77.1−4High7.0GoodLow
TBMENon-renewable55−28Moderate5.0ModerateModerate
Table 2. Average thermodynamic solvent ranking based on activity coefficient at infinite dilution (γ∞), log10 mole fraction solubility (log10( x R S )), and relative mass solubility ( w R S ), as predicted by COSMO-RS at 100 °C.
SolventActivity Coefficient at Infinite Dilution (γ∞)Average log10 ( x R S )Average w R S (g/g)
TrilinoleinTrioleinTripalmitinTristearinAverage
Chloroform0.0090.01960.03080.02970.022311.1025.10 × 1012
THF0.01670.02690.03870.02950.02810.9768.07 × 1012
Diethyl ether0.02720.03240.04740.03280.034910.876.99 × 1012
2-MeTHF0.03480.04570.0620.04680.047310.7384.22 × 1012
Dichloromethane0.01120.0420.07470.08840.054110.7812.59 × 1012
TBME0.0540.06210.08270.06130.06510.5963.13 × 1012
CPME0.07050.07560.1010.07460.080510.5032.26 × 1012
Toluene0.1150.1920.3020.2760.22210.0877.03 × 1011
Benzene0.1110.2430.40.4050.299.9945.81 × 1011
n-Hexane0.4550.2730.330.2140.3189.9188.94 × 1011
Ethyl acetate0.190.4690.6070.7090.4949.7582.90 × 1011
Acetone0.2480.8821.071.480.9219.5192.15 × 1011
Carbon tetrachloride1.441.51.861.661.619.1996.74 × 1010
Ethyl lactate0.8111.932.022.821.899.1675.42 × 1010
DMF0.863.413.525.793.398.964.40 × 1010
2-Propanol3.848.225.859.336.818.5953.10 × 1010
Ethanol22.169.540.288.455.17.724.36 × 109
Methanol6.37 × 1023.93 × 1031.56 × 1036.10 × 1033.06 × 1036.069.55 × 107
Acetonitrile1.32 × 1042.38 × 1051.26 × 1059.31 × 1053.27 × 1054.2636.65 × 105
Water1.26 × 10223.91 × 10241.23 × 10221.92 × 10255.78 × 1024−14.1130
Table 3. Soybean oil extraction yield (mg/g dry soybean material) as a function of extraction time under ASE conditions for CPME, 2-MeTHF, TBME, ethyl acetate, and n-hexane. Data are expressed as mean ± SD (n = 3).
Solvent5 min (mg/g)10 min (mg/g)15 min (mg/g)20 min (mg/g)30 min (mg/g)
CPME230.8 ± 0.6232.4 ± 4.6233.6 ± 0.6234.2 ± 3.7234.5 ± 1.8
2-MeTHF228.7 ± 1.2231.6 ± 0.7233.0 ± 1.3233.2 ± 0.3233.4 ± 0.7
TBME214.8 ± 1.7216.3 ± 0.2217.7 ± 0.7218.0 ± 0.4219.8 ± 1.1
n-Hexane207.4 ± 0.7211.6 ± 2.4214.2 ± 1.9217.0 ± 0.8219.0 ± 0.5
Ethyl acetate201.3 ± 0.4201.5 ± 1.5203.6 ± 0.6204.5 ± 0.3205.3 ± 0.3
Table 5. COSMO-RS-predicted molecular diffusivity D m of soybean oil triglycerides (averaged across trilinolein, triolein, tripalmitin, and tristearin) compared with the experimentally derived effective diffusion coefficient D at 100 °C. The ratio, f = D / D m is the hindrance factor imposed by the soybean particle matrix. B i is the mass-transfer Biot number based on the theoretical stagnant-film limit (Sh = 2).
Solvent D
(×10−12 m2 s−1)
D m
(×10−11 m2 s−1)
f = D / D m B i = D m / D
CPME2.3337.230.032331.0
2-MeTHF0.6447.640.0084119
TBME0.9017.410.012282.2
n-Hexane1.7077.430.02343.5
Ethyl acetate0.377.330.005198
Disclaimer/Publisher’s Note: The statements, opinions and data contained in all publications are solely those of the individual author(s) and contributor(s) and not of MDPI and/or the editor(s). MDPI and/or the editor(s) disclaim responsibility for any injury to people or property resulting from any ideas, methods, instructions or products referred to in the content.