Article

Evaluation of CO2 Adsorption and Activation in CuxScy Nanoclusters by Analyzing DFT and PDOS/TDOS Signatures


by
Katherine Liset Ortiz Paternina
1,*,
Rodrigo Ortega-Toro
2 and
Joaquín Hernández Fernández
1,3,4,*
1
Chemistry Program, Department of Natural and Exact Sciences, San Pablo Campus, University of Cartagena, Cartagena de Indias D.T. y C., Cartagena 130015, Colombia
2
Food Packaging and Shelf-Life Research Group (FP&SL), Food Engineering Program, University of Cartagena, Cartagena 130015, Colombia
3
Department of Natural and Exact Science, Universidad de la Costa, Barranquilla 080002, Colombia
4
Grupo de Investigación GIA, Fundacion Universitaria Tecnologico Comfenalco, Cr 44 D N 30A, 91, Cartagena 30015, Colombia
*
Authors to whom correspondence should be addressed.
Sustain. Chem. 2026, 7(2), 16; https://doi.org/10.3390/suschem7020016
Submission received: 19 February 2026 / Revised: 16 March 2026 / Accepted: 17 March 2026 / Published: 25 March 2026

Abstract

The adsorption and activation of CO2 on CuxScy nanoclusters with x + y equal to 4 were analyzed using DFT and PDOS and TDOS signatures. The geometries of Cu3Sc, Cu2Sc2, and CuSc3 were optimized in the gas phase, and the minima were verified by frequencies in ORCA using M06-2X/def2-TZVP. Multiplicities 1, 3, and 5, temperatures between 298 and 400 K, and four CO2 coordination modes R1 to R4 were evaluated. Naked and complex cluster comparison panels were constructed, and two energy windows, −18 to −10 eV and −8 to 6 eV around the Fermi level, were analyzed, complemented by frontier orbitals and charge maps. Thermodynamics indicated that mode and multiplicity control the adsorption energy, with ANOVA p-values of 0.002 and 0.008, while temperature was not significant (p = 0.682). In Cu3Sc–C2v(1), the R1 singlet at 298 K showed Eads −33.43 kcal·mol−1 with spin contamination, while alternative modes in the singlet were unfavorable. In PDOS and TDOS, the bare cluster exhibits a Cu d band at −11 to −10 eV and a valley around −5 eV. The exergonic complexes show CO2 signals near the Fermi level, superimposed on Cu and Sc states, with state filling and broadening. Transferable indicators based on CO2 intensity in the −8 to 6 eV range and metal–adsorbate overlap are proposed as predictors of exergonic adsorption.

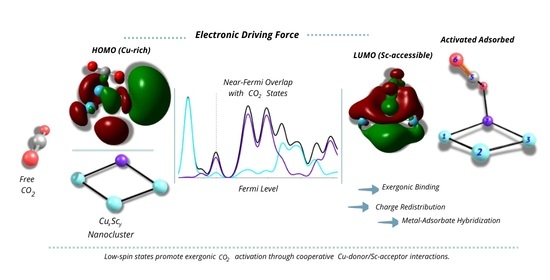
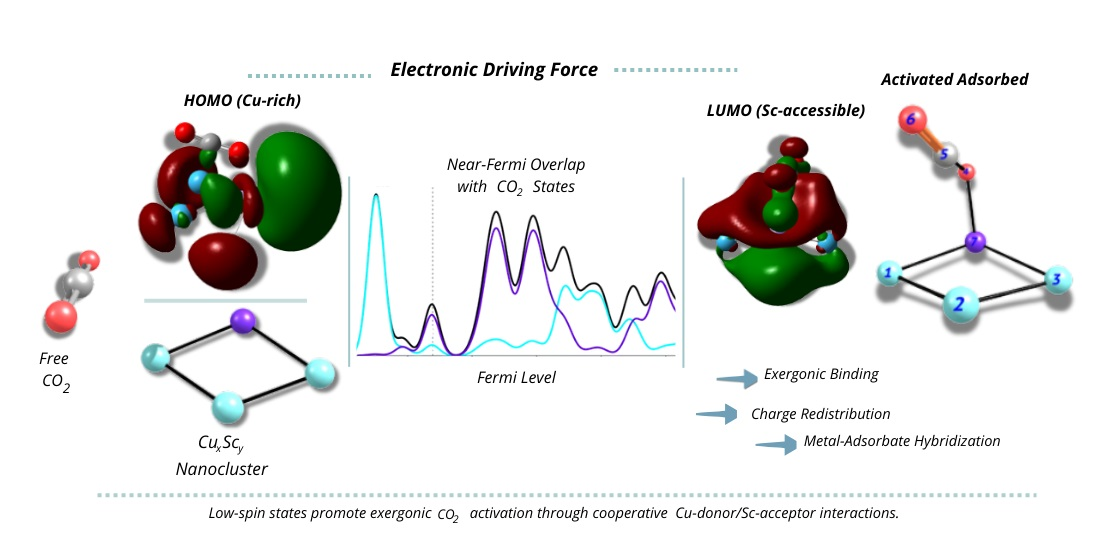
Graphical Abstract

1. Introduction

Rising global atmospheric CO2 concentrations demand urgent action to close the carbon cycle and foster a sustainable future. Selective capture and catalytic conversion of CO2 into value-added chemical feedstocks and fuels have emerged as a central pillar of sustainable chemistry and chemical engineering, directly contributing to the Sustainable Development Goals and the establishment of a circular economy [1,2,3]. This approach not only mitigates environmental waste but also transforms it into a valuable resource, positioning CO2 as a key raw material rather than a pollutant [4]. However, the inherent thermodynamic stability and kinetic inertia of the CO2 molecule present a formidable challenge for its efficient activation and conversion [5]. The development of advanced catalytic systems, framed within the principles of sustainable catalysis and green chemistry, is paramount for industrial viability and environmental sustainability, aiming to achieve high selectivity, moderate energy requirements, and robust performance [6].
From the perspective of sustainable catalyst design, the goal extends beyond simply retaining CO2 in an active site; crucially, it involves inducing its electronic activation [7]. This demands materials and architectures that promote effective orbital coupling, leading to O–C–O double bonding, C–O elongation, and partial occupation of antibonding orbitals—conditions that mark the transition from weak physisorption to reactive chemisorption. Recent computational and experimental evidence consistently highlights the energy region near the Fermi level as containing the most relevant mechanistic information for catalytic activity [8,9]. In single-atom catalysts and nanoalloys, chemisorbed systems exhibit characteristic hybridization peaks near the Fermi level, resulting from interactions between the metal’s d orbitals and CO2’s antibonding π* orbitals. Conversely, lower d-band centers often suppress such mixing, favoring weaker van der Waals interactions. Quantitative metrics such as surface d-charge and the availability of d-states above the Fermi level have been proposed as reliable descriptors for predicting binding strength and catalytic activity [10]. Furthermore, in bimetallic and subnanometric clusters, compositional changes provide a powerful electronic lever to reconfigure the density of states near the Fermi level, thereby enhancing hybridization and modulating catalytic properties. The importance of understanding these electronic structure features is underscored by their direct correlation with experimental observations [11,12]. For example, advanced characterization techniques such as X-ray absorption spectroscopy and EXAFS are increasingly employed to link theoretical predictions of electronic and geometric structures with experimentally observed catalytic performance in bimetallic systems for CO2 reduction. While the d-band center model has been widely used, ongoing research is also exploring more sophisticated data-based descriptors to accurately predict CO2 activation in complex single-atom alloys [13].
Based on this critical framework, this article analyzes the adsorption and activation of CO2 in CuxScy heterobimetallic nanoclusters with x + y = 4. Using a comprehensive factorial design in computational chemistry, we systematically evaluate key parameters, including composition, symmetry, spin multiplicity, temperature (298–400 K), and various orientations of CO2 at the metal center. Geometries are optimized by DFT with M06-2X and def2-TZVP in ORCA and validated by vibrational analysis [14]. This interpretation is supported by detailed Fermi-level-centered PDOS and TDOS analyses that elucidate trends in adsorption and activation from an electronic-structure perspective. A crucial aspect of this work is to link specific near-Fermi-level features with charge transfer and interaction strength, and subsequently propose electronically transferable indicators [15]. These indicators, based on the positions and effective widths of the d states and on metal–adsorbate overlap, serve as quantifiable hybridization signals. From a sustainability perspective, our key contribution lies not only in describing the DOS in an illustrative manner but also in translating these electronic fingerprints into operational criteria for material selection. This approach, by integrating computational methodologies, aligns with life cycle assessment, a critical tool for analyzing the environmental impacts of CO2-using technologies [16]. It enables the development of reusable descriptors for the rational screening of Cu–Sc compositions, prioritizing candidates with effective activation and thermodynamic properties compatible with efficient, regenerable catalytic cycles. Thus, computational modeling not only provides a mechanistic explanation but also advances green chemistry by significantly reducing the number of syntheses and experimental characterizations, minimizing reagent and energy consumption, and facilitating the rapid identification of optimal catalysts. This rational design approach reduces development costs, minimizes waste generation, and accelerates the transition to more viable capture and conversion processes with lower energy penalties, which is essential for a more sustainable chemical industry.

2. Materials and Methods

2.1. Model Building and Computational Factorial Design

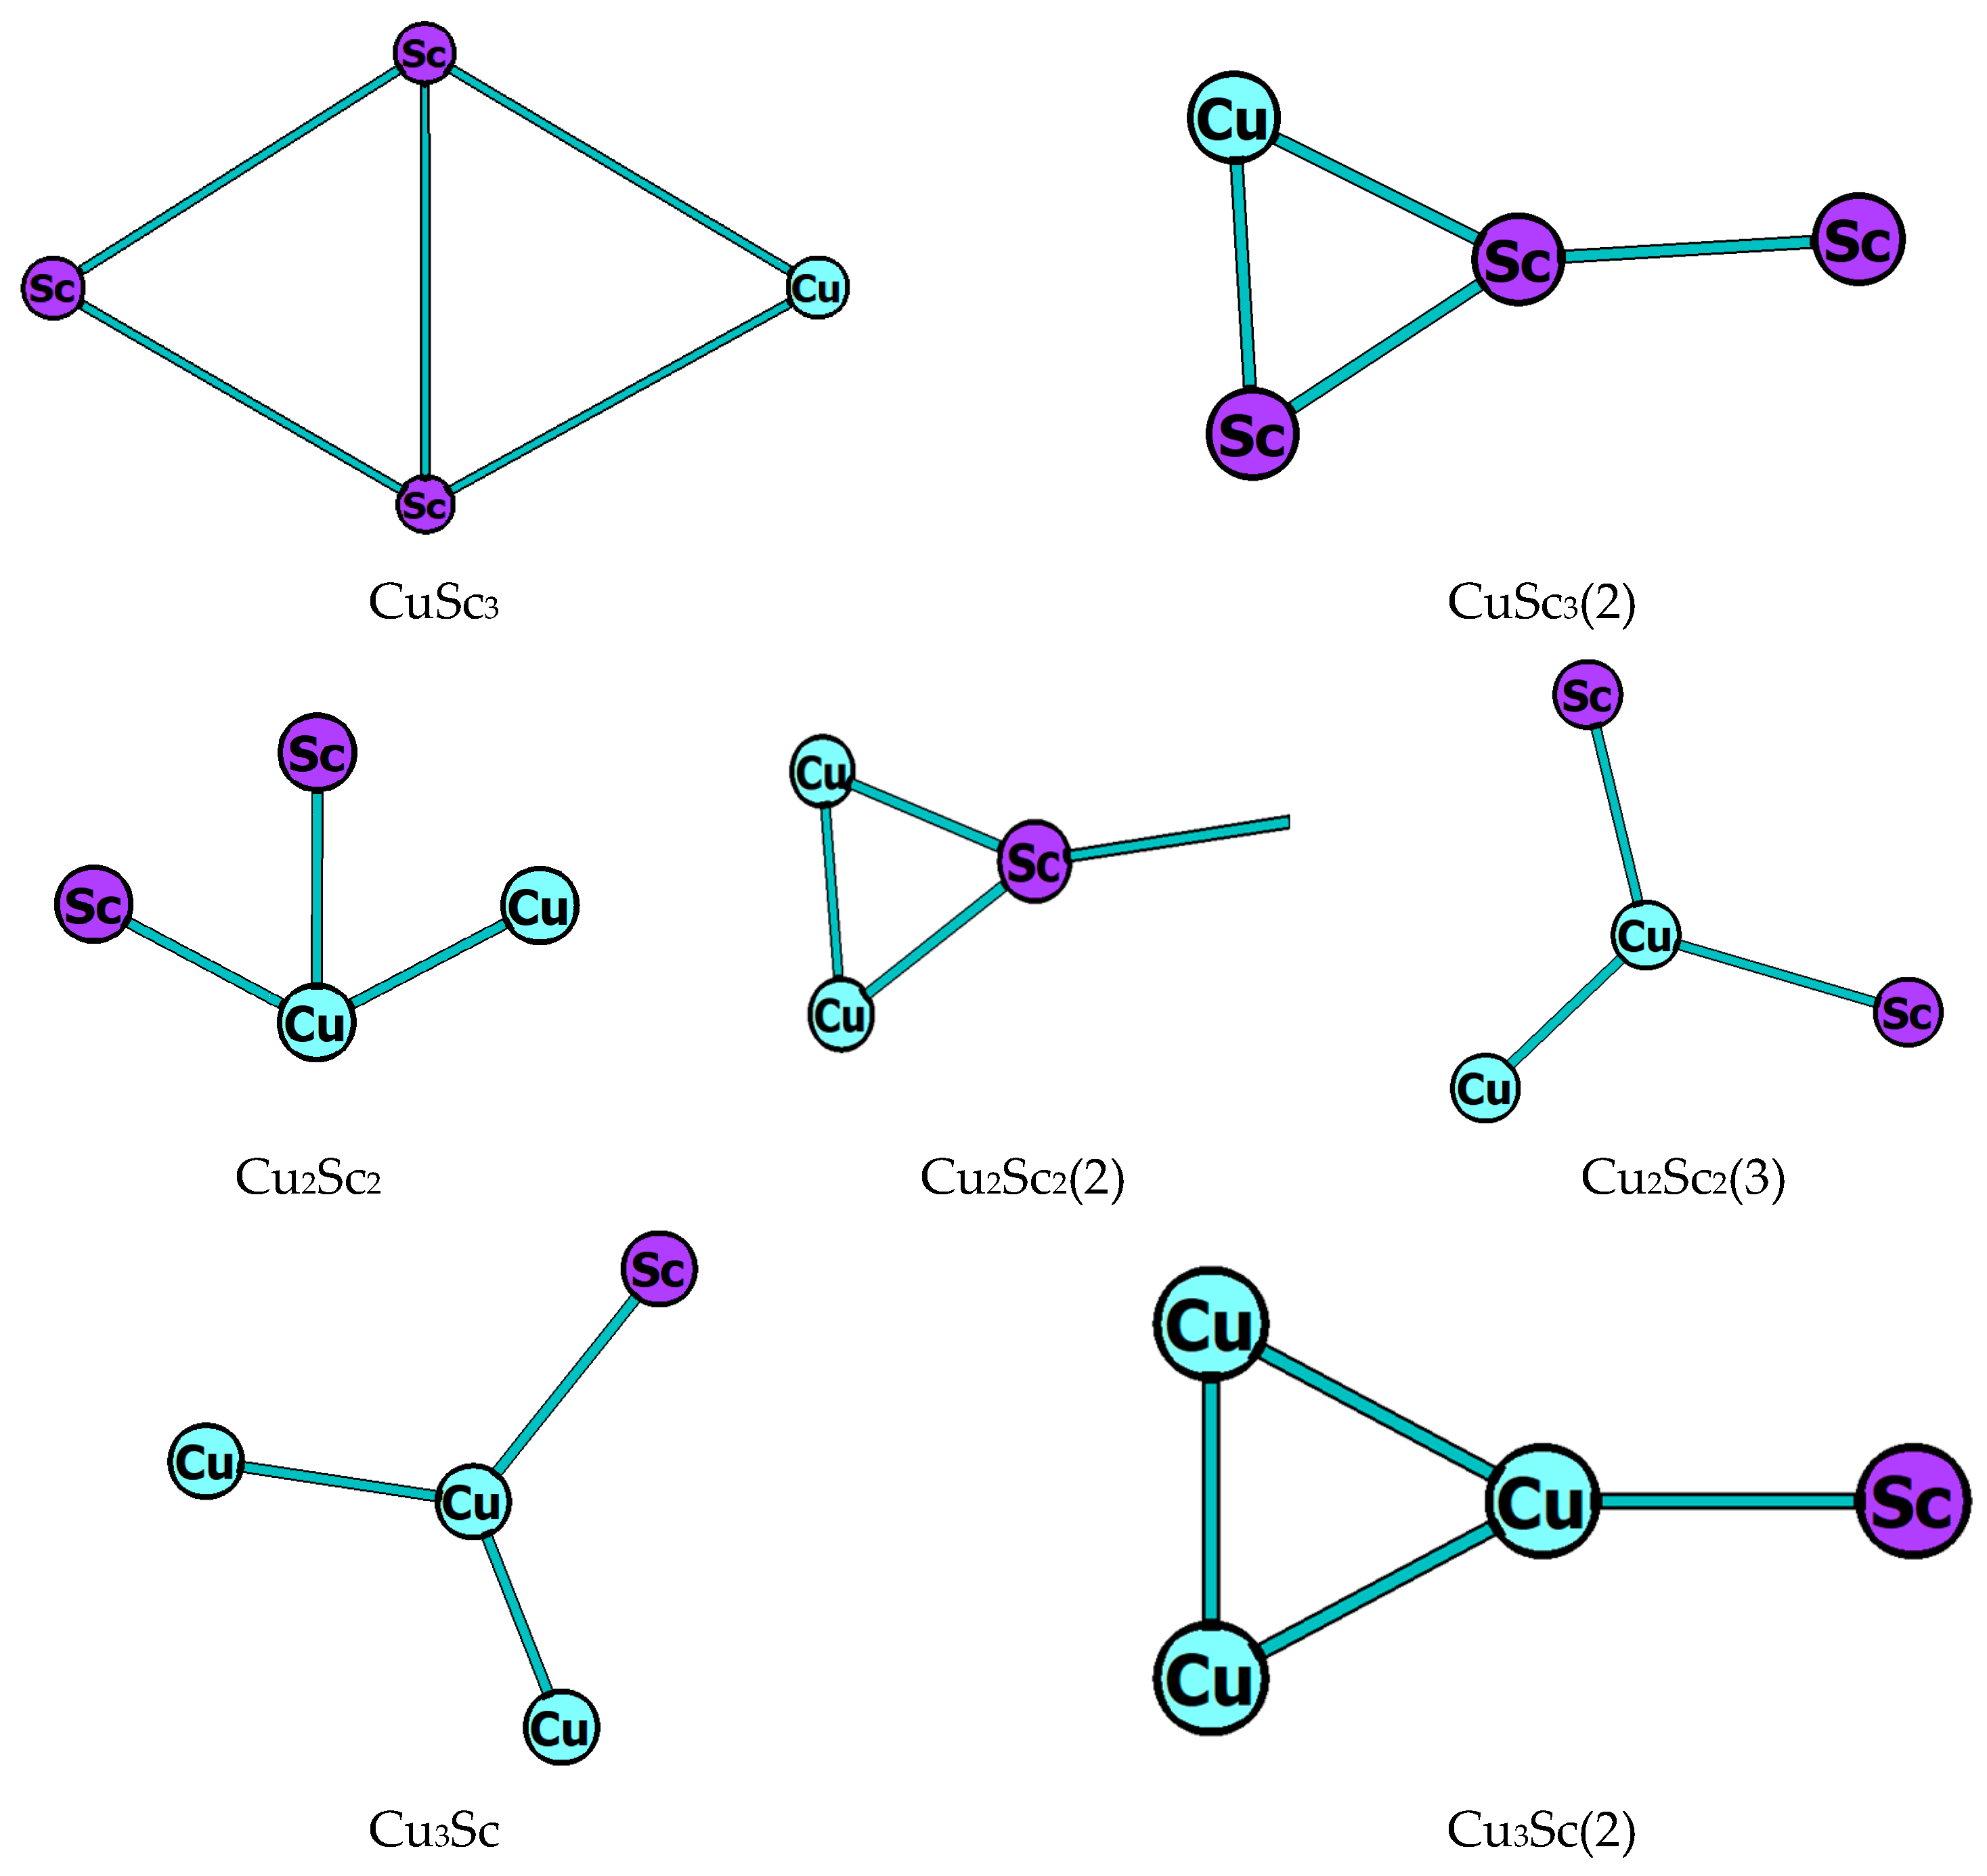
CuxScy nanoclusters with x + y = 4 were evaluated using a factorial design covering the following factors: composition; C2v, Cs, and C3v molecular symmetry; singlet, triplet, and quintet spin multiplicity; and temperatures of 298, 350, and 400 K (Figure 1). The initial geometries were constructed in GaussView 6.0 (Gaussian, Inc., Wallingford, CT, USA) and exported as XYZ coordinates to generate the input files. The calculations were performed in the gas phase with ORCA 6.1.0, using M06-2X and def2-TZVP, and included geometric optimization and vibrational analysis to obtain comparable thermodynamic properties across the systems [17,18].

2.2. CO2 Complexes and Energy-Thermodynamic Classification

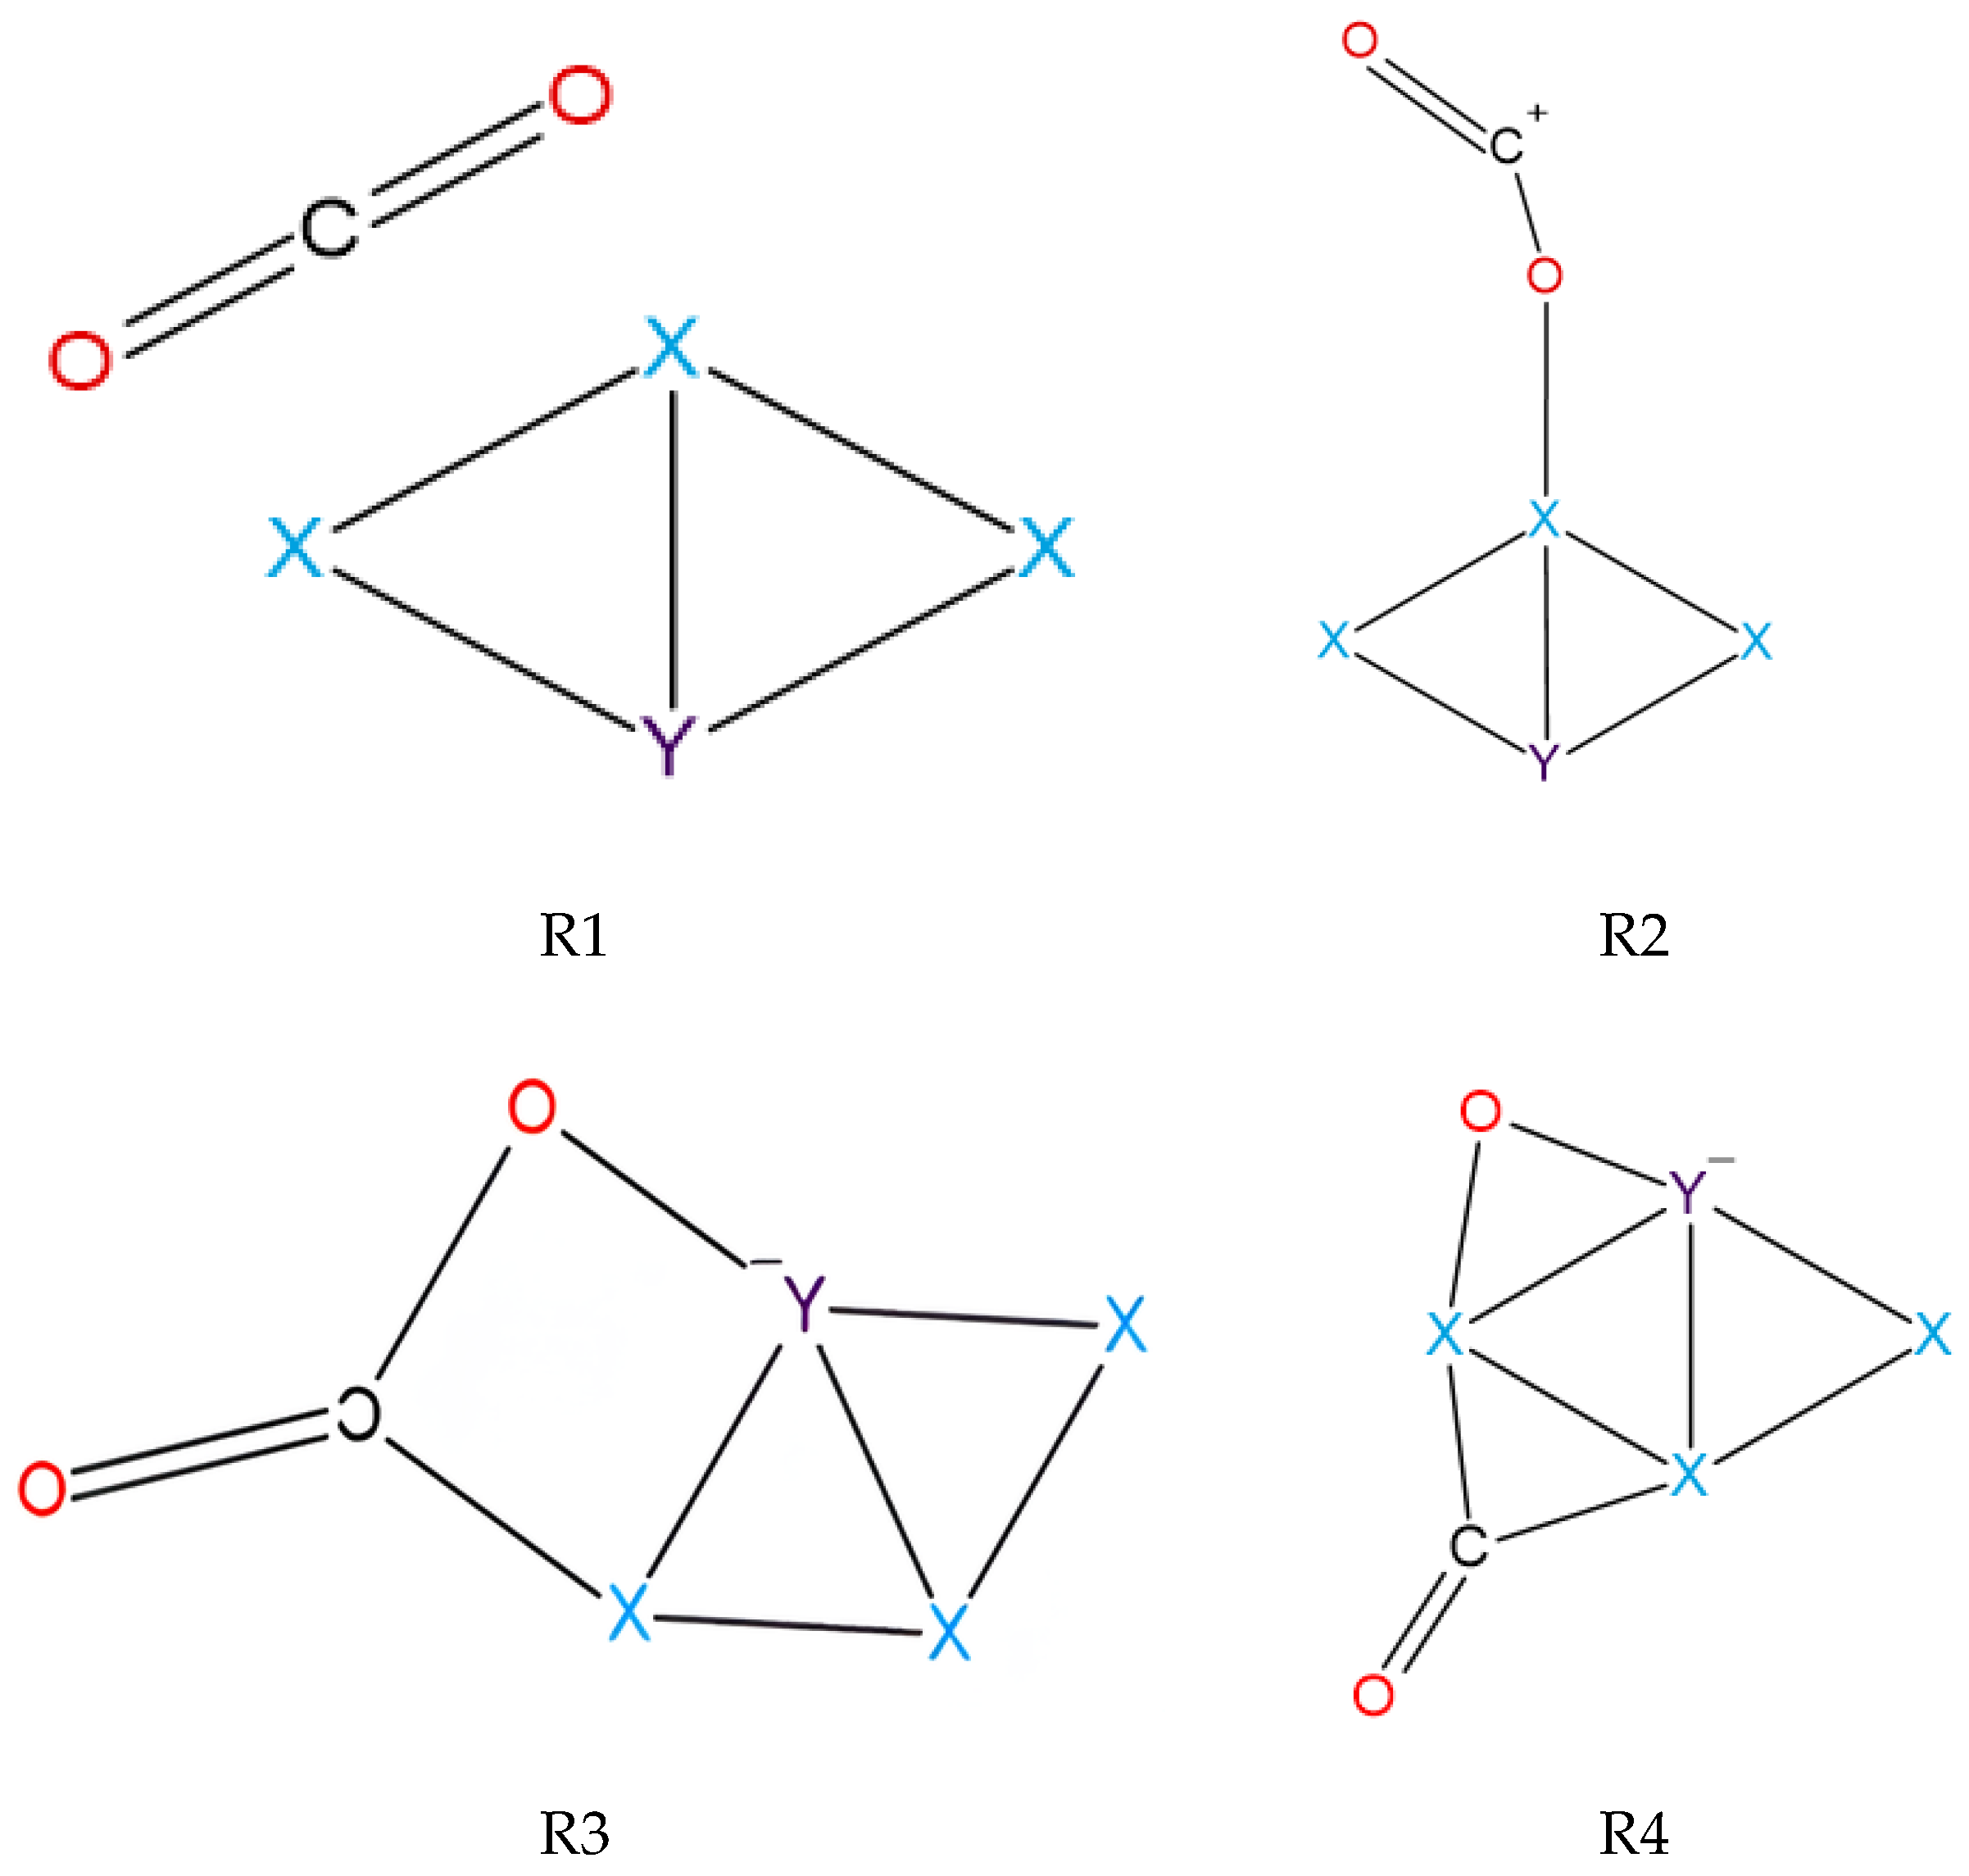
For each convergent cluster CuxScy–CO2 complexes were constructed, and four adsorption modes, R1, R2, R3, and R4, representing alternative metal–adsorbate orientations and coordination patterns, were evaluated. Figure 2 summarizes the initial geometries used as input structures in ORCA for the CuxScy family with x + y = 4. Singlet, triplet, and quintet spin multiplicities were considered for each mode. Each complex was refined to the same level of theory, and electronic energies, enthalpies, and Gibbs free energies were extracted at 298, 350, and 400 K. The configurations were classified as exergonic (unfavorable) based on the sign and magnitude of the adsorption free energy and the consistency of the minimum, as verified by frequency analysis.

2.3. Selection of Representative Cases for Electronic Comparison

The mechanistic analysis was based on comparable pairs of exergonic and unfavorable systems. First, Gibbs free energy minima were selected based on composition and adsorption mode, restricting the relative energies to be below 5 kcal·mol−1 of the global minimum. Then, only structures with sufficiently high negative adsorption energies and no residual imaginary frequencies were retained, with additional priority given to moderate HOMO-LUMO gaps and optimal electrophilicity (ω) values for charge transfer to CO2, according to the criteria outlined in the deliverable.

2.4. PDOS and TDOS Panels and Energy Windows near the Fermi Level

For each selected case, comparative panels were constructed comparing bare and complex clusters with CO2 using the Orca Plot utility from Orca 6.1.0 and the Multiwfn 3.8 program. TDOS and PDOS were generated and analyzed in windows centered on the Fermi level. The comparison was made in two recurring energy regions: a deep valence zone between −18 and −10 eV and a key window near the Fermi level between −8 and 6 eV. In this second region, the filling and broadening of states, and the energy coincidence between CO2 contributions and metallic states, were evaluated, with an emphasis on Cu d contributions and on accessible states associated with Sc in the range near −4 to 6 eV [19,20].

2.5. Complement with Orbitals, Differential Charge Maps, and Mechanistic Criteria

The DOS reading was complemented with frontier orbital analysis and reported electronic maps, including HOMO LUMO maps, electrostatic potential maps, and charge difference maps to examine adsorption-induced electronic redistribution. The mechanism was established operationally from the combined evidence of overlap and metal–adsorbate hybridization, identifying cases where the complex introduces CO2 signals within the Fermi window that overlap with metallic states, accompanied by charge redistribution consistent with thermodynamic stabilization [21].

3. Results and Discussion

3.1. Adsorption Modes and Structural Activation Reading

The activation of CO2, a fundamental step in its catalytic valorization, depends critically on the coordination mode with the catalyst surface [22,23]. Therefore, before interpreting adsorption energies or electronic signatures, it is imperative to establish and understand the evolution of the optimized geometries across the different adsorption modes (R1–R4). A simplified schematic representation of these coordination patterns is shown in Figure 2, in which the orientations and metal–adsorbate bonding motifs evaluated in this work are defined. This systematic approach allows for a clear distinction between scenarios of activated molecular adsorption and those that evolve toward non-molecular or dissociative states. The complete set of optimized geometries for the four CO2 adsorption modes on the Cu3Sc–C2v cluster is included in the Supplementary Materials.
The results reveal two distinct structural behaviors that are crucial for understanding the reaction mechanisms. In modes R1 to R3, CO2 remains a molecular entity, exhibiting significant distortion from its intrinsic linearity. This consistently observed and measured O-C-O angle bending is an unequivocal signature of CO2 activation via metal–adsorbate interactions [24,25]. This molecular activation is desirable for many selective conversion processes, where the goal is to transform CO2 without completely dissociating it. Previous research on CO2 activation in copper and bimetallic clusters, including Cu-Sc systems, has used CO2 bending as a key indicator of activation [26,27].
Conversely, in mode R4, the optimized minimum tends to deviate from the molecular adsorption framework, resulting in configurations in which CO2 is no longer conserved. This behavior suggests that a portion of the thermodynamics in this mode does not represent reversible adsorption, but rather a dissociative or reactive regime. The ability to accurately distinguish between molecular activation and dissociation is fundamental, as the resulting reaction pathways can lead to entirely different products, drastically affecting catalytic selectivity [28]. For example, in the electrochemical reduction of CO2, modulation of electronic and geometric structures is key to influencing yield and selectivity.
This meticulous structural distinction not only provides a deep mechanistic understanding but also guides the subsequent selection of representative cases for PDOS and TDOS panels, favoring exergonic configurations that maintain activated but molecular CO2. The strength of our analysis lies in the systematic resolution of these coordination modes, which goes beyond illustrative descriptions, allowing us to quantify and correlate these structural signatures with key electronic properties. This represents a significant improvement, as integrating this detailed computational data with green chemistry principles drastically reduces experimental trial-and-error, thereby minimizing reagent and energy consumption during the catalyst discovery phase [29,30]. The use of advanced computational tools significantly accelerates the discovery of new catalytic materials. It enables refinement of existing ones to improve their efficiency and selectivity, laying the groundwork for scalability in commercial applications [29]. The ability to predict how CO2 is activated at the molecular level is crucial for designing catalysts with high selectivity and stability for sustainable applications. For example, recent studies have shown that rational design based on theoretical data enables the selection of bimetallic catalysts that have been experimentally validated to improve the performance of C-C coupling reactions in CO2 reduction [31]. Similarly, correlating catalytic activity with the adsorption isotherms of reactants, such as CO2, has been a successful approach for evaluating and developing new catalysts. This work, by identifying the most promising activation modes, lays the groundwork for developing novel CuxScy catalysts that could be experimentally validated for the efficient and sustainable conversion of CO2 into high-value products.

3.2. Adsorption Thermodynamics and Operational Definition of Exergonic and Unfavorable Cases

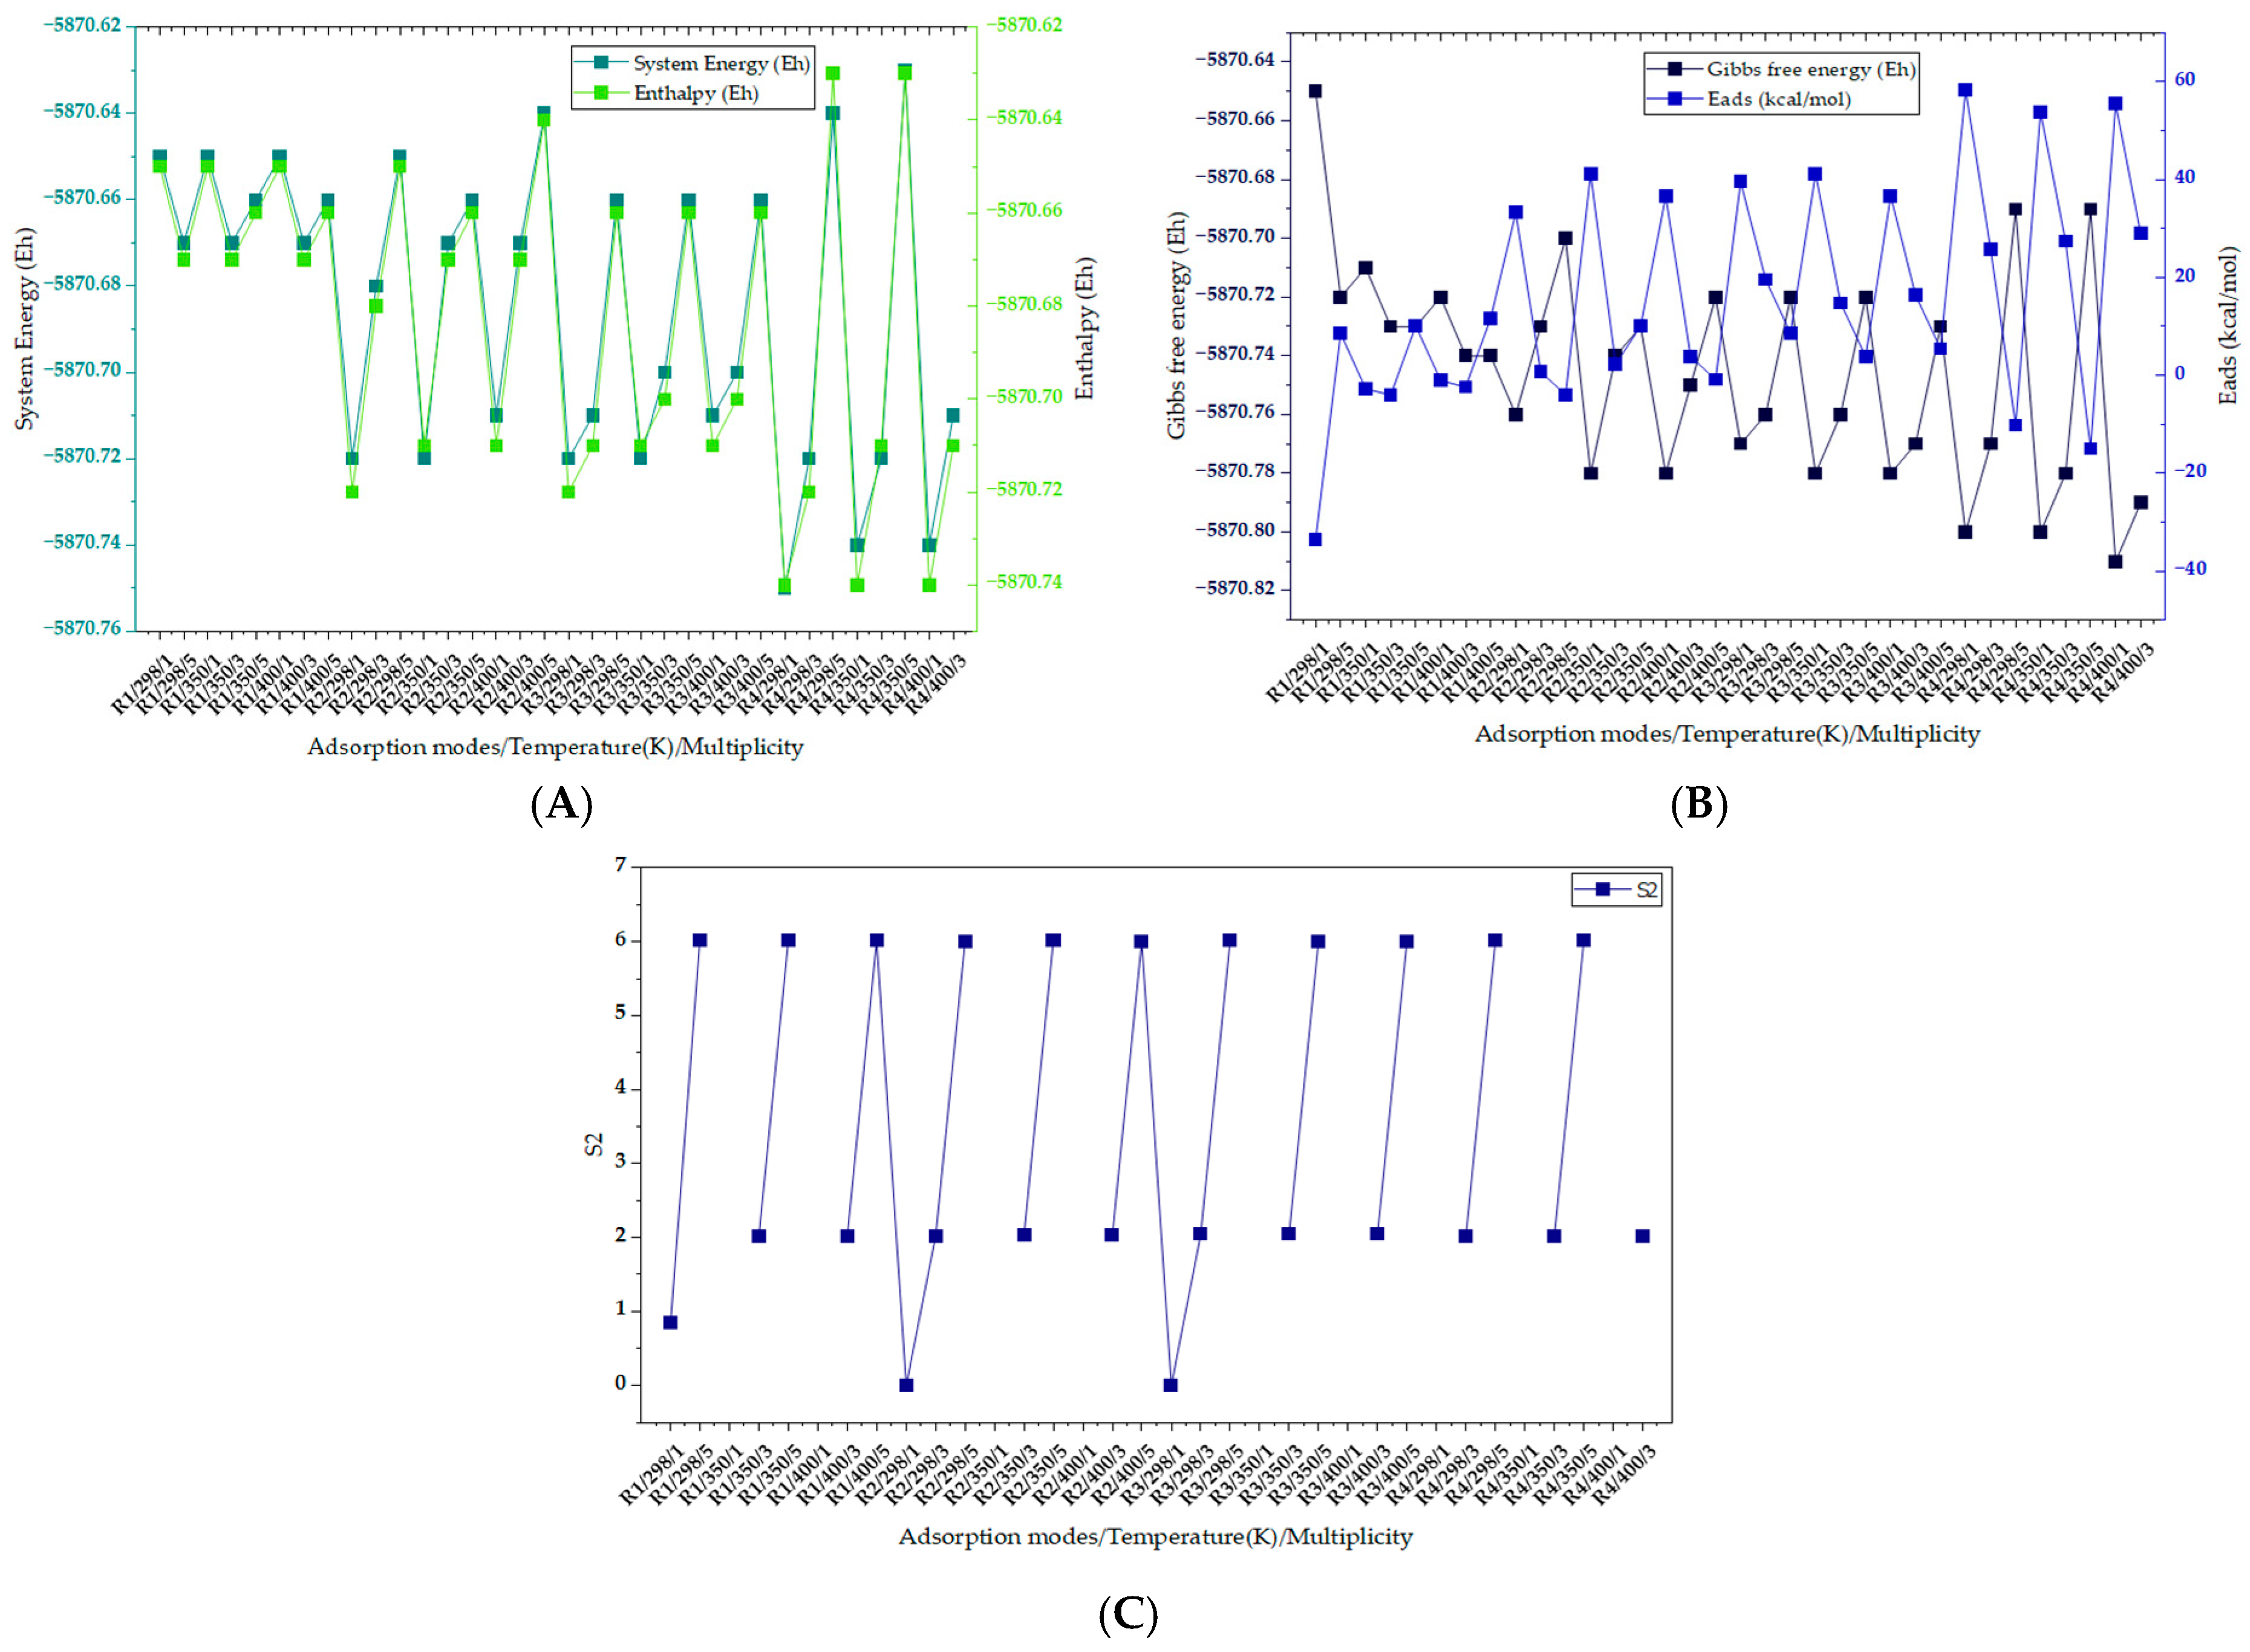
The thermodynamic behavior and electronic consistency of CO2 adsorption on Cu3Sc–C2v(1) are summarized using modes R1 to R4, with temperatures of 298, 350, and 400 K and multiplicities of 1, 3, and 5. This presentation allows direct identification of which mode-spin combinations produce exergonic adsorption with physical significance and which correspond to unfavorable scenarios due to endergonicity or electronic solutions that require caution.
In Figure 3A, the total system energy and enthalpy exhibit remarkably parallel trajectories across modes, temperatures, and spin multiplicities. This internal consistency indicates that the observed stability changes are primarily due to structural and electronic variations induced by the coordination mode and spin state, which is consistent with previous studies of CO2 adsorption on bimetallic nanoclusters [21,32]. Figure 3B confirms that the dominant control on adsorption lies in the mode and multiplicity, whereas increasing the temperature between 298 and 400 K introduces secondary adjustments, mainly due to entropic effects that become more pronounced at higher temperatures, as has also been observed in other CO2 activation systems [27].
At 298 K, the singlet R1 mode exhibits the most exergonic adsorption with an adsorption energy of −33.43 kcal·mol−1. However, Figure 3C shows a value of 0.84 for the same case. This value, which deviates significantly from a pure singlet state, is a sign of spin contamination; it indicates that the spin wavefunction is not an eigenfunction of the spin Hamiltonian, requiring caution when interpreting this exergonicity, especially if it is used as a reference for electronic correlations [33]. Spin contamination is a known challenge in DFT calculations of transition metals, where spin states that are close in energy can introduce artifacts. In the specific case of Cu3Sc clusters, the singlet and triplet states of the bare cluster have been reported to be quasi-degenerate, although singlet Cu3Sc–CO2 adducts are generally more stable [27]. This sensitivity underscores the importance of validating spin purity when interpreting thermodynamic results.
Under the same framework, singlet R2 and R3 are markedly unfavorable, at 33.28 and 39.55 kcal·mol−1, respectively. Meanwhile, singlet R4 reaches a value of 58.38 kcal·mol−1, which is consistent with the lack of thermodynamic stabilization for molecular adsorption in this combination. These positive values indicate that the formation of the adsorption complex is endothermic and therefore non-spontaneous under these conditions, a behavior also observed in other bimetallic systems where certain configurations are thermodynamically unfavorable [34].
Specific cases with negative values in the quintet are also observed for modes other than R1. For example, R2 in the quintet at 298 K with −3.93 kcal·mol−1 and R4 in the quintet at 298 K with −10.21 kcal·mol−1. However, their interpretation must be intrinsically linked to the nature of the minimum. The R4 mode, in particular, can lead to non-molecular scenarios where CO2 dissociates, as discussed in the previous section. In these cases, the reported energy reflects a reactive state or a transition state toward dissociation rather than reversible molecular adsorption [35]. Research on CO2 adsorption on transition metal nanoclusters has shown that adsorption energies vary widely, from strongly negative values indicating robust chemisorption (Ni4Mo with −41 kcal/mol) to values close to zero or positive for weak adsorption [36].
The rigorous thermodynamic characterization of CO2 adsorption modes using computational chemistry is fundamental to green chemistry and the sustainable design of catalysts. By operationally classifying adsorption modes as “exergonic and molecularly activated” versus “unfavorable or dissociative,” this study directly helps reduce experimental “trial and error” [29,30]. Early identification of the optimal conditions (coordination mode, spin multiplicity) for CO2 activation avoids synthesizing and characterizing numerous inefficient catalysts, significantly reducing reagent, energy, and time consumption and minimizing waste generation in the laboratory.
Furthermore, the correlation between computational adsorption energies and experimental results is increasingly important. For example, excellent agreement has been shown between CO2 adsorption energies calculated by DFT and those measured calorimetrically in Cu/UiO-66 systems [37]. Similarly, the ability to predict the stability of adsorption intermediates is crucial for understanding selectivity. Studies such as those by Zheng et al. [38] have used DFT calculations to identify active sites in CuZn alloys, which were subsequently validated experimentally to improve the production of C2+ products in CO2 reduction. Our approach, by precisely defining exergonic cases for molecular CO2 adsorption, generates reliable thermodynamic descriptors that can directly guide the experimental design of CuxScy clusters. This accelerates the discovery and optimization phase, allowing researchers to focus on promising systems that have the potential to enable efficient, selective, and ultimately more sustainable CO2 conversion. Integrating computational thermodynamics into the early stages of catalyst development is therefore an essential strategy for sustainable innovation in CO2 conversion [39].

3.3. Significance of Factors and Global Map of Eads Trends

To support the idea that the differences observed in Eads are due to dominant physical controls and not marginal variations, the contribution of multiplicity, temperature, and adsorption mode is statistically evaluated (Table 1).
Studying the thermodynamics of CO2 adsorption on bimetallic catalysts is fundamental for predicting and optimizing their performance. Our analysis of variance of the adsorption energy reveals that spin multiplicity and adsorption mode are significant factors, with p-values of 0.002 and 0.008, respectively. This finding underscores the critical importance of the cluster’s electronic structure and the spatial configuration of the metal–adsorbate interaction in stabilizing the CO2 complex. Conversely, temperature in the 298–400 K range is not a significant factor, with a p-value of 0.682. This result is consistent with a scenario in which complex stabilization is predominantly governed by the adsorbate’s electronic structure and coordination. At the same time, the thermal increment from thermodynamic corrections does not qualitatively alter the stability order among the modes within the explored range. These findings are consistent with the literature, in which the intrinsic interaction between CO2 and the surface, mediated by charge transfer and d-orbital density, is usually the determining factor for activation [40,41]. Other ANOVA studies of catalytic processes have also shown that temperature can have a variable impact on selectivity, being less decisive than factors inherent to catalyst composition or reaction mechanism [42].
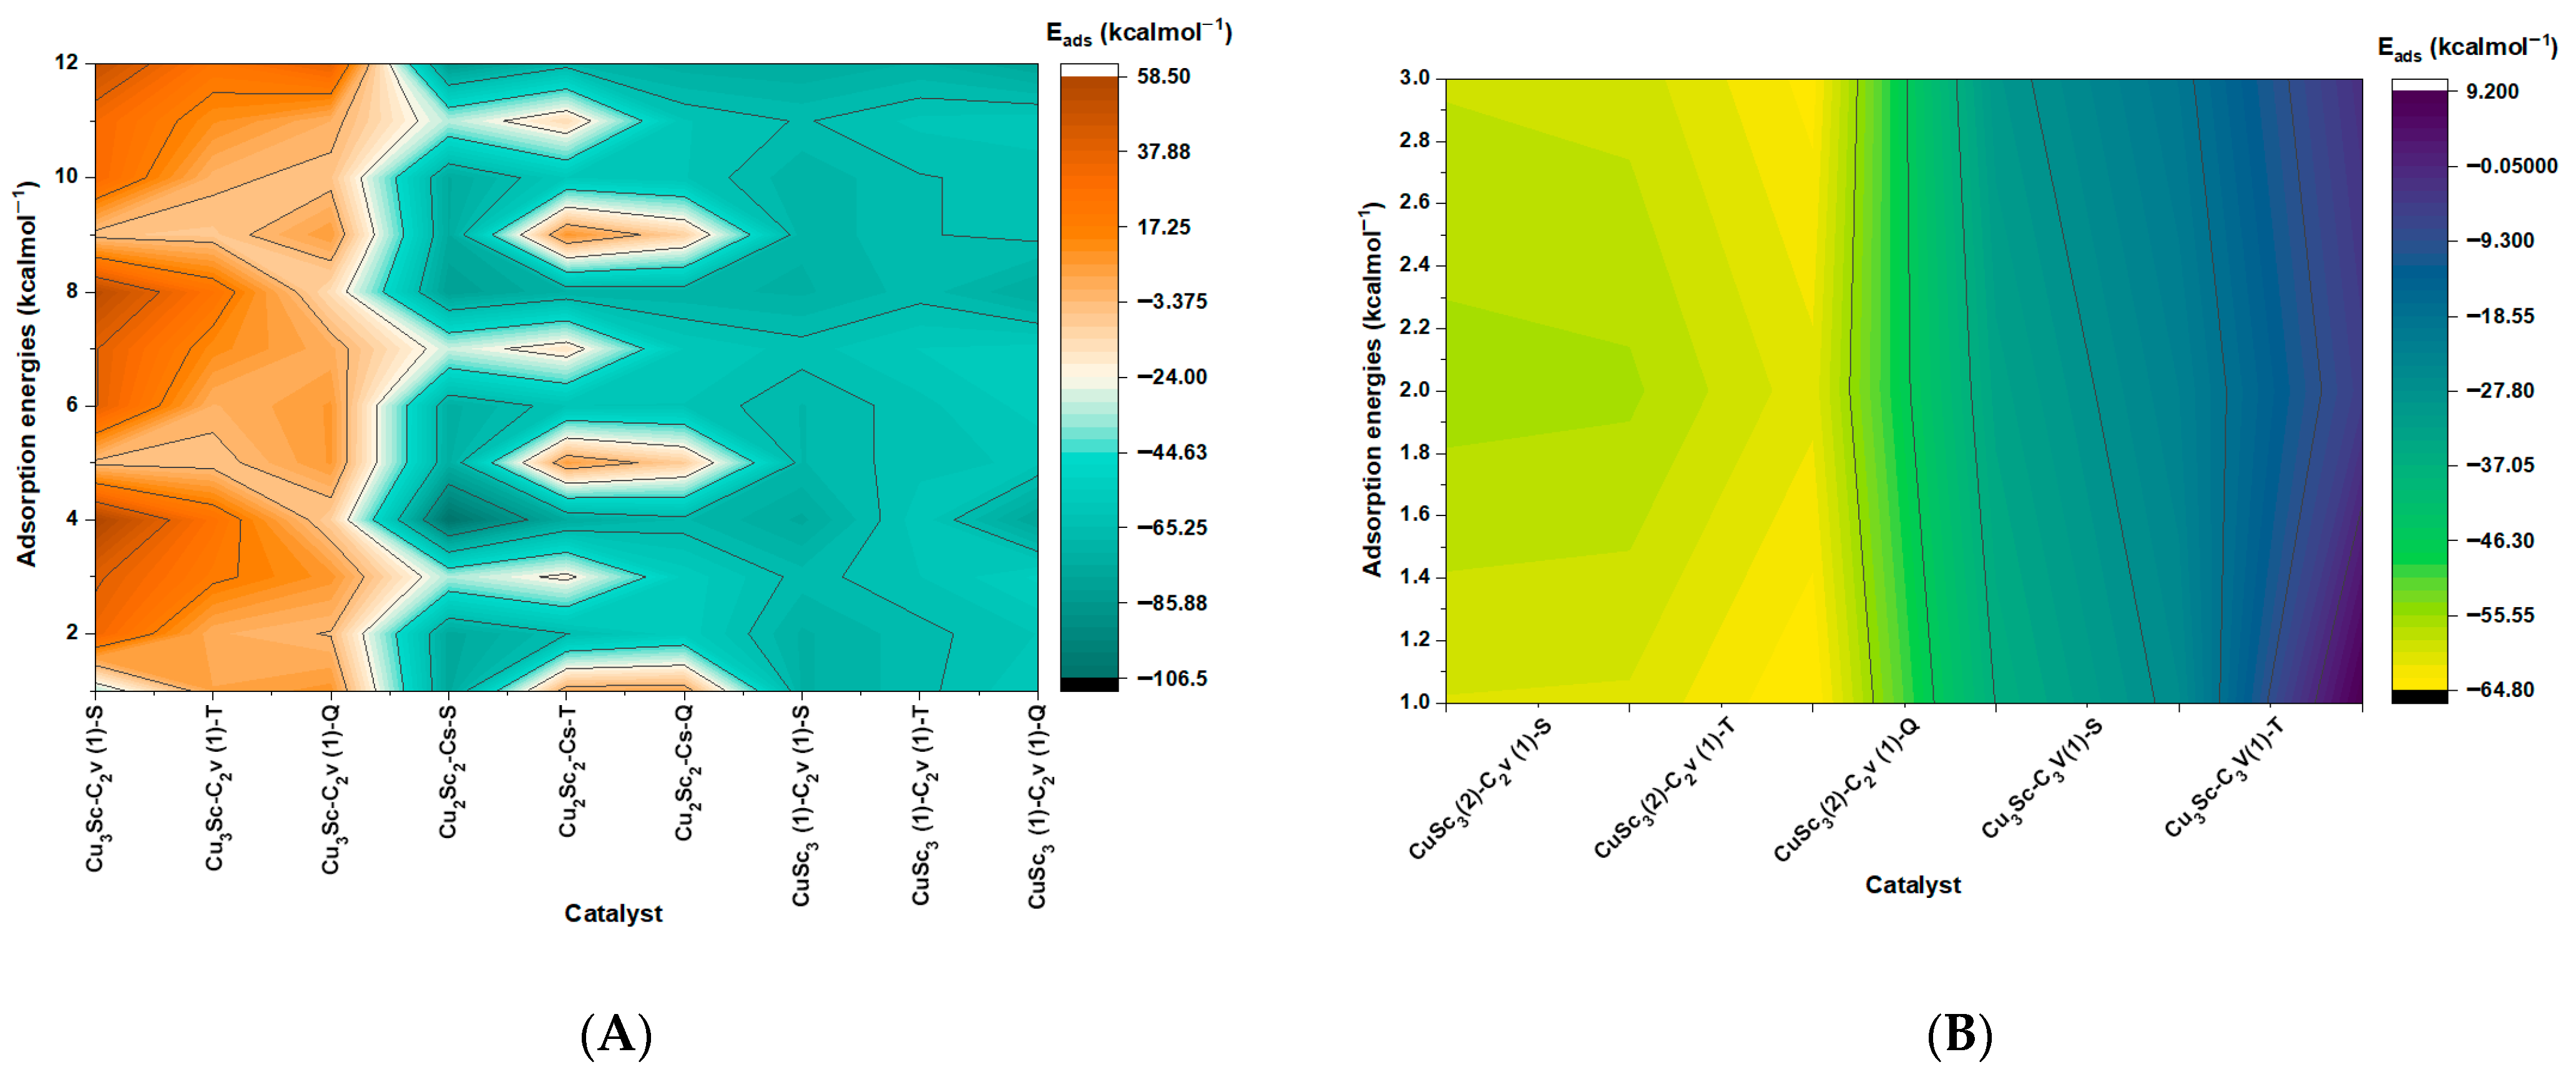
To visualize the behavior of the CuxScy space in an integrated manner, contour maps are used to quickly locate exergonic domains, marginal regions, and conditions where minima appear associated with very strong interactions or non-molecular regimes (Figure 4).
Specifically, the results demonstrate that the Cu3Sc–C2v cluster is situated at a relatively weak adsorption extreme, where only the R1 singlet mode and some high-temperature triplets approach favorable values. On the other hand, the Cu2Sc2–Cs cluster exhibits an excessively strong adsorption regime, with a high propensity for dissociative states. This contrast is fundamental: weak adsorption can be desirable to facilitate product desorption and maintain the reversibility of the catalytic cycle, whereas excessively strong adsorption often leads to CO2 dissociation, catalyst poisoning, or the formation of unwanted products [28,43]. Modulating the adsorption strength, from weak to strong regimes, is a key factor in controlling selectivity and activity in the conversion of CO2 into different products [44,45]. This differentiation between clusters justifies presenting the subsequent electronic analysis as a comparison between representative exergonic cases versus unfavorable ones, thus avoiding mixing minima that actually belong to different interaction pathways within the same energy reading.
ANOVA results and contour maps are powerful tools for the rational design of sustainable catalysts, as they enable a deep understanding of structure-activity relationships without resorting to costly, time-consuming trial-and-error experiments. By accurately identifying the most influential factors (multiplicity and adsorption mode) and the least relevant ones (temperature within the studied range), this study allows for a more efficient focus of experimental efforts. It drastically reduces the number of syntheses and characterizations required to find promising candidates, minimizing reagent consumption, energy use, and waste generation—fundamental pillars of green chemistry [29,46]. By rapidly visualizing favorable and unfavorable adsorption domains, contour maps enable the intelligent selection of nanocluster compositions. This means that researchers can avoid compositions such as Cu2Sc2–Cs, which are highly prone to dissociative states, and instead focus on configurations that promote activated, exergonic molecular adsorption, which is crucial for selective and controlled conversion. This predictive design capability accelerates the development of CO2 catalysts that are not only efficient but also sustainable, by extending their lifetime and avoiding the production of unwanted byproducts [47]. Identifying significant adsorption modes and characterizing weak/strong adsorption regimes provides a solid foundation for developing transferable electronic descriptors. These descriptors are essential for high-throughput computational screening of future catalysts, thereby enhancing the efficiency of discovering new materials for carbon circularity [30].

3.4. PDOS and TDOS Panels as Electronic Footprints of Stability

Understanding the interaction between CO2 and catalytic surfaces at the atomic level is essential for designing efficient and sustainable catalysts. This connection is established by analyzing the projected and total density of states of the free cluster and the adsorbed complex [47,48]. The analysis is organized into two critical energy windows: a deep valence region (approximately between −18 and −10 eV) and a window close to the Fermi level (approximately between −8 and 6 eV), where the metal–adsorbate overlap responsible for stabilizing the activated complex is expected to be captured.
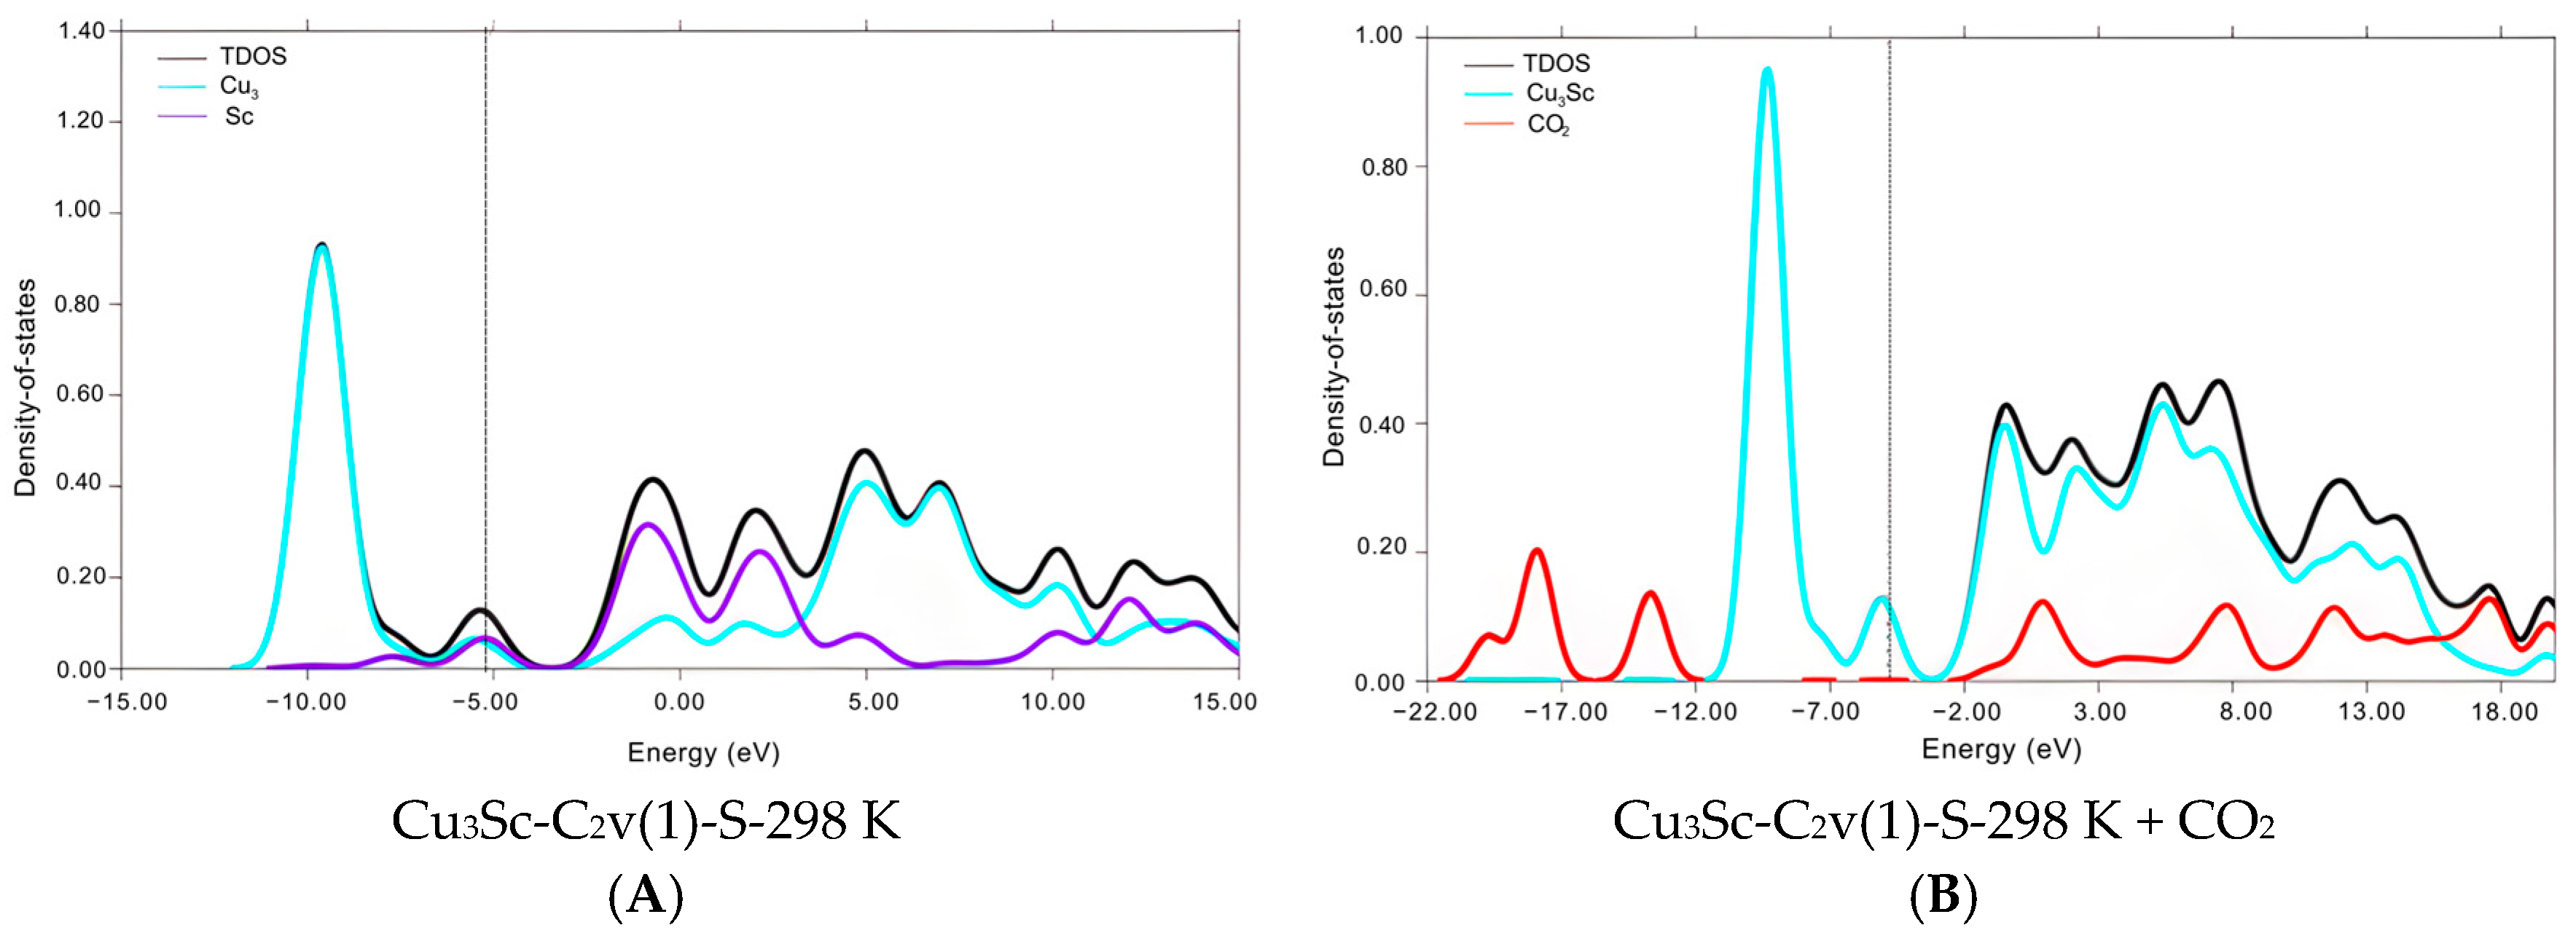
In Figure 5A, the electronic “base footprint” of the bare Cu3Sc–C2v cluster is shown. Characteristically, there is an intense band dominated by Cu d orbitals in the deep valence (around −11 to −10 eV, as is common in Cu-based systems [21]) and a depression of states around the Fermi level. This configuration indicates that the boundary states available for interaction are relatively constrained, suggesting an opportunity for controlled activation. In Figure 5B, CO2 adsorption introduces its own signals in the deep valence (mainly associated with CO2 O 2p orbitals), but, more chemically relevant, significant contributions are observed in the window near the Fermi level that overlap with cluster states. This energetic match and the local broadening of the TDOS imply substantial metal–adsorbate orbital mixing, consistent with charge transfer and stabilization of the activated state [27]. This constitutes the fundamental electronic requirement for transitioning from weak interactions (physisorption) to chemisorption upon activation [49]. The emergence of new hybrid states near the Fermi site is a key indicator of CO2 activation and the formation of a chemical bond with the catalyst. The importance of the cluster’s composition and structural configuration in modulating this interaction becomes evident when comparing different stoichiometries and isomers.
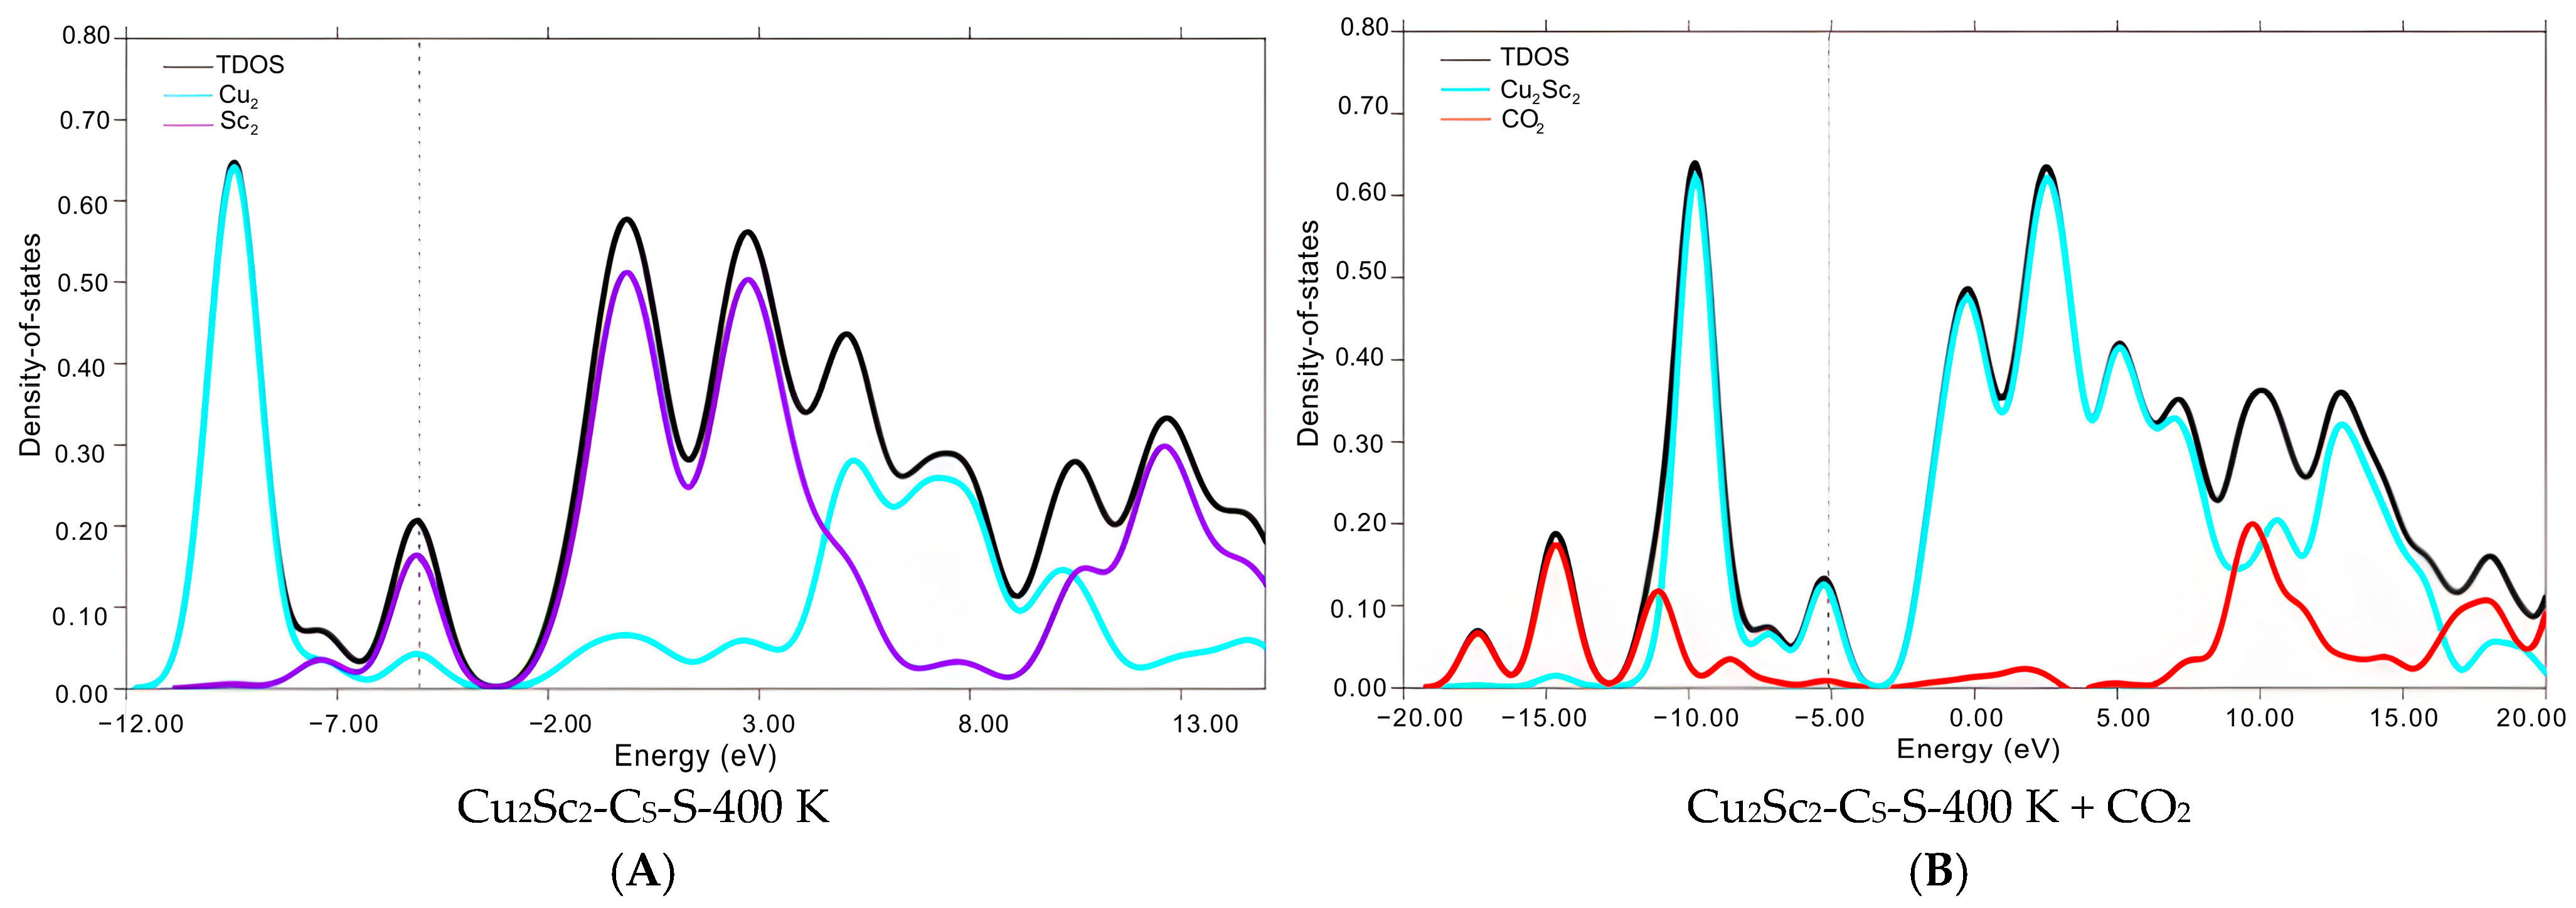
In Figure 6A, the Cu2Sc2 cluster shows a more pronounced Sc contribution in the region near the Fermi, suggesting accessible acceptor states associated with the Sc component (an early transition metal) and, therefore, a greater intrinsic capacity to polarize adsorbates [27]. In Figure 6B, CO2 incorporation shows strong contributions at deep valencies. Still, its presence near the Fermi level is more limited and appears more dependent on a specific “fit” with the cluster states. Chemically, this describes a scenario in which activation is not guaranteed solely by the presence of Sc, but also by the precise alignment of the boundary states and the coordination geometry. If the overlap in the window near the Fermi is reduced, the interaction tends to be less hybrid and more sensitive to the adsorption mode, which explains the variability observed between favorable and unfavorable cases within the same Cu2Sc2 stoichiometry [50].
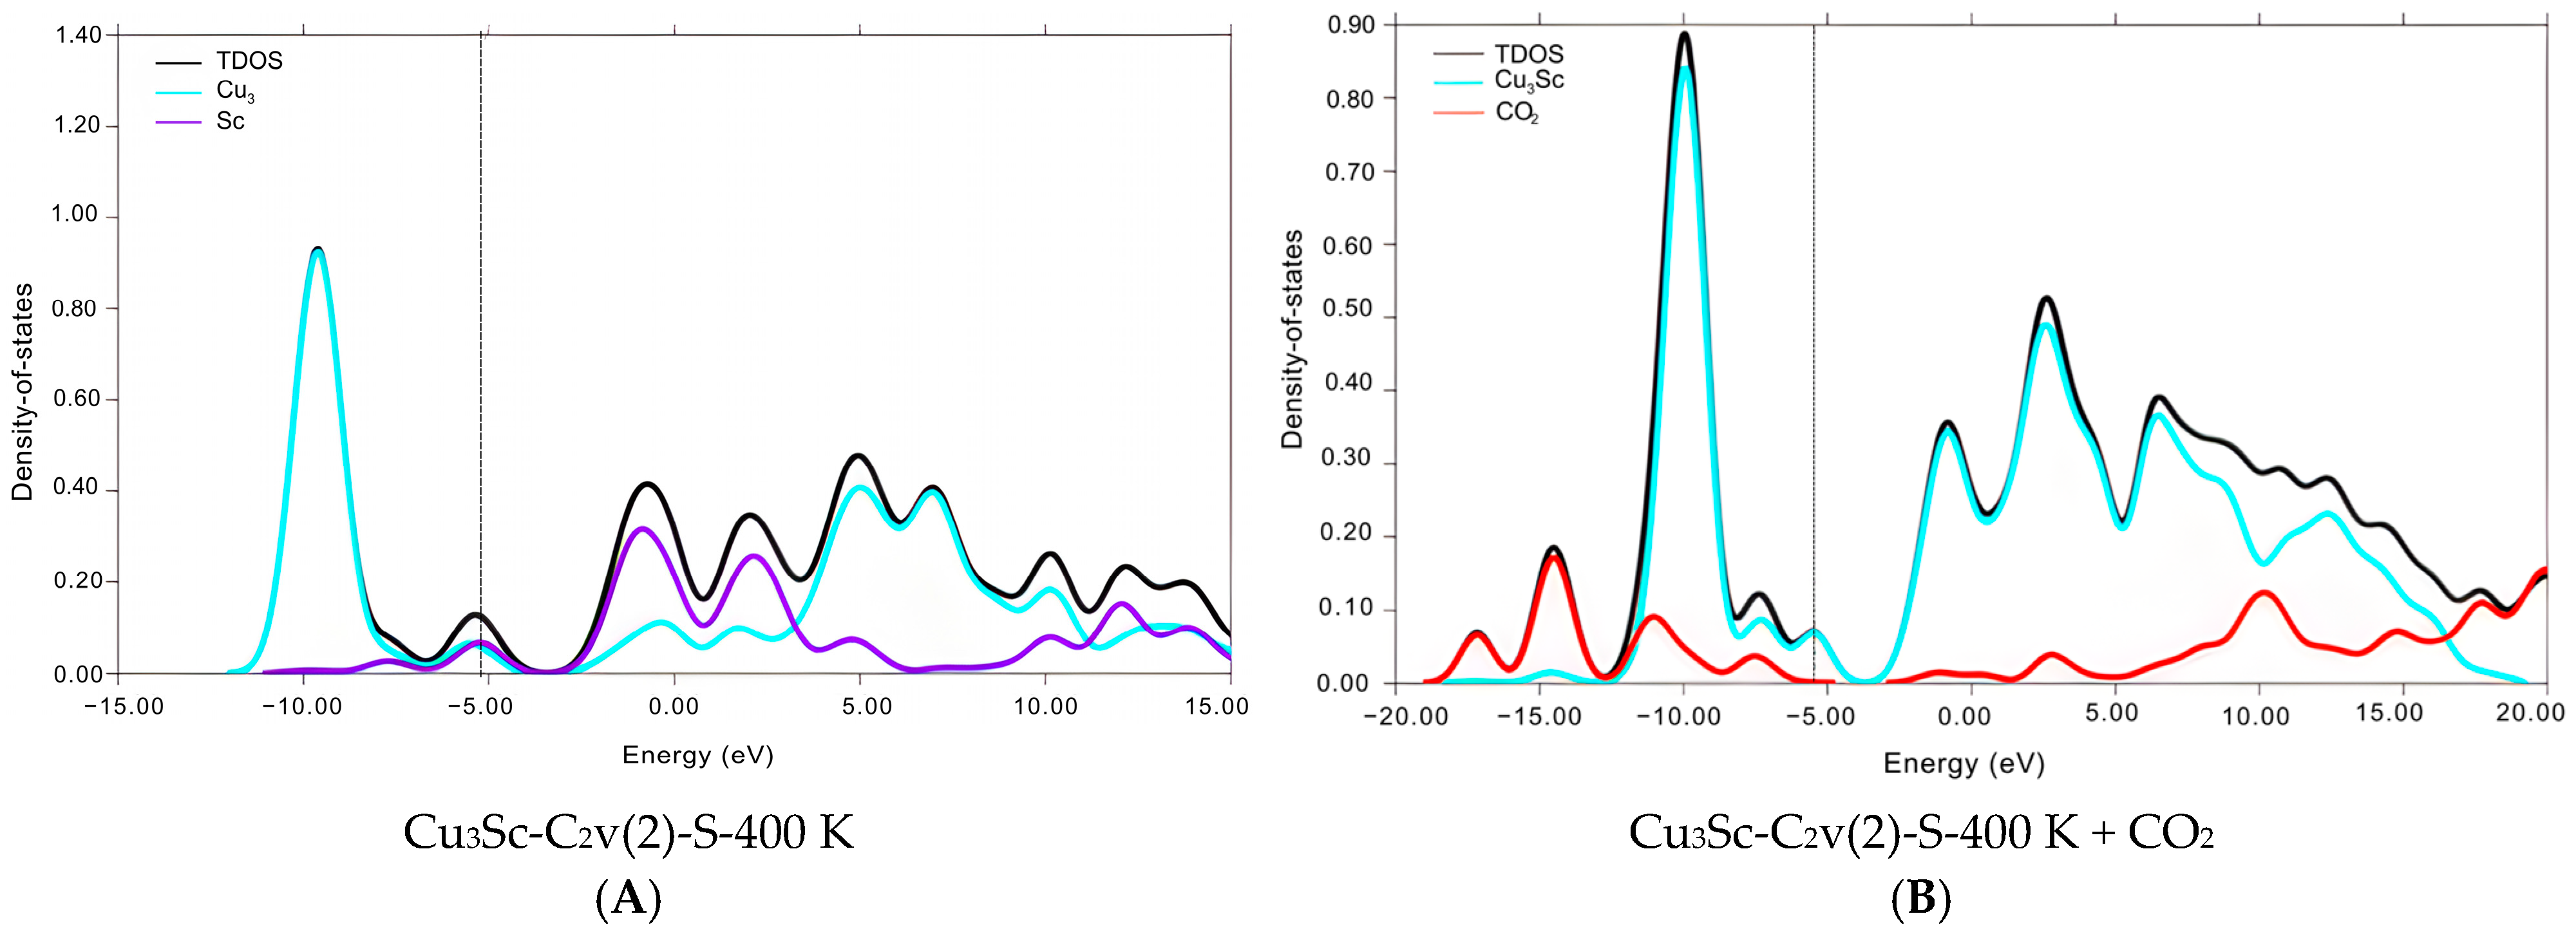
The influence of structural isomerism within the same composition is also notable. In Figure 7A, the Cu3Sc isomer shows a more “populated” distribution of states near the Fermi than the Cu3Sc isomer (Figure 5A), indicating a greater availability of frontier states for coupling. Consistently, in Figure 7B, CO2 not only contributes bands in deep valence, but also appears with a clearer signal in the region near the Fermi and with a notable overlap with the Cu and Sc states. Chemically, this represents more effective metal–adsorbate hybridization, i.e., orbital coupling that facilitates a more efficient redistribution of electron density toward the antibonding orbitals of CO2, thereby stabilizing the activated complex—this type of [21].
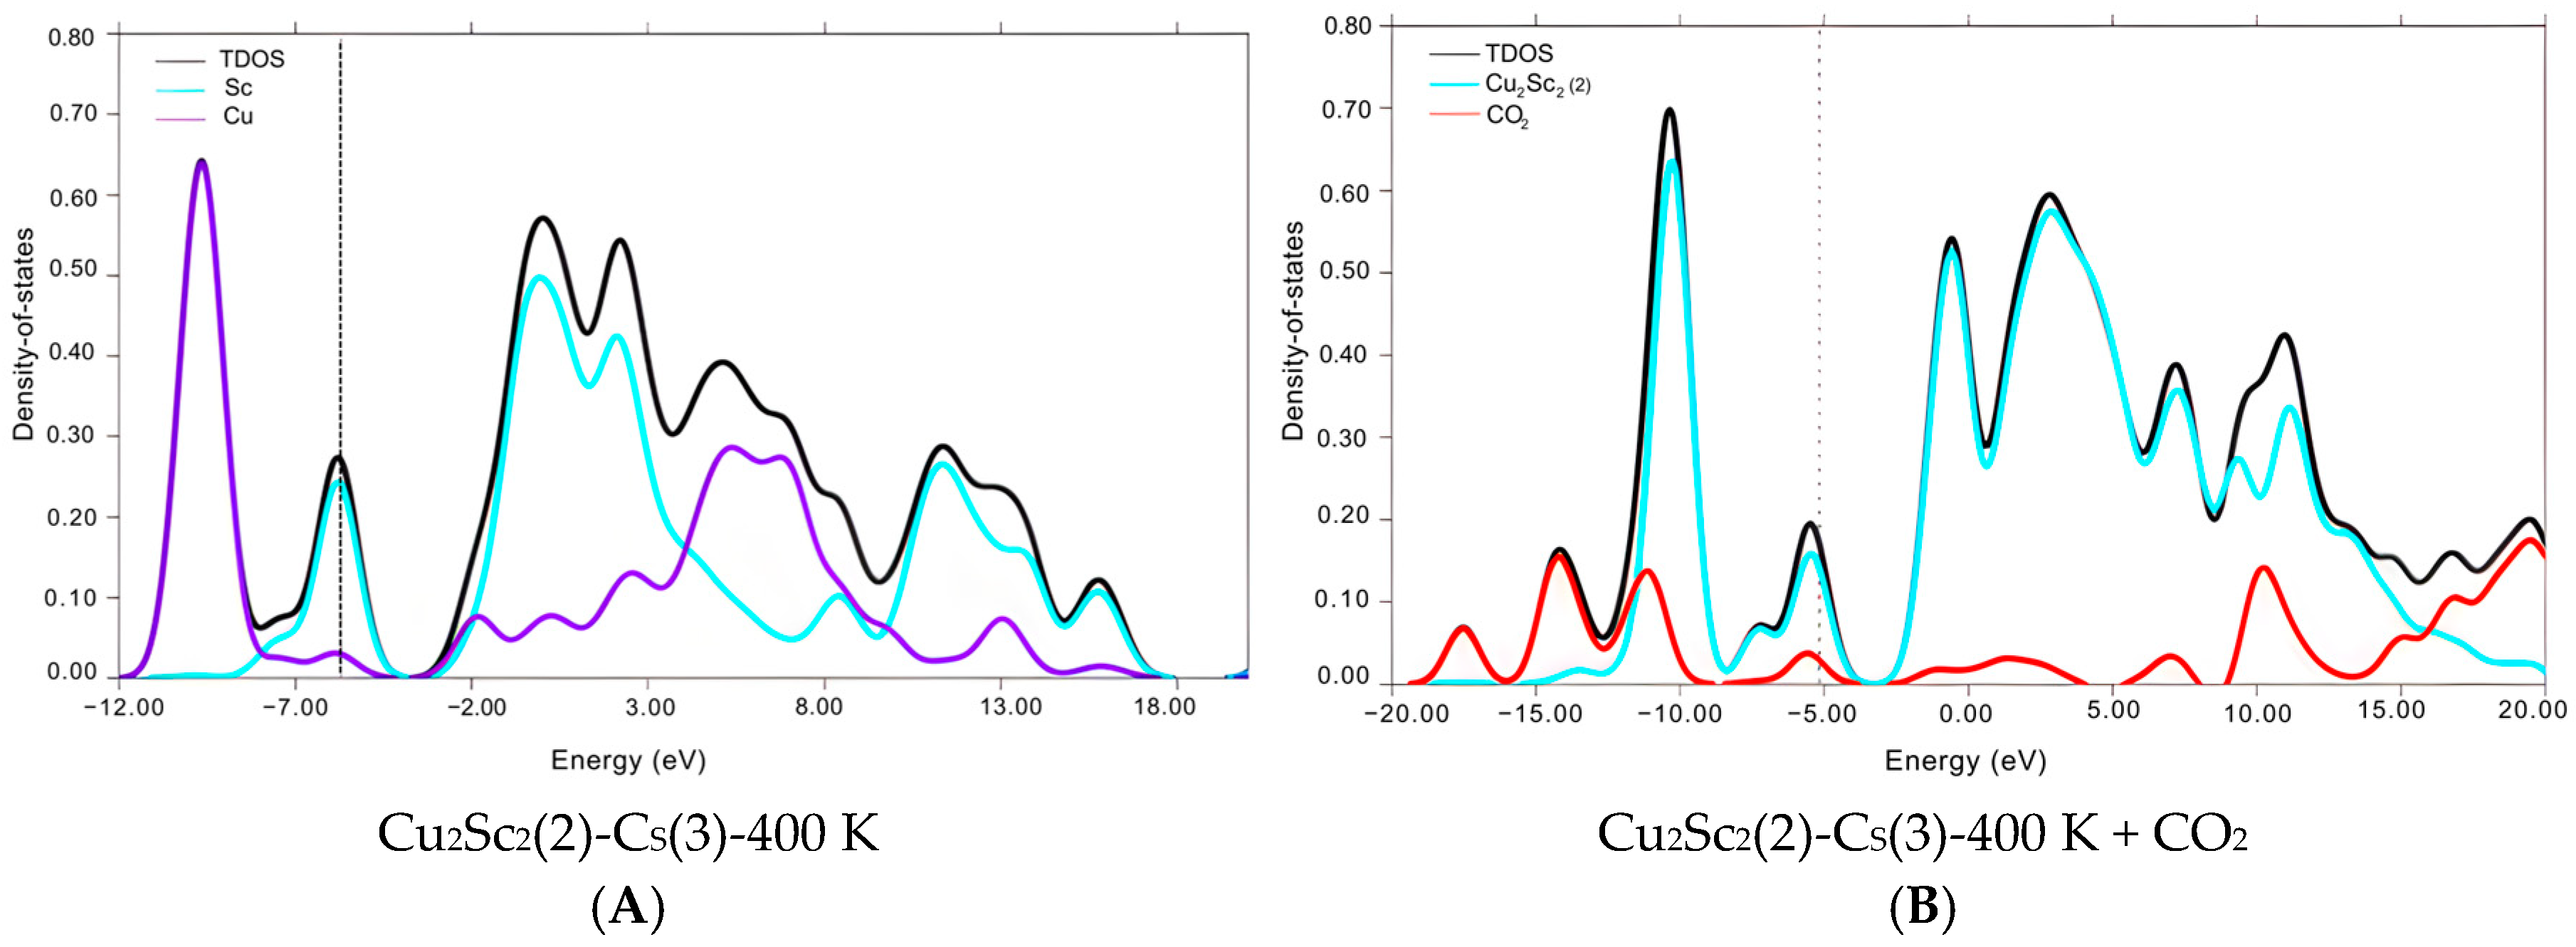
Figure 8A illustrates how the profile of the Cu2Sc2 cluster differs from the Cu2Sc2 case in Figure 6, demonstrating that even a subtle structural rearrangement within the same composition drastically changes the landscape of available boundary states. In Figure 8B, CO2 adsorbed on this isomer shows more prominent contributions in the near-Fermi window and a clearer energetic match with the cluster’s TDOS, with broader features in that region. Chemically, this indicates that this isomer offers a more favorable “alignment” for the metal–adsorbate mixture, generating hybrid states that support effective charge transfer and robust stabilization of the activated CO2 [51]. This is a direct example of why the cluster’s electronic geometry, not just its elemental composition, controls the transition from a weak interaction to effective activation [21].
In the evaluated systems, the bare cluster shows a recurring pattern with a Cu d-band around −11 to −10 eV and a low-density valley near the Fermi level, located around −5 eV. After adsorption, CO2 introduces deep bands associated with the O 2p orbitals. Still, the decisive factor in explaining the exergonic effect is the appearance of a CO2 signal near the Fermi level and its overlap with the cluster’s metallic states. In Cu3Sc–C2v at 298 K, CO2 contributions between −8 and 3 eV are observed, overlapping with Cu d-states and Sc-associated states, with a broadening of the TDOS and an increase in density near the Fermi, consistent with the most favorable cases. In Cu2Sc2–Cs, signals appear in the −4 to 6 eV range where CO2 coincides with conduction states with Cu d and Sc 3d/4p contributions, reflecting a metal-mixture complex and a narrowing of the valley around the Fermi window. In general, the greater the overlap in the −8 to 6 eV range and the filling of the Fermi window, the more negative the signal tends to be, so these features function as transferable electronic fingerprints of exergonic adsorption [21,52]. Conversely, unfavorable cases are associated with CO2 contributions confined to the deep valence and the absence of a strong signal in the Fermi window, indicating weak hybridization and a DOS that does not reorganize in the active region for charge transfer [49].
The detailed elucidation of PDOS and TDOS profiles presented in this work is a fundamental pillar of sustainable catalysis and green chemistry [28]. This computational approach allows us to go beyond mere observation, providing a deep understanding of the electronic mechanisms governing CO2 activation. The correlation among the availability of boundary states (particularly metal d-states), metal–adsorbate overlap, and adsorption exergonicity provides clear guidance for designing novel nanoclusters. This knowledge enables engineers and chemists to synthesize materials with electronic properties tailored for efficient CO2 activation, thereby avoiding catalysts that lead to insufficient activation or undesirable dissociation [53]. For example, in studies of Cu-Zn bimetallic catalysts for the electrochemical reduction of CO2, the position of the d-band center, derived from PDOS analysis, has been directly correlated with experimentally observed binding energy and catalytic activity, thereby explaining the absence of C2+ products in tests [21]. Similarly, the computationally predicted C-O bond elongation of CO2 and changes in residual charge, reflecting stronger activation in Sc and Ti nanoclusters, have been experimentally validated as indicating greater CO2 activation [27]. The ability to adjust adsorption strength and the tunability of the d-states, as demonstrated by these analyses, have been experimentally linked to increased catalyst activity [54]. By providing a robust methodology for correlating electronic properties with adsorption performance, this work lays the foundation for high-throughput screening of a wide range of nanocluster compositions and structures [55]. This acceleration in materials discovery is crucial for rapidly scaling up economically and environmentally viable CO2 conversion technologies to industrial scale, contributing to carbon circularity and the decarbonization of the chemical industry. These electronic descriptors, by reducing the time and resources required to find optimal catalysts, not only drive innovation but also ensure that new materials are more efficient and durable in real-world applications [46].

3.5. Spatial Evidence from Boundary Orbitals and Electrostatic Polarization

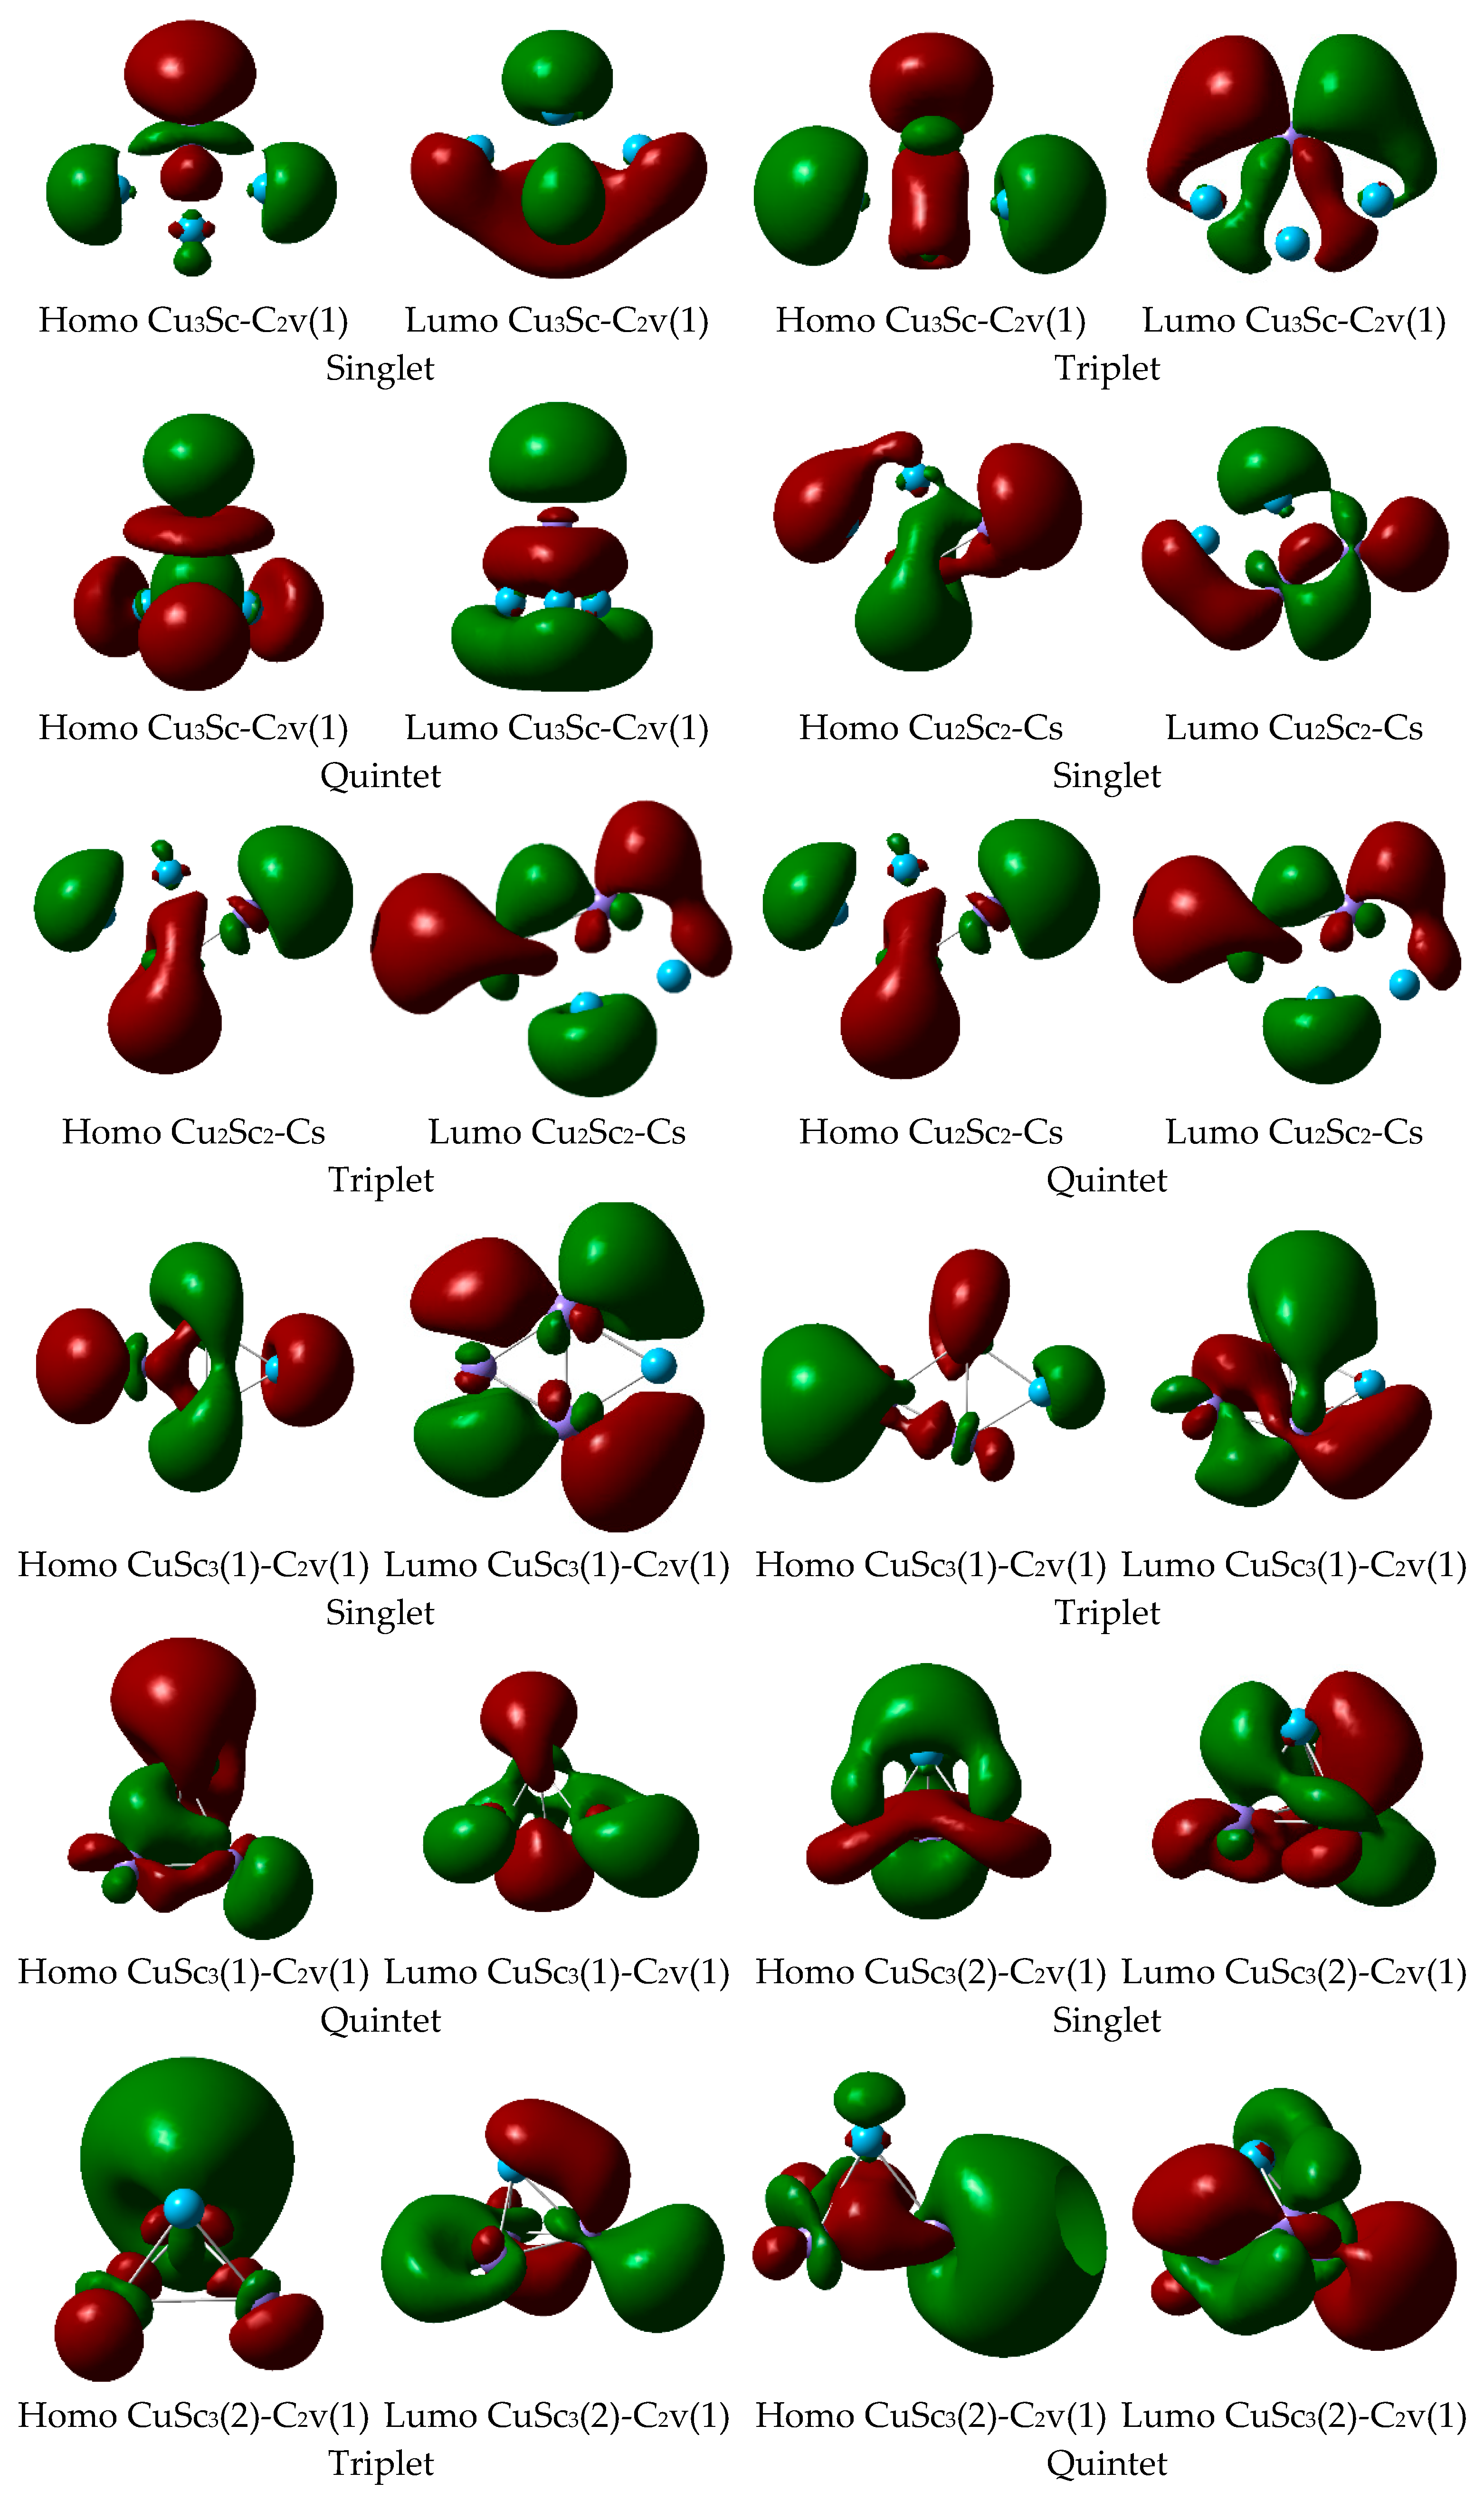
To complement the spectral evidence of PDOS and TDOS with a spatial reading, frontier orbitals are analyzed. This comparison identifies which centers act as dominant donors and acceptors, and whether orbital localization favors coupling with the adsorbate. In particular, Figure 9 brings together HOMO and LUMO for Cu3Sc–C2v, Cu2Sc2–Cs, and CuSc3–C2v in different spin states, so that the effect of composition and spin interactions on the electronic directionality that determines CO2 activation can be simultaneously evaluated.
Figure 9 confirms that interfacial reactivity is governed by donor-acceptor separation within the nanocluster, which is modulated by composition and multiplicity. In Cu3Sc–C2v(1), the HOMO is primarily located in Cu domains, while the LUMO extends toward the cluster center, consistent with Cu as the density source and a distributed acceptor channel capable of coupling with CO2. As the singlet, triplet, and quintet transitions, the surfaces change in extent and orientation, indicating that spin reconfigures the spatial accessibility of the frontier orbitals and, therefore, the probability of effective overlap with the adsorbate. In Cu2Sc2–Cs, a more pronounced polarization is observed, with HOMOs at the metal ends and LUMOs toward the central region, suggesting a more directional internal charge redistribution and greater sensitivity to the coordination mode. In Sc-rich clusters, such as CuSc3–C2v, the LUMO is preferentially located in Sc centers, reinforcing its electrophilic role and supporting a cooperative scheme where Cu acts as a donor and Sc as an acceptor during activation; furthermore, differences between CuSc3 (1) and CuSc3 (2) isomers show that subtle structural changes relocate the boundary lobes and alter the orbital coupling available to CO2.
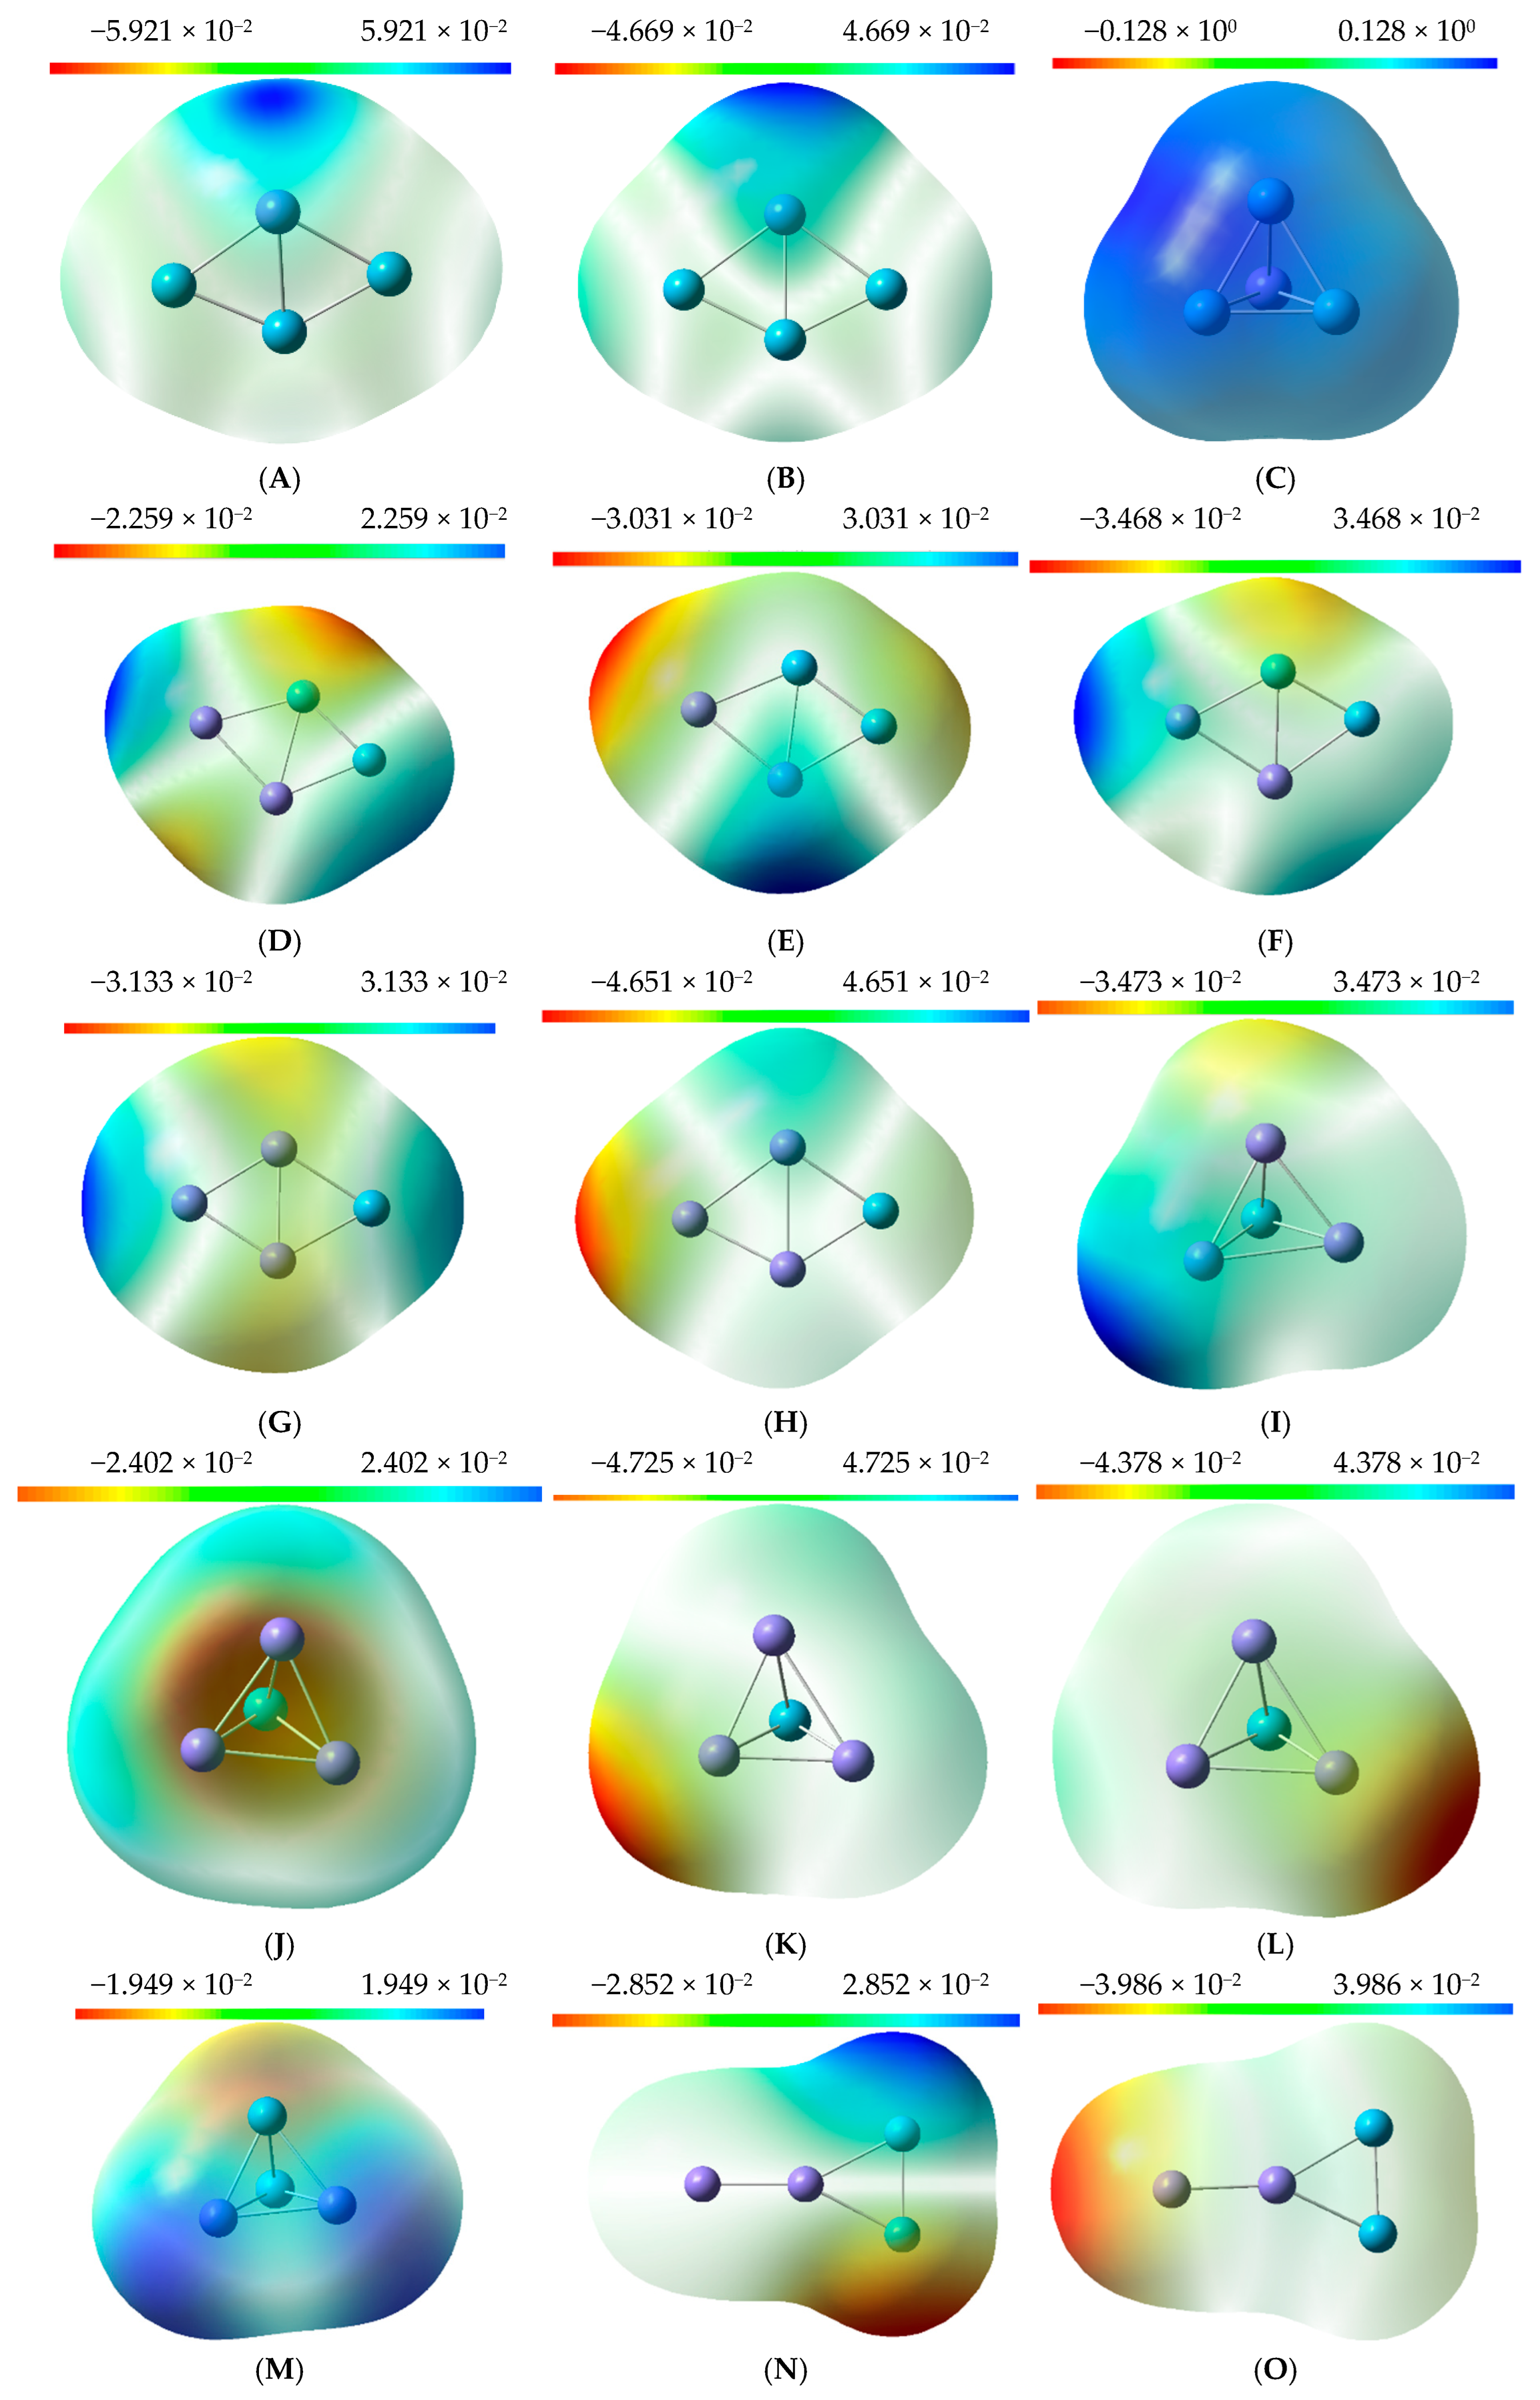
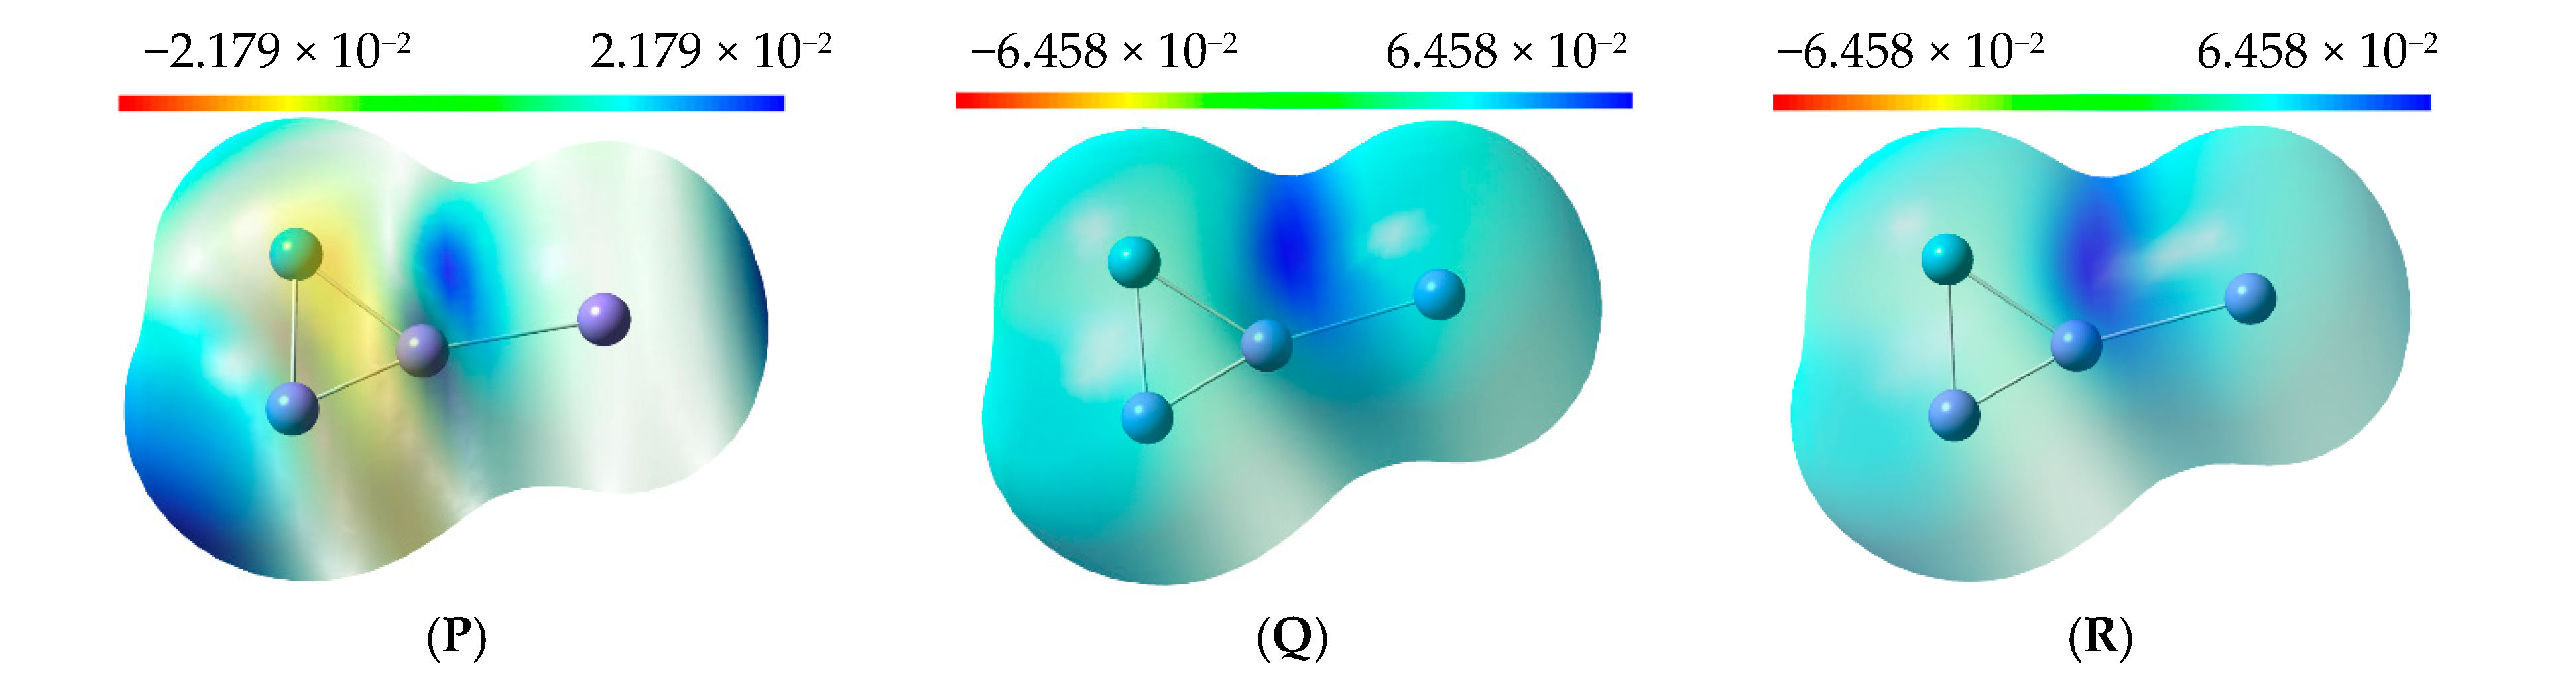
Electrostatic potential provides a spatial measure of polarization and electronic heterogeneity that conditions the approximation and orientation of CO2. This reading explains why certain compositions and multiplicities facilitate activated states, while others disadvantage them (Figure 10).
The maps show that the environment associated with Sc tends to exhibit more electrophilic regions, while Cu-rich areas exhibit more negative potentials, and that anisotropy increases with multiplicity across various systems. It is noteworthy that higher-spin states can enhance charge separation and generate dipolar or multipolar domains, which favor the stabilization of polarized species and, in some cases, highly activated states. Together with PDOS and TDOS, these maps support the idea that adsorption stability is not explained solely by total energy, but by the cluster’s ability to organize an electronic landscape compatible with metal–adsorbate overlap and hybridization in the window near the Fermi level.

3.6. NBO Characterization and Frontier-Orbital Analysis of Representative CuxScy–CO2 Adducts

The study of natural bond orbitals provided further insight into charge redistribution and donor-acceptor stabilization in the representative CuxScy–CO2 adducts. The NPA charges reveal two distinct electronic systems. In Cu3Sc–C2v(1)-S (298 K), the adsorbed CO2 is highly polarized, although generally not significantly reduced. It features a carbon center with high electrophilicity (qC = +1.0999), non-equivalent oxygens (qO1 = −0.6226 and qO2 = −0.4255), and a nearly neutral net charge on the CO2 moiety (ΣqCO2 ≈ +0.052 e). In contrast, the three singlet adducts detected at 400 K exhibit a significantly higher net charge transfer to the adsorbate, with ΣqCO2 values ranging from −1.09 to −1.11 e (Table 2). This demonstrates a much more intense increase and decrease in the coupled CO2 fragment. In all systems, Sc remains positively charged, and Cu exhibits a weakly negative charge or is slightly depleted. This supports a cooperative Cu-donor/Sc-acceptor description rather than a purely monometallic adsorption model.
Second-order perturbation analysis using NBO theory reveals that the system’s stabilization depends directly on the type of adsorption. In the case of Cu3Sc–C2v(1)-S, the main stabilizing factors are related to the transfer of electrons from the CO2 oxygen atoms to the scandium atom, followed by a marked polarization of the CO2 molecule. This is consistent with adsorption driven by asymmetric oxygen coordination and internal charge redistribution in the adsorbate.
For Cu2Sc2–Cs-S, stabilization occurs via an electronic delocalization channel that is strongly concentrated in the scandium-rich region. Particularly notable is the strong interaction between the Cu1–Sc7 bonding orbital and the vacancy acceptors at Sc6 (E(2) = 197.61 kcal/mol), which points to stabilization arising from a highly delocalized bimetallic network rather than from a point-donation process. In Cu2Sc2–CS(3)-S, most of the stabilization is distributed along the metal backbone, with an emphasis on the Sc1–Cu2 to Sc1–Cu3/Cu3 acceptor pathways (E(2) = 15.07 and 13.58 kcal/mol). This suggests that the adsorbed CO2 molecule benefits from effective electronic cooperation between the scandium and copper centers. Finally, in Cu3Sc–C2v(2)-S, a more localized coupling pattern is observed, where the Sc4–C5 bonding orbital delocalizes toward the Sc4–O7 antibonding channel (E(2) = 11.08 kcal/mol), which demonstrates the direct involvement of the Sc–C and Sc–O bonds in CO2 activation.
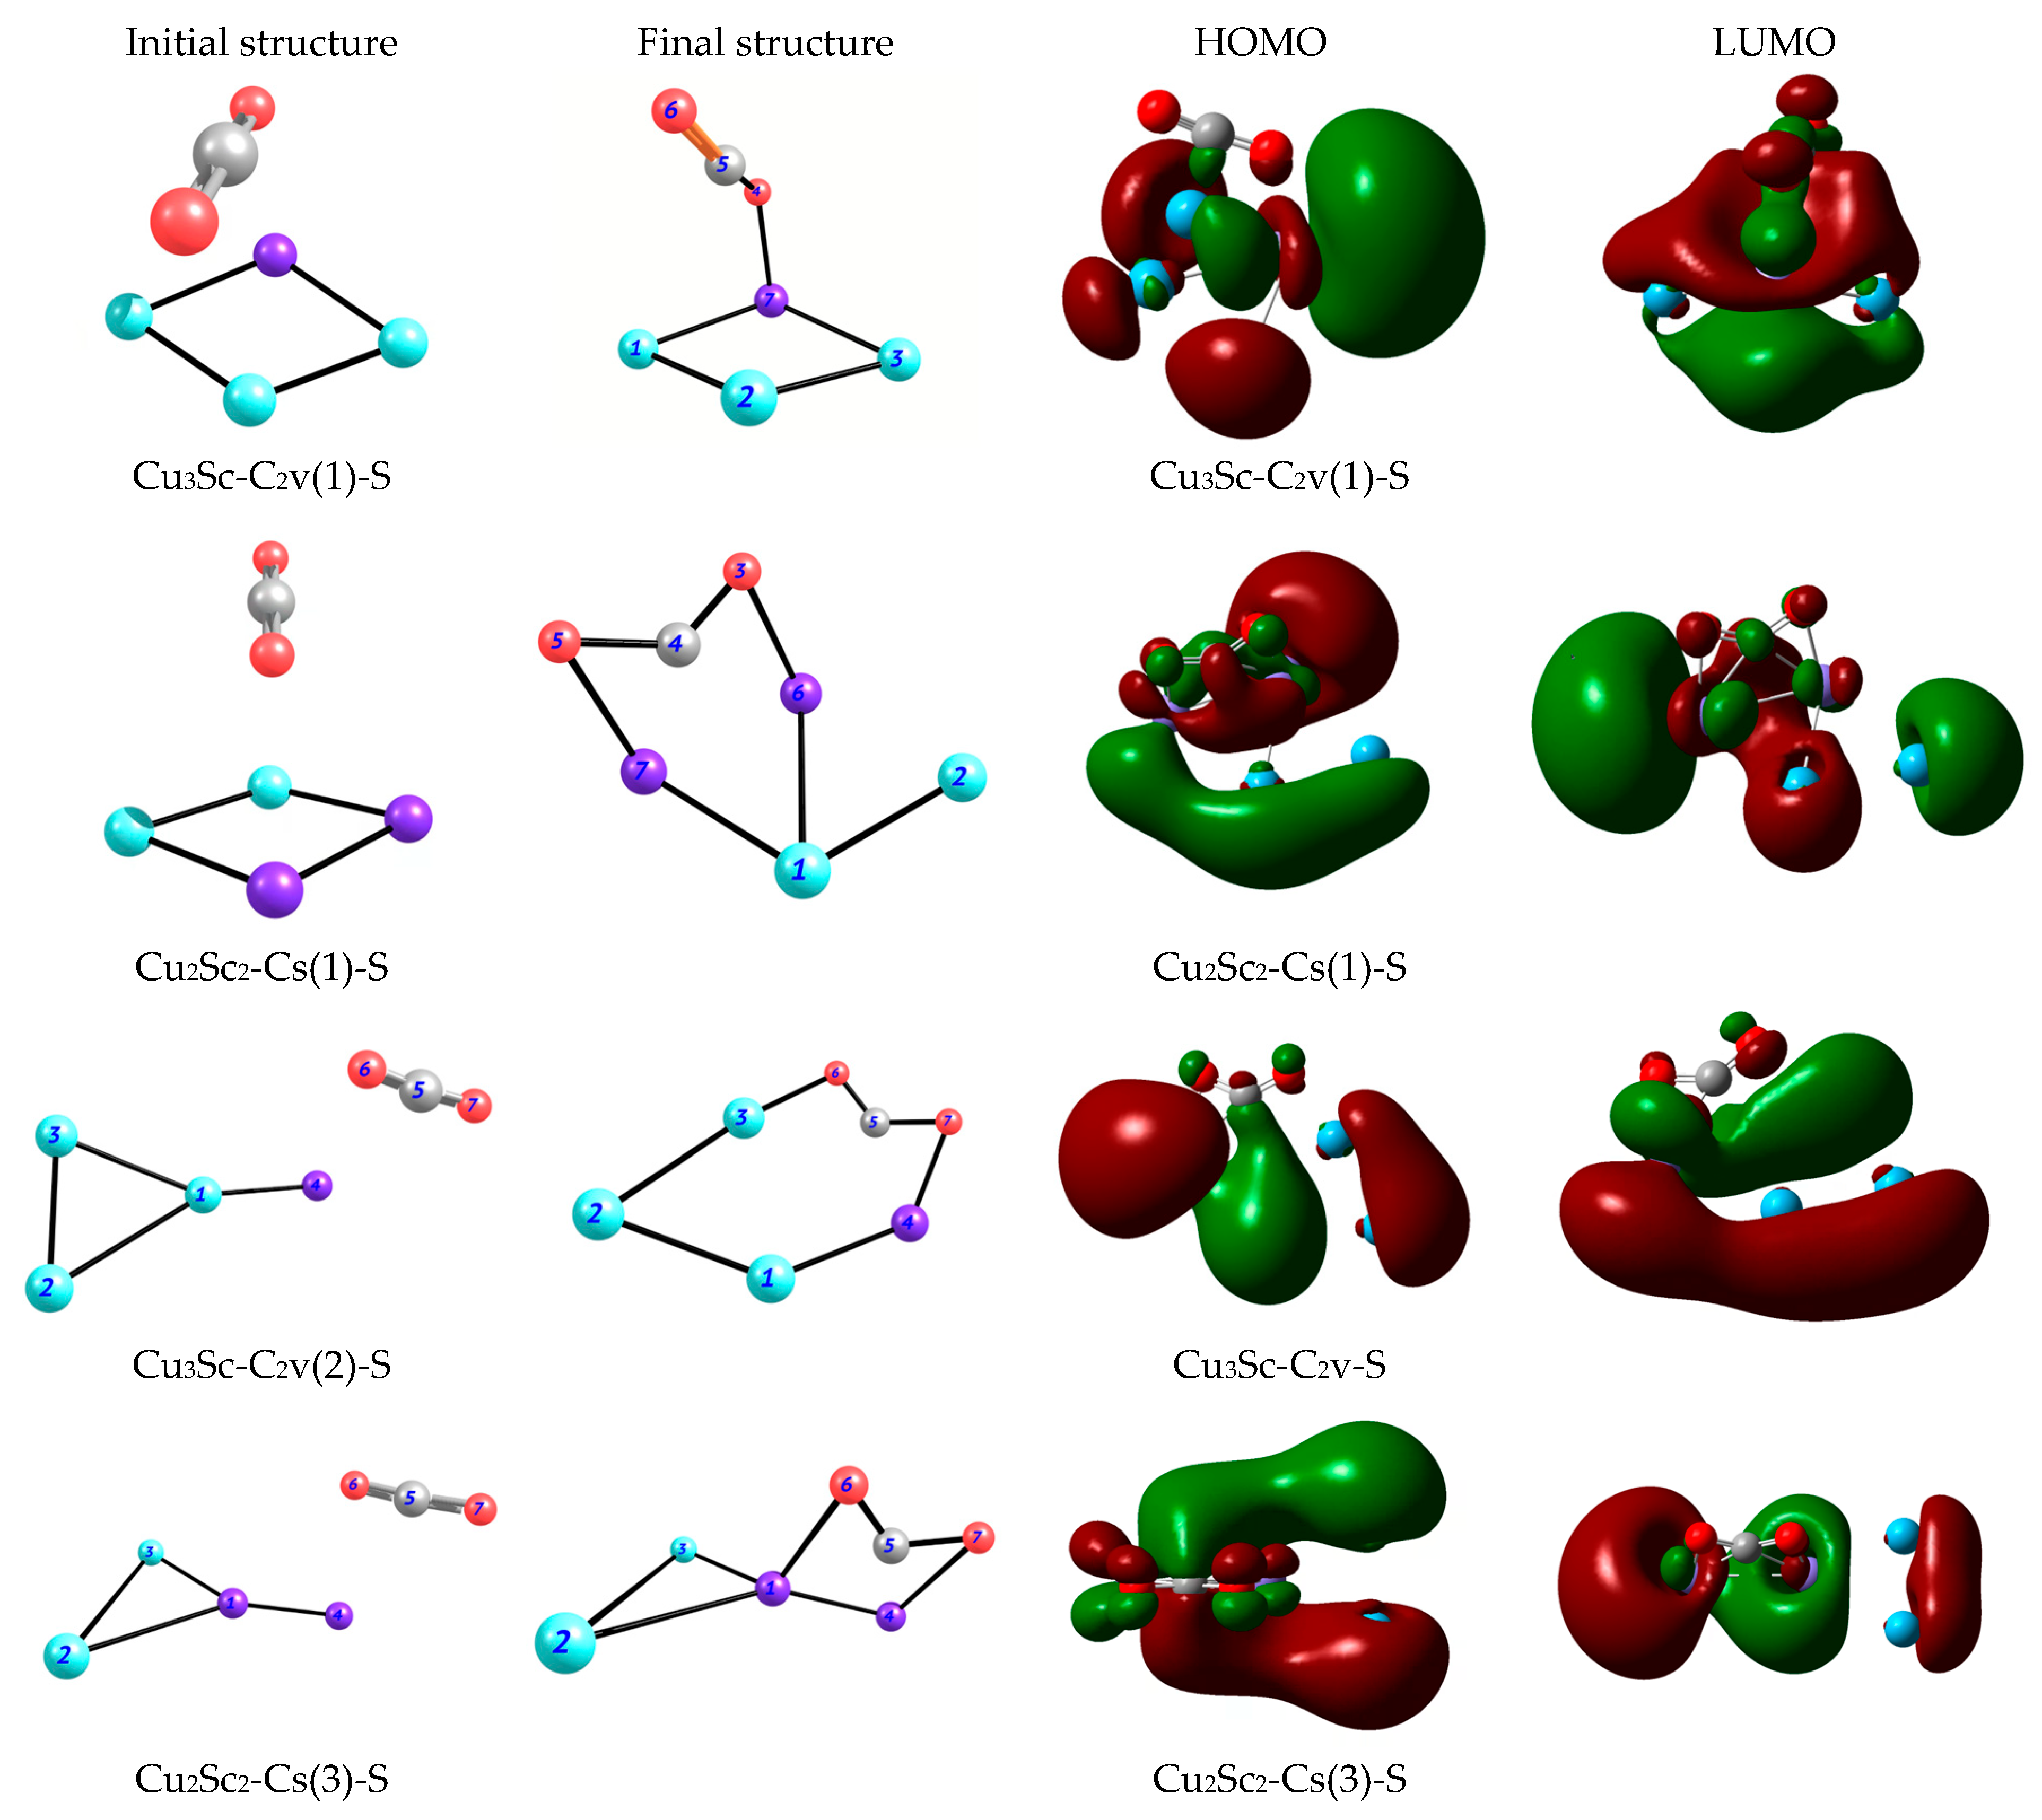
The molecular orbital maps for both the HOMO and the LUMO clearly support this view. In the Cu3Sc–C2v(1)-S complex, the most stable of those studied, the highest-energy electrons (HOMO) are concentrated primarily in the copper-rich region. At the same time, the lowest-energy vacant orbital (LUMO) is oriented toward the area where scandium interacts with CO2. This spatial organization favors electron flow from the copper toward the adsorption region, where scandium plays a crucial role in stabilization by acting as a charge acceptor. In the Cu2Sc2 complexes, the frontier orbitals extend even further over the regions dominated by scandium and over the interface between the metal and the adsorbed molecule. This pattern is consistent with the more intense charge transfer shown by the charge analyses, suggesting greater electronic involvement of the metals in the activation of CO2. On the other hand, in the case of Cu3Sc–C2v(2)-S, the frontier orbitals remain accessible in the area where CO2 binds, but their distribution is more directional and localized. This indicates that the interaction between scandium and CO2 has a more specific character, centered on the Sc–C and Sc–O bonds (Figure 11).

4. Conclusions

This work establishes a consistent mechanistic criterion for interpreting CO2 adsorption in Cu–Sc nanoclusters based on the electronic structure near the Fermi level, thereby avoiding conclusions drawn solely from global energies. The geometric comparison between R1 and R4 showed that not all optimized minima describe the same physical phenomenon, since R1 to R3 preserve CO2 as an activated molecular entity, while R4 can evolve into non-molecular configurations with a dissociative or reactive character. Therefore, this structural separation is essential for thermodynamic and electronic signatures to represent reversible adsorption rather than the chemical transformation of the adsorbate. Statistical analysis also confirmed that the dominant control of Eads comes from the coordination mode and spin state. At the same time, temperatures between 298 and 400 K do not significantly alter the overall stability order, indicating that the observed variability should be attributed mainly to electronic reorganization induced by coordination and spin distribution, rather than to thermal effects. The PDOS and TDOS readings provided a direct link between stability and mechanism, showing that bare clusters have a Cu d band centered around −11 to −10 eV and a low-density valley near −5 eV. At the same time, exergonic complexes are distinguished by introducing CO2 contributions in the −8 to 6 eV window and, especially, by the energetic overlap of these signals with Cu metallic states and accessible Sc states, accompanied by filling and broadening in the vicinity of the Fermi level; in contrast, unfavorable cases tend to confine the contribution of the adsorbate to the deep valence band and do not reorganize the DOS in the mechanistically active region. Finally, the consistency among the signatures in the DOS, the frontier orbitals, the electrostatic potential, and the charge redistribution supports a transferable design rule, according to which the exergonic adsorption of CO2 can be predicted based on the intensity of the projected CO2 contributions in the energy window from −8 to 6 eV, the degree of collapse of the valley near the Fermi level, and evidence of metal–adsorbate hybridization. In this context, Sc acts as an electrophilic component that enables acceptor channels near the Fermi level; therefore, electronic descriptors near this region are proposed as comparable metrics for the rational screening of compositions and spin states in Cu–Sc families beyond the individual cases analyzed here.

Supplementary Materials

The following supporting information can be downloaded at: https://www.mdpi.com/article/10.3390/suschem7020016/s1.

Author Contributions

Conceptualization, R.O.-T. and J.H.F.; Methodology, K.L.O.P. and J.H.F.; Software, K.L.O.P. and J.H.F.; Validation, K.L.O.P. and J.H.F.; Formal analysis, R.O.-T. and J.H.F.; Investigation, K.L.O.P., R.O.-T. and J.H.F.; Resources, R.O.-T. and J.H.F.; Data curation, J.H.F.; Writing—original draft, K.L.O.P. and J.H.F.; Writing—review and editing, K.L.O.P., R.O.-T. and J.H.F.; Visualization, R.O.-T. and J.H.F.; Supervision, J.H.F.; Project administration, J.H.F.; Funding acquisition, J.H.F. All authors have read and agreed to the published version of the manuscript.

Funding

This research received no external funding.

Data Availability Statement

The original contributions presented in this study are included in the article. Further inquiries can be directed to the corresponding author.

Conflicts of Interest

The authors declare no conflict of interest.

References

  1. González-Arias, J.; Reina, T.R.; Zahedi, S.; Fermoso, F.G. Carbon neutrality and challenges in biogas economy: Bioeconomy case studies. In Elsevier eBooks; Woodhead Publishing: Cambridge, UK, 2025; pp. 163–192. [Google Scholar] [CrossRef] [Scilit]
  2. Matlin, S.A.; Mehta, G.; Cornell, S.E.; Krief, A.; Hopf, H. Chemistry and pathways to net zero for sustainability. RSC Sustain. 2023, 1, 1704–1721. [Google Scholar] [CrossRef] [Scilit]
  3. Marín, M.L. Development of High Temperature MIEC Catalytic Reactors for Energy Conversion and Storage Applications. Ph.D. Thesis, Universitat Politècnica de València, València, Spain, 2024. [Google Scholar] [CrossRef] [Scilit]
  4. Navarro, D.S.C. Conversión de CO2 a metanol mediante hidrogenación catalítica selectiva. 2023. Available online: https://hdl.handle.net/11191/9749 (accessed on 16 March 2026).
  5. Cantat, T.; He, L.-N. Innovative methods in CO2 conversion: A breath of fresh air? Curr. Opin. Green Sustain. Chem. 2017, 3, iii–iv. [Google Scholar] [CrossRef] [Scilit]
  6. Mestres, R. Química Sostenible: Naturaleza, fines y ámbito. Educ. Química 2013, 24, 103–112. [Google Scholar] [CrossRef] [Scilit]
  7. Bordacchini, I. Discerning Between Thermal and Electronic Effects in Plasmon-Enhanced Organic Reactions. Ph.D. Thesis, Universitat Politècnica de Catalunya, Barcelona, Spain, 2020. [Google Scholar] [CrossRef] [Scilit]
  8. Guaregua, N.M.; Viniegra, M.; Vargas, R.; Garza, J. Óxidos nanoestructurados de metales de transición con aplicaciones en catálisis. Mundo Nano Rev. Interdiscip. Nanociencia Nanotecnología 2020, 14, 1e–16e. [Google Scholar] [CrossRef] [Scilit]
  9. Ahmad, W.; Younis, M.N.; Shawabkeh, R.; Ahmed, S. Synthesis of lanthanide series (La, Ce, Pr, Eu & Gd) promoted Ni/γ-Al2O3 catalysts for methanation of CO2 at low temperature under atmospheric pressure. Catal. Commun. 2017, 100, 121–126. [Google Scholar] [CrossRef] [Scilit]
  10. Mayer, I.; Bakó, I.; Stirling, A. Are There Atomic Orbitals in a Molecule? J. Phys. Chem. A 2011, 115, 12733–12737. [Google Scholar] [CrossRef] [Scilit]
  11. Chen, S.; Ma, C.; Xu, J.; Du, X.; Liu, Y.; Sham, T.-K.; Zhang, H.; Peng, Y.; Huang, Y.; Wågberg, T.; et al. Subnanometric PT–W bimetallic clusters for efficient alkaline hydrogen evolution electrocatalysis. ACS Nano 2024, 18, 33696–33705. [Google Scholar] [CrossRef] [Scilit]
  12. Fabila, J.; Romero, D.; Paz-Borbón, O.; Buendía, F. Role of bimetallic Au–Ir subnanometer clusters mediating O2 adsorption and dissociation on anatase TiO2 (101). J. Chem. Phys. 2022, 157, 084309. [Google Scholar] [CrossRef] [Scilit] [PubMed]
  13. Iglesias-Juez, A.; Chiarello, G.L.; Patience, G.S.; Guerrero-Pérez, M.O. Experimental methods in chemical engineering: X -ray absorption spectroscopy—XAS, XANES, EXAFS. Can. J. Chem. Eng. 2021, 100, 3–22. [Google Scholar] [CrossRef] [Scilit]
  14. Zhang, W.; Zhu, N.; Ding, L.; Hu, Y.; Wu, Z. Efficacious CO2 adsorption and activation on AG Nanoparticles/CUO mesoporous nanosheets heterostructure for CO2 electroreduction to CO. Inorg. Chem. 2021, 60, 19356–19364. [Google Scholar] [CrossRef] [Scilit]
  15. Gerçeker, D.; Önal, I. A DFT study on CO oxidation on Pd4 and Rh4 clusters and adsorbed Pd and Rh atoms on CeO2 and Ce0.75Zr0.25O2 supports for TWC applications. Appl. Surf. Sci. 2013, 285, 927–936. [Google Scholar] [CrossRef] [Scilit]
  16. Leonzio, G.; Chachuat, B.; Shah, N. Towards ethylene production from carbon dioxide: Economic and global warming potential assessment. Sustain. Prod. Consum. 2023, 43, 124–139. [Google Scholar] [CrossRef] [Scilit]
  17. Katari, M.; Carmichael, D.; Jacquemin, D.; Frison, G. Structure of Electronically Reduced N-Donor Bidentate Ligands and Their Heteroleptic Four-Coordinate Zinc Complexes: A Survey of Density Functional Theory Results. Inorg. Chem. 2019, 58, 7169–7179. [Google Scholar] [CrossRef] [Scilit] [PubMed]
  18. Montejo-Alvaro, F.; González-Quijano, D.; Valmont-Pineda, J.A.; Rojas-Chávez, H.; Juárez-García, J.M.; Medina, D.I.; Cruz-Martínez, H. CO2 Adsorption on PtCu Sub-Nanoclusters Deposited on Pyridinic N-Doped Graphene: A DFT Investigation. Materials 2021, 14, 7619. [Google Scholar] [CrossRef] [Scilit]
  19. Hernández-Oramas, M.; Navarro-Ibarra, D.C.; Franco-Luján, V.A.; Román-Doval, R.; Toledo-Toledo, F.; Ojeda-López, R.; Montejo-Alvaro, F. Transition-Metal Ni6−xCux (x = 0 − 6)/Hexagonal Boron Nitride Composite for CO Detection: A DFT Study. J. Compos. Sci. 2025, 9, 510. [Google Scholar] [CrossRef] [Scilit]
  20. Khatun, M.; Majumdar, R.S.; Anoop, A. A Global Optimizer for Nanoclusters. Front. Chem. 2019, 7, 644. [Google Scholar] [CrossRef] [Scilit]
  21. Chattaraj, D.; Majumder, C. CO2 hydrogenation to formic acid on Pd–Cu nanoclusters: A DFT study. Phys. Chem. Chem. Phys. 2023, 25, 2584–2594. [Google Scholar] [CrossRef] [Scilit]
  22. Kolomnikov, I.S.; Lysyak, T.V. Carbon dioxide in coordination chemistry and catalysis. Russ. Chem. Rev. 1990, 59, 344–360. [Google Scholar] [CrossRef] [Scilit]
  23. Freund, H.-J.; Roberts, M.W. Surface chemistry of carbon dioxide. Surf. Sci. Rep. 1996, 25, 225–273. [Google Scholar] [CrossRef] [Scilit]
  24. Shabeeb, M.; Panda, S.B.; Maity, S. Computational investigation on adsorption facilitated activation of CO2 on FE 2–7 clusters. J. Phys. Chem. A 2025, 129, 10134–10143. [Google Scholar] [CrossRef] [Scilit]
  25. Etim, U.J.; Zhang, C.; Zhong, Z. Impacts of the catalyst structures on CO2 activation on catalyst surfaces. Nanomaterials 2021, 11, 3265. [Google Scholar] [CrossRef] [Scilit] [PubMed]
  26. Lushchikova, O.V.; Szalay, M.; Höltzl, T.; Bakker, J.M. Tuning the degree of CO2 activation by carbon doping Cun− (n = 3–10) clusters: An IR spectroscopic study. Faraday Discuss. 2022, 242, 252–268. [Google Scholar] [CrossRef] [Scilit] [PubMed]
  27. Szalay, M.; Buzsáki, D.; Barabás, J.; Faragó, E.; Janssens, E.; Nyulászi, L.; Höltzl, T. Screening of transition metal doped copper clusters for CO2 activation. Phys. Chem. Chem. Phys. 2021, 23, 21738–21747. [Google Scholar] [CrossRef] [Scilit]
  28. Husile, A.; Wang, Z.; Guan, J. Bimetallic effects in carbon dioxide electroreduction. Chem. Sci. 2025, 16, 5413–5446. [Google Scholar] [CrossRef] [Scilit]
  29. Akhtar, M.S.; Zaman, W. Advancing Sustainable Catalysis: Catalytic solutions for green chemistry and the energy Transition. Catalysts 2025, 15, 511. [Google Scholar] [CrossRef] [Scilit]
  30. Soyemi, A.; Szilvási, T. Trends in computational molecular catalyst design. Dalton Trans. 2021, 50, 10325–10339. [Google Scholar] [CrossRef] [Scilit] [PubMed]
  31. Liu, F.; Gao, P.; Wu, C.; Yang, S.; Ding, X. DFT-based machine learning for ensemble effect of PD@AU electrocatalysts on CO2 reduction reaction. ChemPhysChem 2023, 24, e202200642. [Google Scholar] [CrossRef] [Scilit]
  32. Nabi, A.G.; Rehman, A.U.; Hussain, A.; Di Tommaso, D. Ab Initio Random Structure Searching and Catalytic Properties of Copper-Based Nanocluster with Earth-Abundant Metals for the Electrocatalytic CO2-to-Co Conversion. Mol. Catal. 2022, 527, 112406. [Google Scholar] [CrossRef] [Scilit]
  33. Hostaš, J.; Pérez-Becerra, K.O.; Calaminici, P.; Barrios-Herrera, L.; Lourenço, M.P.; Tchagang, A.; Salahub, D.R.; Köster, A.M. How important is the amount of exact exchange for spin-state energy ordering in DFT? Case study of molybdenum carbide cluster, Mo4C2. J. Chem. Phys. 2023, 159, 184301. [Google Scholar] [CrossRef] [Scilit]
  34. Vahl, A.; Lupan, O.; Santos-Carballal, D.; Postica, V.; Hansen, S.; Cavers, H.; Wolff, N.; Terasa, M.-I.; Hoppe, M.; Cadi-Essadek, A.; et al. Surface functionalization of ZnO: Ag columnar thin films with AgAu and AgPt bimetallic alloy nanoparticles as an efficient pathway for highly sensitive gas discrimination and early hazard detection in batteries. J. Mater. Chem. A 2020, 8, 16246. [Google Scholar] [CrossRef] [Scilit]
  35. Singh, S.K.; Shirhatti, P.R. The curious case of CO2 dissociation on Cu(110). J. Chem. Phys. 2024, 160, 024702. [Google Scholar] [CrossRef] [Scilit]
  36. Pangh, A. Catalytic cleavage of CO2 on bimetallic Ni4M (M = Ni, Mo, Sc, and Y) nanoclusters: A DFT study. Catal. Commun. 2020, 149, 106245. [Google Scholar] [CrossRef] [Scilit]
  37. Zhu, Y.; Zheng, J.; Ye, J.; Cui, Y.; Koh, K.; Kovarik, L.; Camaioni, D.M.; Fulton, J.L.; Truhlar, D.G.; Neurock, M.; et al. Copper-zirconia interfaces in UiO-66 enable selective catalytic hydrogenation of CO2 to methanol. Nat. Commun. 2020, 11, 5849. [Google Scholar] [CrossRef] [Scilit]
  38. Zheng, M.; Zhou, X.; Wang, Y.; Chen, G.; Li, M. The facet Dependence of CO2 electroreduction selectivity on a PD3AU bimetallic catalyst: A DFT study. Molecules 2023, 28, 3169. [Google Scholar] [CrossRef] [Scilit]
  39. Tufa, R.A.; Chanda, D.; Ma, M.; Aili, D.; Demissie, T.B.; Vaes, J.; Li, Q.; Liu, S.; Pant, D. Towards highly efficient electrochemical CO2 reduction: Cell designs, membranes and electrocatalysts. Appl. Energy 2020, 277, 115557. [Google Scholar] [CrossRef] [Scilit]
  40. Cheng, Y.; Chen, J.; Yang, C.; Wang, H.; Johannessen, B.; Thomsen, L.; Saunders, M.; Xiao, J.; Yang, S.; Jiang, S.P. Activation of transition metal (FE, Co, and NI)-Oxide nanoclusters by nitrogen defects in carbon nanotube for selective CO2 reduction reaction. Energy Environ. Mater. 2021, 6, e12278. [Google Scholar] [CrossRef] [Scilit]
  41. Kunkel, C.; Viñes, F.; Illas, F. Transition metal carbides as novel materials for CO2 capture, storage, and activation. Energy Environ. Sci. 2015, 9, 141–144. [Google Scholar] [CrossRef] [Scilit]
  42. Aristizábal-Alzate, C.E.; Castillejos-López, E.; Dongil, A.B.; Romero-Sáez, M. Integration of design of experiments, Analysis of variance and response surface methodology in assessing heterogeneous catalysts Processes: A minireview. ChemistryOpen 2024, 14, e202400148. [Google Scholar] [CrossRef] [Scilit]
  43. Koverga, A.A.; Flórez, E.; Dorkis, L.; Rodriguez, J.A. Promoting effect of tungsten carbide on the catalytic activity of Cu for CO2reduction. Phys. Chem. Chem. Phys. 2020, 22, 13666–13679. [Google Scholar] [CrossRef] [Scilit]
  44. Noh, G.; Lam, E.; Bregante, D.T.; Meyet, J.; Šot, P.; Flaherty, D.W.; Copéret, C. Lewis acid strength of interfacial metal sites drives CH3OH selectivity and formation rates on CU-Based CO2 hydrogenation catalysts. Angew. Chem. Int. Ed. 2021, 60, 9650–9659. [Google Scholar] [CrossRef] [Scilit]
  45. Huang, J.; Zhang, X.; Yang, J.; Yu, J.; Chen, Q.; Peng, L. Recent progress on Copper-Based bimetallic heterojunction catalysts for CO2 electrocatalysis: Unlocking the mystery of product selectivity. Adv. Sci. 2024, 11, e2309865. [Google Scholar] [CrossRef] [Scilit]
  46. Quesne, M.G.; Silveri, F.; De Leeuw, N.H.; Catlow, C.R.A. Advances in Sustainable Catalysis: A Computational Perspective. Front. Chem. 2019, 7, 182. [Google Scholar] [CrossRef] [Scilit] [PubMed]
  47. Ma, M.; Li, F.; Tang, Q. Coordination environment engineering on nickel single-atom catalysts for CO2 electroreduction. Nanoscale 2021, 13, 19133–19143. [Google Scholar] [CrossRef] [Scilit]
  48. Brimley, P.; Almajed, H.; Alsunni, Y.; Alherz, A.W.; Bare, Z.J.L.; Smith, W.A.; Musgrave, C.B. Electrochemical CO2 Reduction over Metal-/Nitrogen-Doped Graphene Single-Atom Catalysts Modeled Using the Grand-Canonical Density Functional Theory. ACS Catal. 2022, 12, 10161–10171. [Google Scholar] [CrossRef] [Scilit]
  49. Xue, Q.; Qi, X.; Yang, T.; Jiang, J.; Zhou, Q.; Fu, C.; Yang, N. DFT study on the CO2 reduction to C2 chemicals catalyzed by FE and Co clusters supported on N-Doped carbon. Nanomaterials 2022, 12, 2239. [Google Scholar] [CrossRef] [Scilit] [PubMed]
  50. Jafarzadeh, A.; Bal, K.M.; Bogaerts, A.; Neyts, E.C. Activation of CO2 on Copper Surfaces: The Synergy Between Electric Field, Surface Morphology and Excess Electrons. J. Phys. Chem. C 2020, 124, 6747–6755. [Google Scholar] [CrossRef] [Scilit]
  51. Alotaibi, T.; Alotaibi, M.; Alhawiti, F.; Aldosari, N.; Alsunaid, M.; Aldawas, L.; Qahtan, T.F.; Ismael, A.K. Tuning the electronic properties of CUMAGN bimetallic clusters for enhanced CO2 activation. Int. J. Mol. Sci. 2024, 25, 12053. [Google Scholar] [CrossRef] [Scilit]
  52. Mikolaj, P.; Yusti, B.Z.; Nyulászi, L.; Bakker, J.M.; Höltzl, T.; Lang, S.M. CO2 activation by copper oxide clusters: Size, composition, and charge state dependence. Phys. Chem. Chem. Phys. 2024, 26, 24126–24134. [Google Scholar] [CrossRef] [Scilit]
  53. Muthuperiyanayagam, A.; Nabi, A.G.; Zhao, Q.; Di Tommaso, D. Adsorption, activation, and conversion of carbon dioxide on small copper–tin nanoclusters. Phys. Chem. Chem. Phys. 2023, 25, 13429–13441. [Google Scholar] [CrossRef] [Scilit]
  54. Kattel, S.; Yu, W.; Yang, X.; Yan, B.; Huang, Y.; Wan, W.; Liu, P.; Chen, J.G. CO2 Hydrogenation over Oxide-Supported PtCo Catalysts: The Role of the Oxide Support in Determining the Product Selectivity. Angew. Chem. Int. Ed. 2016, 55, 7968–7973. [Google Scholar] [CrossRef] [Scilit] [PubMed]
  55. Chanussot, L.; Das, A.; Goyal, S.; Lavril, T.; Shuaibi, M.; Riviere, M.; Tran, K.; Heras-Domingo, J.; Ho, C.; Hu, W.; et al. Open Catalyst 2020 (OC20) Dataset and community challenges. ACS Catal. 2021, 11, 6059–6072. [Google Scholar] [CrossRef] [Scilit]
Figure 1. Initial geometries used as input structures for CuxScy nanoclusters (x + y = 4) for DFT M06-2X/def2-TZVP calculations at ORCA.
Suschem 07 00016 g001
Figure 2. Simplified scheme of the four CO2 adsorption modes evaluated on the Cu3Sc nanocluster, denoted as R1–R4, representing alternative metal–adsorbate orientations and coordination patterns.
Suschem 07 00016 g002
Figure 3. Thermodynamic summary and electronic verification for the adsorption of CO2 on Cu3Sc–C2v(1) evaluating modes R1 to R4, temperatures 298, 350, and 400 K, and multiplicities 1, 3, and 5. Panel (A) shows the total system energy and Hartree enthalpy for each mode–temperature–multiplicity combination. Panel (B) presents the Gibbs free energy of the complex in Hartree, along with the adsorption energy, Eads, in kcal·mol−1. Panel (C) reports the S2 values as an indicator of spin-state consistency.
Suschem 07 00016 g003
Figure 4. Contour maps of CO2 adsorption energies (Eads, kcalmol−1). (A) Adsorption-energy landscape for Cu3Sc–C2v(1), Cu2Sc2–Cs, and CuSc3 (1)–C2v(1) as a function of spin multiplicity; (B) Adsorption-energy landscape for the additional Cu3Sc configurations, Cu3Sc (2)–C2v(1) and Cu3Sc–Cs(3)(1), as a function of the available spin states.
Suschem 07 00016 g004
Figure 5. TDOS/PDOS panels for Cu3Sc–C2v(1) in singlet at 298 K. (A) Bare cluster, showing TDOS and projected contributions of Cu and Sc. (B) Cu3Sc–C2v(1) + CO2 complex, showing TDOS and projected contributions of the cluster and CO2. The dashed line indicates the Fermi level.
Suschem 07 00016 g005
Figure 6. TDOS/PDOS panels for Cu2Sc2–Cs in singlet at 400 K. (A) Bare cluster with TDOS and projections of Cu and Sc. (B) Cu2Sc2–Cs + CO2 complex with TDOS and projections of the cluster and CO2. The dotted line indicates the Fermi level.
Suschem 07 00016 g006
Figure 7. TDOS/PDOS panels for Cu3Sc–C2v(2) in singlet at 400 K. (A) Bare cluster with TDOS and projections of Cu and Sc. (B) Cu3Sc–C2v(2) + CO2 complex with TDOS and projections of the cluster and CO2. The dotted line indicates the Fermi level.
Suschem 07 00016 g007
Figure 8. TDOS/PDOS panels for Cu2Sc2 (2)–Cs(3) at 400 K. (A) Bare cluster with TDOS and cluster projections. (B) Cu2Sc2 (2)–Cs(3) + CO2 complex with TDOS and projected CO2 contribution. The dotted line indicates the Fermi level.
Suschem 07 00016 g008
Figure 9. HOMO and LUMO boundary orbital maps in Cu3Sc–C2v(1) and Cu2Sc2–Cs at different spin multiplicities.
Suschem 07 00016 g009
Figure 10. Electrostatic potential maps for CuxScy catalysts with x + y equal to 4 in singlet, triplet, and quintet states, according to the deliverable. (A) Cu3Sc–C2v(1), singlet; (B) Cu3Sc–C2v(1), triplet; (C) Cu3Sc–C2v(1), quintet; (D) Cu2Sc2–Cs, singlet; (E) Cu2Sc2–Cs, triplet; (F) Cu2Sc2–Cs, quintet; (G) CuSc3 (1)–C2v(1), singlet; (H) CuSc3 (1)–C2v(1), triplet; (I) CuSc3 (1)–C2v(1), quintet; (J) CuSc3 (2)–C2v(1), singlet; (K) CuSc3 (2)–C2v(1), triplet; (L) CuSc3 (2)–C2v(1), quintet; (M) Cu2Sc2 (2)–Cs(3), singlet; (N) Cu2Sc2 (2)–Cs(3), triplet; (O) Cu2Sc2 (2)–Cs(3), quintet; (P) CuSc3 (1)–Cs(4), singlet; (Q) CuSc3 (1)–Cs(4), triplet; (R) CuSc3 (1)–Cs(4), quintet.
Suschem 07 00016 g010aSuschem 07 00016 g010b
Figure 11. Representative CO2 adsorption modes and frontier orbital patterns in CuxScy nanoclusters.
Suschem 07 00016 g011
Table 1. ANOVA for the effect of multiplicity, temperature, and adsorption mode on CO2 adsorption energies, reporting GL, adjusted SC, adjusted MC, F value, and p value.
SourceGLSC Adjust.MC Adjust.F Valuep Value
Multiplicity24241.72120.87.930.002
Temperature (K)2207.7103.80.390.682
Adsorption modes33865.21288.44.820.008
Error266950.7267.3
Total3315,326.6
Table 2. Main NBO descriptors for representative CuxScy–CO2 singlet adducts.
SystemMain NPA Charges (e)Net Charge on CO2, (∑qCO2) (e)Dominant Second-Order NBO Stabilization
Cu3Sc–C2v(1)-S, 298 KCu: −0.061, −0.023, −0.051; Sc: +0.083; C: +1.100; O: −0.623, −0.426+0.052O-lone-pair donation into vacant Sc acceptor orbitals; additional polarization within the CO2 framework
Cu2Sc2–Cs-S, 400 KCu: +0.162, −0.113; Sc: +0.475, +0.575; C: +0.292; O: −0.692, −0.699−1.099BD(Cu1–Sc7) → LP*(Sc6), E(2) = 197.61 kcal mol−1; secondary Sc-centered acceptor terms of 7–10 kcal mol−1
Cu2Sc2–Cs(3)-S, 400 KSc: +0.264, +0.731; Cu: +0.060, +0.051; C: +0.269; O: −0.671, −0.705−1.106BD(Sc1–Cu2) → BD*(Sc1–Cu3), E(2) = 15.07 kcal mol−1; BD(Sc1–Cu2) → LP*(Cu3), E(2) = 13.58 kcal mol−1
Cu3Sc–C2v(2)-S, 400 KCu: +0.006, −0.101, +0.412; Sc: +0.773; C: +0.374; O: −0.720, −0.744−1.090BD(Sc4–C5) → BD*(Sc4–O7), E(2) = 11.08 kcal mol−1; auxiliary Cu1–Sc4 → Sc4–O7 term, E(2) = 2.86 kcal mol−1
* The asterisk denotes an antibonding or vacant acceptor orbital in the NBO analysis; thus, BD* indicates an antibonding bond orbital and LP* a lone-pair-type acceptor orbital.
Disclaimer/Publisher’s Note: The statements, opinions and data contained in all publications are solely those of the individual author(s) and contributor(s) and not of MDPI and/or the editor(s). MDPI and/or the editor(s) disclaim responsibility for any injury to people or property resulting from any ideas, methods, instructions or products referred to in the content.