Abstract
This study investigates the potential of Pinus pinaster subsp. atlantica bark, a forestry by-product from northern Portugal, as a source of phenolic compounds with strong antioxidant properties. Microwave-assisted extraction (MAE) was used to optimize recovery, assessing the effects of solvent composition (water, ethanol, and 50:50 water–ethanol), extraction time (15 or 30 min), and temperature (90, 110, or 130 °C) using a one-variable-at-a-time approach. High-Performance Liquid Chromatography (HPLC) profiling characterized the polyphenol composition. The results showed that solvent choice strongly influenced extract composition and bioactivity, with hydroethanolic and ethanolic extracts exhibiting the highest antioxidant activities in DPPH, ABTS, and ORAC assays. Optimal conditions—50:50 water–ethanol, 130 °C, 15 min—yielded 11.13% (w/w) extract, 3.10 mg GAE/mL total phenolics, and 2.01 mg CE/mL condensed tannins, comparable to commercial extracts such as Pycnogenol®. MAE proved effective, rapid, and solvent-efficient, enhancing phenolic recovery without degrading extract quality. These findings highlight the potential of P. pinaster bark extracts for biomedical, nutraceutical, and cosmetic applications, supporting the sustainable valorization of forestry residues and aligning with circular economy principles.
1. Introduction
The forest industry is an important productive sector based on renewable natural resources. As a result, considerable amounts of products are discarded each year, mainly from the sawmill and cellulose industries, as processing by-products that include sawdust, wood chips, and barks [1,2,3]. These recycled products have low economic value, even when several bioactive compounds have been identified in bark [2]. Therefore, there exists great potential for the forest industry to convert and utilize more of these by-products, transforming them into high-value products. Maritime pine (Pinus pinaster subsp. atlantica) is a conifer native to Mediterranean countries such as France, Spain, and Portugal and some North African countries [3,4]. Pine is an evergreen, coniferous, resinous, extended living, and mostly monoecious tree [5]. Maritime pine is considered ecologically versatile because it shows diverse growth characteristics, namely frost resistance and adaptation to drought and various substrates. It prefers warm temperate areas with an annual rainfall higher than 600 mm, although it can survive with 400 mm if there is sufficient atmospheric moisture. It dwells well in siliceous soils with coarse textures, especially sandy soils, dunes, and other poor substrates [6,7]. Maritime pine bark is a rich source of polyphenols, such as flavonoids, phenolic acids, stilbenes, and tannins, which include proanthocyanidins, which in turn include procyanidins [6]. Maritime pine bark contains a high content of phenolic compounds known for their antioxidant properties [6]. Using environmentally friendly, renewable, non-toxic solvents to extract bioactive products is desirable [8]. The production of antioxidant extracts from vegetal materials is a research field of increasing importance for utilization in the food and pharmaceutical industries [5,8]. The characteristics of most phenolic substances range from polar to nonpolar by nature, and many extraction factors, mainly the solvent system, challenge their extraction efficiency [9,10,11,12]. It is known that polar solvents, such as ethanol or aqueous mixtures containing ethanol, are frequently used to recover phenolic compounds from plant tissues [13]. The extraction of phenols with different concentrations of aqueous ethanol can fractionate phenolics based on polarity [14]. Aqueous ethanol solutions offer many advantages: hydrophilic and lipophilic active compounds are recovered in different proportions, and synergistic interactions occur inside the medium. However, they also present challenges, particularly complex downstream purification and separation processes [15]. As reported by Alonso-Esteban et al. (2022) [6], higher temperatures showed the best extraction yields, and the contact time had low influence on the yield of phenolic compounds. Hence, the authors concluded that the matrix structure of the pine bark allowed for a faster release of phenolic compounds than other natural matrices, and extended extraction times would not be necessary. Chen, J. et al. (2020) [16] studied microwave-assisted extraction (MAE), particularly using 95% ethanol as a solvent, a temperature of 170 °C, and a 55 min extraction duration, which was shown to be more effective than the conventional extraction method for recovering monomeric catechins and proanthocyanidins from grape seed powder. Therefore, the proanthocyanidin-based product obtained from grape seed by MAE showed a higher antioxidant capacity and glucosidase-inhibitory activities than the conventional method. The MAE of pine bark with dynamic heating up to 90–130 °C, avoiding the isothermal heating step, allowed for the recovery of a 1.7-times-higher concentration of proantocyanidin dimers–tetramers, a 1.3-times-higher concentration of catechin, and a 1.2-times-higher concentration of quinic acid in water extracts in comparison to a longer and more solvent-consuming accelerated solvent extraction performed at the same temperature [17]. This study assessed the extraction processes parameters of pine bark from Pinus Pinaster subsp. atlantica cultivated in the north of Portugal. The evaluation encompassed assessments of extraction efficiency, total phenolic content, condensed tannin content, and antioxidant capacity. The extracts were scrutinized throughout these assessments based on the extraction solvents, including water, ethanol, and a 50% ethanol–water mixture. This study is the first to comprehensively optimize MAE for Pinus pinaster subsp. atlantica from the Minho region of Portugal, using pine bark from a certified experimental plantation—a raw material scarcely investigated to date. It further provides a systematic comparison of three solvent systems (water, ethanol, and hydroethanolic mixtures) under varied temperature–time conditions to assess their individual and interactive effects on extraction efficiency.
2. Materials and Methods
2.1. Raw Material Collection and Sample Preparation
Pine bark (from Pinus pinaster Aiton subsp. atlantica) was collected in the northern region of Portugal (Valença, Viana do Castelo, Portugal) in the spring season from 21-year-old trees. These trees were part of an experimental and certified plantation situated in the forest area of the Minho region. Pine bark samples were collected by making a circular cut in an area of the main trunk of the freshly cut tree, about 1.30 m above the ground. For extract production, whole pine bark samples were previously washed several times with distilled water to remove dirt, lichens, and resin, following subsequent drying at 40 °C for 48 h (moisture content—6.67 ± 0.01%). The resulting solid was then ground and sieved at an amplitude of 0.2 mm for 1 min (Analysette 3 PRO, Fritsch GmbH, Oberstein, Germany) to select particles from 200 to 850 µm in diameter. These samples were stored in sealed bags in a cool, dry, and dark room until further use.
2.2. Reagents
Distilled water and food-grade ethanol 96% purchased from Aga (Prior Velho, Portugal) were employed for the extraction experiments. For extract analyses, the following analytical-grade chemicals and solvents were used: gallic acid monohydrate was purchased from Acros Organics (Geel, Belgium), Folin–Ciocalteu reagent was purchased from PanReac (Darmstadt, Germany), sodium carbonate anhydrous was purchased from Panreac (Barcelona, Spain), and methanol was purchased from Fisher Scientific (Leicestershire, UK). ABTS (2,2′-azino-bis(3-ethylbenzothiazoline-6-sulphonic acid)) was purchased from Sigma Aldrich (St. Louis, MI, USA), DPPH and vanillin (2,2-diphenyl-1-picrylhydrazyl) were purchased from Sigma Aldrich (Steinheim, Germany), and Trolox (6-hydroxy-2,5,7,8-tetramethylchroman-2-carboxylic acid) was purchased from Sigma Aldrich (Buchs, Switzerland). The reagents were of analytical grade.
2.3. Experimental Design
A microwave-assisted extraction device (Milestone ETHOS X microwave extraction system with SK-12 medium-pressure rotor, Milestone Srl, Sorisole, Italy) was used. Microwave irradiation was performed at an initial microwave power of 1600 W and an extraction temperature of 90, 110, or 130 °C for 15 or 30 min (Table 1). The system operated in a temperature-controlled mode, in which 1600 W corresponds to the maximum available power. The actual power was automatically modulated to reach and maintain the target temperature, followed by a plateau phase during which the power output continued to vary as needed to sustain this setpoint. In this configuration, the system employs automatic feedback control to continuously adjust power delivery based on real-time temperature measurements. Three solvents were used: 100% distilled water (identified as W), a mixture of 50% distilled water and 50% ethanol (identified as W:E), and 100% ethanol (with a nominal concentration of 96% ethanol and identified as E). A sample of 2.5 g of pine bark was placed in an extraction vessel, with 100 mL capacity, inside the equipment and kept agitated (each vessel contained a magnetic stirrer) throughout the extraction process. Several combinations of time, temperature, and solvents were tested, with a solid/liquid ratio of 1:20 (w:v). After cooling, the liquid fraction with the extractives was vacuum-filtered using Whatman® qualitative filter paper (Whatman PLC, Buckinghamshire, UK), Grade 1 (pore size—11 μm).

Table 1.
Experimental design of this study.
2.4. Determination of Extraction Yield
The extraction yield measures the efficiency of the solvent in extracting specific components from the original material. It is defined as the amount of solid extract recovered in mass compared to the initial amount of dry bark [2]. It is presented in % (w/w) and was determined for each solvent tested and dried at 103 °C. The extraction yield of antioxidant compounds from plant material is influenced mainly by the conditions under which liquid–solid extraction is carried out [18]. The yield of each tested extraction technique was evaluated. Yield percentage was calculated using the mass of extracted solids divided by the dry weight of the sample before extraction.
2.5. Determination of Total Phenolic Content
The content of the polyphenolics in the extracts was determined by the Folin–Ciocalteu analysis according to the procedure described by Singleton & Rossi (1965) [19] and Ainsworth & Gillespie (2007) [20]. A total of 100 µL of extractive solution (water, water–ethanol [50:50], and ethanol) was added to 200 µL of the Folin–Ciocalteu phenol reagent, followed by gentle shaking. Then, 800 µL of 7% (w/v) sodium carbonate was added. After 2 h, the resulting blue complex’s optical density at 765 nm was measured using a Varioskan LUX Multimode Microplate Reader (Thermo Scientific, Vantaa, Finland) spectrophotometer. A mixture of water and reagents was used as a blank. The standard curve was prepared with gallic acid in water at 0, 5, 10, 20, 40, 60, 80, 100, 120, and 160 mg/L. The total phenolic contents were expressed as grams of gallic acid equivalents (GAE) per mL of the extract.
2.6. Determination of Condensed Tannin Content
The condensed tannin content (CTC) can be determined using two methods: the butanol–HCl–iron method and the vanillin method. The butanol–HCl–iron method has been widely used in previous studies, but it requires more time to perform, according to Bharudin et al. (2013) [21], making the vanillin test a good alternative for detecting condensed tannins. Therefore, in this study, the CTC was determined using the vanillin method described by Chupin et al. (2015) [4]. Furthermore, Chupin et al. (2013) [22] used this method for the determination of tannins in pine bark (Pinus pinaster) and later [4] extended this approach to also determine condensed tannins in maritime pine bark extracted through MAE. A total of 3 mL of vanillin (4% in methanol) was added to 0.5 mL of the aqueous sample extract solution. Following this, 1.5 mL of highly concentrated HCl (37%) was then added. After 15 min, the absorbance at 500 nm was measured using a Varioskan LUX Multimode Microplate Reader spectrophotometer (Thermo Scientific, Vantaa, Finland). A standard curve was prepared with a catechin solution (120 mg/L). The condensed tannin content was expressed as mg of catechin equivalents (CE) per mL of the extract.
2.7. Determination of Antioxidant Activity
Antioxidant activity was evaluated by three different assays, namely the DPPH (2,2-diphenyl-1-picrylhydrazyl) radical scavenging method [23] based on Brand-Williams et al. (1995) [24], the ABTS (2,2′-azino-bis(3-ethylbenzothiazoline-6-sulphonic acid)) radical scavenging method, and the oxygen radical absorbance capacity (ORAC) assay, according to the method described by Coscueta et al. (2020) [25].
2.7.1. DPPH Free Radical Scavenging Effect
In the dark, 50 µL of diluted extract stock solution (in methanol) was placed in a clear 96-well microplate with 200 µL of DPPH in methanol and allowed to stand in the dark for 30 min before measuring the absorbance of the solution at 520 nm on the Varioskan LUX Multimode Microplate Reader (Thermo Scientific, Vantaa, Finland). Methanol was used as the blank to calibrate the spectrophotometer. The control was a DPPH solution containing absolute methanol instead of the sample. Antioxidant activity was measured based on the measurement of the reducing ability of pine extracts towards the radical DPPH. The results were expressed as mg of Trolox equivalent (TE) per mL of extract. The standard curve was prepared with Trolox (6-hydroxy-2,5,7,8-tetramethylchroman-2-carboxylic acid). The percent inhibition of the H• radical was calculated from the decrease in the absorbance of the DPPH• radical caused by antioxidants, due to the scavenging of the radical by hydrogen donation. The degree of discoloration indicates the scavenging potential of the antioxidant extract. The DPPH• method has been widely used to measure the antioxidant capacities of different residual and natural products, as it is a rapid, simple, sensitive, and practical assay [26].
2.7.2. ABTS Radical Cation Scavenging Effect
In the dark, 25 µL of diluted extract stock solution (in methanol) was placed in a clear 96-well microplate with 200 µL of ABTS in methanol and allowed to stand in the dark for 6 min before measuring the absorbance of the solution at 735 nm on the Varioskan LUX Multimode Microplate Reader (Thermo Scientific, Vantaa, Finland). Methanol was used as the blank to calibrate the spectrophotometer. The control was an ABTS solution containing absolute methanol instead of the sample. Antioxidant activity was measured based on the measurement of the reducing ability of pine extracts towards the radical ABTS. The standard curve was prepared with Trolox (6-hydroxy-2,5,7,8-tetramethylchroman-2-carboxylic acid). The results were expressed as mg of Trolox equivalent (TE) per mL of extract.
The improved technique for the generation of ABTS•+ described here involves the direct production of the blue/green ABTS•+ chromophore through the reaction between ABTS and potassium persulfate. The addition of antioxidants to the pre-formed radical cation reduces ABTS to an extent and on a timescale depending on the antioxidant activity, the concentration of the antioxidant, and the duration of the reaction. Thus, the extent of decolorization as inhibition percentage of the ABTS•+ radical cation is determined as a function of concentration and time and calculated relative to the reactivity of Trolox as a standard, under the same conditions. This method is applicable to the study of both water-soluble and lipid-soluble antioxidants, pure compounds, and food extracts [27].
2.7.3. Oxygen Radical Absorbance Capacity
The ORAC assay was performed in a black 96-well microplate (Thermo Scientific™ Nunc MicroWell, Nalge Nunc International, Rochester, NY, USA) according to the method described by Coscueta et al. (2020) [25]. Briefly, the reaction was carried out in 75 mM phosphate buffer (pH 7.4) at 40 °C. The final assay mixture was 200 µL, containing fluorescein (70 nM, final concentration in well), 2′-Azobis (2-methylpropionamidine) dihydrochloride (AAPH) (12 mM, final concentration in well), and either Trolox (1–8 µM, final concentration in well) or the sample, for the calibration curve or sample determination. A control with PBS instead of the antioxidant solution was used. Before adding AAPH, the mixture was pre-incubated for 10 min at 37 °C. AAPH solution was added rapidly. The kinetic loop measured the fluorescence every 30 s for 90 min, for a total of 181 measurement cycles in a multidetection plate reader (Varioskan LUX Multimode Microplate Reader, Thermo Scientific, Vantaa, Finland) with excitation and emission wavelengths of 485 nm and 520 nm, respectively. The equipment was controlled by SkanIt software version 6.1.1.7. Antioxidant curves (fluorescence versus time) were normalized to the blank curve corresponding to the same assay. The area under the fluorescence decay curve (AUC) was calculated according to the trapezoidal method from the normalized curves. Regression equations between net AUC and antioxidant concentration were calculated. The results were expressed as mg of Trolox equivalent (TE) per mL of extract.
2.8. Quantitative Analysis of Extracts by HPLC-DAD Analysis
The individual phenolic compounds of the pine bark extracts were analyzed by an HPLC system (Thermo Scientific UltiMate 3000, Thermo Fisher Scientific, Waltham, MA, USA) equipped with a Diode Array Detector (DAD). The extracts were prepared in methanol/water (50:50, v/v) at 10 mg m−1, and the filtration process was carried out by a 0.2 m tetrafluoroethylene filter. The injection volume was 20 µL. Separation was performed on a Hypersil ODS C18 250 × 4.6 mm 5 µm (Thermo Scientific, Waltham, MA, USA) column operating at 40 °C. The mobile phase is composed of water/formic acid (0.1%) (A) and acetonitrile (B). Gradient elution was carried out at a flow rate of 1 mL min−1 for 16 min, as follows: 15% B kept from 0 to 1 min; 15–35% B over 9 min; and 35–90% B over 14 min, followed by re-equilibration at 15% B for 2 min. Phenolic compounds were identified at different wavelengths by comparing their UV spectra and retention times with the corresponding standards. The limit of detection (LoD) was calculated using the calibration curves of pure phenolic compound standards, ranging between 250 and 1.25 mg/L (250, 125, 100, 50, 25, 10, 5, 1.25 mg/L). The LoD was calculated for each standard used. Quantification was carried out using calibration curves and identified at different wavelengths (280–320 nm). Standard solutions of cinnamic acid, catechin, quercetin, gallic acid, syringic acid, caffeic acid, taxifolin, ferulic acid, ellagic acid, protocatechuic acid, rutin, tyrosol, vanillin, resveratrol, and o-coumaric acid were injected in the HPLC system to obtain standard curves. The solutions were prepared in HPLC-grade methanol, with eight concentrations ranging from 1.25 to 250 mg/L. The phenolic compounds were quantified using the linear regression equation (Table 2). The pine bark extracts were injected in triplicate.
Table 2.
Linearity, calibration curve, and limit of detection for compounds under analysis.
2.9. Statistical Analysis
Statistical analysis utilized the Statistica for Windows software package, version 14.0.0.15 (TIBCO Software, Palo Alto, CA, USA). A multivariate analysis of variance (MANOVA) was conducted to evaluate the statistical significance of the examined factors. Group variations were assessed through Tukey’s post hoc test, with significance set at p < 0.05. All determinations were performed in triplicate.
3. Results and Discussion
3.1. Factor Testing
The experiments involved three variables: temperature, time, and extraction solvent. Consequently, 18 distinct extracts were generated and assessed for parameters such as dry matter, extraction efficiency, total phenolic content, condensed tannin content, and antioxidant activity as determined by ABTS and DPPH assays. It was found that all factors or interactions presented statistically significant differences (Table 3). Initially, the factor analysis was unable to discern the most favorable condition, as all interactions were significant. Therefore, the results were analyzed in a univariate manner, establishing comparisons between isolated samples, using the graphs in the following sections, where it is possible to discern the extractions with the best results.
Table 3.
Factors and interaction effects of MAE method—extraction yield, total phenolic content (TPC), antioxidant activity (DPPH, ABTS, ORAC), and condensed tannins of tested experimental model.
This study is inserted in the context that guides the principles of sustainability, being one of the pioneers in the MAE and characterization of phenolic compounds from Pinus pinaster bark from the Minho region, as well as in the optimization of process parameters, evaluating the influence of contact time and solvent composition on the extraction process. All pine bark extracts are a rich source of polyphenols, but their mass fractions significantly depend on the extraction conditions, solvent polarity, extraction temperature, and time [10]. Therefore, the extraction solvent (W—100% water; W:E—50% water–50% ethanol; and E—100% ethanol), extraction temperature (90, 110, and 130 °C), and time (15 and 30 min) were evaluated, aiming to increase extraction efficiency.
3.2. Extraction Yield
For each extraction, the extraction yield is measured as the percentage of extract recovered in mass compared to the initial mass of dry bark. All the factors and interactions were found to be significant (p < 0.001).
The results (Figure 1) indicate that extraction yields were significantly increased (p < 0.05) when extraction was performed with a hydroethanolic solvent compared to ethanolic or aqueous extraction for both extraction conditions. The use of a hydroethanolic mixture allowed both polar and nonpolar compounds to be recovered [4]. It is known that most phenolic compounds have a greater affinity for ethanol than for water. Also, regarding the different temperatures and times, the best results were obtained with the hydroethanolic solvent. Significant differences (p < 0.001) were observed between the ethanol 50% and ethanol 100% solvents. The best condition was ethanol 50% at 130 °C for 15 min, obtaining 11.13 ± 0.01% (w/w). The results achieved in this study are similar to those reported in the literature. For example, the study by Chupin et al. (2015) [4] using microwave-assisted extraction in ethanol–water (80–20, v/v) at a solid-to-liquid ratio of 1–10 (w/v) and different conditions for extracting pine bark compounds reported extraction yields of approximately 9.24%. In a study by Fradinho et al. (2002) [28], they also reported that the yield of extractives from the bark of P. pinaster, obtained by Soxhlet extraction, was 10.3% for ethanol extractives and 3.2% for water extractives. In another study using supercritical CO2 extraction or mixtures of CO2 and high-pressure ethanol (ethanol content ranging from 30% to 70% (v/v), the extraction yield was approximately 4.0%, much lower than that obtained in this work for ethanolic extracts [29]. In addition to extraction methods, the differences between different studies using pine are likely also due to a number of other factors, such as the age of the pine bark, growing conditions, or extraction conditions [10]. Do et al. (2014) [30], studying the extraction of phenolics from Limnophila aromatica, using other techniques and various solvents, also observed that 50% aqueous ethanol had a higher extraction yield compared to the 75 and 100% ethanol solvents. Another study, testing several herbs and spices, reported that better results were obtained with 100% water instead of 100% ethanol as the main antioxidant components recovered were phenolic; therefore, organic solvents of higher polarity are more effective in the quantitative recovery of these substances than nonpolar solvents [31]. These apparently different findings are certainly due to the different plant sources used.
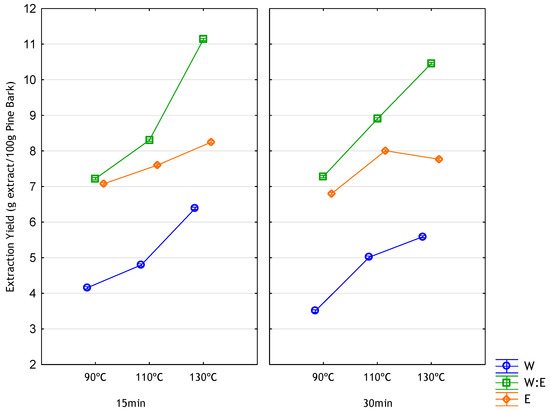
Figure 1.
Pinus pinaster bark MAE process parameters influence extraction yields (% w/w), extraction times (15′ or 30′), solvents (W—100% water; W:E—50% water–50% ethanol; and E—100% ethanol), and extraction temperatures (9, 110, or 130 °C). Vertical bars denote 95% of confidence interval. Values are expressed as mean ± SD of 3 analytical measurements.
3.3. Total Phenolic Content and Condensed Tannin Content
The total phenolic content (TPC) and condensed tannin content (CTC) of P. pinaster bark under different extraction conditions are presented in Figure 2 and Figure 3. All the factors and interactions were significant (p < 0.001).
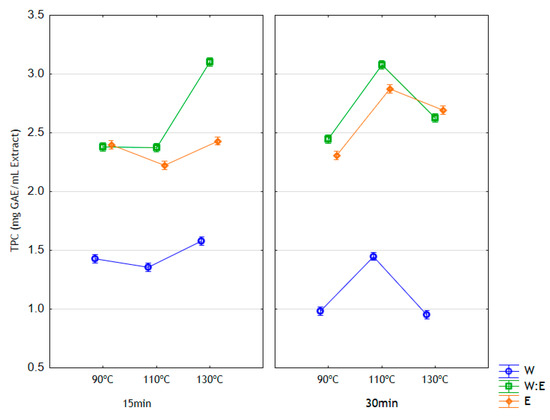
Figure 2.
Total phenolic content (mg gallic acid equivalent/mL extract)—influence of different solvents, temperatures, and extraction times on MAE pine bark extracts. W—100% water; W:E—50% water/50% ethanol; and E—100% ethanol. Vertical bars denote 95% of confidence interval. Values are expressed as mean ± SD of 3 analytical measurements.
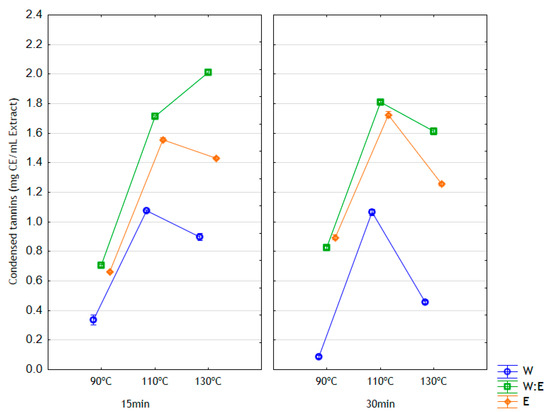
Figure 3.
Condensed tannin content (mg catechin equivalent/mL extract)—influence of different solvents, temperatures, and extraction times on MAE pine bark extracts. W—100% water; W:E—50% water/50% ethanol; and E—100% ethanol. Vertical bars denote 95% of confidence interval. Values are expressed as mean ± SD of 3 analytical measurements.
The selectivity of the compounds within the extract is attributed to the solvents, which also facilitate the dissolution of intracellular compounds found in the raw materials, namely plants or by-products. Essential metabolites possessing antioxidant qualities in natural sources, like phenolic compounds, exhibit greater solubility in polar solvents owing to the hydroxyl group’s presence [32,33]. As a result, this study employed water and ethanol as both efficient and environmentally friendly polar solvents [13]. The outcomes of our study reveal that the extracts derived from pine bark exhibit a significant concentration of phenolic compounds. The phenolic content was quantified using the Folin–Ciocalteu method, yielding values between 0.95 and 3.10 mg of gallic acid per mL of pine bark extract.
The results (Figure 2 and Figure 3) revealed that the highest values of total phenols and condensed tannins are achieved using the mixture water/ethanol or ethanol, showing significantly higher amounts (p < 0.05) than water extracts in all time and temperature extraction conditions studied. Previous studies have shown that increasing the ethanol concentration accelerates mass transfer between the solvent and the material, thereby improving the solubility of polar phenolic compounds [14]. The mass fraction of total polyphenols significantly depends on the extraction temperature. The extraction of pine bark polyphenols at 110 or 130 °C gave higher yields compared to the extraction at a lower temperature likely due to increased solubility and diffusion coefficients. From the results shown in Figure 2, it is evident that the recovery of phenolic compounds depended on the type of solvent used, its polarity, and, consequently, on the solubility of phenolic compounds in the extraction solvents. It was observed that the higher TPC was obtained at 130 °C with the hydroethanolic solvent during 15 min, but values decreased when increasing the time of extraction. However, at the same temperature, the TPC of ethanolic extracts increased with time, with the highest values being observed at 30 min. In summary, the best conditions for the extraction of polyphenols from pine bark were with the hydroethanolic solvent at 110 or 130 °C for 30 or 15 min, respectively, under which the highest mass fraction of TPC of 3.08 ± 0.03 and 3.10 ± 0.09 mg GAE per mL of extract, respectively, was determined. No statistical differences were observed between those two conditions. Bai et al. (2010) [34] also reported that a mixture of water/ethanol was a better solvent than pure water or pure ethanol for extracting phenolic compounds. Wang et al. (2004) [35] also investigated the influence of solvents on the amount of extracted phenolic acids, concluding that optimal extraction capacity was achieved with 30–60% ethanol solutions. In addition, Pinelo et al. (2004) [26] obtained better results with ethanol than with water when extracting pine sawdust. Our results show that pine bark TPC varied considerably as a function of solvent composition, with the results being in agreement with several studies, which showed that the nature of the solvent exerts great power on the phenolic extraction capacities in many plant species. Furthermore, this result was in accordance with previous reports suggesting that a binary solvent system (water/ethanol) is more efficient than a mono-solvent system (water or pure ethanol) in extracting phenolic compounds regarding their relative polarity. Ustun et al. (2012) [36], studying the commercially available Pycnogenol (Pycnogenol®, maritime pine bark extract, 95% proanthocyanidins), known for its bioactivity, reported a concentration of about 57.2 ± 0.5 g equivalent of gallic acid/100 g of extract. In our study, the values obtained at 110 °C for 30 min and 130 °C for 15 min with the hydroethanolic solvent condition were similar to those obtained with Pycnogenol®.
Feria-Reyes et al. (2023) [37] reported that Pinus spp. bark extracts are rich in phenolic compounds, especially in condensed tannins. Chupin et al. (2015) [4] reported that MAE is a technique capable of recovering high amounts of condensed tannins. The content of condensed tannins in the extracts varied from 0.085 to 2.012 mg CE/mL, depending on the solvent employed during extraction. The highest content was observed in the water/ethanol mixture (2.01 ± 0.03 mg CE/mL and 1.81 ± 0.01 mg CE/mL from 130 °C for 15 min and 110 °C for 30 min, respectively), while the extracts obtained with 100% water (0% ethanol) showed the lowest CTC (0.09 ± 0.02 mg CE/mL and 0.34 ± 0.06 mg CE/mL at 90 °C for 15 min and 30 min, respectively) (p < 0.05). These results, in agreement with those mentioned above, verify that hydroethanolic solvents can effectively extract tannins from pine bark. When compared to aqueous mixtures, pure solvents with 100% ethanol showed lower efficiency in tannin extraction; similar results were observed with pure water. In our results, CTC increased as extraction temperature rose. The results also indicated that different extraction conditions resulted in significant variations in CTC values. As shown in Figure 3, the highest CTC values were obtained at 130 °C for 15 min with water/ethanol [50:50]. Thus, this extraction condition was selected as the optimal condition for recovering condensed tannins from Pinus pinaster bark in this study. Jiménez-Moreno and colleagues explored various extraction conditions for attaining polyphenol-rich extracts from grape stems. Their findings indicated that 50% ethanol optimizes extraction, yielding extracts with enhanced antioxidant activity [38]. Recently, Tanase et al. (2019) [39] compiled literature-based information regarding the extraction of phenolic compounds from woody plant bark and their potential biological effects. They highlighted the utilization of multiple solvents for obtaining phenolic compounds. In their review, the authors pointed out that the combination of water and ethanol has been extensively employed to enhance the extraction of these compounds from lignocellulosic matrices, such as those found in Pinus species. This choice may be attributed to the solvent’s capacity to permeate cell walls, facilitating the release of phenolic compounds [38]. While phenolic compounds are major contributors to bioactivity in plant extracts, other co-extracted compounds including polysaccharides, proteins, and secondary metabolites may also contribute to the observed biological activities, necessitating bioactivity-guided fractionation studies to definitively attribute effects to specific phenolic compounds [40].
3.4. Antioxidant Activity
The antioxidant capacity of natural molecules and extracts is one of the most studied biological activities, often described as a mechanism to prevent oxidative stress and several diseases [41]. It is well-known that the antioxidant activity of plant extracts cannot be discussed based on the results of a single assay [31]. The DPPH assay assesses the capability of antioxidants to neutralize free radicals, whereas the ABTS method gauges the antioxidants’ capacity to inhibit the oxidation of ABTS radicals. On the other hand, the ORAC method quantifies antioxidant capacity against peroxyl radicals, as indicated by Thaipong et al. (2006) [42]. The ORAC assay is considered more relevant since it employs a biologically relevant radical source, as noted by Prior et al. (2003) [43]. Therefore, in this study, the effects of solvent and the time of extraction on the antioxidant activity of pine bark extracts were evaluated using three different methods: DPPH, ABTS and ORAC. Significant effects (p < 0.05) of temperature, time, and type of solvent on the antioxidant activity of extracts were observed. The hydroethanolic extracts showed higher antioxidant activities in the three tested assays than ethanolic and aqueous extracts (Figure 4, Figure 5 and Figure 6).
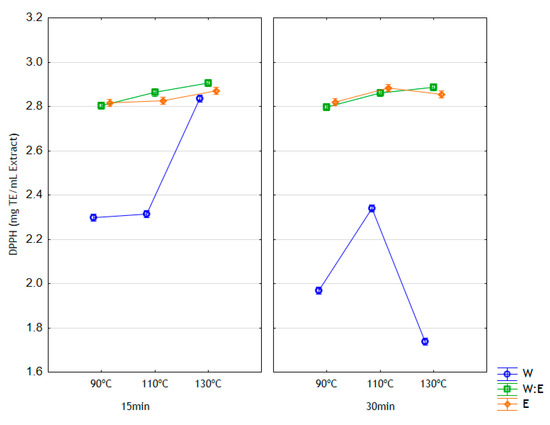
Figure 4.
DPPH assay (mg Trolox equivalent/mL extract)—influence of different solvents, temperatures, and extraction times on MAE pine bark extracts. W = 100% water; W:E = 50% water–50% ethanol; E = 100% ethanol. Vertical bars denote 95% confidence intervals. Values are expressed as mean ± SD of 3 analytical measurements.
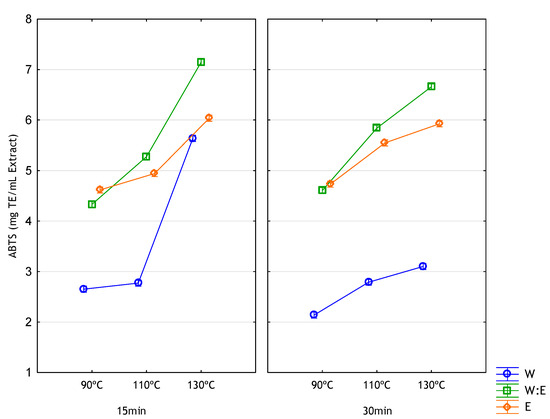
Figure 5.
ABTS assay (mg Trolox equivalent/mL extract)—influence of different solvents, temperatures, and extraction times on MAE pine bark extracts. W = 100% water; W:E = 50% water–50% ethanol; E = 100% ethanol. Vertical bars denote 95% of confidence interval. Values are expressed as mean ± SD of 3 analytical measurements.
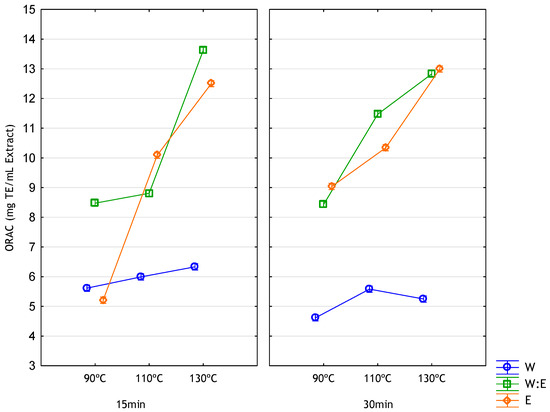
Figure 6.
ORAC assay (mg Trolox equivalent/mL extract)—influence of different solvents, temperatures, and extraction times on MAE pine bark extracts. W—100% water; W:E—50% water–50% ethanol; and E—100% ethanol. Vertical bars denote 95% of confidence interval. Values are expressed as mean ± SD of 3 analytical measurements.
The water solvent had the lowest values in the different temperature and time conditions, as shown in Figure 4, Figure 5 and Figure 6. The antioxidant capacities of extracts were also found to be sensitive to ethanol concentration. Increasing ethanol concentration up to 50% was associated with an increase in the antioxidant capacity of the extracts. However, further increasing the ethanol concentration to 100% caused a significant (p < 0.05) decrease in DPPH but no significant (p < 0.05) effect on ABTS. This observation may be explained by the extraction of different molecular weights of phenolic compounds. A previous study reported that DPPH assay is more reactive with low-molecular-weight phenolic compounds [44]. Hence, we propose that 100% ethanol was less efficient in extracting low-molecular-weight phenolic compounds with high antioxidant capacity from Pinus pinaster subsp. atlantica compared with the hydroethanolic mixture. This aligns with the findings reported in Braga et al. (2008) [45] that show that ethanol plays an important role in extracting compounds with greater antioxidant activity.
The results obtained in the DPPH, ABTS, and ORAC methods demonstrate the potent reducing power of pine bark extracts. Our data show that the extracts obtained with water–ethanol [50:50] and ethanol have greater radical scavenging activity than those where water was used as a solvent, as shown in Figure 4, Figure 5 and Figure 6. Extraction time is crucial in the solvent extraction of phenolic compounds, as proper extraction time can result in both time and cost efficiency. Significant differences were observed between the hydroethanolic mixture and ethanol solvents at all temperatures (90, 110, and 130 °C) for 15 min. However, when changing the extraction time to 30 min, no significant differences between 50% and 100% ethanol were observed at all temperatures (90, 110, and 130 °C). It was observed that the antioxidant activity in all extracts obtained at 130 °C with water, water–ethanol, and ethanol increased with higher temperatures of extraction. The extraction condition yielding the highest antioxidant activity in both the DPPH and ABTS assays was water–ethanol at 110 or 130 °C for 30 or 15 min, respectively, with 2.86 ± 0.01 mg TE/g sample and 2.91 ± 0.00 mg TE/g sample. Jusoh et al. [46] stated that the highest DPPH of apple peel extract can be achieved when ethanol concentration is between 10 and 47%; beyond this value, the DPPH value starts to decrease. The proposed explanation is that by increasing the ethanol content, the polarity changes, thereby reducing the tendency of the solvent to extract compounds that can react with DPPH.
These findings illustrate a connection between the bark extracts’ total phenolics, condensed tannin content, and antioxidant activity assessed through DPPH, ABTS, and ORAC assays. This association underscores the role of these extracted bio-compounds in contributing to the observed antioxidant activity.
3.5. Quantitative Analysis of Extracts by HPLC-DAD Analysis
The phenolic profile of pine bark extracts was quantified by HPLC-DAD (Table 4). Catechin was the most abundant phenolic compound with concentrations ranging from 18.84 and 252.89 mg/L. Taxifolin was also identified as one of the most abundant compounds, ranging from 8.09 and 58.53 mg/L. Hydroethanolic mixtures yielded the highest concentrations for nearly all phenolic compounds. Protocatechuic acid, detected only in hydroethanolic extracts (26.77 ± 0.20 mg/L at 110 °C for 30 min, 29.54 ± 0.83 mg/L at 130 °C for 15 min, and 27.56 ± 2.16 mg/L at 130 °C for 30 min), was observed at differing levels. Tyrosol, found only in aqueous extracts (10.57 ± 0.39 mg/L at 130 °C for 15 min) and hydroethanolic extracts (13.59 ± 0.19 at 110 °C for 15 min and 41.28 ± 0.33 mg/L at 110 °C for 30 min, as well as 53.26 ± 1.01 mg/L at 130 °C for 15 min and 44.73 ± 1.57 mg/L at 130 °C for 30 min), was found in varying concentrations. Gallic acid, caffeic acid, vanillin, syringic acid, rutin, ellagic acid, ferulic acid, o-coumaric acid, resveratrol, quercetin, and cinnamic acid were not detected. In all extracts, high levels of taxifolin and catechin were present, with concentrations increasing when a water–ethanol mixture was used and when extraction temperatures were higher. The main constituents described in the literature for Pycnogenol, the commercial extract from maritime pine bark known for its bioactive properties, indicate that it primarily contains catechin, epicatechin, and taxifolin [47]. As reported in a review by Liu et al. (2023) [48], taxifolin is a naturally bioactive flavonoid with superior antioxidant capacity than common flavonoids, which is closely related to its phenolic hydroxyl groups. Extracts obtained from the barks of five distinct pine species, namely P. pinea, P. sylvestris, P. nigra, P. parviflora, and P. ponderosa collected from various geographical regions, revealed that the heightened concentrations of catechin and taxifolin were linked to climatic stress factors, such as reduced rainfall, elevated temperatures, and extended periods of sun exposure [49].
Table 4.
Identification and quantification of phenolic compounds in aqueous, hydroethanolic, and ethanolic extracts from Pinus pinaster bark. Values are expressed as concentration (mg/L), mean ± SD of three analytical measurements.
Several phenolic compounds commonly reported in plant matrices, namely gallic acid, caffeic acid, vanillin, syringic acid, rutin, ellagic acid, ferulic acid, o-coumaric acid, resveratrol, quercetin, and cinnamic acid [50], were not detected in P. pinaster bark extracts. This outcome may reflect either genuinely low concentrations or levels below the limit of detection (LoD) of the HPLC-DAD method. Compounds present below the LoD remain analytically undetectable but may still contribute to extract bioactivity if enriched under alternative extraction conditions or assessed with more sensitive techniques (e.g., LC-MS/MS). The results suggest that phenolic compounds quantified by HPLC play a major role in the antioxidant activity of the samples. The moderate correlation with DPPH (r = 0.41) may reflect the lower sensitivity of this assay to certain phenolic structures, whereas the stronger associations observed with ABTS and ORAC (r = 0.60 and r = 0.56, respectively) indicate that these methods are more responsive to the antioxidant potential of the quantified compounds. Similarly, the strong correlations with TPC (r = 0.56) and CTC (r = 0.59) support the contribution of total phenolics and condensed tannins, suggesting that these groups are key determinants of the overall antioxidant capacity.
4. Conclusions
Microwave-assisted extraction enabled the efficient recovery of phenolic-rich extracts from Pinus pinaster subsp. atlantica bark. The optimal conditions—50:50 (v/v) water–ethanol, 130 °C, 15 min—yielded 11.13% (w/w) extract, 3.10 mg GAE/mL total phenolics, 2.01 mg CE/mL condensed tannins, and strong antioxidant capacities in DPPH, ABTS, and ORAC assays, matching the values reported for commercial extracts such as Pycnogenol®.
Hydroethanolic mixtures provided the best balance between polarity and extraction efficiency. Microwave-assisted extraction proved to be a rapid, solvent-efficient, and scalable method for valorizing forestry by-products. Further studies on bioavailability, in vivo activity, microbial validation, and industrial scalability could support the integration of Pinus pinaster bark extracts into biomedical, nutraceutical, and cosmetic applications, contributing to circular economy objectives.
As this study was conceived as a preliminary investigation focused on characterizing the chemical profile of the extracts, microbiological screening was not included. This limitation is acknowledged, as assessing antimicrobial properties and microbiological safety is essential for validating their potential in food applications. Future work will therefore integrate microbiological evaluations, including tests in representative food matrices, to more robustly determine both functional efficacy and practical feasibility.
Author Contributions
Conceptualization and investigation, D.B., R.P.-P. and É.F.; writing—original draft preparation, D.B., R.P.-P. and É.F.; writing—review and editing, D.B., R.P.-P., P.P. and M.V.-V.; supervision, M.V.-V. All authors have read and agreed to the published version of the manuscript.
Funding
The authors are grateful to the Foundation for Science and Technology (FCT, Portugal) for financial support through national funds FCT/MCTES to the CISAS, UIDB/05937/2020 (DOI: 10.54499/UIDB/05937/2020) and UIDP/05937/2020 (DOI: 10.54499/UIDP/05937/2020).
Data Availability Statement
The original contributions presented in this study are included in the article. Further inquiries can be directed to the corresponding author.
Acknowledgments
The authors thank the Foundation for Science and Technology (FCT, Portugal) for financial support with a PhD scholarship for Diana Barros—SFRH/BD/146720/2019 (DOI: 10.54499/SFRH/BD/146720/2019)—co-financed by Fundo Social Europeu (FSE) through the Programa Operacional Regional Norte 2020. The authors thank CentroPinus for the donation of pine bark for this study.
Conflicts of Interest
The authors declare no conflicts of interest.
Correction Statement
This article has been updated to include a Data Availability Statement. This change does not affect the scientific content of the article.
References
- Ku, C.S.; Jang, J.P.; Mun, S.P. Exploitation of polyphenol-rich pine barks for potent antioxidant activity. J. Wood Sci. 2007, 53, 524–528. [Google Scholar] [CrossRef]
- Aspé, E.; Fernández, K. The effect of different extraction techniques on extraction yield, total phenolic, and anti-radical capacity of extracts from Pinus radiata Bark. Ind. Crops Prod. 2011, 34, 838–844. [Google Scholar] [CrossRef]
- Barros, D.; Vieito, C.; Santos, J.; Ramos, C.; Vaz-Velho, M. Inhibitory Effects of Pinus pinaster Aiton Subsp. Atlantica Bark Extracts Against Known Food Pathogens. Chem. Eng. Trans. 2020, 79, 163–168. [Google Scholar] [CrossRef]
- Chupin, L.; Maunu, S.L.; Reynaud, S.; Pizzi, A.; Charrier, B.; Charrier-El Bouhtoury, F. Microwave assisted extraction of maritime pine (Pinus pinaster) bark: Impact of particle size and characterization. Ind. Crops Prod. 2015, 65, 142–149. [Google Scholar] [CrossRef]
- Venkatesan, T.; Choi, Y.-W.; Kim, Y.-K. Impact of Different Extraction Solvents on Phenolic Content and Antioxidant Potential of Pinus densiflora Bark Extract. Biomed. Res. Int. 2019, 2019, 3520675. [Google Scholar] [CrossRef]
- Alonso-Esteban, J.I.; Carocho, M.; Barros, D.; Velho, M.V.; Heleno, S.; Barros, L. Chemical composition and industrial applications of Maritime pine (Pinus pinaster Ait.) bark and other non-wood parts. Rev. Environ. Sci. Bio/Technol. 2022, 21, 583–633. [Google Scholar] [CrossRef]
- Abad Viñas, R.; Caudullo, G.; Oliveira, S.; de Rigo, D. Pinus pinaster in Europe: Distribution, habitat, usage and threats. In European Atlas of Forest Tree Species; San-Miguel-Ayanz, J., de Rigo, D., Caudullo, G., Houston Durrant, T., Mauri, A., Eds.; Publications Office: Luxembourg, 2016. [Google Scholar]
- Conde, E.; Díaz-Reinoso, B.; Moure, A.; Hemming, J.; Willför, S.; Domínguez, H.; Parajó, J.C. Extraction of Phenolic and Lipophilic Compounds from Pinus pinaster Knots and Stemwood by Supercritical CO2. In Proceedings of the IIIrd Iberoamerican Conference on Supercritical Fluids, Cartagena de Indias, Colombia, 1–5 April 2013; Available online: http://www.nupeg.ufrn.br/prosciba/prosciba2013/Papers/T2-19.pdf (accessed on 23 June 2025).
- Caballero-Valdés, E.; Olivares-Miralles, A.; Soto-Maldonado, C.; Zúñiga-Hansen, M.E. Solid–Liquid Extraction of Polyphenols at Low Pressure. In Advances in Technologies for Producing Food-Relevant Polyphenols; Cuevas-Valenzuela, J., Vergara-Salinas, J.R., Pérez-Correa, J.R., Eds.; Taylor & Francis: Boca Raton, FL, USA, 2016; pp. 63–76. [Google Scholar]
- Ferreira-Santos, P.; Genisheva, Z.; Pereira, R.N.; Teixeira, J.A.; Rocha, C.M.R. Moderate Electric Fields as a Potential Tool for Sustainable Recovery of Phenolic Compounds from Pinus pinaster Bark. ACS Sustain. Chem. Eng. 2019, 7, 8816–8826. [Google Scholar] [CrossRef]
- Plaza, M.; Domínguez-Rodríguez, G.; Castro-Puyana, M.; Marina, M. Polyphenols analysis and related challenges. In Polyphenols: Properties, Recovery, and Applications; Woodhead Publishing: Cambridge, UK, 2018; pp. 177–232. [Google Scholar] [CrossRef]
- Llompart, M.; Garcia-Jares, C.; Celeiro, M.; Dagnac, T. Extraction|Microwave-Assisted Extraction. In Encyclopedia of Analytical Science, 3rd ed.; Worsfold, P., Poole, C., Townshend, A., Miró, M., Eds.; Academic Press: Oxford, UK, 2019; pp. 67–77. [Google Scholar] [CrossRef]
- Chemat, F.; Abert-Vian, M.; Fabiano-Tixier, A.S.; Strube, J.; Uhlenbrock, L.; Gunjevic, V.; Cravotto, G. Green extraction of natural products. Origins, current status, and future challenges. TrAC Trends Anal. Chem. 2019, 118, 248–263. [Google Scholar] [CrossRef]
- Durling, N.E.; Catchpole, O.J.; Grey, J.B.; Webby, R.F.; Mitchell, K.A.; Foo, L.Y.; Perry, N.B. Extraction of phenolics and essential oil from dried sage (Salvia officinalis) using ethanol–water mixtures. Food Chem. 2007, 101, 1417–1424. [Google Scholar] [CrossRef]
- McDonald, S.; Prenzler, P.D.; Antolovich, M.; Robards, K. Phenolic content and antioxidant activity of olive extracts. Food Chem. 2001, 73, 73–84. [Google Scholar] [CrossRef]
- Chen, J.; Thilakarathna, W.; Astatkie, T.; Rupasinghe, H.P.V. Optimization of Catechin and Proanthocyanidin Recovery from Grape Seeds Using Microwave-Assisted Extraction. Biomolecules 2020, 10, 243. [Google Scholar] [CrossRef]
- Pals, M.; Lauberte, L.; Ponomarenko, J.; Lauberts, M.; Arshanitsa, A. Microwave-Assisted Water Extraction of Aspen (Populus tremula) and Pine (Pinus sylvestris L.) Barks as a Tool for Their Valorization. Plants 2022, 11, 1544. [Google Scholar] [CrossRef]
- Oroian, M.; Escriche, I. Antioxidants: Characterization, natural sources, extraction and analysis. Food Res. Int. 2015, 74, 10–36. [Google Scholar] [CrossRef] [PubMed]
- Singleton, V.L.; Rossi, J.A. Colorimetry of Total Phenolics with Phosphomolybdic-Phosphotungstic Acid Reagents. Am. J. Enol. Vitic. 1965, 16, 144. [Google Scholar] [CrossRef]
- Ainsworth, E.A.; Gillespie, K.M. Estimation of total phenolic content and other oxidation substrates in plant tissues using Folin-Ciocalteu reagent. Nat. Protoc. 2007, 2, 875–877. [Google Scholar] [CrossRef]
- Bharudin, M.A.; Zakaria, S.; Chia, C.H. Condensed tannins from acacia mangium bark: Characterization by spot tests and FTIR. AIP Conf. Proc. 2013, 1571, 153–157. [Google Scholar] [CrossRef]
- Chupin, L.; Motillon, C.; Charrier-El Bouhtoury, F.; Pizzi, A.; Charrier, B. Characterisation of maritime pine (Pinus pinaster) bark tannins extracted under different conditions by spectroscopic methods, FTIR and HPLC. Ind. Crops Prod. 2013, 49, 897–903. [Google Scholar] [CrossRef]
- Deng, Q.; Penner, M.H.; Zhao, Y. Chemical composition of dietary fiber and polyphenols of five different varieties of wine grape pomace skins. Food Res. Int. 2011, 44, 2712–2720. [Google Scholar] [CrossRef]
- Brand-Williams, W.; Cuvelier, M.E.; Berset, C. Use of a free radical method to evaluate antioxidant activity. LWT Food Sci. Technol. 1995, 28, 25–30. [Google Scholar] [CrossRef]
- Coscueta, E.R.; Reis, C.A.; Pintado, M. Phenylethyl Isothiocyanate Extracted from Watercress By-Products with Aqueous Micellar Systems: Development and Optimisation. Antioxidants 2020, 9, 698. [Google Scholar] [CrossRef]
- Pinelo, M.; Rubilar, M.; Sineiro, J.; Núñez, M.J. Extraction of antioxidant phenolics from almond hulls (Prunus amygdalus) and pine sawdust (Pinus pinaster). Food Chem. 2004, 85, 267–273. [Google Scholar] [CrossRef]
- Re, R.; Pellegrini, N.; Proteggente, A.; Pannala, A.; Yang, M.; Rice-Evans, C. Antioxidant activity applying an improved ABTS radical cation decolorization assay. Free Radic. Biol. Med. 1999, 26, 1231–1237. [Google Scholar] [CrossRef] [PubMed]
- Fradinho, D.M.; Neto, C.P.; Evtuguin, D.; Jorge, F.C.; Irle, M.A.; Gil, M.H.; Pedrosa de Jesus, J. Chemical characterisation of bark and of alkaline bark extracts from maritime pine grown in Portugal. Ind. Crops Prod. 2002, 16, 23–32. [Google Scholar] [CrossRef]
- Seabra, I.J.; Dias, A.M.A.; Braga, M.E.M.; de Sousa, H.C. High pressure solvent extraction of maritime pine bark: Study of fractionation, solvent flow rate and solvent composition. J. Supercrit. Fluids 2012, 62, 135–148. [Google Scholar] [CrossRef]
- Do, Q.D.; Angkawijaya, A.E.; Tran-Nguyen, P.L.; Huynh, L.H.; Soetaredjo, F.E.; Ismadji, S.; Ju, Y.H. Effect of extraction solvent on total phenol content, total flavonoid content, and antioxidant activity of Limnophila aromatica. J. Food Drug Anal. 2014, 22, 296–302. [Google Scholar] [CrossRef]
- Muzolf-Panek, M.; Stuper-Szablewska, K. Comprehensive study on the antioxidant capacity and phenolic profiles of black seed and other spices and herbs: Effect of solvent and time of extraction. J. Food Meas. Charact. 2021, 15, 4561–4574. [Google Scholar] [CrossRef]
- Aryal, S.; Baniya, M.K.; Danekhu, K.; Kunwar, P.; Gurung, R.; Koirala, N. Total Phenolic Content, Flavonoid Content and Antioxidant Potential of Wild Vegetables from Western Nepal. Plants 2019, 8, 96. [Google Scholar] [CrossRef]
- Rafińska, K.; Pomastowski, P.; Rudnicka, J.; Krakowska, A.; Maruśka, A.; Narkute, M.; Buszewski, B. Effect of solvent and extraction technique on composition and biological activity of Lepidium sativum extracts. Food Chem. 2019, 289, 16–25. [Google Scholar] [CrossRef]
- Bai, X.L.; Yue, T.L.; Yuan, Y.H.; Zhang, H.W. Optimization of microwave-assisted extraction of polyphenols from apple pomace using response surface methodology and HPLC analysis. J. Sep. Sci. 2010, 33, 3751–3758. [Google Scholar] [CrossRef]
- Wang, H.; Provan, G.J.; Helliwell, K. Determination of rosmarinic acid and caffeic acid in aromatic herbs by HPLC. Food Chem. 2004, 87, 307–311. [Google Scholar] [CrossRef]
- Ustun, O.; Senol, F.S.; Kurkcuoglu, M.; Orhan, I.E.; Kartal, M.; Baser, K.H.C. Investigation on chemical composition, anticholinesterase and antioxidant activities of extracts and essential oils of Turkish Pinus species and pycnogenol. Ind. Crops Prod. 2012, 38, 115–123. [Google Scholar] [CrossRef]
- Feria-Reyes, R.; Ramírez-Cruz, S.O.; Ruiz-Aquino, F.; Robledo-Taboada, L.H.; Sánchez-Medina, M.A.; Mijangos-Ricárdez, O.F.; Gabriel-Parra, R.; Suárez-Mota, M.E.; Puc-Kauil, R.; Porcallo-Vargas, J. Pine Bark as a Potential Source of Condensed Tannin: Analysis through Fourier Transform Infrared Spectroscopy (FTIR), Scanning Electron Microscopy (SEM), and Energy Dispersive X-ray (EDX). Forests 2023, 14, 1433. [Google Scholar] [CrossRef]
- Jiménez-Moreno, N.; Volpe, F.; Moler, J.A.; Esparza, I.; Ancín-Azpilicueta, C. Impact of Extraction Conditions on the Phenolic Composition and Antioxidant Capacity of Grape Stem Extracts. Antioxidants 2019, 8, 597. [Google Scholar] [CrossRef]
- Tanase, C.; Coșarcă, S.; Muntean, D.L. A Critical Review of Phenolic Compounds Extracted from the Bark of Woody Vascular Plants and Their Potential Biological Activity. Molecules 2019, 24, 1182. [Google Scholar] [CrossRef]
- Shi, L.; Zhao, W.; Yang, Z.; Subbiah, V.; Suleria, H.A.R. Extraction and characterization of phenolic compounds and their potential antioxidant activities. Environ. Sci. Pollut. Res. Int. 2022, 29, 81112–81129. [Google Scholar] [CrossRef]
- Carocho, M.; Ferreira, I.C. A review on antioxidants, prooxidants and related controversy: Natural and synthetic compounds, screening and analysis methodologies and future perspectives. Food Chem. Toxicol. 2013, 51, 15–25. [Google Scholar] [CrossRef] [PubMed]
- Thaipong, K.; Boonprakob, U.; Crosby, K.; Cisneros-Zevallos, L.; Hawkins Byrne, D. Comparison of ABTS, DPPH, FRAP, and ORAC assays for estimating antioxidant activity from guava fruit extracts. J. Food Compos. Anal. 2006, 19, 669–675. [Google Scholar] [CrossRef]
- Prior, R.L.; Hoang, H.; Gu, L.; Wu, X.; Bacchiocca, M.; Howard, L.; Hampsch-Woodill, M.; Huang, D.; Ou, B.; Jacob, R. Assays for Hydrophilic and Lipophilic Antioxidant Capacity (oxygen radical absorbance capacity (ORACFL)) of Plasma and Other Biological and Food Samples. J. Agric. Food Chem. 2003, 51, 3273–3279. [Google Scholar] [CrossRef]
- Paixão, N.; Perestrelo, R.; Marques, J.C.; Câmara, J.S. Relationship between antioxidant capacity and total phenolic content of red, rosé and white wines. Food Chem. 2007, 105, 204–214. [Google Scholar] [CrossRef]
- Braga, M.E.M.; Santos, R.M.S.; Seabra, I.J.; Facanali, R.; Marques, M.O.M.; de Sousa, H.C. Fractioned SFE of antioxidants from maritime pine bark. J. Supercrit. Fluids 2008, 47, 37–48. [Google Scholar] [CrossRef]
- Jusoh, Y.; Orsat, V.; Gariepy, Y.; Raghavan, V. Optimisation of Radio Frequency Assisted Extraction of Apple Peel Extract: Total Phenolic Contents and Antioxidant Activity. Chem. Eng. Trans. 2017, 56, 1153–1158. [Google Scholar] [CrossRef]
- Packer, L.; Rimbach, G.; Virgili, F. Antioxidant activity and biologic properties of a procyanidin-rich extract from pine (pinus maritima) bark, pycnogenol. Free Radic. Biol. Med. 1999, 27, 704–724. [Google Scholar] [CrossRef] [PubMed]
- Liu, Z.; Yang, W.; Wei, H.; Deng, S.; Yu, X.; Huang, T. The mechanisms and applications of cryoprotectants in aquatic products: An overview. Food Chem. 2023, 408, 135202. [Google Scholar] [CrossRef] [PubMed]
- Yesil-Celiktas, O.; Otto, F.; Parlar, H. A comparative study of flavonoid contents and antioxidant activities of supercritical CO2 extracted pine barks grown in different regions of Turkey and Germany. Eur. Food Res. Technol. 2009, 229, 671–677. [Google Scholar] [CrossRef]
- Albuquerque, B.R.; Heleno, S.A.; Oliveira, M.; Barros, L.; Ferreira, I. Phenolic compounds: Current industrial applications, limitations and future challenges. Food Funct. 2021, 12, 14–29. [Google Scholar] [CrossRef]


Disclaimer/Publisher’s Note: The statements, opinions and data contained in all publications are solely those of the individual author(s) and contributor(s) and not of MDPI and/or the editor(s). MDPI and/or the editor(s) disclaim responsibility for any injury to people or property resulting from any ideas, methods, instructions or products referred to in the content. |
© 2025 by the authors. Licensee MDPI, Basel, Switzerland. This article is an open access article distributed under the terms and conditions of the Creative Commons Attribution (CC BY) license (https://creativecommons.org/licenses/by/4.0/).