3.2. Defect Properties
In this section, the formation of intrinsic defect processes such as Frenkel, Schottky, and anti-site defects, is discussed. Initially, the point defect energies were calculated, and then they were combined to calculate the intrinsic defect processes with the appropriate energies of the lattices. The following equations were written using Kröger–Vink notation [
40] to explain the defect reactions. Anti-site defects were considered to be in an isolated or clustered form. Isolated anti-site defects were modeled by considering defects separately. In the clustered form, defects were considered in the same supercell.
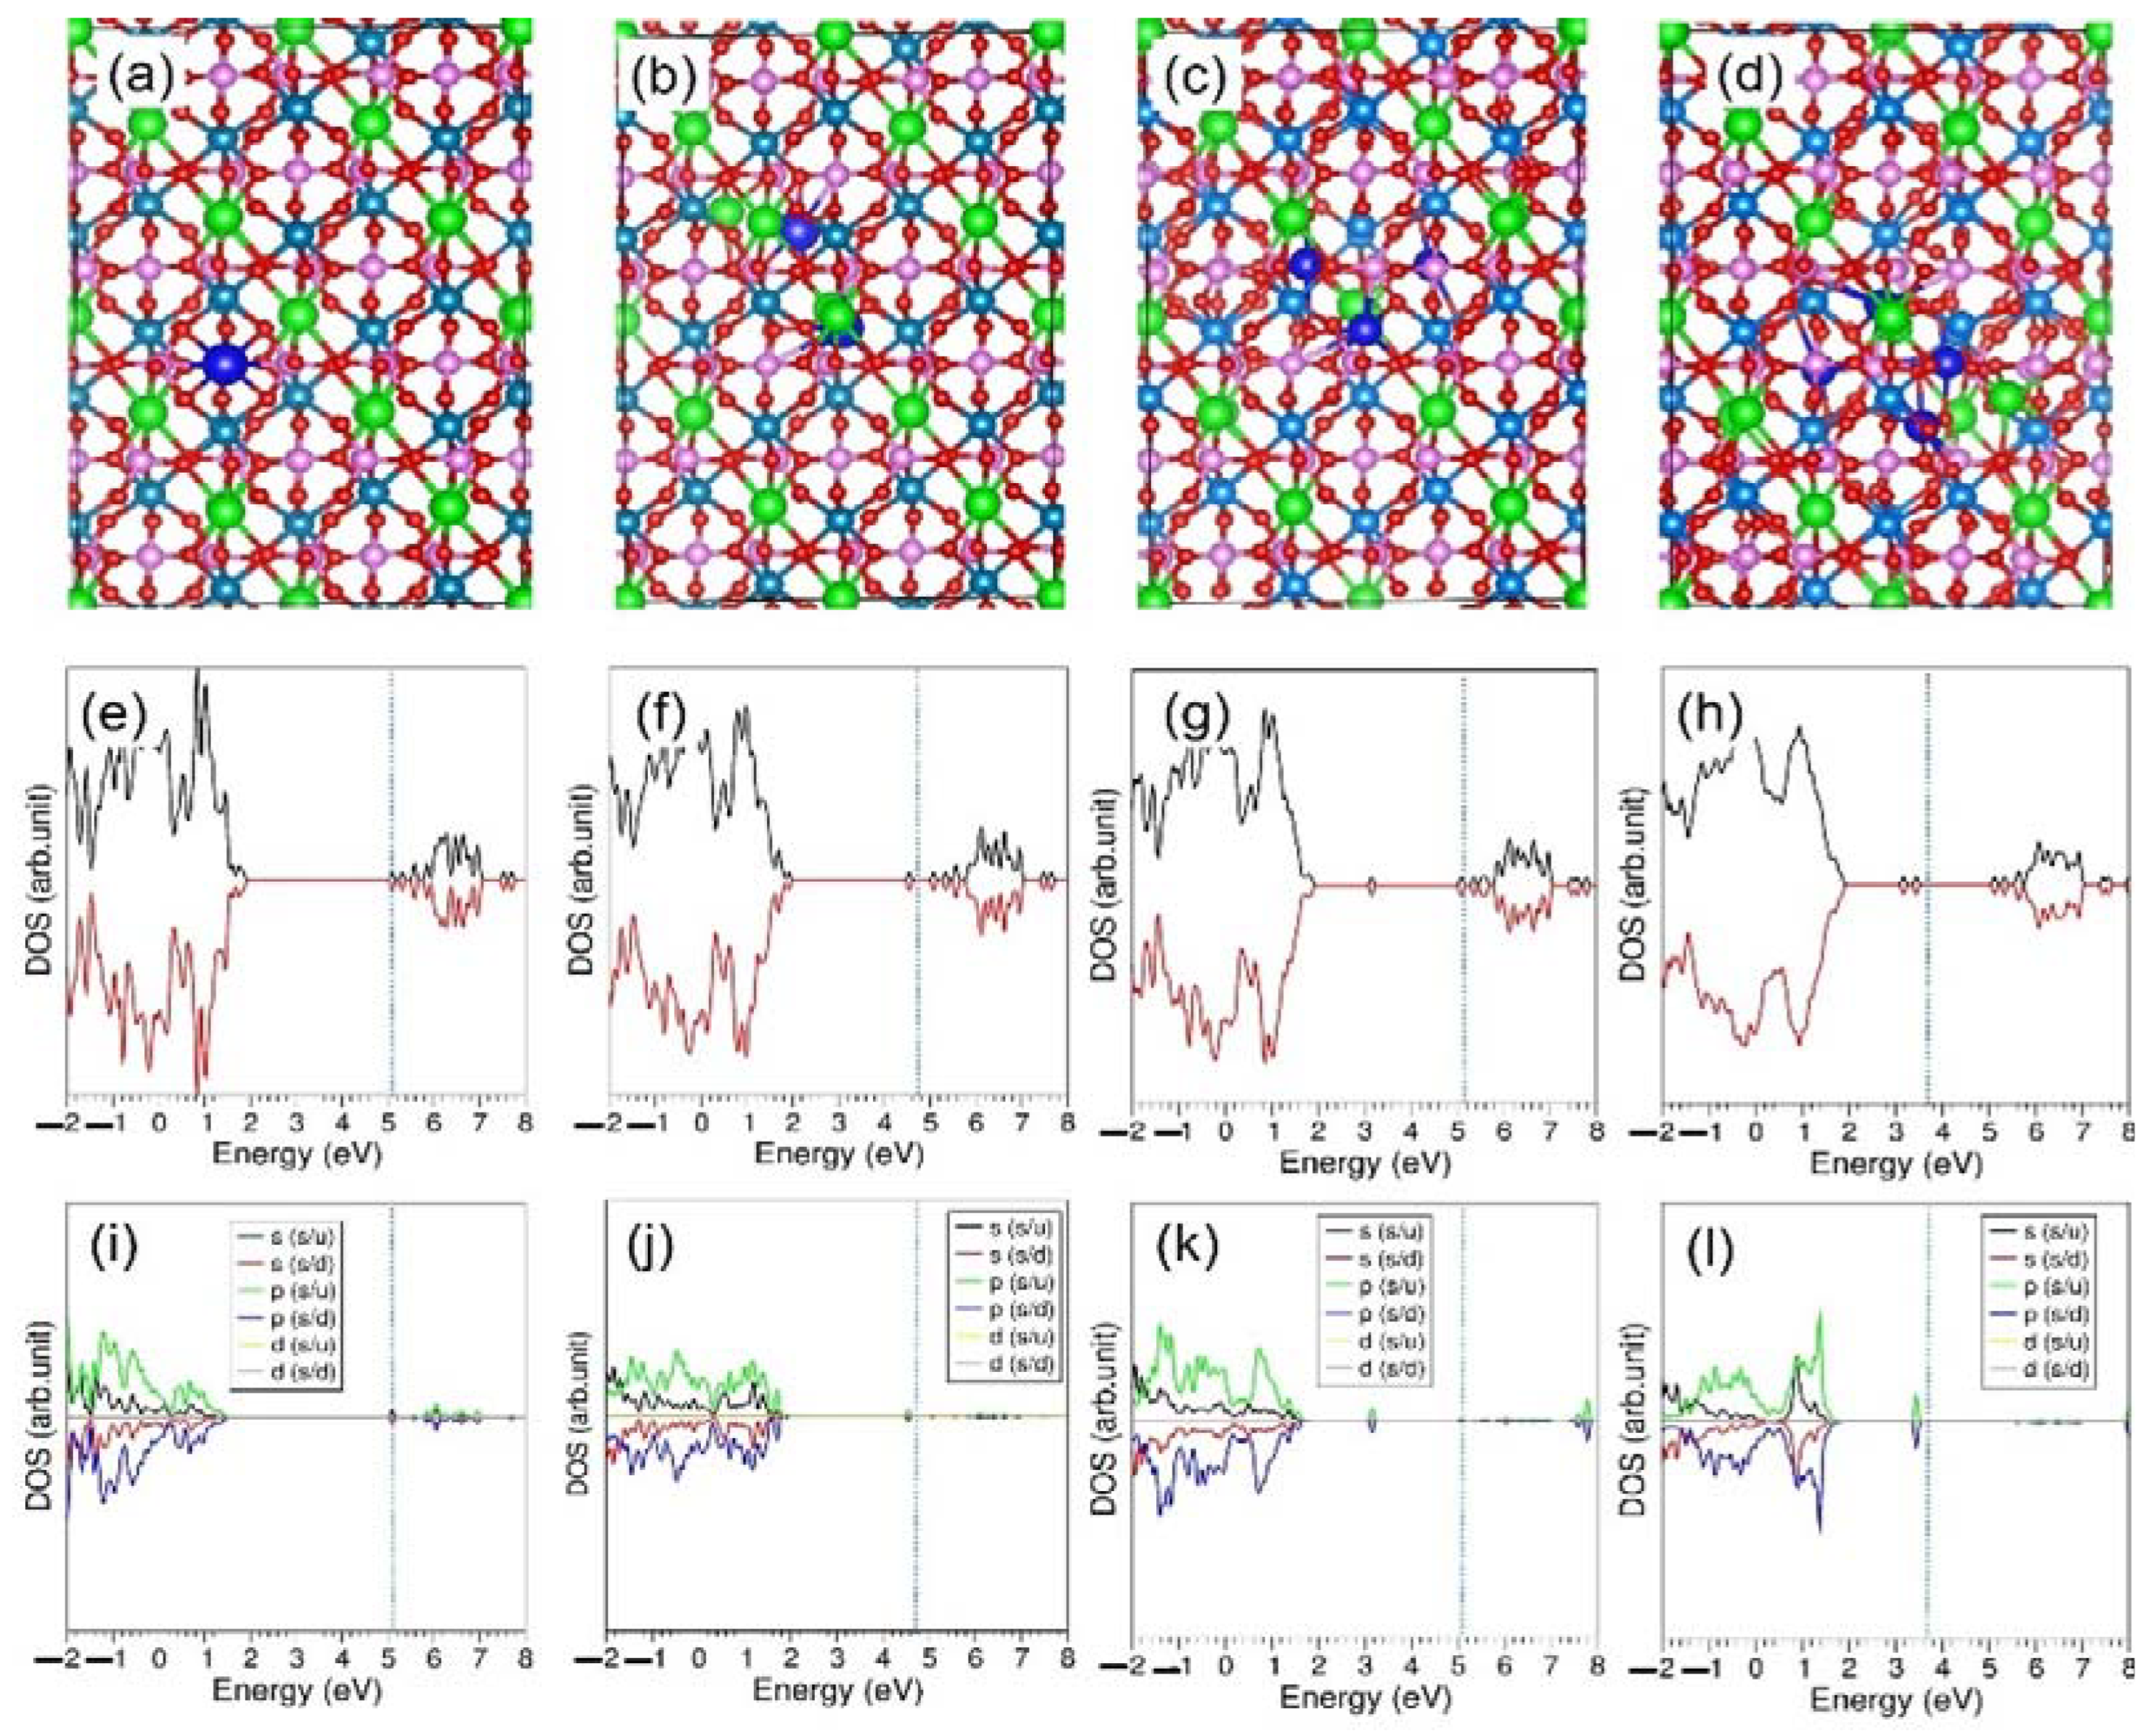
Table 3 reports the calculated defect energies. The calculations show that the most prominent defect in this material was the Li Frenkel defect (0.75 eV/defect). The concentration of this defect was higher than those of the other defect processes. In particular, Li vacancies in the material facilitate vacancy-assisted Li-ion migration. The second most favorable defect was the Ge-P anti-site defect cluster (1.26 eV/defect). This defect cluster was formed by the aggregation of isolated defects with a binding energy of −0.75 eV. Anti-site defects have been observed in many as-prepared oxide materials [
41,
42,
43]. Both experimental and theoretical studies have shown that this defect would change the properties of materials [
44,
45,
46]. The Li-Ge anti-site defect energy was high due to the charge difference between Li
+ and Ge
4+. The Li
2O partial Schottky energy was relatively low (3.10 eV/defect). Other Frenkel and Schottky defect energies were high (>4 eV), meaning that the defects were not significant in this material at room temperature.
3.3. Diffusion of Li Ions
Materials that exhibit a high Li-ionic conductivity are important in the construction of promising Li-ion batteries. The experimental determination of long-range Li-ion diffusion pathways is generally challenging. Computational simulation studies have been useful in predicting the diffusion pathways or validating the pathways determined in experimental studies. For example, the Li-ion diffusion pathway and its migration barrier in Li
1+xAl
xTi
2−x(PO
4)
3 as calculated by Case et al. [
47] were in excellent agreement with the corresponding experimental observations [
19,
48].
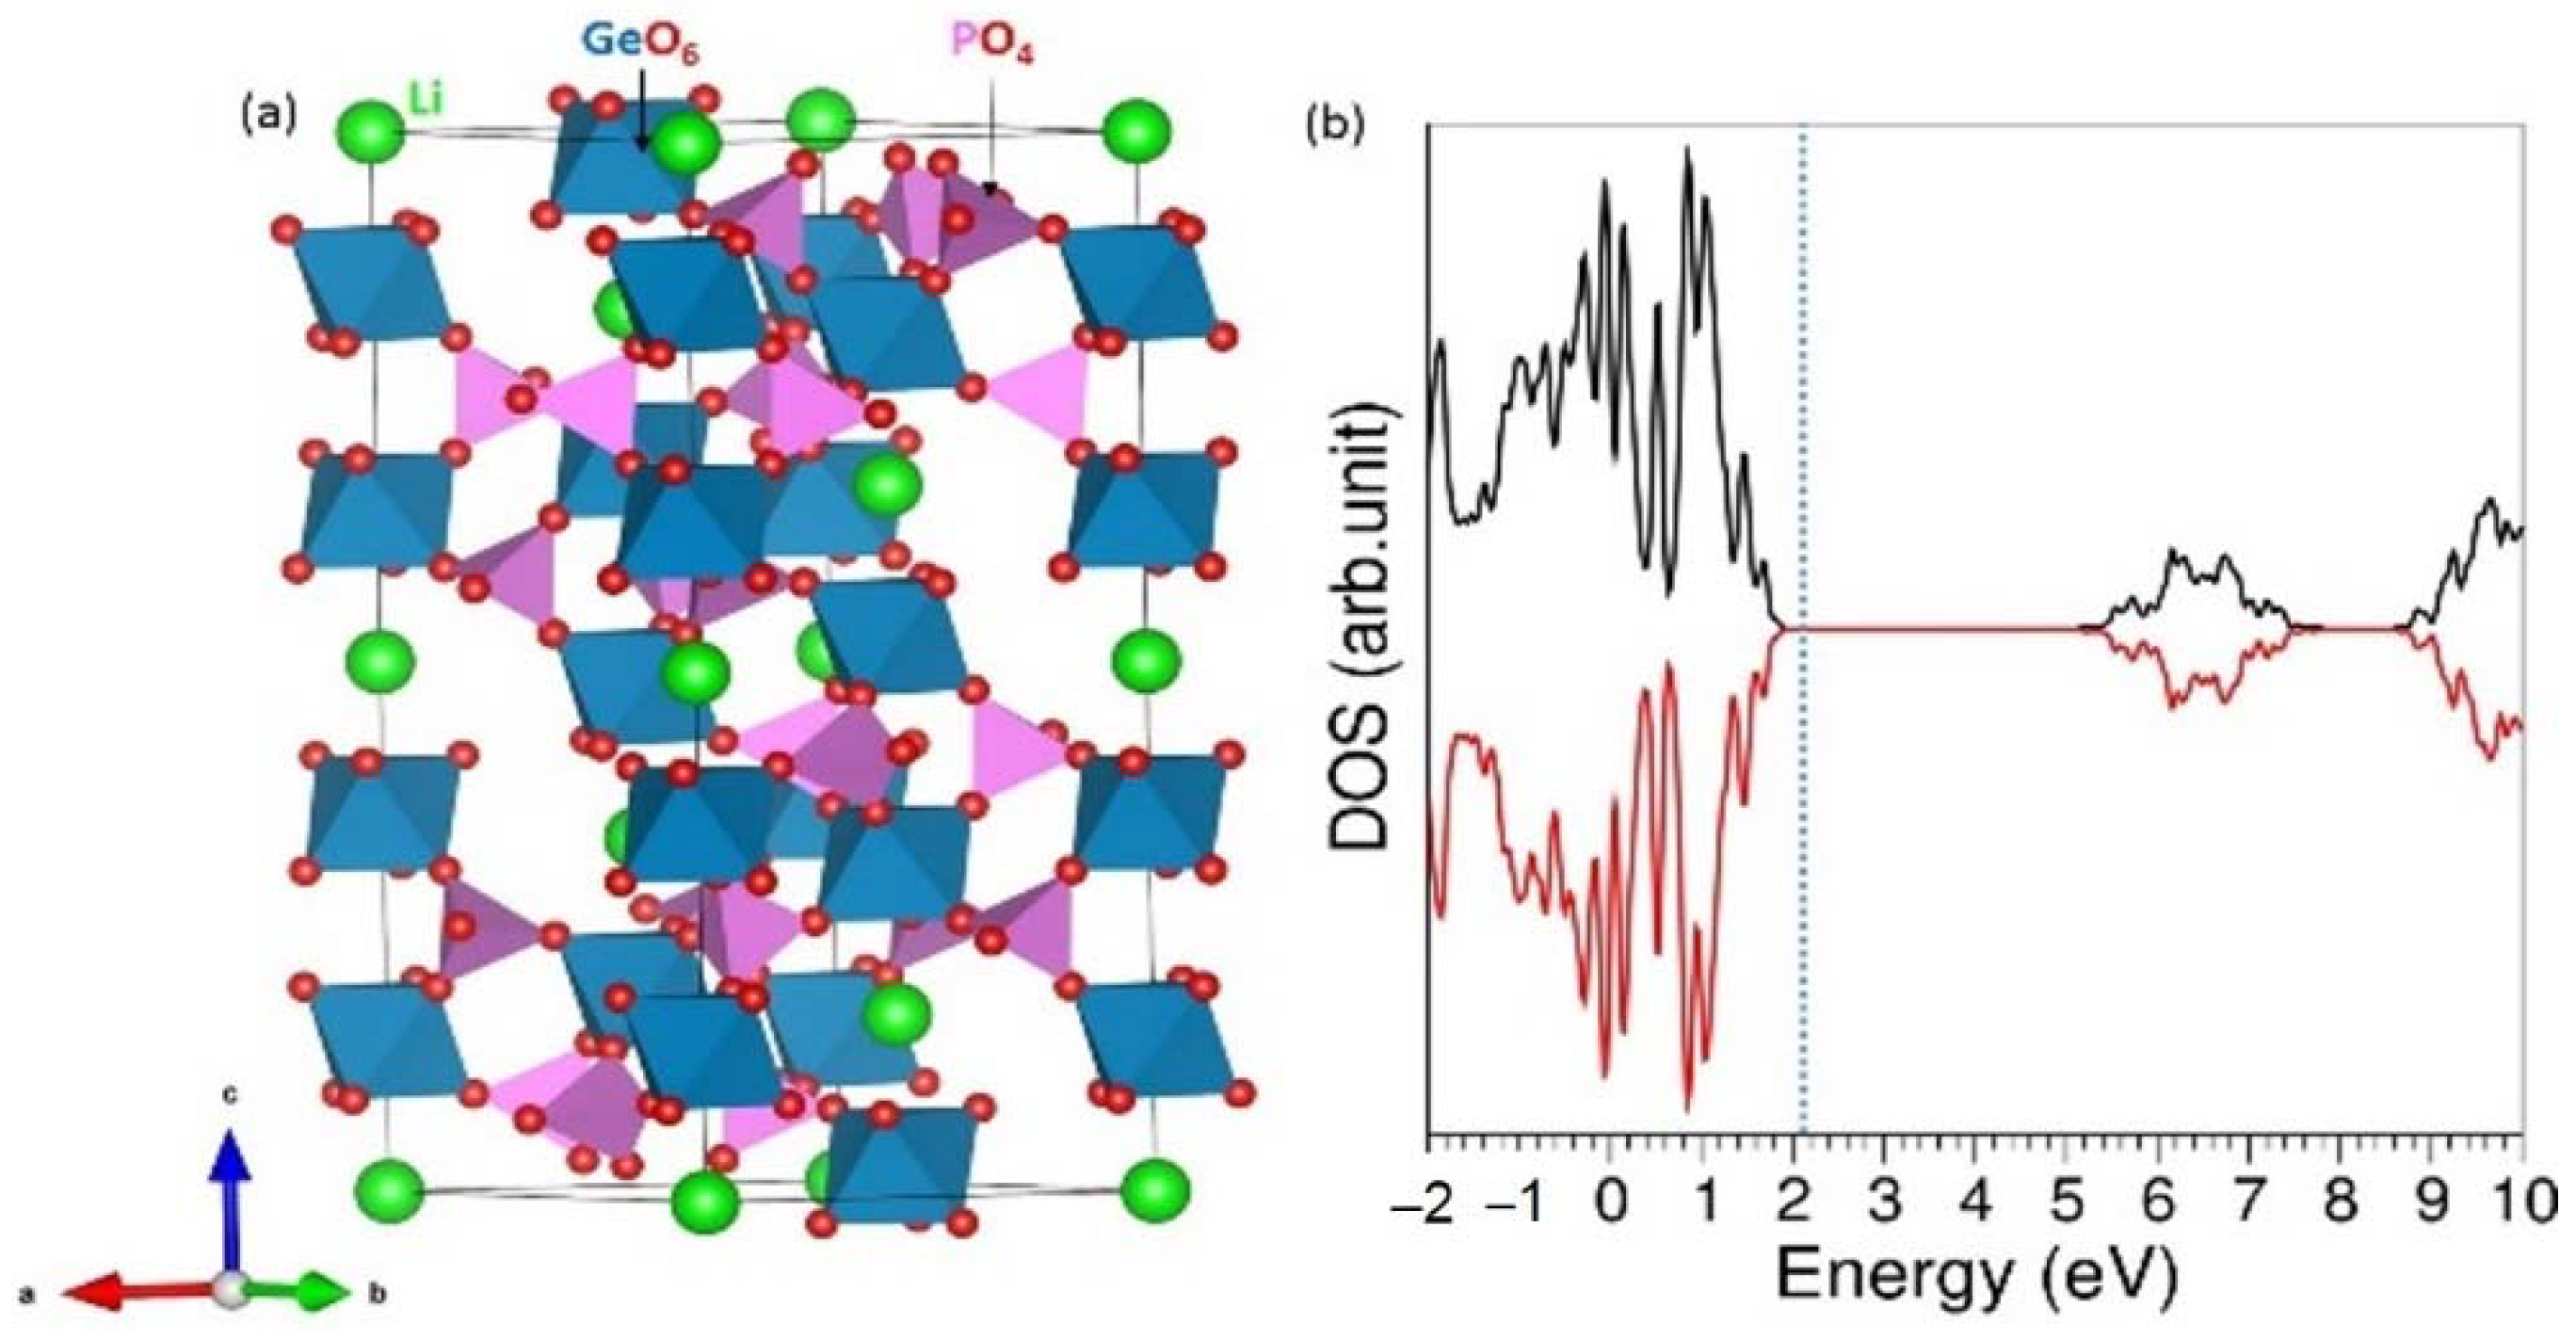
Here, a classical simulation was employed to examine the diffusion of Li ions. We identified a local Li hop with a jump distance of 5.89 Å and calculated its vacancy-assisted migration pathway and activation energy. The activation energy for this hop was 0.44 eV. This Li hop was extended through the lattice to construct a long-range Li-ion diffusion pathway. This resulted in a three-dimensional pathway, as shown in
Figure 2a. The energy profile diagram (see
Figure 2b) shows the activation energy calculated for this local Li hop. As this long-range diffusion pathway consisted of only one Li hop, the overall migration barrier was also 0.44 eV. The experimental activation energy of the Li ions in LiGe
2(PO
4)
3 reported by Martínez-Juárez et al. [
49] was 0.60 eV. In another experimental study by Nikodimos et al. [
15], it was reported that the activation energy was 0.286 eV, and the DFT-based calculation by the same authors revealed an activation energy of 0.329 eV. The activation energy calculated in this study was between two experimental values and was closer to the value calculated in the DFT simulation. Nevertheless, this material exhibited high Li-ion conductivity.
3.4. Solutions of Dopants
Ionic dopants are generally used to increase the ionic conductivity and chemical and mechanical stability of materials. Here, we considered a range of dopants to screen and predicted promising dopants that can be of interest for future experiments. For the dopant calculations, a classical simulation was employed. Charge-compensating defects, such as interstitials, vacancies, and lattice energies, were used to calculate solution energies. In the electronic supplementary information (ESI), the Buckingham potentials used for the oxides of dopants are listed (see
Table S1).
First, alkali dopants (M = Na, K and Rb) on the Li site were considered. The following reaction equation explains the doping process.
The most favorable dopant was Na
+, with an exothermic solution energy of −0.90 eV (
Table 4). This was due to the ionic radius of Na
+, which is close to that of Li
+ (0.76 Å). There was a gradual increase in the solution energy with the increase in the ionic radii of the dopants. Both K
+ and Rb
+ ions exhibited endoergic solution energies. A possible doped configuration that can be synthesized is Li
1-xNa
xGe
2(PO
4)
3 (x = 0.0–1.0).
The relaxed structure of Na-doped LiGe
2(PO
4)
3 is shown
Figure 3a. The doped Na atom forms a distorted octahedral structure (NaO
6) with longer Na-O bond distances than Li-O bond distances in the LiO
6 octahedral structure. As mentioned earlier, this is due to the fact that the ionic radius of Na
+ is larger than that of Li
+. The DOS plots show that the doping had a negligible impact on the electronic structure and that there were no additional states present in the gap.
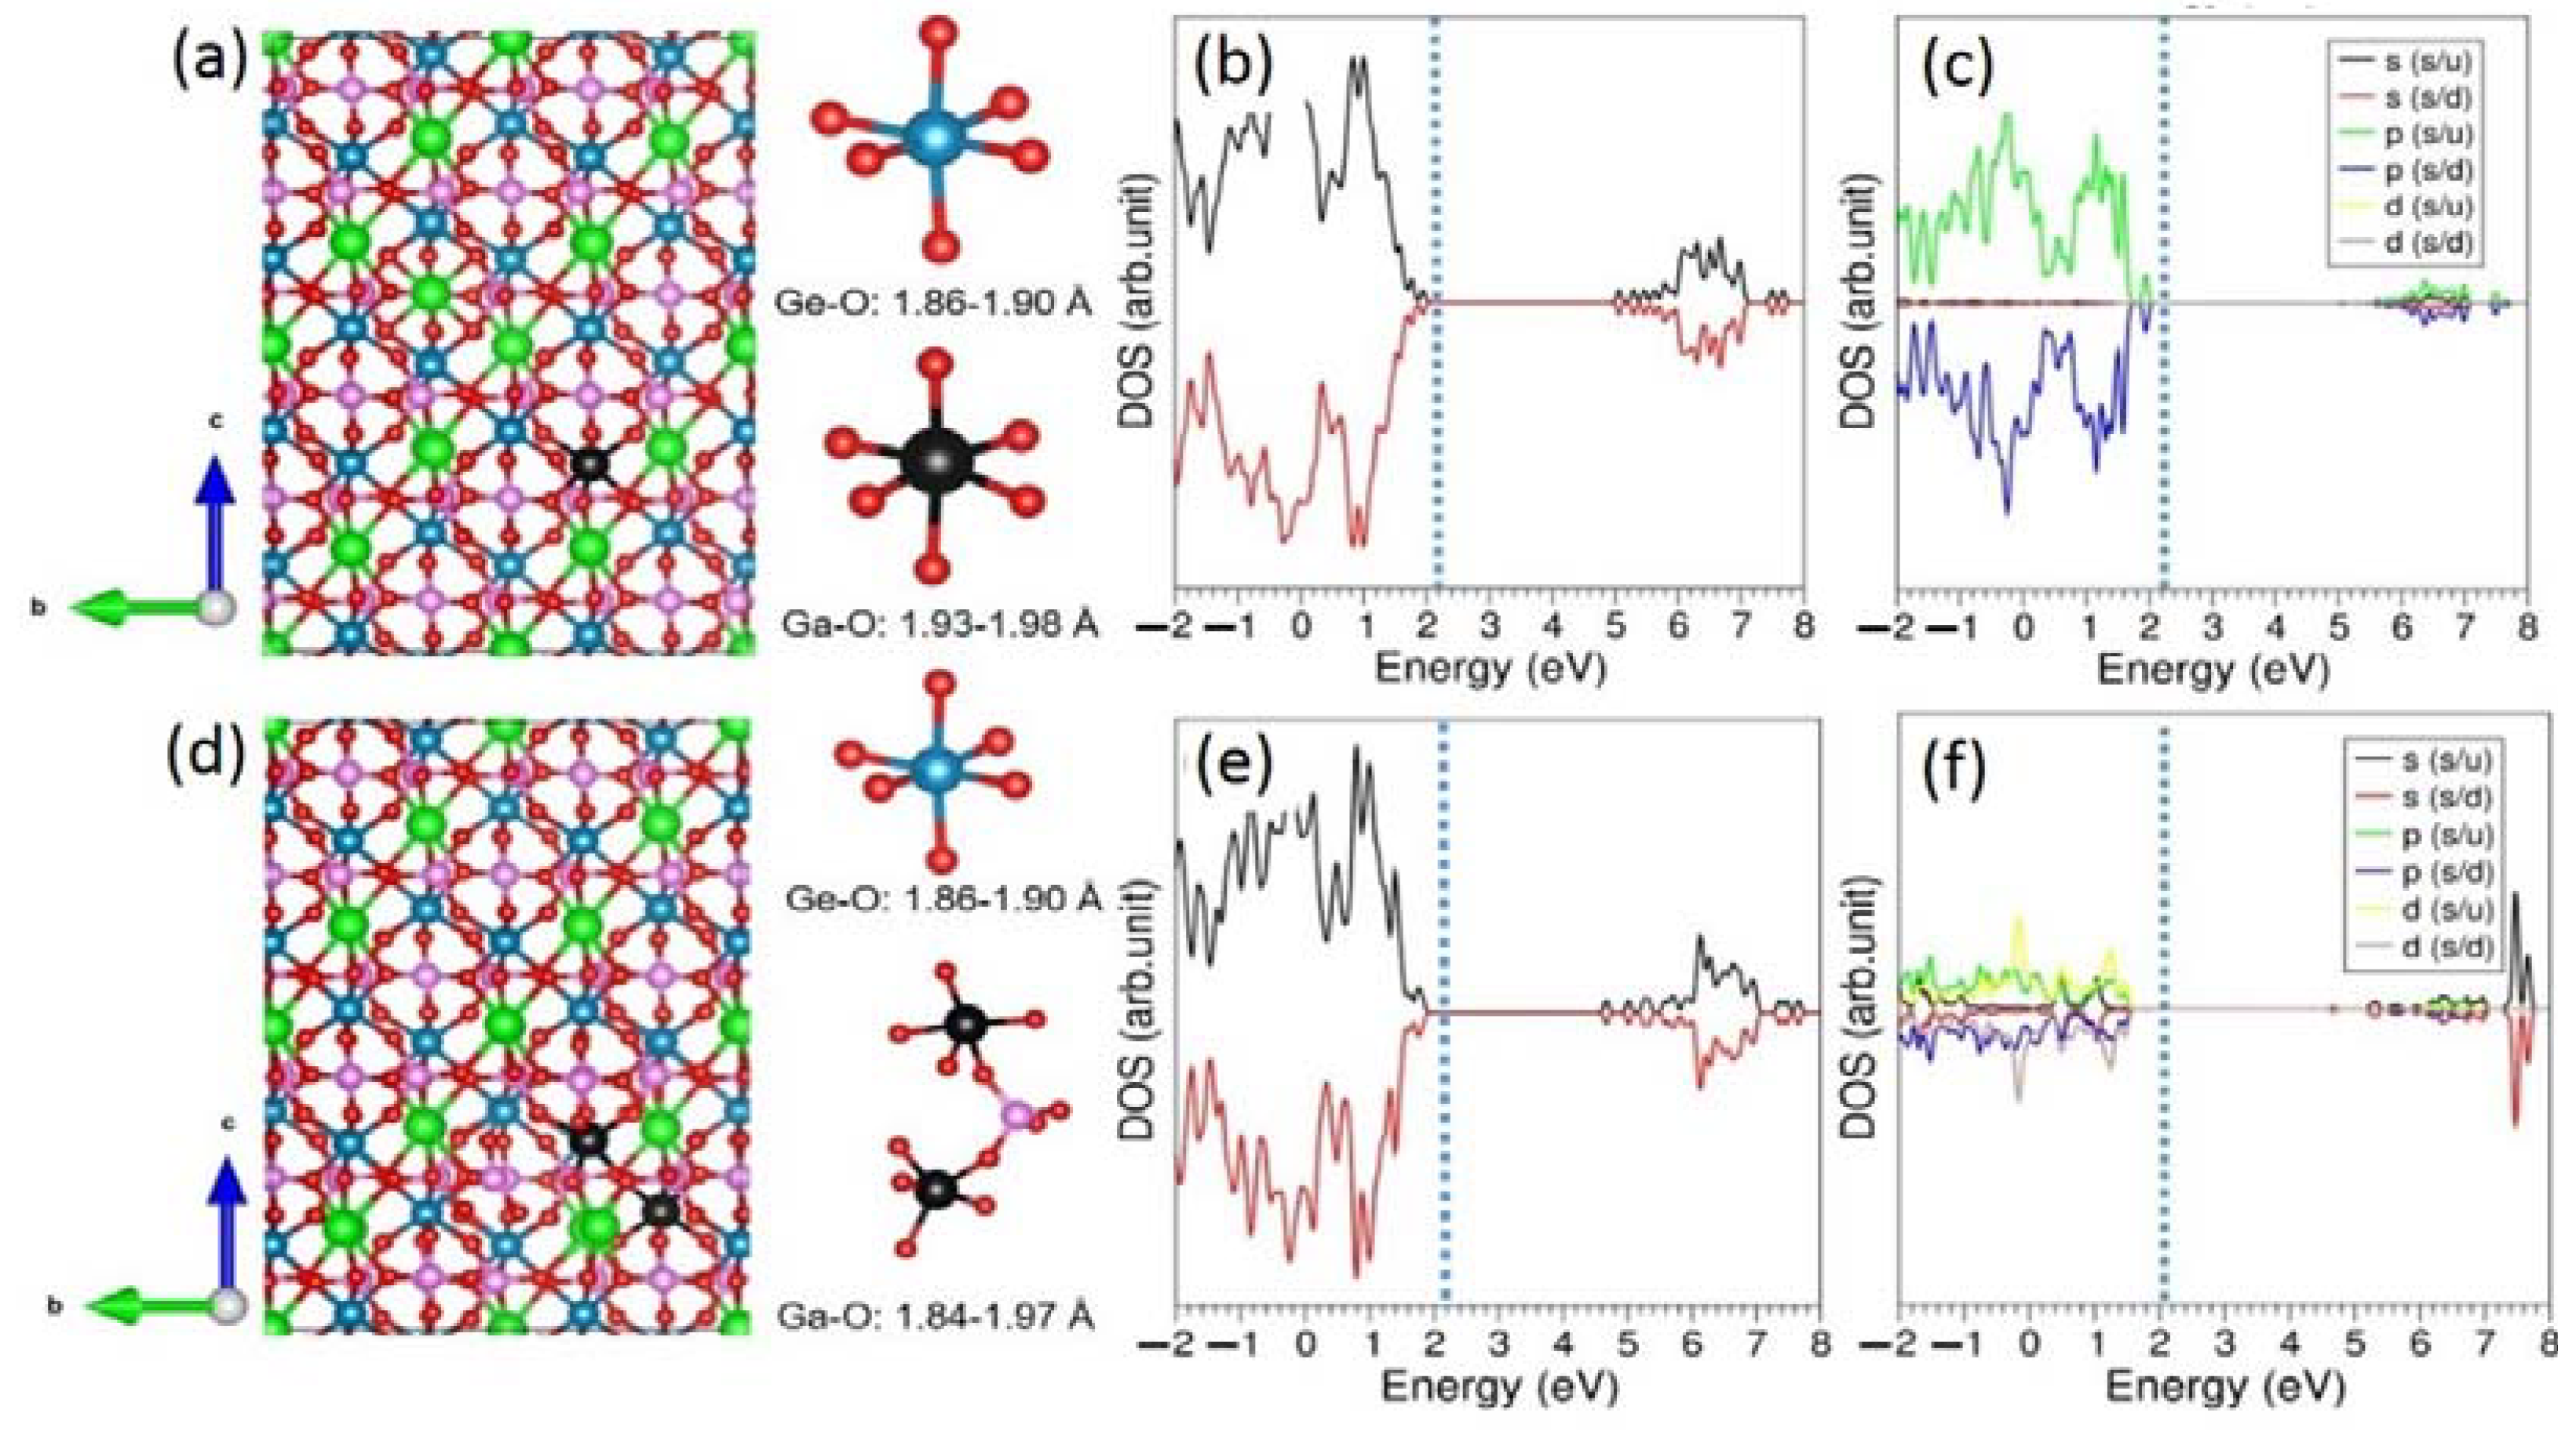
Next, we considered the doping of trivalent dopants (M = Al, Ga, Sc, In, Y, Gd, and La) on the Ge site. This doping process can create additional Li in the form of interstitials in the lattice according to the following equation. The presence of additional Li can increase the capacity of batteries.
The most promising dopant was Ga
3+, and the solution energy for this dopant was 2.20 eV (see
Table 5). The solution energy calculated for Al
3+ was higher than that calculated for Ga
3+ by only 0.14 eV. The favorability of both dopants (Ga
3+ and Al
3+) was due to the fact that their ionic radii matched closely with the ionic radius of Ge
4+ (0.53 Å). The solution energy gradually increased with the increase in the ionic radius. The most unfavorable dopant was La
3+, and its solution energy was 4.28 eV.
The same doping process can introduce oxygen vacancies, as explained in the following reaction equation.
The solution energies were higher for this process than those calculated for the process in which Li interstitials acted as charge-compensating defects (see Equation (13)). This indicates that the concentration of oxygen vacancies will not be high at room temperature. Although the solution energies were larger than 5 eV for all dopants, the candidate dopant was Ga3+. The trend in the solution energy was the same as that calculated for the previous process.
The relaxed structures of Ga-doped LiGe
2(PO
4)
3 and electronic structures are shown in
Figure 4. The Ga-O bond distances in the GaO
6 octahedral unit were larger than the Ge-O bond distances. The band-gap value was not altered much upon doping. The atomic DOS plots show that states arising from Ga were mainly localized in the valence band (see
Figure 4c,f).
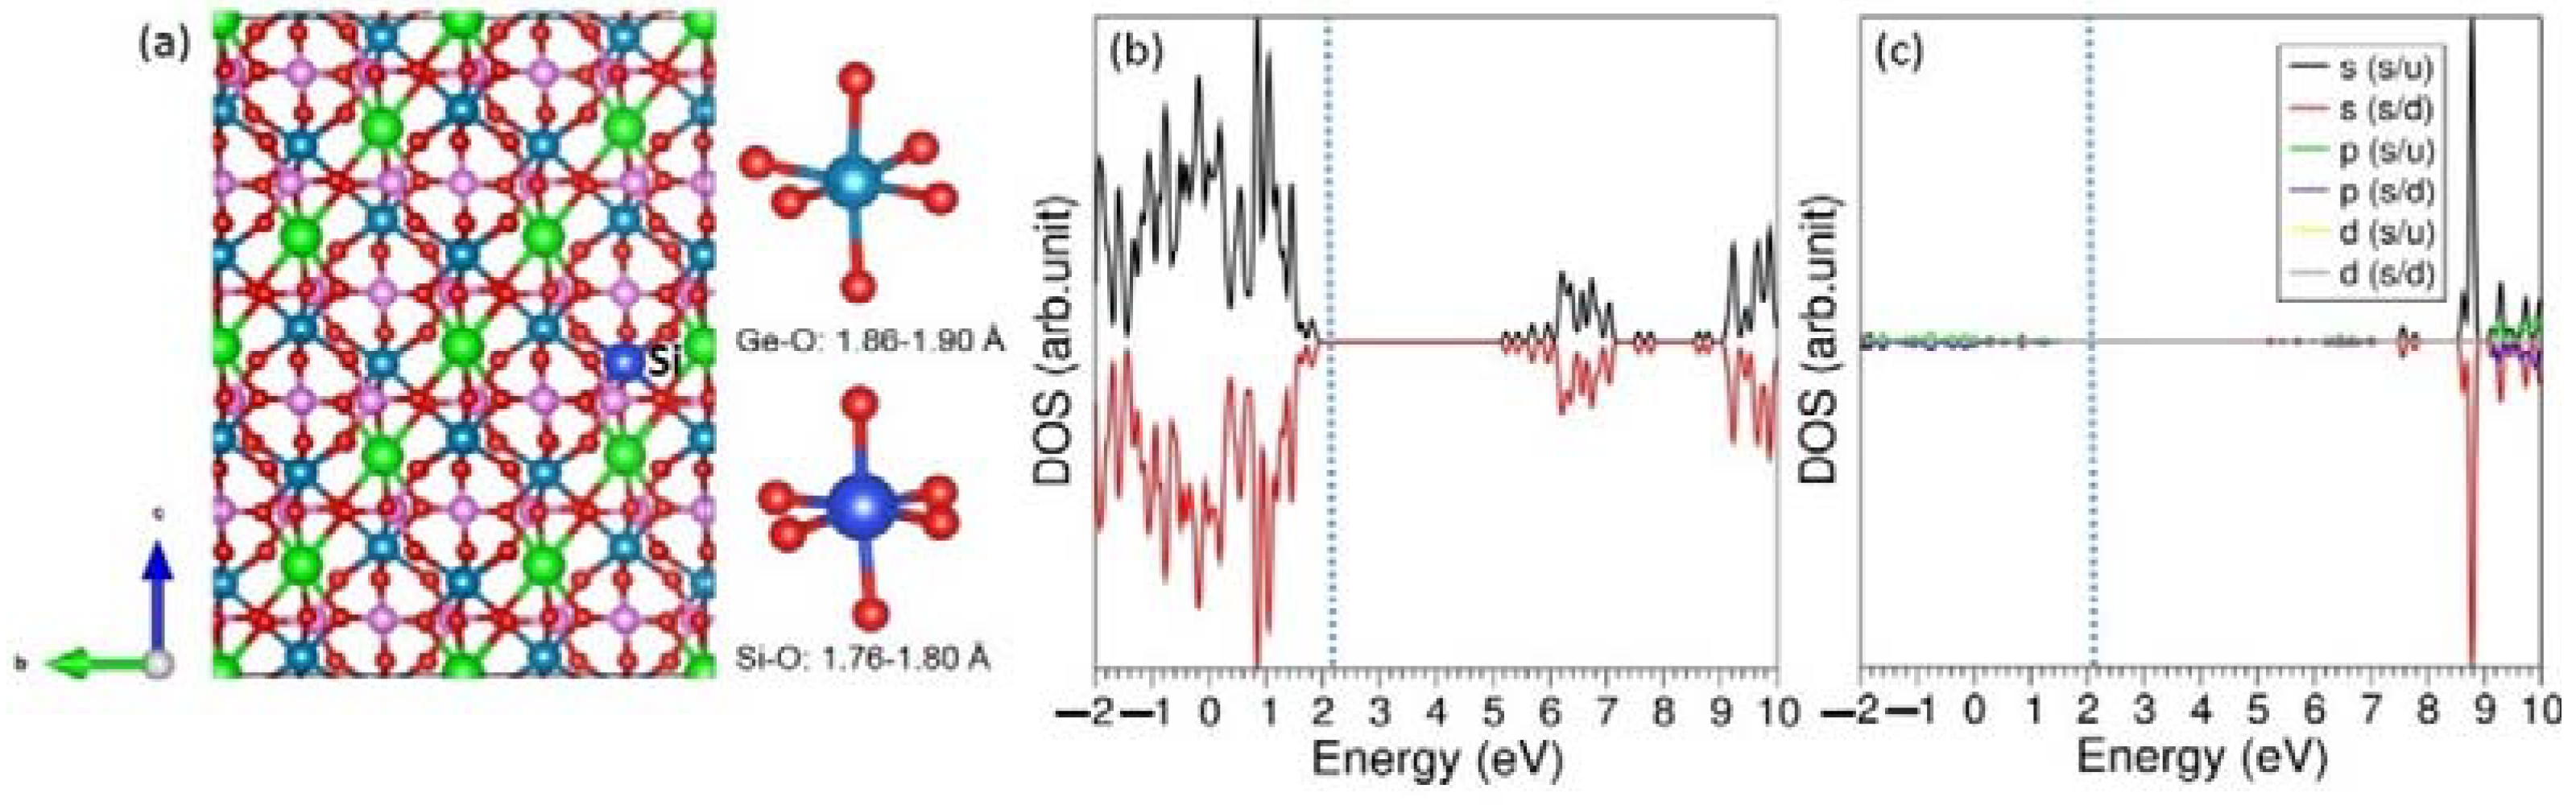
Finally, tetravalent dopants (Si, Ti, Sn, Zr, and Ce) were substitutionally doped on the Ge site. The solution energies were calculated using the following equation.
The solution energy calculated for Si
4+ was 0.67 eV (see
Table 6). The other dopants exhibited higher solution energies. Thus, Si
4+ was the most promising. This was partly due to the fact that the ionic radius of Si
4+ closely matched with that calculated for Ge
4+. The next most favorable dopant was Ti
4+. Its solution energy was almost double the solution energy calculated for Si
4+. Both Sn
4+ and Zr
4+ had solution energies that were closer to each other. The solution energy calculated for Ce
4+ was highly endoergic, and the doping of this cation required a high temperature.
The relaxed structure of Si-doped LiGe
2(PO
4)
3 and its electronic structure are shown in
Figure 5. The Si-O bond distances in SiO
6 unit are shorter than Ge-O bond distances in GeO
6 unit. This is partly owing to the fact that the ionic radius of Si
4+ (0.40 Å) is smaller than that of Ge
4+ (0.53 Å). The total and atomic DOS plots show that the insulating nature of this material is unchanged.


