Abstract
Magic angle intensity decay and dynamic fluorescence anisotropy measurements were made on the binary solvent system composed of ethylammonium nitrate ([N2,0,0,0+][NO3−], EAN) + methanol (MeOH) across the complete EAN mole fraction range (xIL = 0–1) using the neutral dipolar solute coumarin 153 (C153) at 295 K. Stokes–Einstein–Debye (SED) hydrodynamic theory was used as a model framework to assess the C153 rotational reorientation dynamics. Departure from stick SED prediction was observed (in contrast to literature reports that used cationic or anionic dyes) and indicated a significant influence of domain nanoheterogeneity on probe dynamics. Steady-state spectroscopy indicated minimal changes in spectral peak and width with mole fraction, except at xIL = 0.3 where absorption widths decreased by ~170 cm−1, signaling that C153 sensed a change in solution heterogeneity. Magic angle intensity decays corroborated the steady-state observation and the excited-state lifetimes showed a marked change from xIL = 0.2–0.4 where EAN-EAN interactions became notably more significant. C153 average rotation times () showed significant solvent decoupling with increased EAN. The rotational data were fit to a power law dependence, , where p = 0.82, demonstrating the presence of dynamic heterogeneity in the EAN/MeOH solutions. With increased EAN, rotation times showed that the heterogeneity became increasingly more significant since the rotation times systematically decreased away from the hydrodynamic stick limit.
1. Introduction
The canonical ionic liquid, ethylammonium nitrate (EAN, Scheme 1), was reportedly identified by Paul Walden more than a century ago. Since then, room temperature ionic liquids have been intensively studied and become a very popular medium for synthetic chemistry and various applications [1,2,3,4,5]. Protic ionic liquids (PILs) are among the most studied and reviews have discussed structure-property relationships, physicochemical properties, electrochemical, chromatographic and synthetic applications [3,6]. There is a large body of experimental and computational work that has communicated physicochemical properties [3,6,7,8,9,10,11,12,13], and described cosolvent interactions with organic solvents [7,8,9,10,12,14,15].
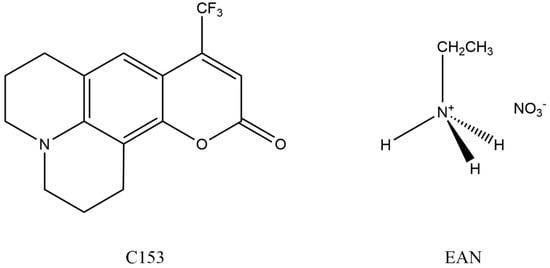
Scheme 1.
Structures of coumarin 153 (C153) and ethylammonium nitrate (EAN).
Solvation in ILs is often probed using a dye molecule to measure spectral shift (absorption or emission) and Stokes shift changes upon solvent reorganization. The time dependence of the Stokes shift is determined from time-resolved emission spectra (TRES) and gives some insight on the overall probe solvation dynamics. Dynamic anisotropy measurements yield a different measure of solute-solvent interactions through examining the viscosity coupling (microscopic friction) to the solvent system. In IL systems, solvation dynamics have been described using computer simulations [15,16,17,18,19,20], Stokes shift measurements [21,22,23,24,25,26,27,28], and rotational dynamics [21,22,29] measurements. The basic starting point for comparisons from these measurements is to use the results to evaluate the solution behavior against simple hydrodynamic theory, e.g., Debye-Stokes-Einstein (DSE) behavior [30]. According to the DSE description, a solute should experience the viscous drag of the first solvent shell as it moves through solution. Departures from hydrodynamic behavior can be correlated to many phenomena such as specific solute-solvent interactions (e.g., hydrogen bonding, electrostatic interactions, solvophobic interactions) [31] and “jump” mechanisms [32,33] where a molecule moves in a rapid angular (rotational) manner, but does so with nondiffusive motion, usually on an ultrafast time scale.
In simple dipolar solvents, reorganization dynamics are linked to solute coupling primarily through dipole–dipole forces, whereas the dynamics in IL and IL + cosolvent are more complex resulting from solute, cosolvent, and ion pair interactions. In neat ILs, ion–dipole (i.e., IL-solute) forces are typically the most significant interactions [26,34,35] but solvent-solvent interactions such as occurs through ion–ion interactions, dispersion forces, and dipolar forces also contribute to the overall IL solvation characteristics [14,20,26,36,37]. A molecular cosolvent adds more complexity by introducing additional forces that depends on the nature of the chosen cosolvent/IL pair, which has been discussed using a theoretical perspective [27,28]. In both neat ILs and IL/solvent mixtures one expects the solvation dynamics to be responsive to the varying types of molecular interactions; however, this is not always the case [24,25,35,38,39]. Samanta, using coumarin 153 (C153, Scheme 1) reported that nonpolar solvents added to 1-butyl-3-methylimidazolium hexafluorophosphate (bmim+PF6−) resulted in faster C153 rotational dynamics because of an increase in solution fluidity [38]. While the use of nonpolar solvents might be expected to have less impact on C153 rotational dynamics (from solvent coupling), one would expect that polar solvents would strongly influence the dynamics. However, Sarkar observed that for C153 rotational dynamics the addition of both protic and aprotic type polar solvents added to 1-hexyl-3-methylimidazolium hexafluorophosphate (hmim+PF6−) resulted in faster probe rotational reorganization [39]. Whether the solvent was nonpolar, protic, or aprotic, it appears that the primary effect was assigned to a viscosity effect as opposed to invoking specific solute/cosolvent/IL interactions. Nonetheless, it was noted that the C153 rotational dynamics in binary IL + polar solvent mixtures was less pronounced compared to the binary mixtures of IL + aprotic solvent [39]. In other work, Maroncelli’s group showed that the C153 solvation times in several IL classes (imidazolium, ammonium, and phosphonium) follows a well-defined linear correlation with viscosity that was a linear extension of that observed in conventional dipolar solvents [24,25]. To date, the role that IL-IL and/or IL + cosolvent interactions play in modified IL solutions remains a topic interest [2,7,15,16,18,40,41,42,43,44].
While there has been much work done on EAN using experimental and computational approaches, there are still relatively few reports that have examined the direct influence of a simple alcohol cosolvent on the resulting solution dynamics using simple hydrodynamic theory as a means of assessing the experimental observations. Dynamical measurements from extrinsic probes provides a useful perspective for determining the range of effects of the molecular interactions that govern probe-solvent interactions. In a very recent report, Garrett-Roe and coworkers identified two sub-ensembles in EAN from SCN− vibrational and rotational relaxation using 2-D IR spectroscopy, giving yet further evidence of the dynamical heterogeneity that is observed in ILs [43]. Given the inherent nanoheterogeneity within ILs and IL solutions, we set upon the task of evaluating whether hydrodynamic theory provided a good description against which we could assess probe rotational motion in the EAN/MeOH system. We also have examined the influence of solution organizational changes on probe rotational reorientation dynamics through the variation of EAN mole fraction using methanol as a diluent. For all optical spectroscopy reported in this work (both steady-state and time resolved fluorescence), the neutral solvatochromic probe C153 was used to measure the effects of compositional change in the EAN + methanol (MeOH) binary mixture as the solution was concentrated in EAN. C153 was chosen for its well-characterized emission and its well-known sensitivity to its chemical environment [30,45,46]. We note here that Sarkar and co-workers have performed similar measurements in EAN/MeOH, where they examined the solution dynamics using the cationic dye rhodamine 6G and the anionic dye fluorescein [47]. These probes would be expected to probe specific regions within the solution structure because they are charged dyes, and therefore may additionally be influenced by specific interactions. For our measurements, we chose to use the C153 dye for the additional reason that it is a neutral dye, and although it will experience hydrogen bonding interactions, the added complication of charged interactions is not present. Herein, we begin with a presentation of the bulk property characterization in the form of viscosity measurements. We then turn to describe our spectroscopic observations, where we report the solution effects on the steady-state spectroscopy and subsequently the time-resolved fluorescence results including magic angle intensity decays and decays of fluorescence anisotropy (rotational relaxation). The latter forms the main framework for the solvation dynamics discussion in the EAN/MeOH solvent system.
2. Materials and Methods
Coumarin 153 (laser grade) was purchased from Exciton, Lockbourne, OH, USA, stored under desiccation, and used as received. EAN was from IoLiTec, Heilbronn, Germany and dried in a vacuum oven for 48 h at 40 °C prior to use. MeOH was HPLC grade from Fisher Scientific. To prepare a mole fraction solution, an aliquot of a stock 1 mM C153/MeOH was added to the 1 cm path length 23-Q-10 Spectrosil® quartz cuvette (Starna Cells, Inc., Atascadero, CA, USA), the desired amount of EAN was added and massed on a 0.1 mg balance (Mettler Toledo, Columbus, OH, USA, model XS104) and then diluted with MeOH. The C153 concentration was 10 μM (optical density was always less than 0.1). The cuvette was always kept tightly stoppered to minimize any MeOH evaporative losses. The cuvette was repeatedly inverted until the solution was single-phased and equilibrated. All spectroscopic measurements were made on this solution prior to micro-pipetting additions of either MeOH or EAN to make the next mole fraction solution until the cuvette was full. In this way, we were able to minimize solution preparation errors and economize on component consumption. Solutions were always single-phased and optically transparent at all mole fractions studied. The uncertainty in mole fraction was less than ± 0.5%.
The water content of each solution component was determined by Karl-Fischer coulometric titration using a Mettler Toledo C20 titrator equipped with a DM 143-SC double platinum pin electrode at 295 K. Measurements were performed in at least triplicate and average values were MeOH water content was 130 ± 2 ppm and EAN was not more than 500 ± 5% ppm water. Neat and cosolvent modified EAN viscosities were measured using an Anton-Paar AMVn automated rolling ball viscometer. Rolling angles were accurate to 0.1° and temperature was controlled to ±0.02 K. Quartz capillary tubes were calibrated with Koehler ISO 17025 Viscosity Reference Standard, type S60 or type S600. A typical viscosity measurement varied temperature from 288 to 323 K and used six replicated (12 total rolls) at each temperature. Data were collected cyclically starting at low temperature, increasing to the maximum, and then cooling to the starting temperature. This allowed us to evaluate reproducibility and spot hysteresis effects. For all measurements, viscosity uncertainty was typically ±1–2% and reproducibility was ±0.5–1%.
Steady-state absorption and fluorescence were measured with a Perkin-Elmer Lambda 800 UV-Vis spectrometer with 2 nm resolution and a Horiba Scientific (Piscataway, NJ, USA) Fluorolog-3 fluorescence spectrometer with 2 nm resolution, respectively. The fluorimeter is equipped with a single grating excitation monochromator and a double grating emission monochromator for enhanced stray light rejection. All spectra were blank subtracted and corrected for instrument responses. We have described our time-correlated single photon counting (TCSPC) instrument previously [21,42]. Briefly, photons from a 405 nm NanoLED (405-L) high output diode laser were passed through a polarizer prior to entering the sample. Emission photons were passed through an automated Glan–Thompson polarizer set at “magic” angle (54.7°) for lifetime measurements and spectrally resolved with the double grating monochromator and detected with an air-cooled IBH TBX 850 detector. For anisotropy measurements, the emission polarization was acquired parallel and perpendicular to the excitation polarizer. The instrument response function was measured using a scattering solution and was on the order of 170 ps. Time calibration of the counting electronics was 7.16 ps per channel. All decay data were measured at the peak of the steady-state emission with emission slits between 4–6 nm. Intensity decay data were fit to a sum of exponentials models using an iterative reconvolution algorithm within the IBH DAS6 decay analysis software and the estimated effective time resolution was ~50 ps, which was also confirmed from replicate measurements. Reduced chi-squared values (χr2) for a fit was judged to be acceptable if χr2 < 1.2.
3. Results
3.1. Bulk Properties-Viscosity
Viscosity was measured over a temperature range of 288–323 K and for all mole solution fractions, xIL = 0 to 1. Figure 1 summarizes the results in two ways; the upper panel shows the viscosity dependence on EAN mole fraction and the lower panel presents the temperature dependence for all mole fractions. Both sets of data are typical of what is observed in IL/cosolvent solutions. The lines in each panel are regressions to the respective data sets. The mole fraction dependence in the upper panel appears linear only for xIL ≥ 0.6, where the viscosity decreased by a factor of ~4.5. The linearity in this mole fraction range was well represented by a linear regression of the form log(η) = (2.883 ± 0.085) log(xIL) + (1.686 ± 0.011). While it is certain that ion association plays a significant role in EAN-rich solution interactions, it seems that viscosity itself is not sensitive to any variations in this region. However, for xIL < 0.6, the viscosity changes by roughly an order of magnitude and Δ log(η) shows a significantly non-linear dependence on xIL. It is important to take note of this non-linearity because this response is indicative of more substantial changes occurring in dilute EAN solution [20,48,49]. The EAN/MeOH mixture in the low EAN concentration region is more strongly dominated by hydrogen bonding between MeOH and the EAN ions and the details from x-ray and neutron scattering provide ample evidence for this observation [49]. From the data here, viscosity appears to vary uniformly above xIL = 0.6. In other words, dilution with MeOH seems to result in a predictable, systematic variation of solution organization, but with an increase in fluidity that is particularly effective below 50 mol% EAN. For completeness, we include the excess viscosities in Supplementary Materials Figure S1. These data were computed from:
where ηmix is the measured EAN/MeOH mixture viscosity, ηEAN and ηMeOH are the pure component viscosities, and xEAN is the EAN mole fraction. ηE values were fitted to a two component Redlich-Kister polynomial (see Supplementary Materials) [50]. Excess viscosities showed negative deviations for all mole fractions with the greatest deviation occurring at xIL = 0.6. Our results are in excellent agreement with results from Sarkar, who also observed a minimum in excess viscosity at exactly xIL = 0.6 in EAN/MeOH [47]. While we cannot infer any specific differentiation between the competing interactions from these data, we can be sure that there is a significant change in bulk composition xIL = 0.6 that likely signals that the MeOH impact has reached a climax as the mixture richens in EAN.
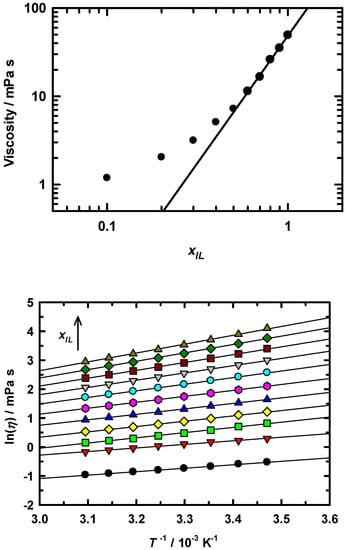
Figure 1.
Upper panel: viscosity dependence on IL mole fraction for EAN/MeOH solutions at 295 K. Line shown is a second order polynomial regression of the data and fits to the functional form: ln(η) = (−1.40 ± 0.25) xIL2 + (5.7 ± 0.26) xIL − (0.47 ± 0.055), r2 = 0.998. Lower panel: temperature dependent viscosities for each xIL solution. Mole fraction is increasing upward across the data set.
In contrast to the mole fraction results, the temperature dependence of viscosity is linear for all mole fractions and at all temperatures (see lower panel of Figure 1). Although we do not examine the temperature dependence of the spectroscopy and dynamics in this report, we are currently working on this as part of an extension to this work. Nonetheless, we have included the temperature dependent viscosity data in part to show that for any single mole fraction the viscosity suggests no obvious temperature effect, e.g., the temperature variation is linear at all mole fractions. It is interesting to note that for a given solution composition (xIL) there seems to be no specific influence from temperature except to increase solution fluidity. The ηE data also show little variation in the overall pattern as a function of temperature, with the observed minimum remaining consistent at xIL = 0.6. However, in addition to the viscosity data, it is useful to examine the activation energies for viscous flow. To compute these values, the viscosity data were modeled using the Arrhenius activation model:
where Ea is the activation energy for viscous flow, R is the gas constant and T is temperature in Kelvins. From these regression slopes, we have computed the activation energy for viscous flow at each solution mole fraction and summarized the results in Figure 2. The linearity of the EAN activation energy is in stark contrast to the non-linear behavior that we observed for the trihexyltetradecylphosphonium chloride (P14,6,6,6+ Cl−)/MeOH system [50]. The structural contrast between these ILs is clearly different and demonstrates the significant contribution of long alkyl chains, which results in substantially enhanced entanglement as neat IL is approached in P14,6,6,6+ Cl− compared to the EAN C2 chains. EAN has comparatively weaker interactions with MeOH than does the phosphonium example as Ea, EAN is approximately 50% that of P14,6,6,6+ Cl−/MeOH at comparable mole fraction solutions. The increase in activation energy with mole fraction supports the perspective of a general increase in dipolar interactions (e.g., ion–ion or ion-molecule association) the bulk solution effect scales well with composition. We note one further point of interest. Closer examination of the activation energies reveals that at xIL = 0.2 and 0.3 the values lie above the linear regression and the uncertainty in these values shows that this deviation is significant. Although the viscosity data do not reveal any extreme deviation, it is clear from the activation energy that the solution composition does reveal subtle differences for these mole fractions.
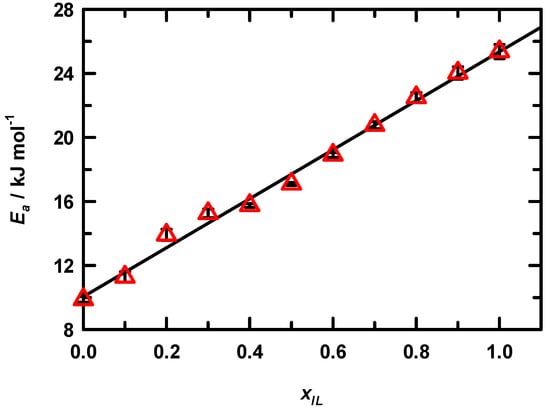
Figure 2.
Arrhenius activation energy for viscous flow in EAN/MeOH solutions as a function of mole fraction. Symbols are sized to represent the experimental uncertainties. Line shown here is a first order polynomial regression, which yields the relation: Ea = (15.30 ± 0.43) xIL + (10.06 ± 0.26), r2 = 0.993.
3.2. Steady State Spectroscopy
Steady-state absorption and emission spectra of neat EAN and C153/EAN/MeOH solutions were measured as a function of xIL in MeOH. A set of representative steady-state emission spectra are presented in Figure 3 for xIL = 0.1, 0.4, 0.6, and 1.0 EAN in MeOH. The spectra here are consistent with what is observed in simple dipolar solvents, and moreover are similar to what is observed in various ILs independent of cation/anion pairings [39,51,52,53]. As usual, spectra are featureless, and the spectra produce the typical log-normal line shapes. The set of spectra shown indicate that on first pass the microenvironment about the C153 probe appear to change very little in either peak position (νpk) or in spectral width. Subsequent analysis results for νpk and full width at half maximum (FWHM) for absorption and emission are presented in Figure 4 The upper panel gives results νpk value for both absorbance (red symbols) and emission (green symbols) confirm this general observation. In the context of experimental uncertainty (~100 cm−1), there is a significant, though subtle, bathochromic shift in both spectral measures of ~450 cm-1 for absorbance and 290 cm−1. With regard to spectral widths, the absorption FWHM suggests a modest decrease in solution heterogeneity at xIL ~ 0.3. The change in dipole moment upon C153 excitation is ~8 D based on in-house electronic structure calculations and in good agreement with literature reports [45]. Evidently, the increased polarity of the C153 excited state is sensitive to what, from our data, appears to be compositional changes as EAN is added to solution. Interestingly, excess volumes reported for EAN in cosolvents, including MeOH and acetonitrile, show a minimum at xIL = 0.3 and scattering studies therein confirmed the presence of mesoscopic solution organization [7,14,20,36]. EAN structural organization seems to be independent of the specific diluent. At the same time, x-ray and neutron scattering showed that alcohol addition to EAN in small amounts does not alter the mesoscopic structure of neat EAN [20]. Finally, our activation energy results also confirm solution variation in the dilute EAN region. We also report the results of steady-state absorption and emission for C153 in neat EAN as a function of temperature (288 K–323 K), which are presented as arrows at the right edge of Figure 4. The values across the temperature range were constant to within experimental uncertainty. From our C153 spectroscopic perspective, either temperature variation seems to be an ineffective means of influencing the EAN solution structure or C153 does not adequately probe temperature effects.
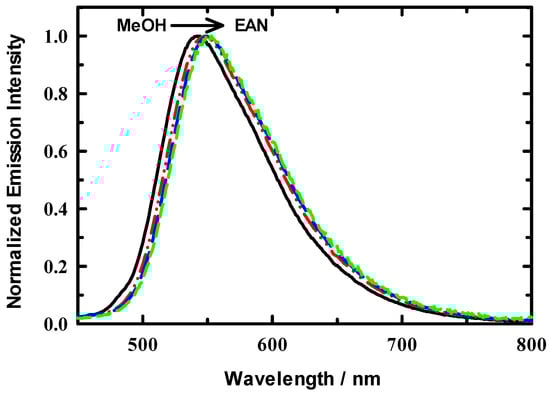
Figure 3.
Representative normalized steady-state emission spectra for C153 in EAN/MeOH at 295 K. EAN/MeOH mole fractions shown (left to right) are xIL = 0.1, 0.4, 0.6, 1.0.
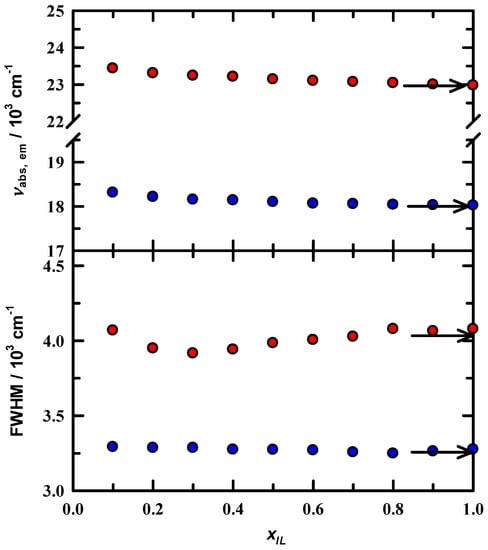
Figure 4.
Steady-state spectral parameters for C153/EAN/MeOH. Red symbols are absorbance data and blue circles are emission data. Arrows indicate the spectral maxima and widths of C153/EAN temperature dependent data. The values indicated by the arrows were invariant over the temperature range measured (see text).
3.3. Time-Resolved Spectroscopy
We turn to the measured intensity decays for C153 in the binary mixtures at 295 K. Here, the decays were measured at the peak of the spectral emission. Figure 5 shows two examples of the intensity decays (blue and green dotted symbols) in the bottom panel along with fits to those decays represented as solid lines. Weighted residuals of the fits are presented in the middle and upper panels. The data shown here are for xIL = 0.1 (curve a, blue) and 0.8 (curve b. green). We note a few points from these data. First, as the amount of EAN in solution is increased, the decays move to shorter time. Second, the residuals for the fits to simple sum of exponential models indicates that for dilute EAN solution (blue traces) it is difficult to appreciate the improvement in the quality of the fits with additional time constants. At higher xIL, here 0.8 EAN, the C153 decay is clearly non-exponential, and requires more than a single time constant to adequately represent the intensity decay (note the residual comparison in panel (b) for time <5 ns). Residuals are typically the metric of assessing quality of fits, but importantly, in addition to using the residuals as a metric for quality of fits we also examined the autocorrelation of the residuals (see Supplementary Materials Figure S2), which is more sensitive to variations in the fitting parameters. From the autocorrelations, in concert with residuals, we were able to make more confident determinations as to whether we included an additional time constant. Criteria that are used to determine if the data require additional time constants are (1) a threshold of 10% improvement in χr2; (2) a significant improvement in the randomness of the residuals; and (3) significant improvement in the autocorrelations of the residuals.
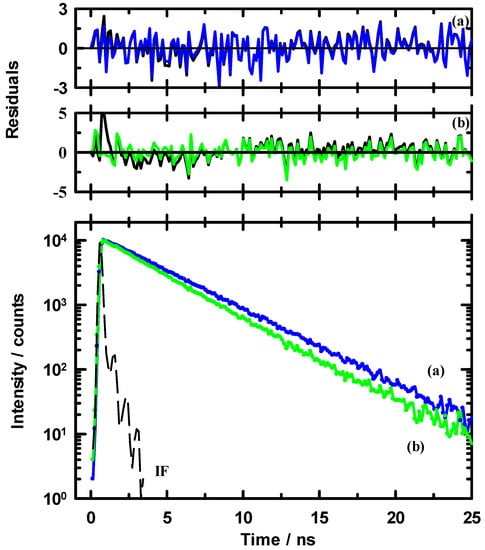
Figure 5.
Examples of magic angle fluorescence intensity decays for C153 in EAN / MeOH at 295 K. The bottom panel shows decay data for (a, blue) xIL = 0.1 and (b, green) xIL = 0.8. Data are thinned by a factor of 10 for added clarity. The dashed line labeled “IF” is the instrument response function. The upper panels show the weighted residuals (thinned by 10 ×) at each of the mole fractions: (a) xIL = 0.1, blue line, using two time constants in the decay model and (b) xIL = 0.8, green line, using three time constants in the decay model. The black line in panel (b) shows the residuals for two time constants.
To begin, we note that within our time resolution C153/MeOH exhibits a monoexponential decay and C153 senses only a bulk MeOH environment. The results of the intensity decay fits for the EAN/MeOH solutions are compiled in Table 1 and are presented in Figure 6, with lifetimes in the lower panel and associated fractional contributions in the upper panel.

Table 1.
Results of EAN/MeOH Intensity Decay Fits at 295 K.
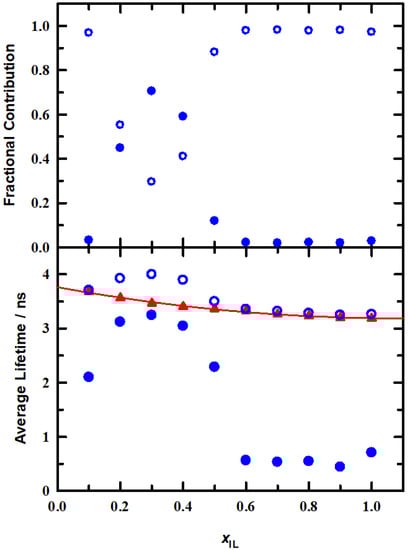
Figure 6.
Time resolved intensity decay parameters for C153 in EAN/MeOH solutions at 295 K. Fractional contributions and time constants from best fits to the intensity decays (◯, ⬤). Average lifetimes (▲) calculated using Equation (4). The line is a second order polynomial regression, τfl = (0.49 ± 0.07) xIL2−(1.06 ± 0.08) xIL + (3.76 ± 0.02), r2 = 0.992, that is included primarily as a visual aid.
Here, we include two representations of the data, the lifetime-weighted fractions and time constants (blue symbols) and the average lifetimes (red symbols) for each mole fraction. Fractions were calculated as:
and weighted average lifetimes were computed using:
where ai is the normalized un-weighted pre-exponential factors determined from the DAS-6 fitting parameters and τi is the component lifetime.
The C153 lifetime in neat MeOH is adequately described by a single time constant 3.9 ns and agrees with previous literature [21,54]. As is typical in dipolar solvents such as MeOH and ILs, the ~4 ns shows that substantial non-radiative relaxation is present, compared to gas phase intensity decay where the representative time constant is on the order of ~6 ns [51]. We observe that for EAN/MeOH mixture data two time constants were required for all mole fractions. On initial addition of EAN (xIL = 0.1) about 3% of the decay was contributed from the faster time constant. Between xIL = 0.2–0.5 there is a more substantial contribution from each of the two time constants, with a minimum that appears at xIL = 0.3. This minimum in the lifetime results is in good agreement with our steady-state results and aforementioned literature reports of EAN/MeOH solution organization [7,14,20,36]. Moreover, the lifetimes are suggestive that C153 interactions are differentiating between solution components and reflective of C153-EAN and C153-MeOH. Note that in the range xIL = 0.2–0.5 the faster time constant is ~3 ns, similar to the value of ~3.2 ns for xIL = 1, and the slower time constant is consistent with the C153/MeOH lifetime of ~4 ns. The relative contributions (fractions) give a commentary on the variation of these interactions. For solution compositions greater than xIL = 0.6 the decays were nearly exponential, requiring only ~2% of a ~0.5 ns time constant. Intensity decay in neat ILs is typically non-exponential [24,35,51,53,55], and the scope and complexity of interactions in neat ILs has been shown to require up to five exponentials to fully and adequately describe the intensity decay data [55]. Reports have suggested that ion translational/diffusional motions are collectively described by sub-picosecond dynamics and slower solvent dynamics [18,20,40,41,43,47]. Samanta described additional contributions to solute-solvent interactions, such as solvent shell reorganization, orientational relaxation, dipolar interactions, aggregate translation and rotation, etc., that will also influence the C153 emission [35]. For EAN/MeOH, as the solution is enriched in EAN (xIL > 0.5) it is interesting to note that from the lifetime data alone one might infer that there appears to be little if any change in component interactions. This perspective is corroborated from diffraction measurements reported by Triolo and co-workers, where they show that at low alcohol concentration (here, larger xIL values) there is minimal influence by MeOH on the IL structure. Rather, it is on MeOH where there is significant impact to its microenvironment in that it is the methanol-methanol correlation that is significantly impacted [20]. The C153 radiative rates and fractions at smaller xIL values gives clear evidence that solute-solvent interactions are changing significantly as the complexity of the system is increased with added EAN. Finally, it is interesting to consider the average lifetime (triangles) data. These data are perhaps a bit deceiving in that they suggest a smooth variation in solute-solvent interactions across the compositional range. By that measure, one would miss the clear pattern shift at xIL ~0.3. However, the average value does give the correct view for EAN at larger xIL values and indicates a nearly invariant lifetime as the influence of MeOH on EAN-MeOH interactions diminishes. Whatever specific micro- or nanoscopic organization (e.g., caging) drives the interactions that are attributable to the 0.5 ns contribution to the lifetime beyond xIL = 0.5, this time constant contributes at most 2.5% to the C153 decay kinetics. We now examine the C153 rotational dynamics for the EAN/MeOH binary solutions.
3.4. Rotational Dynamics
Fluorescence decays of anisotropy were measured at the emission maxima for each mole fraction. Supplementary Materials Figure S3 shows representative polarized intensity decay data at xIL = 0.2 and 0.9. The polarized intensity decays were fit using a reconvolution sum of exponentials model:
where r0 is the initial anisotropy, fi is the normalized pre-exponential factor and τrot,i is the rotation time. C153 limiting anisotropy values have been measured and discussed in detail elsewhere [30]. The accepted r0 value is 0.373 but was shown to range from 0.33 to 0.39. We used r0 as a variable fitting parameter in our analysis to test whether our data are capturing the entire anisotropy decay. Results of the fits are noted in Table 2. The values for r0 indicate that for the two most dilute EAN solutions, we are missing ~ 22% initial decay because our time resolution is unable to detect the faster ps and sub-ps motions that are surely in the dynamics. When fixing r0 to 0.37 the rotation times are 75 and 135 ps for xIL = 0.1 and 0.2, respectively, a decrease in the reported times of about 30% each. However, this does not change the observed trend. Further, we note that for xIL > 0.2 the recovered r0 values are within uncertainty of the expected range, showing that we are capturing the rotational diffusion that occurs within the ml153 lifetime. For xIL values 0.6 and greater, the C153 rotational dynamics require two time constants to model the decay and this is consistent with an the increased solution complexity of interactions. Table 2 also reports the average rotation times () and uncertainties in these data are at most 6%. Figure 7 depicts the rotation time dependence on solution viscosity and we observe that at first glance the increase in time constants parallels increasing viscosity.
Table 2.
Results of EAN/MeOH Anisotropy Decay Fits at 295 K.
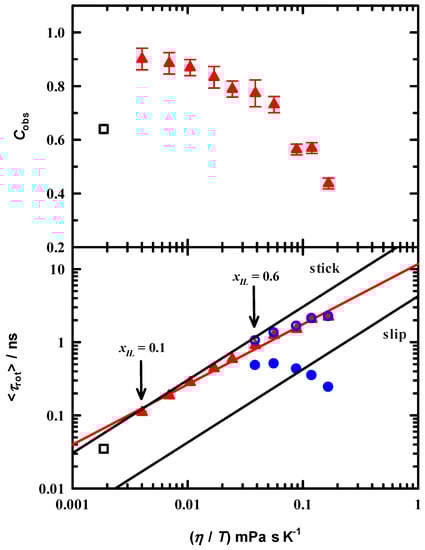
Figure 7.
Lower Panel: Rotation times of C153 in EAN/MeOH at 295 K. Symbols represent time constants for fits to the anisotropy decays. Data sets that required one time constant are shown with triangles (▲), but only for xIL < 0.6, and data sets that required two time constants are the circles (⬤, ◯). Triangles over the entire range are weighted average rotation time constants. The red line is a regression fit to these data only. The black lines show the predictions for stick and slip hydrodynamics. Upper Panel: Coupling factor, C, that indicates the fractional average rotation times relative to the stick prediction (see Equation (7)). The open square shows the values for C153/MeOH.
The red triangles below xIL = 0.6 are the monoexponential times whereas the blue spheres indicate the mole fractions requiring two rotation times. In addition to the smaller mole fractions, red triangles at xIL = 0.6 and above represent the average rotation times. Figure 7 also includes the computed hydrodynamic times for stick and slip boundary conditions, where the stick limit is reflective of the probe’s rotation including the first solvent shell and in the extreme slip limit the lack of solvent drag [56,57]. Stick and slip hydrodynamic limits for rotational diffusion are computed using the relation:
where V is C153 volume, f is a shape factor, and C is a coupling factor. Molecular parameters were determined by modeling C153 as an ellipsoid with semi-axis dimensions of 2.0, 4.8, and 6.1 Å, yielding a molecular volume V = 246 Å3, and with f = 1.71. The coupling factor C = 1 and C = 0.24 are for the stick and slip limits, respectively [30]. The average rotation times are lie near the stick limit up to xIL = ~0.6, after which the values decrease more substantially from the hydrodynamic limit. The correlation to hydrodynamic behavior is quantified from Cobs as:
and are presented in the upper panel of Figure 7. The open square is C153 in neat MeOH measured at 22 °C using femtosecond up-conversion [30]. Immediately upon addition of EAN C153 rotations times show a distinct difference compared to MeOH and even with the initial addition follow the stick limit hydrodynamic prediction. Cobs shows that the dynamics are nearly hydrodynamic at ~90% of the stick limit and drop precipitously as EAN is added. At the split in rotation times the faster time contributes ~25% to the decay and steadily decreases to a 1% contribution in EAN. It appears that C153 experiences a solution heterogeneity, which becomes very prominent at about 50 mol% and remains detectable even in neat EAN. The rotation data give evidence that the solution complexity is consistently increasing as the deviation from hydrodynamic becomes significant as evidenced by Cobs → 0.4.
As a final point of analysis, we evaluated the rotational diffusion coupling to solution viscosity. Assuming the Stokes–Einstein–Debye hydrodynamic behavior in Equation (6), one expects that where p = 1 in the stick limit and rotation correlates directly viscosity. Since the average rotation time seems to provide a reasonable estimate at all mole fractions, we regressed those times accordingly and found that the fit yielded a p value of 0.82 ± 0.03, indicating the EAN/MeOH solution is exhibiting dynamic heterogeneity. ILs nano- and microstructure tends to form polar and non-polar domains in varying degrees depending on solution constituents and the varieties of interactions that occur, which leads to both spatial (structural) and dynamic heterogeneities [10,11,18,43,47]. As a consequence of solution heterogeneity, we expect a distribution of microenvironments that manifest as viscosity variations in the bulk solution. Of particular interest for this work is the excess viscosity (Supplementary Materials Figure S2 and ref) that showed a substantial depression in the EAN/MeOH solution viscosity, with a decrease of about −7 cP at 298 K and as much as −20 cP at 278 K. The change in our rotational dynamics from one-to-two time constants aligns well with the change in excess viscosity and it appears that from the perspective of heterogeneity the solution structure at xIL = 0.6 and above is significantly different. We attribute this observation to the existence of multiple IL domains that include both polar and apolar micro- and nanodomains.
4. Discussion
An extensive amount of experimental and simulation evidence exists in the literature supporting the structural heterogeneity of ILs and IL solutions, the source of which may arise from ion pair associations in neat IL and dilution effects in cosolvent modified ILs [58,59,60,61,62]. Extended aggregation also drives heterogeneity in ILs especially when the cation possesses longer alkyl chains [21,63,64]. For EAN with only a C2 chain, aggregation is not a significant consideration, so what governs structural variation? Formation of hydrogen bonds between EAN, MeOH and C153 collectively would seem to account for the slowed hydrodynamic-like rotational dynamics as well as the formation of polar and apolar domains within the EAN structure, and these interactions have been discussed in detail elsewhere (and references above) [18,31,36,65,66]. Another point of importance is the various correlation lengths that exist in solution, including anion-anion, cation-anion, cation-cation interactions, that not only persist spatially but dynamically as well [31,66]. Correlation lengths in EAN were reported to be on the order of ~10 Å [31,66], and given that the semi-axes dimensions of the C153 ellipsoid are estimated to be 6.0 Å and 4.8 Å the C153 will fit within any local domains that may form within the 3-D solution structure. Therefore, we expect that these short-range interactions may cage C153 and thereby in part govern the observed dynamics and result in fast reorientation. Rotational time correlation functions (TCFs) were also reported for EAN cations and anions and fit to a two-time constant model that showed at 300 K anion organization persists at most on the order of a few hundred ps with a weighted average of 88 ps whereas cation persistence is much greater with a weighted average of 2500 ps. Considering that our results were measured at 295 K and these time constants were at 300 K there is reasonable agreement with a difference of ~10%. From ultrafast vibrational measurements using SCN−, dynamical heterogeneity was also confirmed with the observation of two populations that described the solute rotational dynamics [43]. However, the associated rotation times for the populations were reported to be the same within the experimental uncertainty at ~2.5 ps. Additional slower reorientations of ~30 ps were suggested that deplete any remaining anisotropy. The authors posited a set of domains, “charge-depleted” and “charge dense”, to account for the two observed populations [43]. These ultrafast measurements agree with the general consensus from the literature regarding EAN spatial and dynamic heterogeneity, but the SCN− ultrafast dynamics are well beyond our time resolution.
In dilute EAN solution at xIL = 0.1 the bulk solution viscosity increases by ~0.5 mPa s (about a 2-fold increase) but the even though absolute viscosity change is relatively small it is substantial enough that the viscous drag on C153 increases the rotational dynamics from ~60% of the stick limit in MeOH to ~90%. Although we cannot assess the individual contributions from this data, the effect on the C153 rotational dynamics is evident. Further, for diluted EAN solutions the rotation times clearly demonstrate that with successively added EAN the solution is organizing with a predictable, smooth hydrodynamic-like variation. It is interesting to note that the rotation times steadily move away from the stick hydrodynamic prediction with increased EAN, although from our data the reason is not completely clear. Beyond xIL = 0.6 we noted that the rotational dynamics showed two time constants, with the faster time’s relative weighting decreasing from ~20% to ~2% in neat EAN. Evidently, at xIL = 0.5–0.6 there is a ‘balancing’ point among all the competing effects of ion concentration and associated changes in ion mobility. Certainly, ion–ion interactions, hydrogen bond variations among the solution constituents, nanodomain formation all contribute to the solution heterogeneity that is sensed by C153. For our data, this is clearly manifested by the decreased value of the exponent p (=0.82) from unity in the fitting of the average rotational time constants. Such a deviation has been shown in many ILs (including deep eutectic solvents, DESs) and explained as clear evidence of solution heterogeneity [42,67,68]. Cobs values clearly show the extent of deviation from ideal (Cobs = 1) and we note that the solvent coupling is less than 50% of the stick limit in neat EAN. The most reasonable explanation would seem to be that C153 is in an environment where hydrogen bonding among ions is much stronger than hydrogen bond interactions with C153. Whether this is a simple caging effect or polar/apolar domain effect is not clear from our data and is most likely some combination of both. A report of rotational dynamics using rhodamine 6G (cationic dye) and fluorescein (anionic dye) showed that for charged dyes the rotational dynamics we not less than the stick limit and were super-stick at lower viscosity [47]. However, the authors did not present an analysis that determined the non-linearity of the rotational data, e.g., a computed p-value, so we are unable to comment on this aspect in comparison to our C153 p-value. One final point to address is the reason why we only see two time constants for the EAN-rich solutions. We conjecture two possibilities here. First, it is reasonable to suggest that in the MeOH-rich solutions we simply do not have sufficient time resolution to resolve multiple time constants at these smaller mole fractions. Second, it is plausible that C153 is in a relatively rigid environment wherein the hydrogen bond interactions are such that the sum of all interactions between the ions, MeOH and C153 essentially lock C153 into a tight EAN/MeOH solvent shell. However, it is interesting to note that the magic-angle intensity decay is sensitive to solution composition near xIL ~ 0.3, which underscores the importance of using various measurement strategies to study these complex systems. To resolve these questions further measurements are needed to examine more carefully the complexities of EAN/MeOH solutions and we will be reporting on our findings for temperature dependent measurement in a subsequent report.
5. Summary and Conclusions
We have studied the EAN/MeOH binary solvent system over the entire range of IL mole fraction using the well-known, solvent sensitive, neutral fluorescent molecule C153. The interests here were to use SED hydrodynamics as a framework wherein we characterized the inherent heterogeneity of EAN and the EAN + methanol cosolvent system. C153 was chosen for this task, in part because as a neutral dye it reported on locales within the IL solution there were not associated with charged interactions, thereby avoiding the invocation of specific solvent-probe interactions that are not reasonably described by SED theory. As a diluent, MeOH solvates the EAN ions and viscosity measurements show that MeOH disrupts the EAN organization, as evidenced by an increased fluidity (η−1). Steady-state fluorescence results indicate that across the complete mole fraction range that the average energetics as measured by the emission maximum red shifted by ~300 cm−1 and the emission width (FWHM) was invariant. The absorption peak maximum showed a 450 cm−1 red shift with a distinctive 170 cm−1 narrowing of the width at xIL = 0.3. Magic-angle intensity decays also indicated that the solution composition at xIL = 0.3 was significantly different but beyond xIL = 0.5 there was little change in time dependent emission. Fluorescence anisotropy decays yielded a single time constant for xIL < 0.5 and the rotation times were upwards of 90% stick hydrodynamics, which decreased to ~80% stick at xIL = 0.5. For xIL > 0.5 the anisotropy decay was described by two time constants, and the faster time decreased from 500 to 240 ps with a concomitant change in fractional contribution from 20% down to 2%. The slower time constant showed a steady increase from 1.0 to 2.2 ns, but systematically deviated further away from the stick hydrodynamic limit as indicated by the continually decreased Cobs value that was 43% of the stick limit in neat EAN. The power law fit to the rotation times yielded a p value of 0.82, signifying the presence of dynamic heterogeneity in the EAN/MeOH solution. Heterogeneity arises from the composite EAN ion–ion, ion–dipole (EAN–MeOH), ion solute (EAN–C153), and dipole solute (MeOH–EAN) interactions.
Supplementary Materials
The following are available online at https://www.mdpi.com/article/10.3390/suschem2040041/s1, Figure S1: Excess Viscosity Values for EAN/MeOH, Figure S2: Autocorrelation functions for Magic Angle Intensity Decays Fits, Figure S3: Polarized Emission Intensity Decays for EAN/MeOH.
Author Contributions
Conceptualization, M.P.H.; Methodology, M.P.H.; Validation, M.P.H.; Formal Analysis, M.P.H., S.M.R. and T.J.S.; Investigation, M.P.H., S.M.R. and T.J.S.; Resources, M.P.H.; Data Curation, S.M.R. and T.J.S.; Writing—Original Draft Preparation, M.P.H., S.M.R. and T.J.S.; Writing—Review and Editing, M.P.H.; Supervision, M.P.H.; Project Administration, M.P.H.; Funding Acquisition, M.P.H. All authors have read and agreed to the published version of the manuscript.
Funding
This research was funded by the Scholarly Incentive Grant Program and the Institute for Engaged Learning at SUNY Brockport.
Institutional Review Board Statement
Not applicable.
Informed Consent Statement
Not applicable.
Data Availability Statement
The data presented in this study are available on reasonable request from the corresponding author and are not publicly available.
Conflicts of Interest
The authors declare no conflict of interest. The funders had no role in the design of the study; in the collection, analyses, or interpretation of data; in the writing of the manuscript, or in the decision to publish the results.
References
- Welton, T. Ionic liquids: A brief history. Biophys. Rev. 2018, 10, 691–706. [Google Scholar] [CrossRef]
- Lei, Z.; Chen, B.; Koo, Y.-M.; MacFarlane, D.R. Introduction: Ionic Liquids. Chem. Rev. 2017, 117, 6633–6635. [Google Scholar] [CrossRef]
- Greaves, T.L.; Drummond, C.J. Protic Ionic Liquids: Evolving Structure–Property Relationships and Expanding Applications. Chem. Rev. 2015, 115, 11379–11448. [Google Scholar] [CrossRef]
- Castner, E.W.; Margulis, C.J.; Maroncelli, M.; Wishart, J.F. Ionic Liquids: Structure and Photochemical Reactions. Ann. Rev. Phys. Chem. 2011, 62, 85–105. [Google Scholar] [CrossRef] [PubMed]
- Edward, W.; Castner, J.; Wishart, J.F. Spotlight on ionic liquids. J. Chem. Phys. 2010, 132, 120901. [Google Scholar] [CrossRef]
- Greaves, T.L.; Drummond, C.J. Protic Ionic Liquids: Properties and Applications. Chem. Rev. 2008, 108, 206–237. [Google Scholar] [CrossRef] [PubMed]
- Mariani, A.; Caminiti, R.; Ramondo, F.; Salvitti, G.; Mocci, F.; Gontrani, L. Inhomogeneity in Ethylammonium Nitrate–Acetonitrile Binary Mixtures: The Highest “Low q Excess” Reported to Date. J. Phys. Chem. Lett. 2017, 8, 3512–3522. [Google Scholar] [CrossRef] [PubMed]
- Usula, M.; Matteoli, E.; Leonelli, F.; Mocci, F.; Marincola, F.C.; Gontrani, L.; Porcedda, S. Thermo-physical Properties of Ammonium-Based Ionic Liquid + N-methyl-2-pyrrolidone Mixtures at 298.15 K. Fluid Phase Equilib. 2014, 383, 49–54. [Google Scholar] [CrossRef]
- Docampo-Álvarez, B.; Gómez-González, V.; Méndez-Morales, T.; Carrete, J.; Rodríguez, J.R.; Cabeza, Ó.; Gallego, L.J.; Varela, L.M. Mixtures of protic ionic liquids and molecular cosolvents: A molecular dynamics simulation. J. Chem. Phys. 2014, 140, 214502. [Google Scholar] [CrossRef] [PubMed]
- Mariani, A.; Bonomo, M.; Wu, B.; Centrella, B.; Dini, D.; Castner, E.W.; Gontrani, L. Intriguing transport dynamics of ethylammonium nitrate–acetonitrile binary mixtures arising from nano-inhomogeneity. Phys. Chem. Chem. Phys. 2017, 19, 27212–27220. [Google Scholar] [CrossRef] [PubMed]
- Zheng, Z.-P.; Fan, W.-H.; Roy, S.; Mazur, K.; Nazet, A.; Buchner, R.; Bonn, M.; Hunger, J. Ionic Liquids: Not only Structurally but also Dynamically Heterogeneous. Angew. Chem. Int. Ed. 2015, 54, 687–690. [Google Scholar] [CrossRef]
- Zarrougui, R.; Dhahbi, M.; Lemordant, D. Transport and Thermodynamic Properties of Ethylammonium Nitrate—Water Binary Mixtures: Effect of Temperature and Composition. J. Solution Chem. 2015, 44, 686–702. [Google Scholar] [CrossRef]
- Chagnes, A.; Tougui, A.; Carré, B.; Ranganathan, N.; Lemordant, D. Abnormal Temperature Dependence of the Viscosity of Ethylammonium Nitrate–Methanol Ionic Mixtures. J. Solution Chem. 2004, 33, 247–255. [Google Scholar] [CrossRef]
- Russina, O.; Mariani, A.; Caminiti, R.; Triolo, A. Structure of a Binary Mixture of Ethylammonium Nitrate and Methanol. J. Solution Chem. 2015, 44, 669–685. [Google Scholar] [CrossRef]
- Yalcin, D.; Christofferson, A.J.; Drummond, C.J.; Greaves, T.L. Solvation properties of protic ionic liquid—Molecular solvent mixtures. Phys. Chem. Chem. Phys. 2020, 22, 10995–11011. [Google Scholar] [CrossRef]
- Rumble, C.A.; Uitvlugt, C.; Conway, B.; Maroncelli, M. Solute Rotation in Ionic Liquids: Size, Shape, and Electrostatic Effects. J. Phys. Chem. B 2017, 121, 5094–5109. [Google Scholar] [CrossRef]
- Araque, J.C.; Yadav, S.K.; Shadeck, M.; Maroncelli, M.; Margulis, C.J. How Is Diffusion of Neutral and Charged Tracers Related to the Structure and Dynamics of a Room-Temperature Ionic Liquid? Large Deviations from Stokes—Einstein Behavior Explained. J. Phys. Chem. B 2015, 119, 7015–7029. [Google Scholar] [CrossRef]
- Usui, K.; Hunger, J.; Bonn, M.; Sulpizi, M. Dynamical heterogeneities of rotational motion in room temperature ionic liquids evidenced by molecular dynamics simulations. J. Chem. Phys. 2018, 148, 193811. [Google Scholar] [CrossRef] [PubMed]
- Huang, Y.; Zhou, G.; Li, Y.; Yang, Z.; Shi, M.; Wang, X.; Chen, X.; Zhang, F.; Li, W. Molecular Dynamics Simulations of Temperature-Dependent Structures and Dynamics of Ethylammonium Nitrate Protic Ionic Liquid: The Role of Hydrogen Bond. Chem. Phys. 2016, 472, 105–111. [Google Scholar] [CrossRef]
- Mariani, A.; Russina, O.; Caminiti, R.; Triolo, A. Structural Organization in a Methanol:Ethylammonium Nitrate (1:4) Mixture: A Joint X-ray/Neutron Diffraction and Computational Study. J. Mol. Liq. 2015, 212, 947–956. [Google Scholar] [CrossRef]
- Barra, K.M.; Sabatini, R.P.; McAtee, Z.P.; Heitz, M.P. Solvation and Rotation Dynamics in the Trihexyl(tetradecyl)phosphonium Chloride Ionic Liquid/Methanol Cosolvent System. J. Phys. Chem. B 2014, 118, 12979–12992. [Google Scholar] [CrossRef]
- Das, S.K.; Sarkar, M. Steady-state and time-resolved fluorescence behavior of coumarin-153 in a hydrophobic ionic liquid and ionic liquid–toluene mixture. J. Mol. Liq. 2012, 165, 38–43. [Google Scholar] [CrossRef]
- Das, S.K.; Sarkar, M. Solvation and rotational relaxation of coumarin 153 and 4-aminophthalimide in a new hydrophobic ionic liquid: Role of N–H…F interaction on solvation dynamics. Chem. Phys. Lett. 2011, 515, 23–28. [Google Scholar] [CrossRef]
- Ito, N.; Arzhantsev, S.; Heitz, M.; Maroncelli, M. Solvation Dynamics and Rotation of Coumarin 153 in Alkylphosphonium Ionic Liquids. J. Phys. Chem. B 2004, 108, 5771–5777. [Google Scholar] [CrossRef]
- Arzhantsev, S.; Ito, N.; Heitz, M.; Maroncelli, M. Solvation Dynamics of Coumarin 153 in Several Classes of Ionic Liquids: Cation Dependence of the Ultrafast Component. Chem. Phys. Lett. 2003, 381, 278–286. [Google Scholar] [CrossRef]
- Kashyap, H.K.; Biswas, R. Solvation Dynamics of Dipolar Probes in Dipolar Room Temperature Ionic Liquids: Separation of Ion−Dipole and Dipole−Dipole Interaction Contributions. J. Phys. Chem. B 2010, 114, 254–268. [Google Scholar] [CrossRef]
- Daschakraborty, S.; Ranjit, B. Stokes Shift Dynamics in (Ionic Liquid + Polar Solvent) Binary Mixtures: Composition Dependence. J. Phys. Chem. B 2011, 115, 4011–4024. [Google Scholar] [CrossRef] [PubMed]
- Daschakraborty, S.; Biswas, R. Composition Dependent Stokes Shift Dynamics in Binary Mixtures of 1-Butyl-3-methylimidazolium Tetrafluoroborate with Water and Acetonitrile: Quantitative Comparison between Theory and Complete Measurements. J. Phys. Chem. B 2014, 118, 1327–1339. [Google Scholar] [CrossRef]
- Pramanik, R.; Rao, V.G.; Sarkar, S.; Ghatak, C.; Setua, P.; Sarkar, N. To Probe the Interaction of Methanol and Acetonitrile with the Ionic Liquid N,N,N-Trimethyl-N-propyl Ammonium Bis(trifluoromethanesulfonyl) Imide at Different Temperatures by Solvation Dynamics Study. J. Phys. Chem. B 2009, 113, 8626–8634. [Google Scholar] [CrossRef]
- Horng, M.L.; Gardecki, J.A.; Maroncelli, M. Rotational Dynamics of Coumarin 153: Time-Dependent Friction, Dielectric Friction, and Other Nonhydrodynamic Effects. J. Phys. Chem. A 1997, 101, 1030–1047. [Google Scholar] [CrossRef]
- Hayes, R.; Imberti, S.; Warr, G.G.; Atkin, R. Amphiphilicity determines nanostructure in protic ionic liquids. Phys. Chem. Chem. Phys. 2011, 13, 3237–3247. [Google Scholar] [CrossRef]
- Dasari, S.; Mallik, B.S. Nondiffusive Rotational Jump Dynamics in Ethyl Ammonium Nitrate. J. Phys. Chem. B 2018, 122, 9738–9746. [Google Scholar] [CrossRef] [PubMed]
- Hunger, J.; Sonnleitner, T.; Liu, L.; Buchner, R.; Bonn, M.; Bakker, H.J. Hydrogen-Bond Dynamics in a Protic Ionic Liquid: Evidence of Large-Angle Jumps. J. Phys. Chem. Lett. 2012, 3, 3034–3038. [Google Scholar] [CrossRef] [PubMed]
- Kobrak, M.N. Characterization of the Solvation Dynamics of an Ionic Liquid via Molecular Dynamics Simulation. J. Chem. Phys. 2006, 125, 064502. [Google Scholar] [CrossRef]
- Samanta, A. Solvation Dynamics in Ionic Liquids: What We Have Learned from the Dynamic Fluorescence Stokes Shift Studies. J. Phys. Chem. Lett. 2010, 1, 1557–1562. [Google Scholar] [CrossRef]
- Schroer, W.; Triolo, A.; Russina, O. Nature of Mesoscopic Organization in Protic Ionic Liquid–Alcohol Mixtures. J. Phys. Chem. B 2016, 120, 2638–2643. [Google Scholar] [CrossRef]
- Kanzaki, R.; Mitsugi, T.; Fukuda, S.; Fujii, K.; Takeuchi, M.; Soejima, Y.; Takamuku, T.; Yamaguchi, T.; Umebayashi, Y.; Ishiguro, S.-I. Ion-ion interaction in room temperature ionic liquid 1-ethyl-3-methylimidazolium tetrafluoroborate studied by large angle X-ray scattering experiment and molecular dynamics simulations. J. Mol. Liq. 2009, 147, 77–82. [Google Scholar] [CrossRef]
- Paul, A.; Samanta, A. Effect of Nonpolar Solvents on the Solute Rotation and Solvation Dynamics in an Imidazolium Ionic Liquid. J. Phys. Chem. B 2008, 112, 947–953. [Google Scholar] [CrossRef] [PubMed]
- Chakrabarty, D.; Chakraborty, A.; Seth, D.; Sarkar, N. Effect of Water, Methanol, and Acetonitrile on Solvent Relaxation and Rotational Relaxation of Coumarin 153 in Neat 1-Hexyl-3-methylimidazolium Hexafluorophosphate. J. Phys. Chem. A 2005, 109, 1764–1769. [Google Scholar] [CrossRef]
- Overbeck, V.; Schröder, H.; Bonsa, A.-M.; Neymeyr, K.; Ludwig, R. Insights into the translational and rotational dynamics of cations and anions in protic ionic liquids by means of NMR fast-field-cycling relaxometry. Phys. Chem. Chem. Phys. 2021, 23, 2663–2675. [Google Scholar] [CrossRef] [PubMed]
- Overbeck, V.; Appelhagen, A.; Rößler, R.; Niemann, T.; Ludwig, R. Rotational correlation times, diffusion coefficients and quadrupolar peaks of the protic ionic liquid ethylammonium nitrate by means of 1H fast field cycling NMR relaxometry. J. Mol. Liq. 2021, 322, 114983. [Google Scholar] [CrossRef]
- LaRocca, M.M.; Baker, G.A.; Heitz, M.P. Assessing rotation and solvation dynamics in ethaline deep eutectic solvent and its solutions with methanol. J. Chem. Phys. 2021, 155, 034505. [Google Scholar] [CrossRef] [PubMed]
- Johnson, C.A.; Parker, A.W.; Donaldson, P.M.; Garrett-Roe, S. An ultrafast vibrational study of dynamical heterogeneity in the protic ionic liquid ethyl-ammonium nitrate. I. Room temperature dynamics. J. Chem. Phys. 2021, 154, 134502. [Google Scholar] [CrossRef] [PubMed]
- Conway, B.; Uitvlugt, C.; Maroncelli, M. Simulations of 1-Butyl-3-methylimidazolium Tetrafluoroborate + Acetonitrile Mixtures: Force-Field Validation and Frictional Characteristics. J. Phys. Chem. B 2018, 122, 7385–7393. [Google Scholar] [CrossRef] [PubMed]
- Horng, M.L.; Gardecki, J.A.; Papazyan, A.; Maroncelli, M. Subpicosecond Measurements of Polar Solvation Dynamics: Coumarin 153 Revisited. J. Phys. Chem. 1995, 99, 17311–17337. [Google Scholar] [CrossRef]
- Reynolds, L.; Gardecki, J.A.; Frankland, S.J.V.; Horng, M.L.; Maroncelli, M. Dipole Solvation in Nondipolar Solvents: Experimental Studies of Reorganization Energies and Solvation Dynamics. J. Phys. Chem. 1996, 100, 10337–10354. [Google Scholar] [CrossRef]
- Kundu, N.; Roy, A.; Dutta, R.; Sarkar, N. Translational and Rotational Diffusion of Two Differently Charged Solutes in Ethylammonium Nitrate–Methanol Mixture: Does the Nanostructure of the Amphiphiles Influence the Motion of the Solute? J. Phys. Chem. B 2016, 120, 5481–5490. [Google Scholar] [CrossRef] [PubMed]
- Russina, O.; Schroer, W.; Triolo, A. Mesoscopic Structural and Dynamic Organization in Ionic Liquids. J. Mol. Liq. 2015, 210, 161–163. [Google Scholar] [CrossRef]
- Russina, O.; Sferrazza, A.; Caminiti, R.; Triolo, A. Amphiphile Meets Amphiphile: Beyond the Polar–Apolar Dualism in Ionic Liquid/Alcohol Mixtures. J. Phys. Chem. Lett. 2014, 5, 1738–1742. [Google Scholar] [CrossRef]
- McAtee, Z.P.; Heitz, M.P. Density, Viscosity and Excess Properties in the Trihexyltetradecylphosphonium Chloride Ionic Liquid/Methanol Cosolvent System. J. Chem. Thermodyn. 2016, 93, 34–44. [Google Scholar] [CrossRef]
- Jin, H.; Baker, G.A.; Arzhantsev, S.; Dong, J.; Maroncelli, M. Solvation and Rotational Dynamics of Coumarin 153 in Ionic Liquids: Comparisons to Conventional Solvents. J. Phys. Chem. B 2007, 111, 7291–7302. [Google Scholar] [CrossRef]
- Chakraborty, A.; Seth, D.; Chakrabarty, D.; Setua, P.; Sarkar, N. Dynamics of Solvent and Rotational Relaxation of Coumarin 153 in Room-Temperature Ionic Liquid 1-Butyl-3-methylimidazolium Hexafluorophosphate Confined in Brij-35 Micelles: A Picosecond Time-Resolved Fluorescence Spectroscopic Study. J. Phys. Chem. A 2005, 109, 11110–11116. [Google Scholar] [CrossRef]
- Ingram, J.A.; Moog, R.S.; Ito, N.; Biswas, R.; Maroncelli, M. Solute Rotation and Solvation Dynamics in a Room-Temperature Ionic Liquid. J. Phys. Chem. B 2003, 107, 5926–5932. [Google Scholar] [CrossRef]
- Bose, S.; Adhikary, R.; Mukherjee, P.; Song, X.; Petrich, J.W. Considerations for the Construction of the Solvation Correlation Function and Implications for the Interpretation of Dielectric Relaxation in Proteins. J. Phys. Chem. B 2009, 113, 11061–11068. [Google Scholar] [CrossRef] [PubMed][Green Version]
- Funston, A.M.; Fadeeva, T.A.; Wishart, J.F.; Castner, E.W. Fluorescence Probing of Temperature-Dependent Dynamics and Friction in Ionic Liquid Local Environments. J. Phys. Chem. B 2007, 111, 4963–4977. [Google Scholar] [CrossRef]
- Hu, C.M.; Zwanzig, R. Rotational friction coefficients for spheroids with the slipping boundary condition. J. Chem. Phys. 1974, 60, 4354–4357. [Google Scholar] [CrossRef]
- Zwanzig, R.; Harrison, A.K. Modifications of the Stokes–Einstein formula. J. Chem. Phys. 1985, 83, 5861–5862. [Google Scholar] [CrossRef]
- Jiang, Y.; Nadolny, H.; Kashammer, S.; Weibels, S.; Schroer, W.; Weingartner, H. The ion speciation of ionic liquids in molecular solvents of low and medium polarity. Faraday Discuss. 2012, 154, 391–407. [Google Scholar] [CrossRef]
- Hu, X.; Lin, Q.; Gao, J.; Wu, Y.; Zhang, Z. Anion–cation and ion–solvent interaction of some typical ionic liquids in solvents with different dielectric constant. Chem. Phys. Lett. 2011, 516, 35–39. [Google Scholar] [CrossRef]
- Annapureddy, H.V.; Dang, L.X. Pairing mechanism among ionic liquid ions in aqueous solutions: A molecular dynamics study. J. Phys. Chem. B 2013, 117, 8555–8560. [Google Scholar] [CrossRef] [PubMed]
- Yee, P.; Shah, J.K.; Maginn, E.J. State of Hydrophobic and Hydrophilic Ionic Liquids in Aqueous Solutions: Are the Ions Fully Dissociated? J. Phys. Chem. B 2013, 117, 12556–12566. [Google Scholar] [CrossRef] [PubMed]
- Hunger, J.; Stoppa, A.; Buchner, R.; Hefter, G. From Ionic Liquid to Electrolyte Solution: Dynamics of 1-N-Butyl-3-N-methylimidazolium Tetrafluoroborate/Dichloromethane Mixtures. J. Phys. Chem. B 2008, 112, 12913–12919. [Google Scholar] [CrossRef]
- Hemmateenejad, B.; Safavi, A.; Dorostkar, S. Aggregation of imidazolium based ionic liquids in binary methanol–water solvents: A linear solvation free energy relationship study. J. Mol. Liq. 2011, 160, 35–39. [Google Scholar] [CrossRef]
- Mukherjee, P.; Crank, J.A.; Sharma, P.S.; Wijeratne, A.B.; Adhikary, R.; Bose, S.; Armstrong, D.W.; Petrich, J.W. Dynamic Solvation in Phosphonium Ionic Liquids: Comparison of Bulk and Micellar Systems and Considerations for the Construction of the Solvation Correlation Function, C(t). J. Phys. Chem. B 2008, 112, 3390–3396. [Google Scholar] [CrossRef] [PubMed]
- Hayes, R.; Warr, G.G.; Atkin, R. Structure and Nanostructure in Ionic Liquids. Chem. Rev. 2015, 115, 6357–6426. [Google Scholar] [CrossRef]
- Song, X.; Hamano, H.; Minofar, B.; Kanzaki, R.; Fujii, K.; Kameda, Y.; Kohara, S.; Watanabe, M.; Ishiguro, S.-I.; Umebayashi, Y. Structural Heterogeneity and Unique Distorted Hydrogen Bonding in Primary Ammonium Nitrate Ionic Liquids Studied by High-Energy X-ray Diffraction Experiments and MD Simulations. J. Phys. Chem. B 2012, 116, 2801–2813. [Google Scholar] [CrossRef]
- Das, A.; Biswas, R. Dynamic Solvent Control of a Reaction in Ionic Deep Eutectic Solvents: Time-Resolved Fluorescence Measurements of Reactive and Nonreactive Dynamics in (Choline Chloride + Urea) Melts. J. Phys. Chem. B 2015, 119, 10102–10113. [Google Scholar] [CrossRef]
- Hossain, S.S.; Paul, S.; Samanta, A. Liquid Structure and Dynamics of Tetraalkylammonium Bromide-Based Deep Eutectic Solvents: Effect of Cation Chain Length. J. Phys. Chem. B 2019, 123, 6842–6850. [Google Scholar] [CrossRef]
Publisher’s Note: MDPI stays neutral with regard to jurisdictional claims in published maps and institutional affiliations. |
© 2021 by the authors. Licensee MDPI, Basel, Switzerland. This article is an open access article distributed under the terms and conditions of the Creative Commons Attribution (CC BY) license (https://creativecommons.org/licenses/by/4.0/).