4.1. Cluster Analysis Results
The cluster analysis of 154 countries worldwide based on the scores of all 17 SDGs, using the k-means method, made it possible to identify three typologically homogeneous groups that differ substantially in their sustainable development profiles. Between-group differences were examined using one-way analysis of variance. It should be noted that, since the same variables were used both to form the clusters and to compute the ANOVA statistics, these tests do not constitute independent confirmatory evidence and should be interpreted as descriptive rather than inferential. With this caveat in mind, statistically significant between-group differences were observed for 16 out of 17 variables (p < 0.001). This indicates the high discriminatory power of the proposed classification. The only exception is Goal 14 (F = 1.92, p = 0.157), which does not reach statistical significance, suggesting relative homogeneity across countries in marine ecosystem conditions regardless of overall development level. This finding is itself substantively meaningful: the absence of between-group differentiation on Goal 14 (OHI) indicates that the state of marine ecosystems does not constitute a distinguishing characteristic of the identified typological groups. Goal 14 was nonetheless retained in the discriminant analysis to preserve the conceptual completeness of the “one indicator–one goal” framework, which is a stated methodological principle of the study. As shown by the subsequent discriminant analysis, its coefficients are close to zero, which is consistent with the ANOVA result and indicates its minimal contribution to group separation. The highest between-group differentiation was observed for Goal 3 (), Goal 7 (), and Goal 9 (), indicating the strong statistical association of health, access to energy, and infrastructure with the observed typological differences among groups of countries.
The composition of the clusters is presented in
Table 3, the distribution of countries across clusters by World Bank region and income group is shown in
Table 4, the mean scores by goal for each cluster are shown in
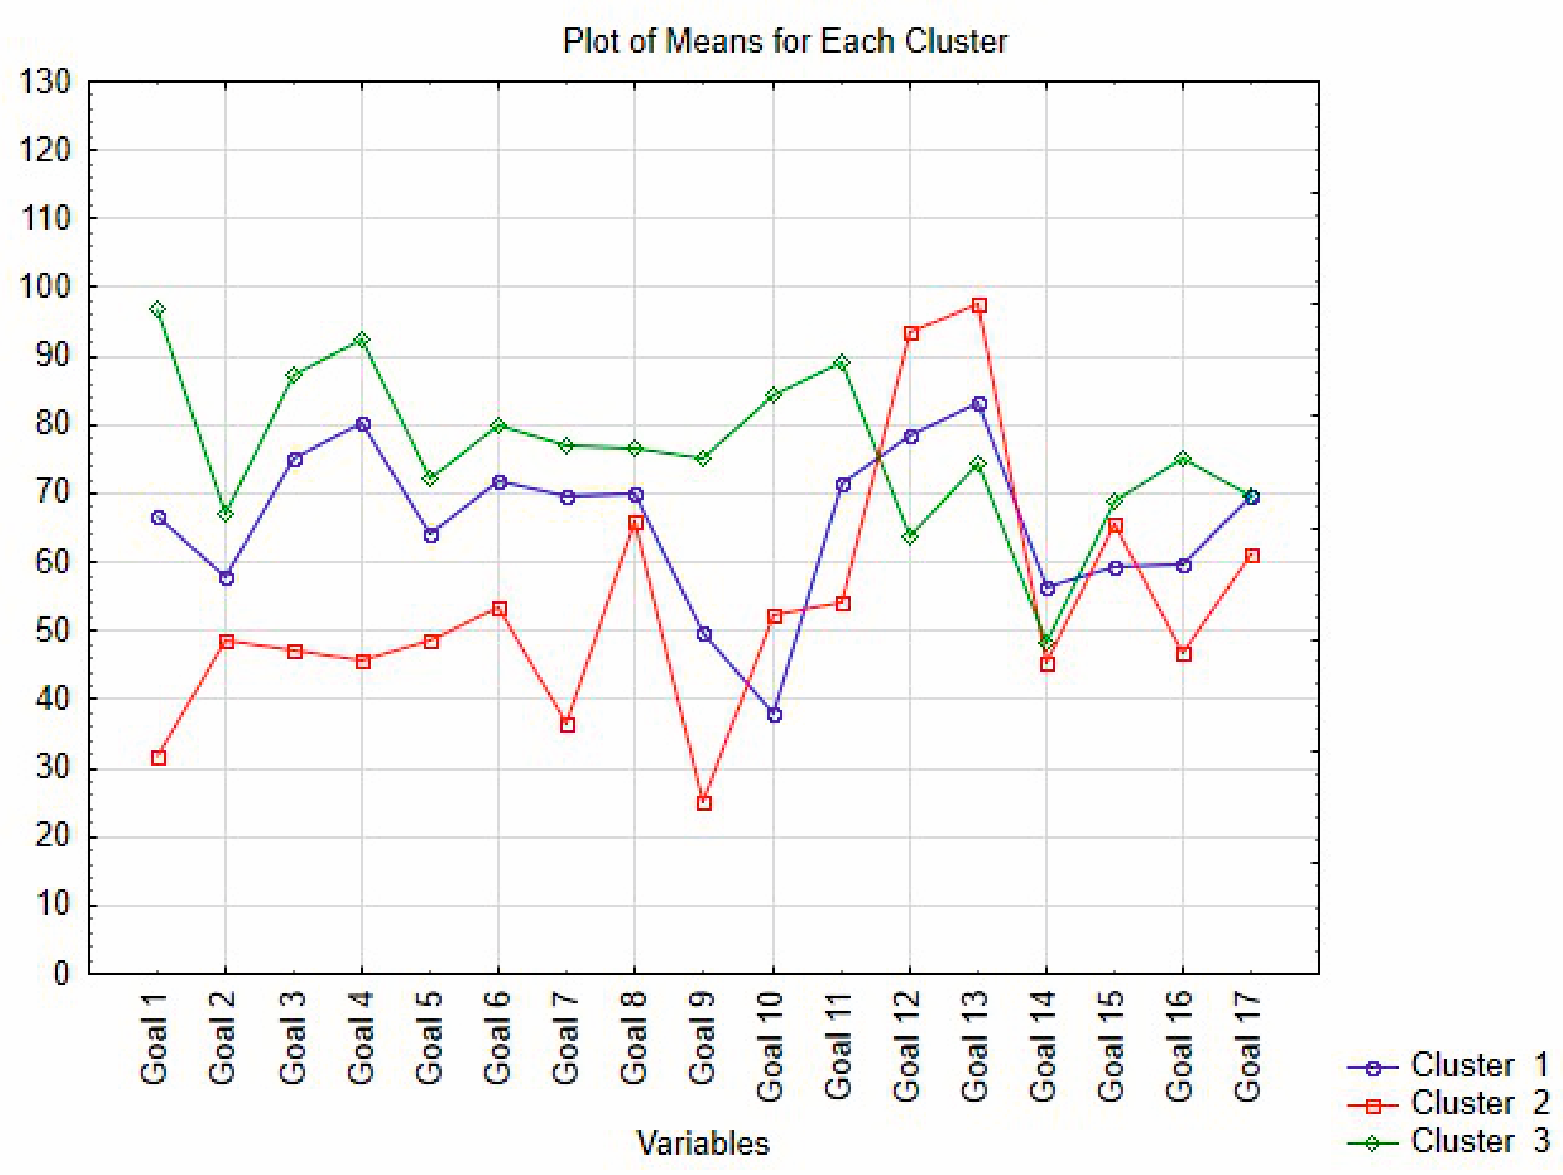
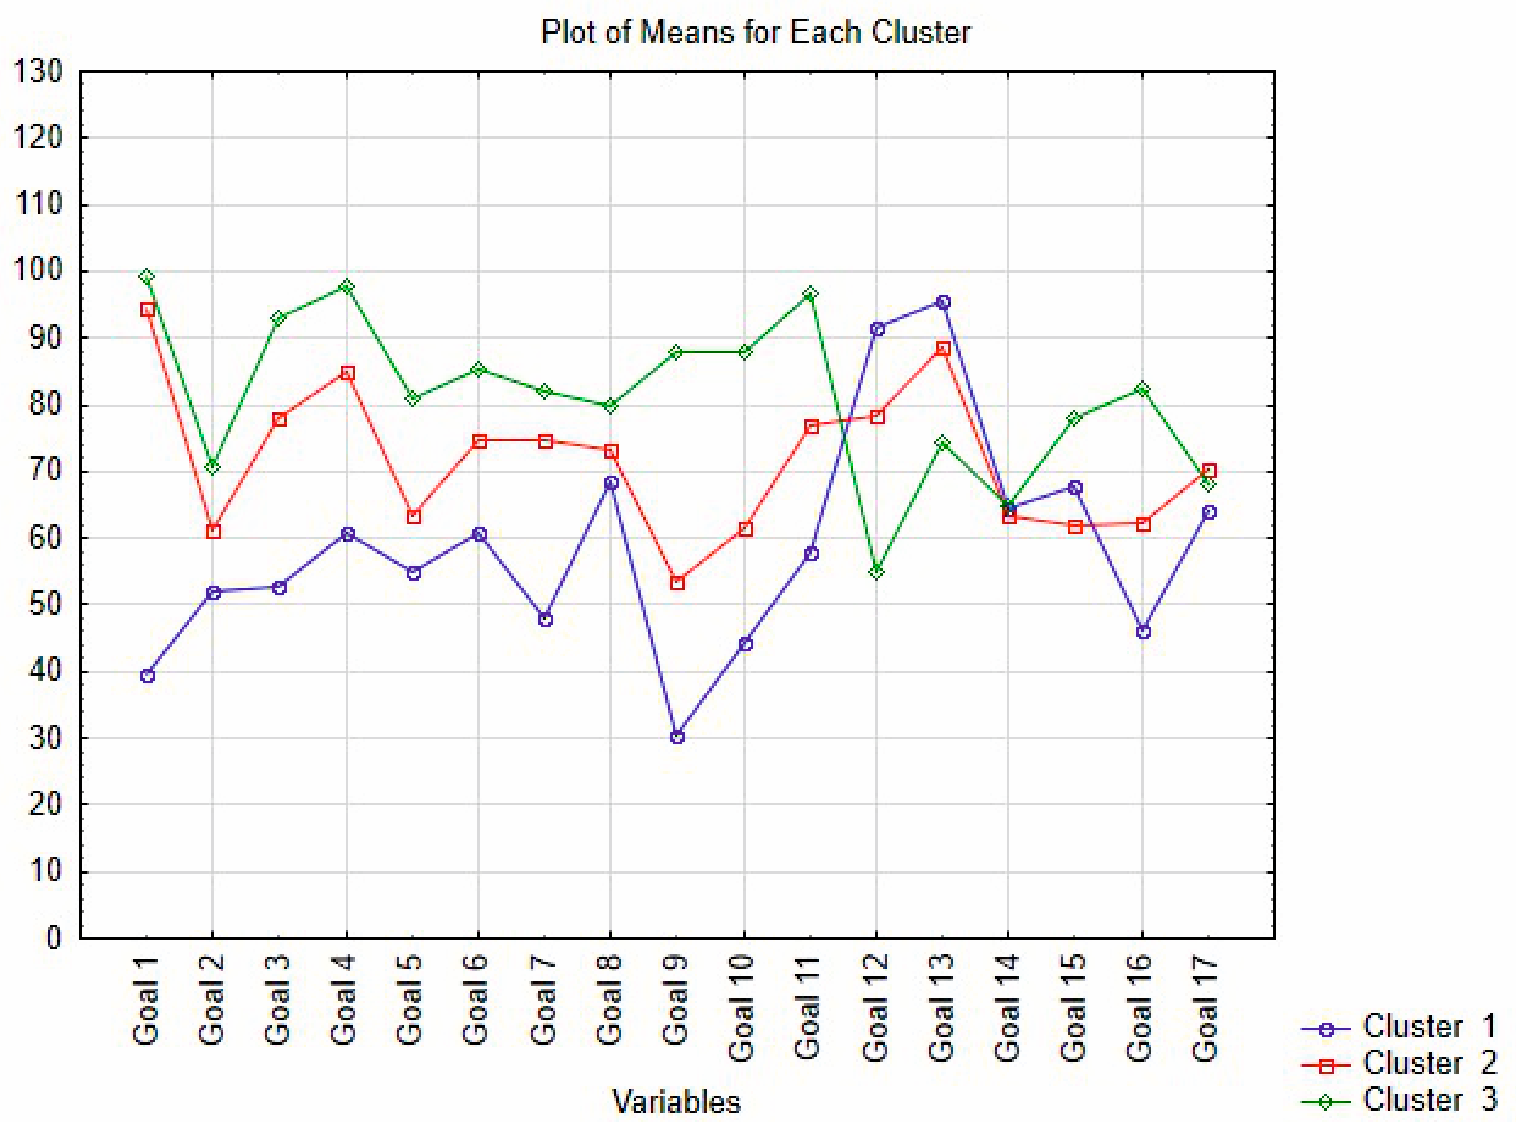
Table 5, and the graphical interpretation is provided in
Figure 3.
The internal heterogeneity of Cluster I warrants particular attention. Despite sharing a medium-level SDG achievement profile, the 52 countries span highly diverse geographical and economic contexts: Latin America (Brazil, Mexico, Argentina), South and Southeast Asia (India, Indonesia, Philippines), the Middle East (Egypt, Iran, Jordan), Sub-Saharan Africa (Ghana, South Africa, Botswana), and high-income Gulf states (Bahrain, Kuwait, Saudi Arabia, Singapore) whose SDG profiles nonetheless place them in this intermediate group rather than Cluster III. This confirms that the SDG achievement profile is an independent analytical characteristic not reducible to income level.
The distances between the cluster centroids (
Table 6) confirm that Clusters II and III are the most dissimilar (Euclidean distance = 32.99), whereas Clusters I and III are the closest to each other (17.73). This distance structure is consistent with the pattern of classification errors identified at the stage of discriminant analysis and discussed in detail in the following subsection.
Cluster I includes 52 countries with predominantly medium levels of SDG achievement—countries of Latin America, South and Southeast Asia, the Middle East, and Sub-Saharan Africa with relatively higher income levels (including Brazil, Mexico, India, Indonesia, South Africa, and Ukraine). The cluster is characterized by relatively high scores for Goal 12 (78.63) and Goal 13 (83.23), which is consistent with moderate consumption levels and relatively low CO2 emissions per capita, typical of middle-income countries where industrialization has not yet reached the level of developed economies. In contrast, the lowest scores were recorded for Goal 10 (reduced inequalities, 38.04) and Goal 9 (industry, innovation, and infrastructure, 49.84), consistent with structural characteristics in the areas of economic inclusiveness and technological development.
Cluster II includes 42 countries—predominantly the least developed countries of Sub-Saharan Africa, as well as several countries in Asia and the Middle East (Haiti, Myanmar, Pakistan, Syria, and Yemen). This cluster demonstrates the lowest mean scores for most social and institutional goals, in particular Goal 1 (no poverty, 31.84), Goal 3 (good health and well-being, 47.27), Goal 4 (quality education, 45.84), and Goal 16 (peace, justice, and strong institutions, 46.91). At the same time, this cluster stands out for the highest scores for Goal 12 (93.72) and Goal 13 (97.46)—a pattern that appears not to reflect environmental responsibility, but rather to be associated with an extremely low level of consumption and industrial activity.
The described paradox of Goals 12 and 13 is a methodologically important caveat: the highest scores on the environmental goals are demonstrated by the poorest countries solely as a result of their low level of economic activity, rather than targeted environmental policy. This indicates the limitations of certain SDG indicators outside the economic context of a country and constitutes an important signal for the developers of the global monitoring system.
Cluster III is the largest (60 countries) and includes predominantly high-income countries—states of Western and Central Europe, North America, Australia, New Zealand, Japan, and South Korea—as well as some upper-middle-income countries that demonstrate steady progress in the field of sustainable development (China, Vietnam, the Baltic states, and the countries of Central Asia). The cluster is characterized by the highest scores for most social, economic, and institutional goals: Goal 1 (96.97), Goal 4 (92.51), Goal 10 (84.44), Goal 11 (89.25), and Goal 16 (75.24). At the same time, relatively lower scores for Goals 12 (63.79) and 13 (74.47) reflect higher levels of consumption and greater per capita emissions—a structural characteristic of developed economies that remains one of the key challenges of global sustainability.
Overall, the identified clusters correspond to the gradation of countries by level of economic development, but do not coincide with it completely. It is noteworthy that countries such as Singapore, Kuwait, Bahrain, and Saudi Arabia, despite their high income level, were assigned to Cluster I rather than Cluster III. This confirms that the SDG achievement profile is an independent analytical characteristic of a country that cannot be reduced to traditional indicators of economic well-being.
The graphical analysis (
Figure 3) visually confirms the identified patterns. The greatest dispersion among the three profiles is observed for Goal 1, Goal 9, and Goal 10, which is consistent with the highest values of the F-statistic for these variables. A pronounced inter-cluster gap is also observed for Goal 3, Goal 4, and Goal 16, where Cluster III consistently outperforms the other two, while Cluster II records the lowest values. In contrast, for Goal 14 and Goal 17, the cluster profiles converge, which is consistent with the statistically weakest differentiation across these variables. The characteristic crossing of the lines in the area of Goal 12 and Goal 13, where Cluster II sharply exceeds the others, graphically confirms the methodological paradox of the environmental goals described above.
The obtained results indicate that the countries of the world form three clearly differentiated typological groups according to their SDG achievement profiles. To deepen the analysis and move from the description of typological differences to the identification of structural indicators statistically associated with group separation, discriminant analysis was applied at the next stage.
4.2. Discriminant Analysis Results
To identify the structural indicators statistically associated with countries’ membership in the identified clusters, canonical discriminant analysis was performed for 64 countries for which the values of the 17 indicators selected for the analysis are available (
Table 2).
To ensure consistency of group membership between the two stages of the study, cluster analysis was conducted on the sample of 64 countries. The cluster profiles reproduce the same hierarchy and pattern of between-group differences as in the full sample (154 countries). This is clearly confirmed by the graph of mean values (
Figure 4) and indicates the representativeness of the reduced sample.
The results of the discriminant analysis are presented in
Table 7 and
Table 8.
Table 7 presents the classification matrix, which reflects the accuracy of assigning countries to clusters based on the constructed discriminant functions.
The overall classification accuracy was 90.63%, indicating a high discriminatory power of the constructed model within the estimation sample. To assess the stability of the classification, leave-one-out (LOO) cross-validation was performed for the 64 countries with complete data across all 17 indicators. The LOO cross-validated accuracy was 71.43% (
Table 8), which is substantially above the level expected by chance for a three-group classification (33.3%) and confirms that the model retains meaningful discriminatory power beyond the estimation sample. The difference between apparent and cross-validated accuracy is partly attributable to the high predictor-to-observation ratio (17 predictors, 64 observations), which is known to produce optimistic resubstitution estimates in small samples. The cross-validated results indicate that Cluster III is classified most stably (86.21% correct), while Clusters I and II show greater overlap under LOO conditions, consistent with their closer centroid distances reported in
Table 5.
The highest level of correct classification was achieved for Cluster III (93.33%) and Cluster II (92.31%), whereas for Cluster I it was somewhat lower (85.71%). Notably, the classification errors were exclusively of a “neighboring” nature: countries from Cluster I were misclassified only into Cluster II or Cluster III, but no misclassification occurred directly between the extreme groups. This confirms that the identified clusters form a developmental continuum between the distinguished types.
No reassignment of misclassified observations was performed, since the group membership of countries was determined at the first stage by cluster analysis and is substantively justified; changing the group membership of individual observations would contradict the logic of the two-stage approach and would reduce the interpretability of the results.
Table 9 presents the classification functions of discriminant analysis—linear combinations of predictors that make it possible to assign each country to one of the three clusters based on the values of the selected indicators.
The analysis of the classification functions (
Table 9) makes it possible to identify the indicators with the greatest discriminatory power. The highest absolute coefficient values are observed for LPI and GPI, highlighting the strong statistical association of infrastructure development and institutional stability with typological differences between countries. It should be noted that the high absolute values of the LPI and GPI coefficients in the classification functions are driven by the scale of the original variables and are not directly comparable with standardized coefficients. Substantial differences between the clusters are also observed for the coefficients of CO
2 and FLII. In particular, the considerably higher CO
2 coefficient for Cluster III (1.903 versus 1.122 and 1.181) is consistent with the structurally higher emission levels of developed economies, whereas the higher FLII coefficient for Cluster III is consistent with greater forest landscape integrity observed in countries with more developed environmental protection systems. By contrast, the coefficients for UEM and OHI are close to zero in all three functions, indicating their minimal contribution to cluster differentiation.
Table 10 presents the results of the significance test of the canonical roots of the discriminant model.
The test results indicate that the first discriminant function is statistically significant at the level of and explains the predominant share of between-group variation, as evidenced by the high eigenvalue (5.803) and canonical correlation of 0.924. This means that the first function separates the three clusters of countries in the discriminant space with very high power. The second function, by contrast, does not reach statistical significance (), indicating that the additional differentiation between the clusters contributed by this function is marginal. Thus, the distribution of countries across clusters is primarily accounted for by one dominant discriminant function, which simplifies the interpretation of the model and increases its practical value for classification purposes.
Table 11 presents the standardized coefficients of the canonical variables, which make it possible to assess the relative contribution of each indicator to the formation of the discriminant functions.
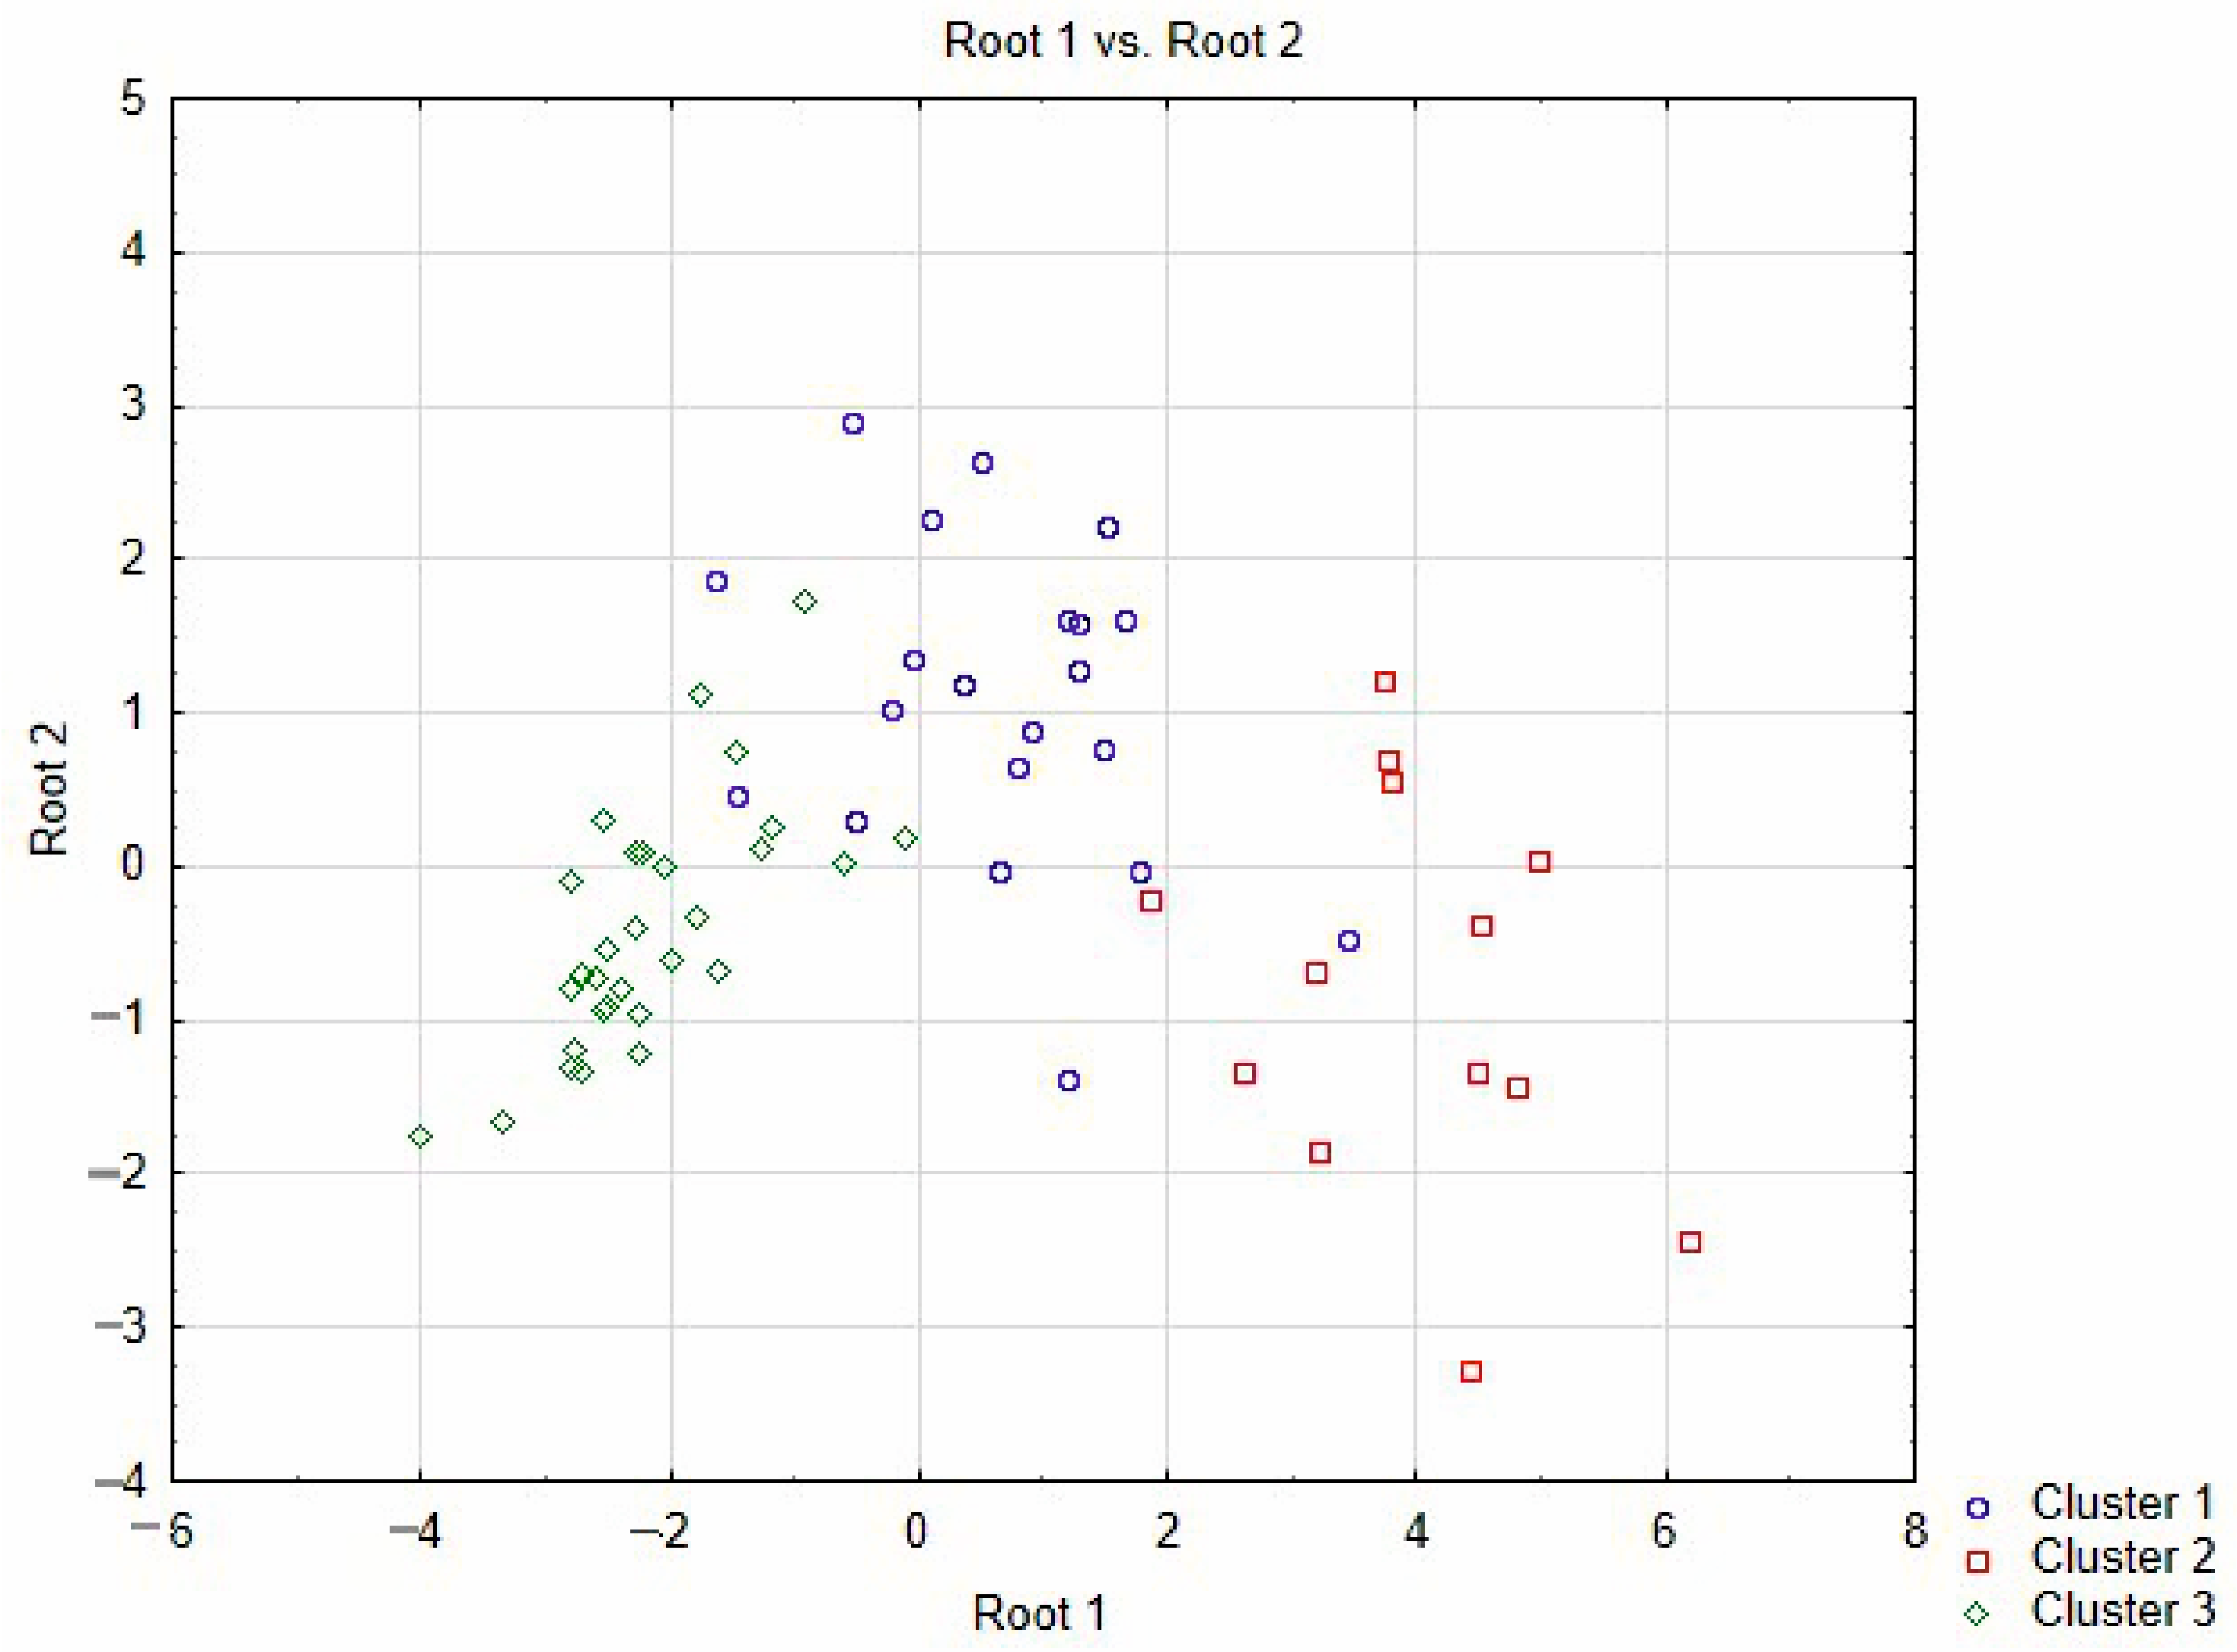
The first discriminant function (Root 1) explains 90.3% of the between-group variation, confirming its dominant role in the distribution of countries across clusters. The greatest contribution to this function is made by PUP (proportion of urban population living in slums, 0.608) and GPI (Global Peace Index, 0.589) with positive coefficients, as well as JMP_SAN (access to sanitation, −0.402) and WBPHR (poverty, 0.402), which together define the first axis of differentiation as an axis of “basic human development and institutional stability”. The second function (Root 2) explains the remaining 9.7% of the variation. As it does not reach conventional levels of statistical significance (p = 0.059), it should be interpreted only cautiously and descriptively. Descriptively, it is associated primarily with POU (−0.592), CO2 (−0.482), and REC (−0.422), which may tentatively suggest an axis of “environmental and food-related pressure”; however, this interpretation is not statistically supported and should not be treated as a substantive finding.
The graphical interpretation of the discriminant analysis results in the space of two canonical functions (
Figure 5) confirms the quality of the constructed model: the points corresponding to the countries of the three clusters form clearly separated clouds with limited overlap. This indicates that the selected 17 indicators, taken together, ensure a high degree of linear separation of the identified typological groups in the canonical space, and that the boundaries between the clusters are statistically substantiated and robust.
Summarizing the results of the discriminant analysis, it should be noted that the constructed model demonstrates high classification accuracy (90.63%; ) and LOO cross-validated accuracy of 71.43%, which confirms its validity for the typologization of countries according to their SDG achievement profiles. The main structural indicators associated with inter-cluster differentiation were found to be indicators of basic human development and institutional stability—primarily access to sanitation (JMP_SAN), financial inclusion (AO), the level of peace (GPI), and CO2 emissions (CO2)—which together form the first and most powerful axis of the distribution of countries in the discriminant space.
Overall, the results of the two-stage analysis indicate that the trajectories of sustainable development are associated not with isolated individual factors but with a combination of infrastructural, institutional, and environmental correlates acting in concert. The identified patterns may have practical relevance: for countries seeking to change their typological position, the identified patterns suggest that the structural correlates most clearly associated with typological positioning concern basic infrastructure, financial accessibility, and institutional quality—precisely those dimensions that most consistently differentiate country groups on the path to 2030.