1. Introduction
In the current socioeconomic landscape, housing is established as a fundamental right in the Constitution of the Portuguese Republic, playing a key role in promoting social cohesion and addressing structural inequalities. However, in recent decades, complex economic, demographic, and urban dynamics have intensified disparities in access to adequate housing conditions. Municipalities and central governments face rising pressures to mitigate the effects of soaring rental prices, a scarcity of affordable options, and gentrification phenomena, which have contributed to the intensification of urban polarization and the vulnerability of large population segments. These challenges are further amplified in metropolitan areas where the cost of living increasingly outpaces income growth. As the housing market continues to fluctuate, the ability to systematically identify and monitor these disparities has become essential for effective governance. In this context, monitoring social and economic inequalities becomes crucial, to raise public awareness and as pathway to a more inclusive society.
Housing inequalities constitute one of the most significant obstacles to social and economic progress. They affect not only access to housing but also the quality of living conditions and their consequences for health, education, and community integration. The lack of adequate housing restricts both individual and collective opportunities, accentuating cycles of poverty and social exclusion while undermining territorial cohesion. In a context characterized by significant shifts in housing markets and demographic pressure in urban centers, a systematic approach is crucial to monitor these inequalities. Existing official data sources offer valuable insights into these dynamics but require careful integration. The resulting analysis can be used by public authorities to gain a deeper understanding of the structural challenges of this sector and create effective public policies aimed at mitigating social and economic inequalities.
PLANAPP—the Centre for Planning and Public Policy Evaluation (
https://planapp.gov.pt/)—is a state body that aims to support the design and implementation of public policies and prospective analysis. Its main objective is to support and strengthen the different phases of the public policy cycle (planning, monitoring, evaluation, and impact analysis) with the aim of improving public policy design and implementation. This study is a result of a collaboration between academia and PLANAPP, focused on developing an analytical framework to monitor social and economic inequalities in housing. The study uses public data from official and internationally recognized sources, such as Statistics Portugal (
https://www.ine.pt/) (INE, from Portuguese National Statistics Institute); Eurostat (
https://ec.europa.eu/eurostat); the Organization for Economic Co-operation and Development (OECD) (
https://www.oecd.org/); and the Strategy and Planning Office (
https://www.gep.mtsss.gov.pt/) (GEP, from the Portuguese name) from the Ministry of Labor, Solidarity, and Social Security. The use and integration of multiple official sources enables a richer analysis and a comparison of indicators with different scales, granularity, and context.
This study provides a data preparation and visualization approach that can be applied to other social and economic inequality dimensions or adapted to other contexts to analyze official statistical data for better governance. This paper presents an analysis of housing inequalities in Portugal, examining the evolution of bank valuation values, the structure of the housing stock, and the dynamics of new construction between 2015 and 2025. Through this data-driven approach, this study contributes to ongoing efforts to enhance public policies and provides a replicable framework for understanding the reality of a national housing market.
Despite the growing research on housing inequalities, relatively few studies translate official statistical data into integrated and reproducible analytical workflows supporting continuous monitoring across territorial scales. In practice, many analyses remain descriptive or confined to a single spatial level, limiting their usefulness for tracking indirect and regional behavior over time. This paper addresses this gap by combining a multi-scale empirical analysis with a Business Intelligence (BI) and visual analytics framework designed for policy monitoring.
The remainder of this paper is structured as follows:
Section 2 presents related work and a literature review on social and economic inequalities in housing.
Section 3 describes the study area, data, and method adopted.
Section 4 presents the results, discussing their significance regarding territorial polarization and housing supply dynamics. Finally,
Section 5 outlines the main conclusions and contributions of this study.
2. Related Work
Housing is widely recognized in the academic literature not merely as a physical shelter but also as a determinant of health, well-being, and social inclusion [
1]. Access to adequate housing is intrinsic to the realization of the United Nations Sustainable Development Goals (SDGs), particularly SDG 11 on sustainable cities and communities and SDG 10 on reducing inequalities. Despite its formal recognition as a basic human right, housing remains a major source of inequality worldwide.
Housing is one of the key domains where socioeconomic inequalities are reproduced and reinforced. Housing inequality research documents persistent disparities in access, affordability, and housing quality, alongside the need for more inclusive housing policies and sustainable urban planning frameworks [
1]. Empirical evidence indicates that vulnerable social groups face elevated risks of housing discrimination and deprivation even after accounting for socioeconomic characteristics, pointing to structural barriers within housing markets [
2]. Evidence from Northern Europe also suggests that urban densification strategies do not automatically promote social inclusion, as they may entail socio-environmental trade-offs that require complementary policy measures to mitigate exclusionary outcomes [
3].
Housing inequality is characterized by the unequal availability of safe, affordable, accessible, and dignified living spaces [
4]. James et al. conceptualize housing inequality as an uneven distribution of housing opportunities and resources, manifested through inadequate living conditions, unaffordable rents or mortgages, and structural barriers limiting access to desirable residential environments [
5]. These disparities are deeply intertwined with broader socioeconomic and demographic factors. Characteristics such as age, gender, ethnicity, education, and income are key determinants influencing both the probability of homeownership and the housing quality [
6,
7,
8,
9]. Furthermore, the rapid urbanization and market dynamics observed in recent decades have intensified these issues. The increasing demand in urban areas has driven housing prices beyond the reach of lower-income populations, increasingly relegating them to substandard living arrangements [
10].
A critical dimension of housing inequality is discrimination, which creates barriers that extend beyond financial capacity. The literature distinguishes between taste-based discrimination, where housing providers exhibit preferences for members of their own social group, and statistical discrimination, whereby stereotypes are used to infer the reliability of potential tenants [
11]. These mechanisms are particularly evident in the rental market.
Experimental studies across Europe, such as the work of [
12] in Ireland, have revealed evidence of ethnic and gender bias, demonstrating that minority groups face disproportionate difficulties in securing dignified housing compared to the majority population. Closely related is the concept of housing deprivation, defined as a form of material deprivation associated with physical structural deficiencies (such as dampness or inadequate heating) and a lack of basic facilities [
13]. This form of deprivation is not evenly distributed for all societal groups. Recent analyses also in Ireland, based on the Survey on Income and Living Conditions (SILC), indicate that vulnerable groups, including young adults aged 18 to 34, persons with disabilities, and single-parent households, are significantly more likely to experience these precarious conditions, even when controlling for other socioeconomic variables [
2].
Parallel to social exclusion, the economic dimension of housing has become more prominent in European policy debates, often framed as a persistent “housing crisis.” Le Goix et al. show that housing costs in major European cities have increased at a faster pace than household incomes since the 1990s, generating a widening gap in housing accessibility [
14]. The concept of housing regimes, defined as the systematic interaction between housing systems, tenure structures, and welfare-state arrangements, has been used to explain these dynamics [
15]. These regimes have undergone substantial transformation over the past decades, particularly in relation to tenure structures and market regulations. There has been a notable decline in homeownership in certain countries, accompanied by an unprecedented expansion of the private rental sector and the emergence of corporate landlords [
16]. In contrast, countries like the Netherlands and France have attempted to stabilize ownership and affordability through regulatory reforms and renewed investments in social housing [
17,
18]. To assess these trends quantitatively, the Price-to-Income Ratio (PIR) remains a widely used indicator of housing affordability, relating housing prices to income levels, offering a clear metric for assessing financial pressure on households and informing housing policy intervention [
19,
20].
Recent European (EU) research shows that socioeconomic and housing inequalities are shaped by interactions between income distribution, household characteristics, territorial contexts, and institutional frameworks. Comparative studies reveal substantial EU cross-national variation in inequality of opportunity, particularly in labor markets, with estimates ranging from relatively low to markedly high levels, and little evidence that urban areas systematically function as “social elevators” relative to less urbanized regions [
21]. These findings challenge simplified narratives regarding the equalizing effects of urbanization and highlight the importance of national and regional policy contexts.
Beyond aggregate income measures, the literature also focuses on household-level mechanisms that shape inequality. Unequal intra-household resource allocation has been shown to bias conventional poverty and inequality estimates downward, masking higher levels of deprivation and disproportionately disadvantaging women, particularly in Central and Eastern Europe [
22]. Household composition, occupational sector, and degree of urbanization also emerge as key determinants of income inequality, with rural areas and low-wage sectors consistently associated with lower income levels across European countries [
23]. Educational similarity bias in partner selection (i.e., mating) further amplifies household income inequality, especially in Eastern European contexts, while its effects appear more limited in Nordic countries due to stronger gender equality and more redistributive welfare regimes [
24]. Territorial inequalities and measurement challenges also feature prominently in the European literature. Studies on regional poverty and inequality indicators demonstrate that standard measures often suffer from high uncertainty at sub-national scales, limiting their usefulness for policy design and evaluation [
25].
Comparative and intergenerational perspectives highlight the growing role of housing wealth in deepening socioeconomic inequalities. Cross-city analyses reveal substantial variation in housing affordability across Europe, reflecting dynamics between housing prices and household incomes [
14]. The increasing concentration of housing wealth reinforces both intergenerational and territorial inequalities, strengthening calls for fiscal and housing policies aimed at a more equitable redistribution of capital gains [
26]. Multidimensional and extreme poverty approaches further identify specific household profiles (such as unemployed individuals approaching retirement age and living alone) as being at heightened risk of deprivation, underscoring the importance of targeted housing and social policy interventions [
27].
Analyzing these inequalities requires a granular understanding of income distribution that goes beyond national averages, which often mask significant territorial heterogeneity. Ref. [
25] demonstrated that regional disparities in poverty and inequality are profound, with regions such as Southern Italy and Eastern Germany exhibiting much higher vulnerability than their respective national averages. Their findings suggest that standard indicators may suffer from high uncertainty at the sub-national level, advocating for the use of small-area estimation models, such as the Fay–Herriot model, to produce more stable estimates that can support targeted policy interventions. Equally important is the intra-household distribution of resources. Using small-area estimation techniques has improved the reliability of regional indicators, strengthening the empirical basis for targeted poverty-reduction strategies. Complementary approaches propose composite poverty indices to identify particularly vulnerable regions within the European Union, thereby supporting more effective spatial targeting of cohesion policies [
28].
While this literature provides important insights into the drivers and consequences of housing inequalities, fewer studies focus on how these dynamics can be operationalized through integrated analytical frameworks using official statistics. In particular, challenges related to data fragmentation, scale mismatches, and indicator comparability remain underexplored. This gap is especially relevant for policy-oriented analysis, where reproducible and scalable monitoring tools are required.
3. Data and Method
3.1. Study Area
This research focuses on the housing market dynamics in Portugal, which is currently experiencing a severe housing crisis, marked by shifts in real estate valuation and social accessibility. The analysis covers the entire national territory, focusing on the asymmetries between the coastal urban areas and the interior regions. According to the 2021 Census by Statistics Portugal (INE), the country is characterized by a “two-speed” demographic and economic reality. The metropolitan areas, specifically in Lisbon, Porto, and Algarve, concentrate most of the population, economic activity, and tourism pressure. These regions have witnessed the most significant accelerations in bank valuation values, creating a widening gap compared to the interior.
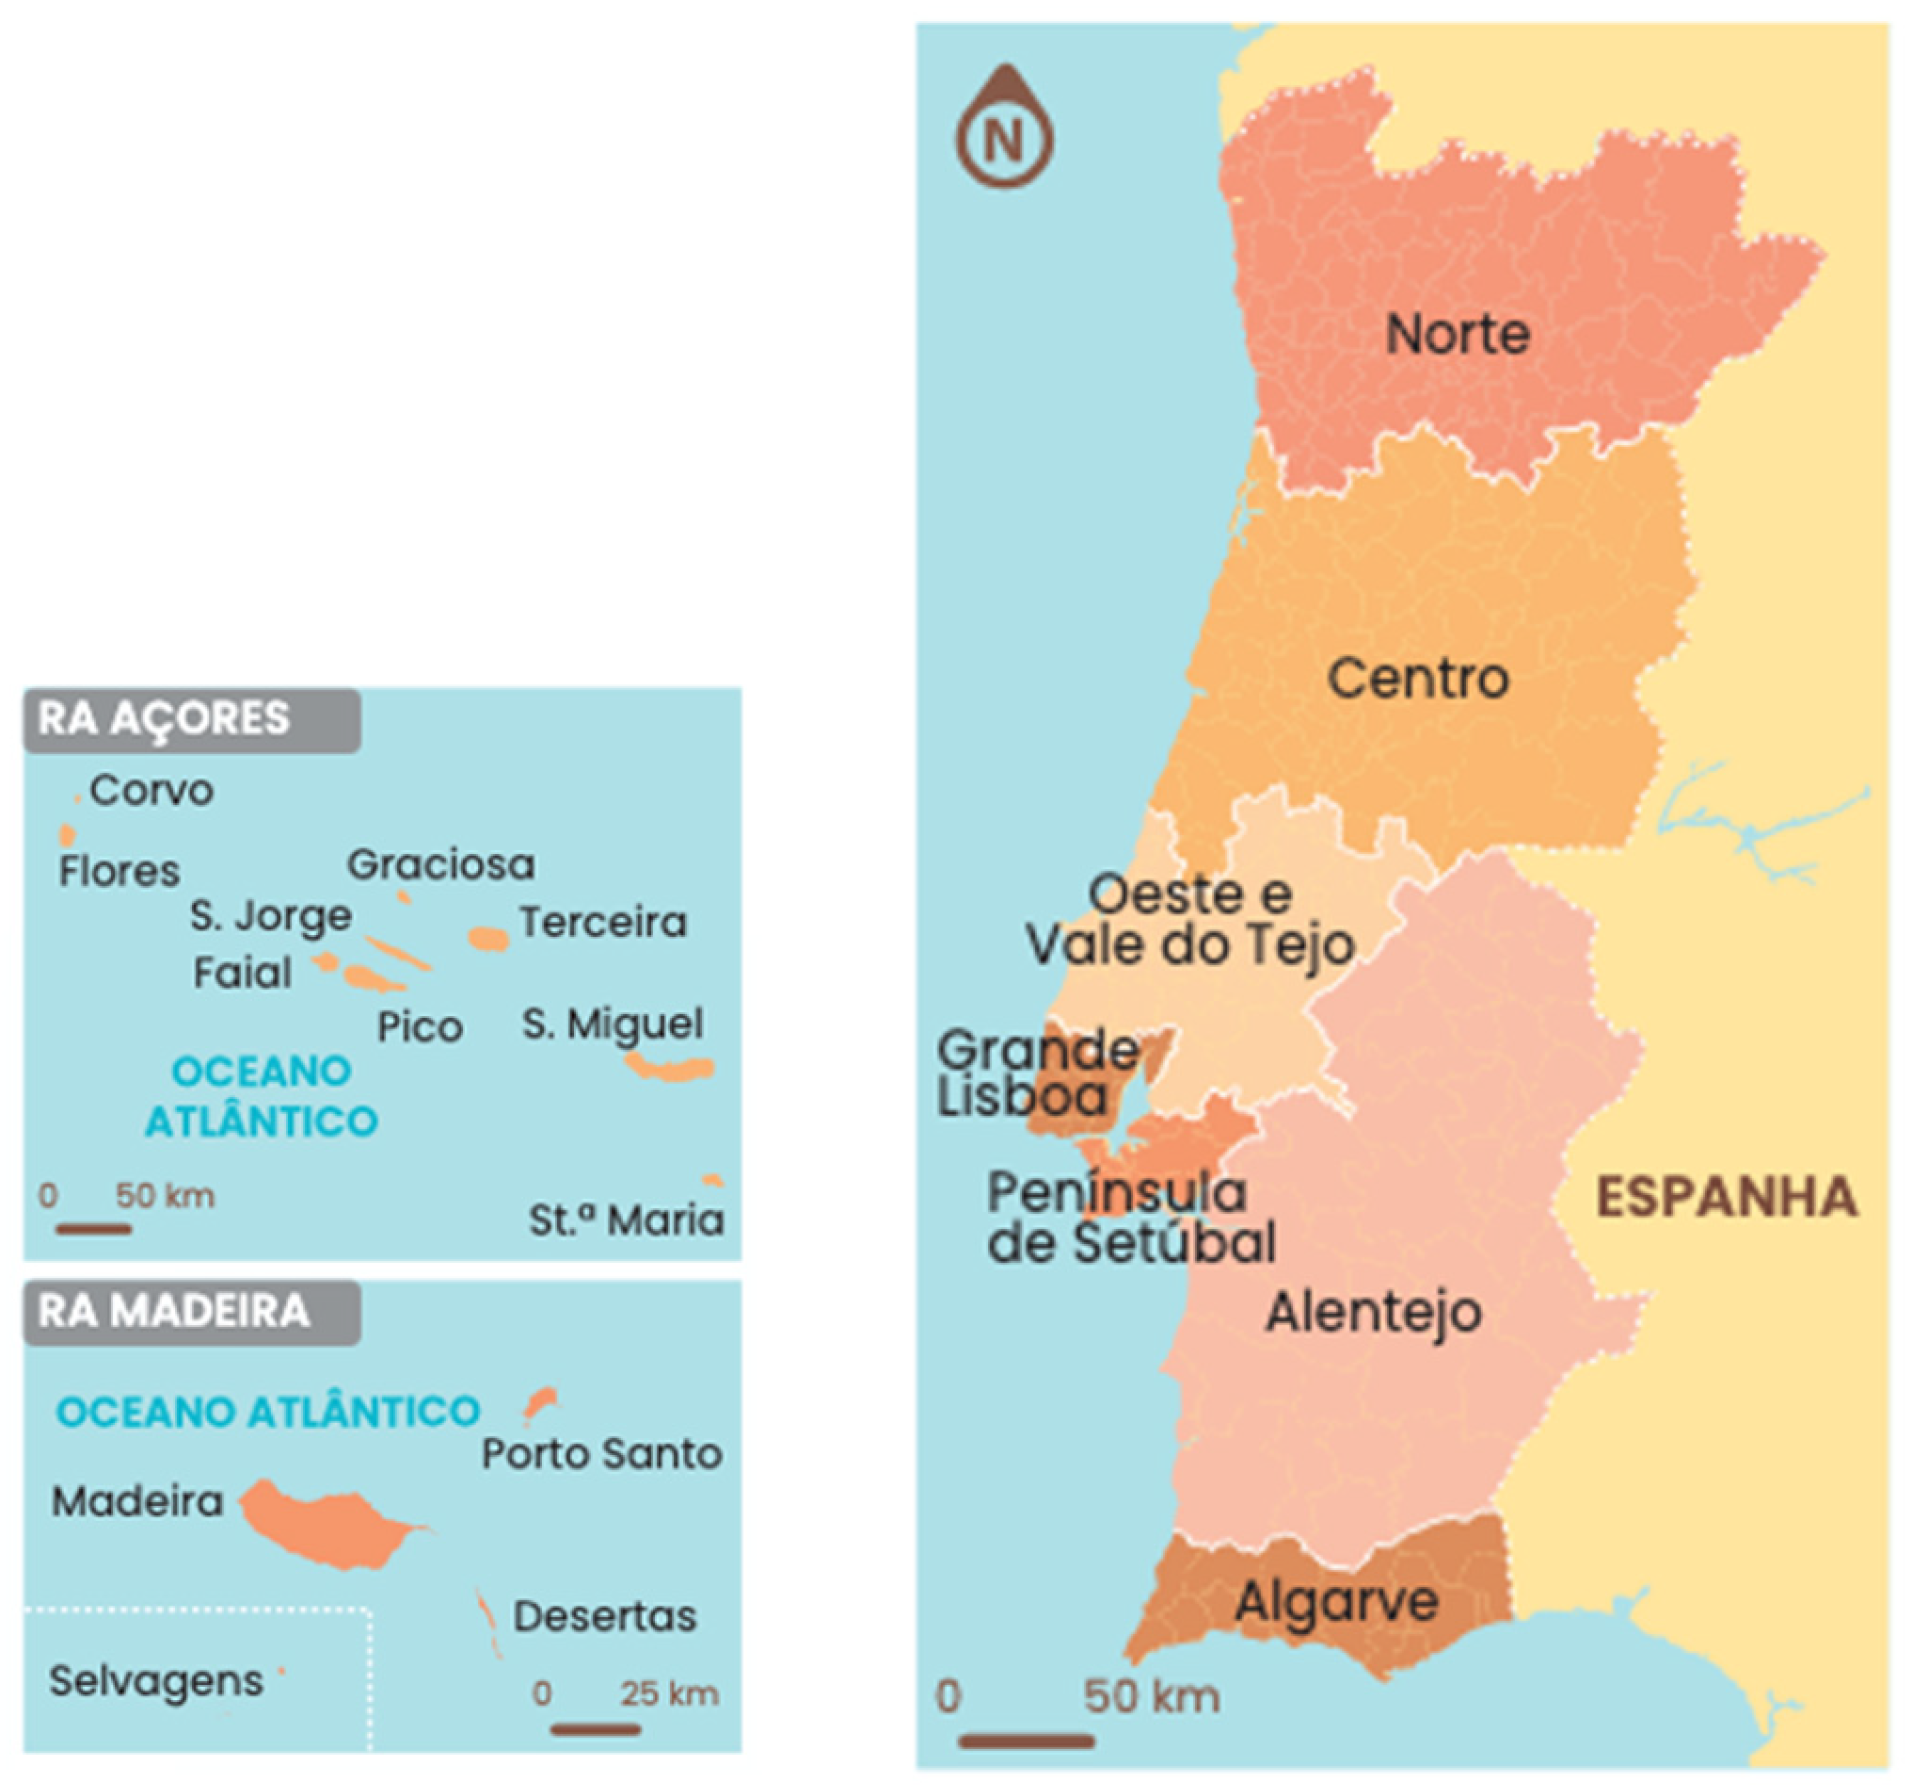
Identifying and understanding territorial disparities is critical as housing is not only a market asset but also a determinant of social cohesion. The study area is analyzed through a multidimensional approach, utilizing the NUTS 2024 classification (Nomenclature of Territorial Units for Statistics). The analysis drills down from the broad NUTS II regions (e.g.,
Norte,
Centro,
Grande Lisboa,
Península de Setúbal,
Alentejo, and
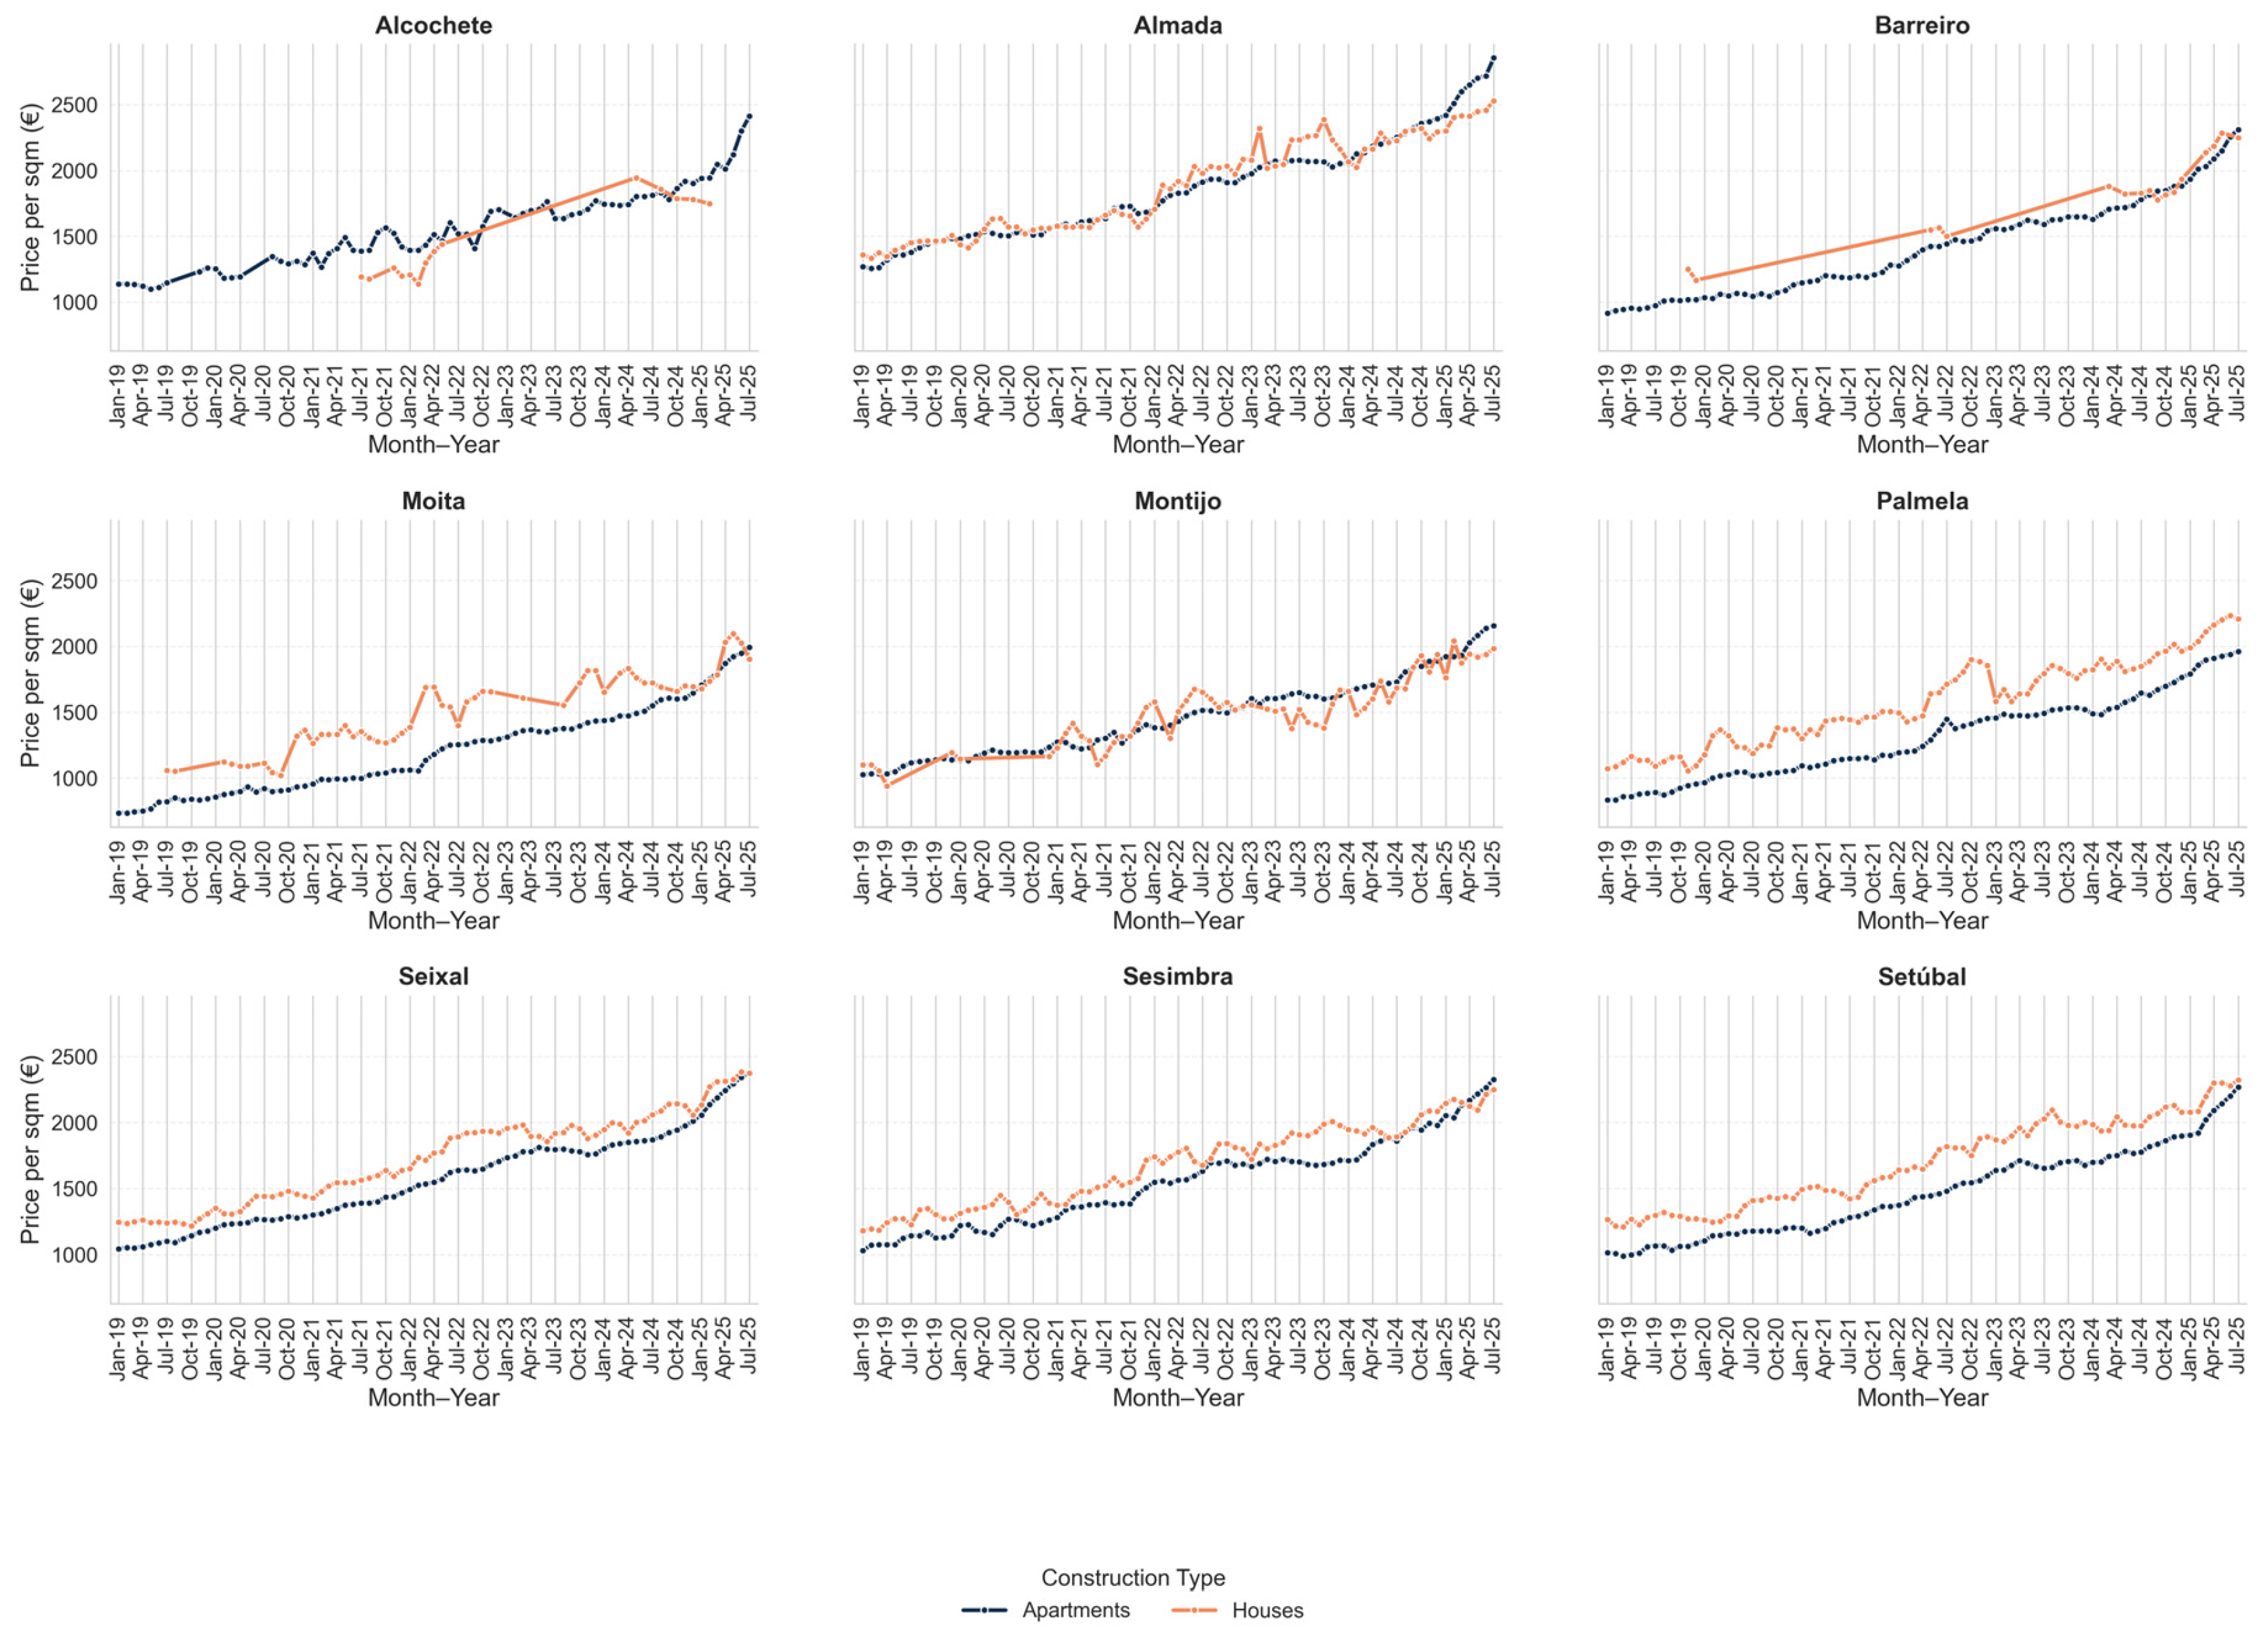
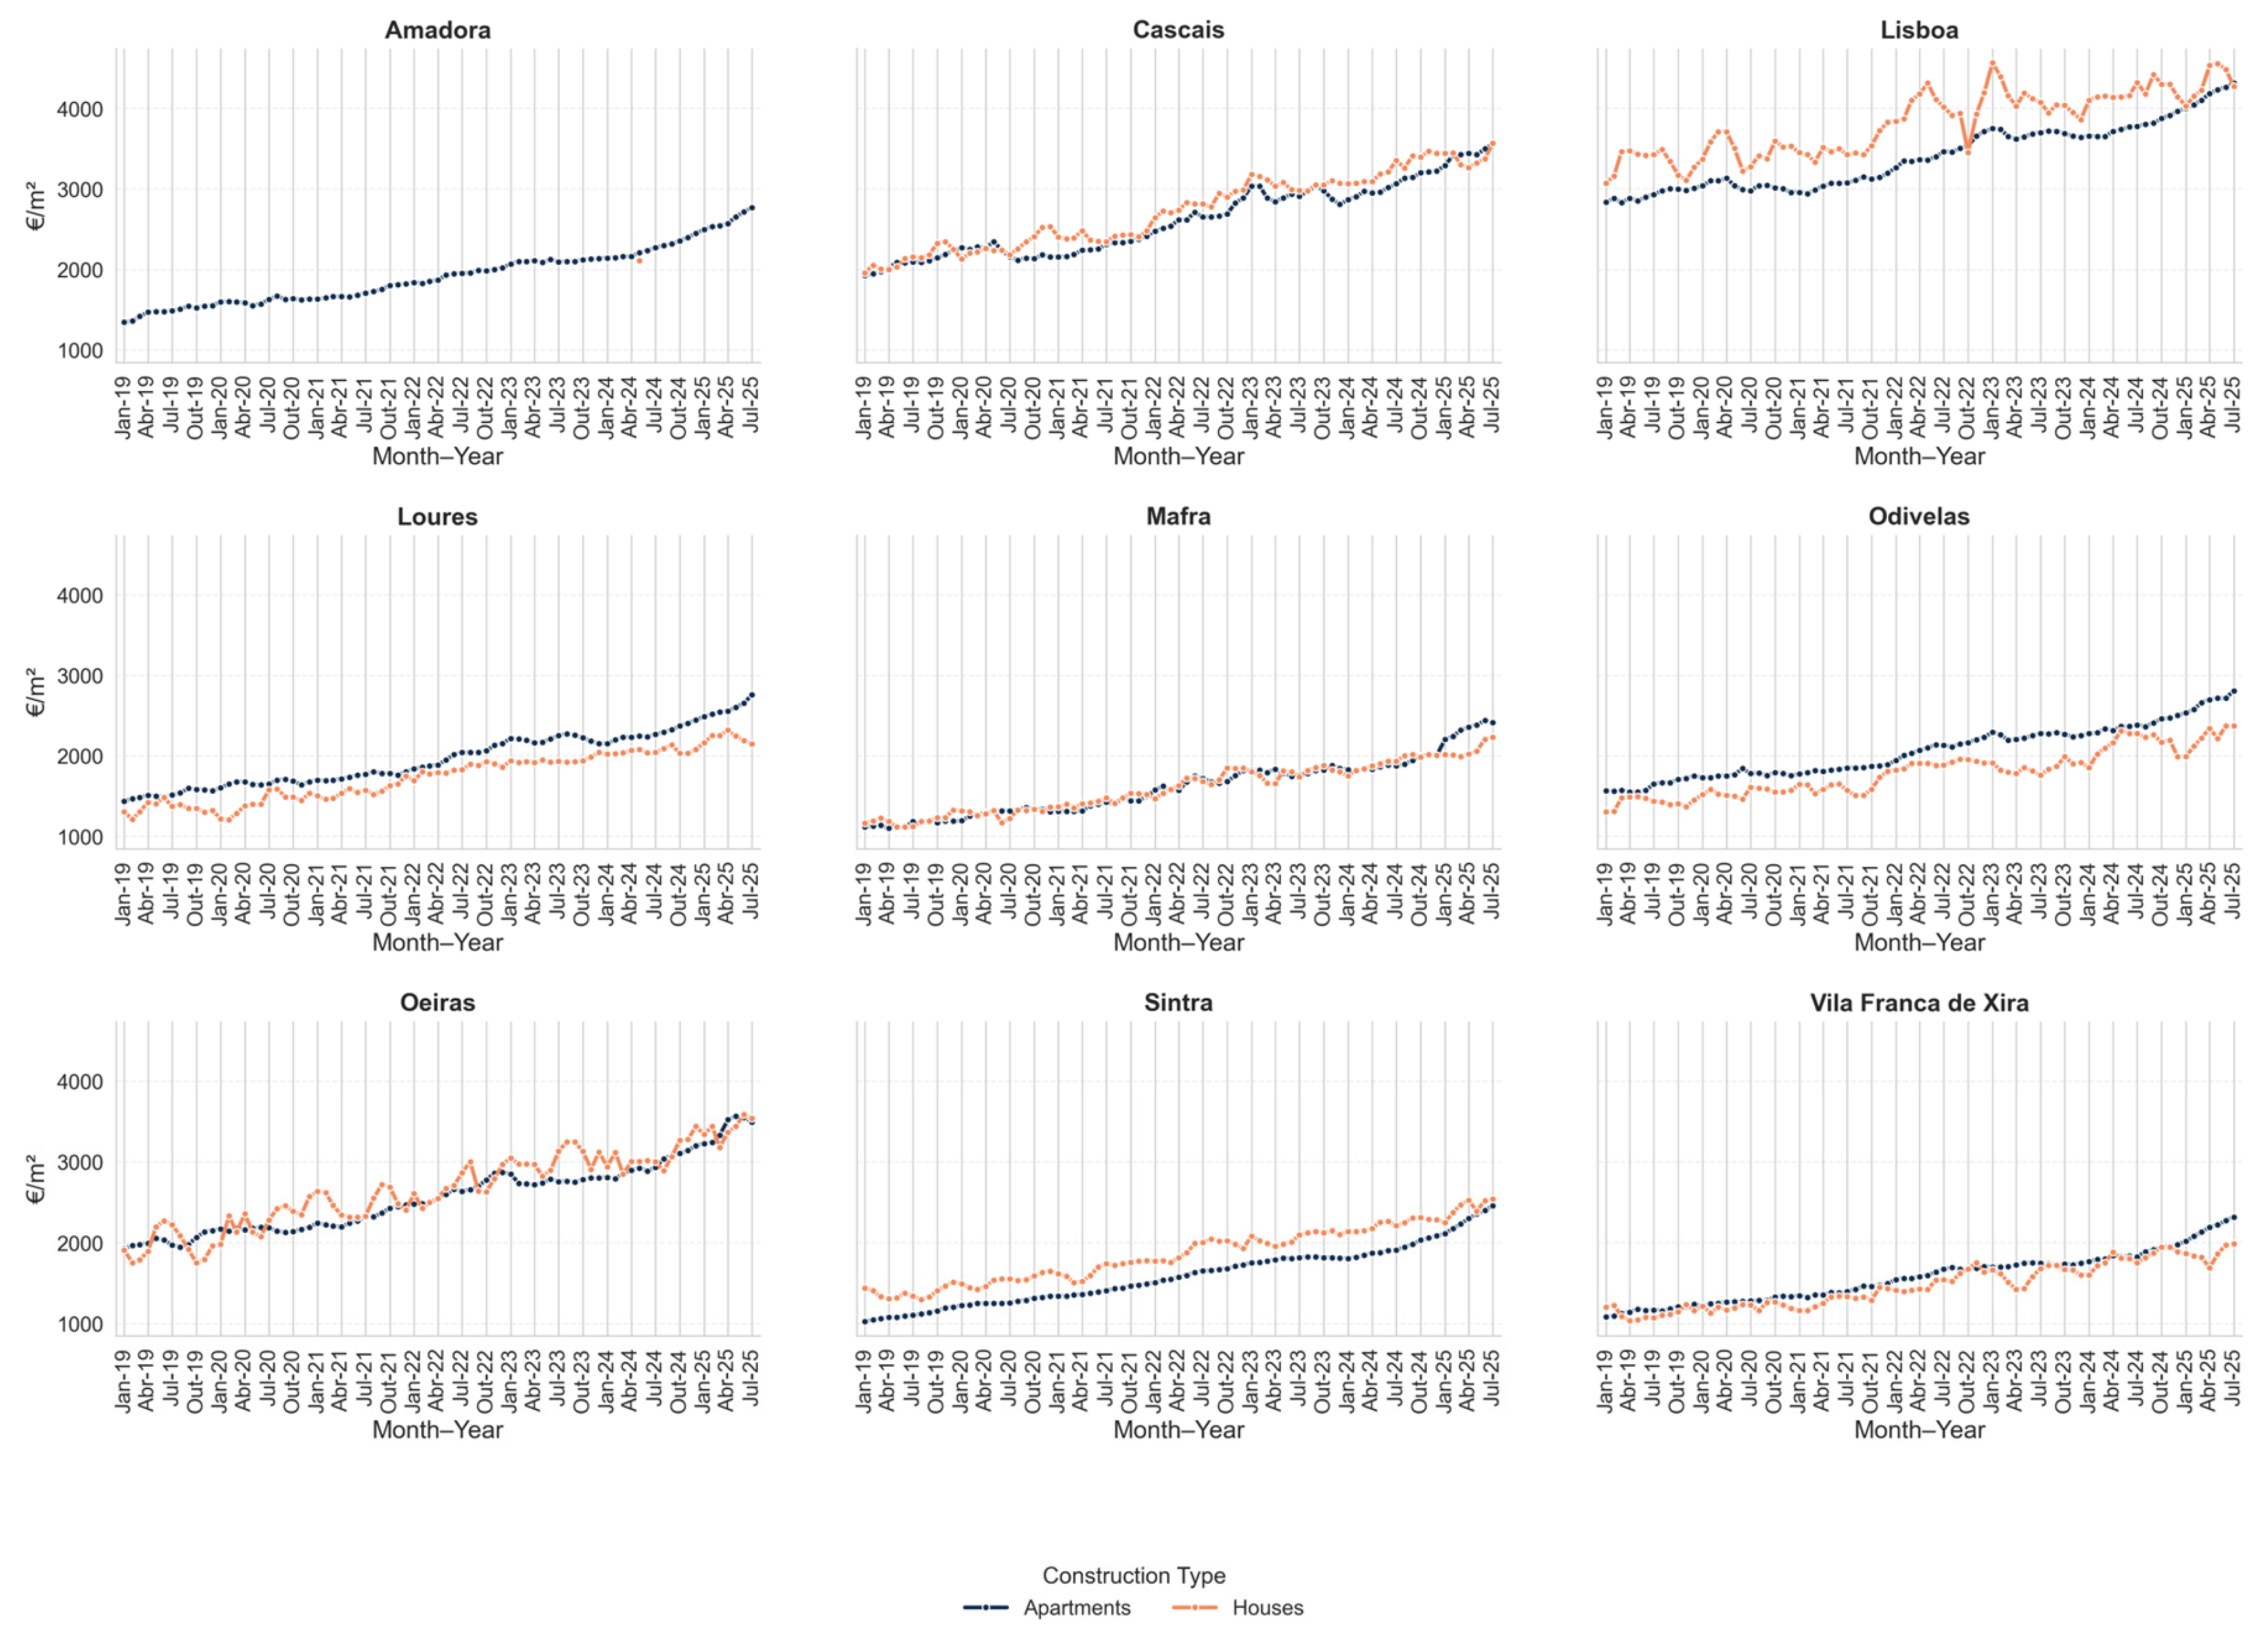
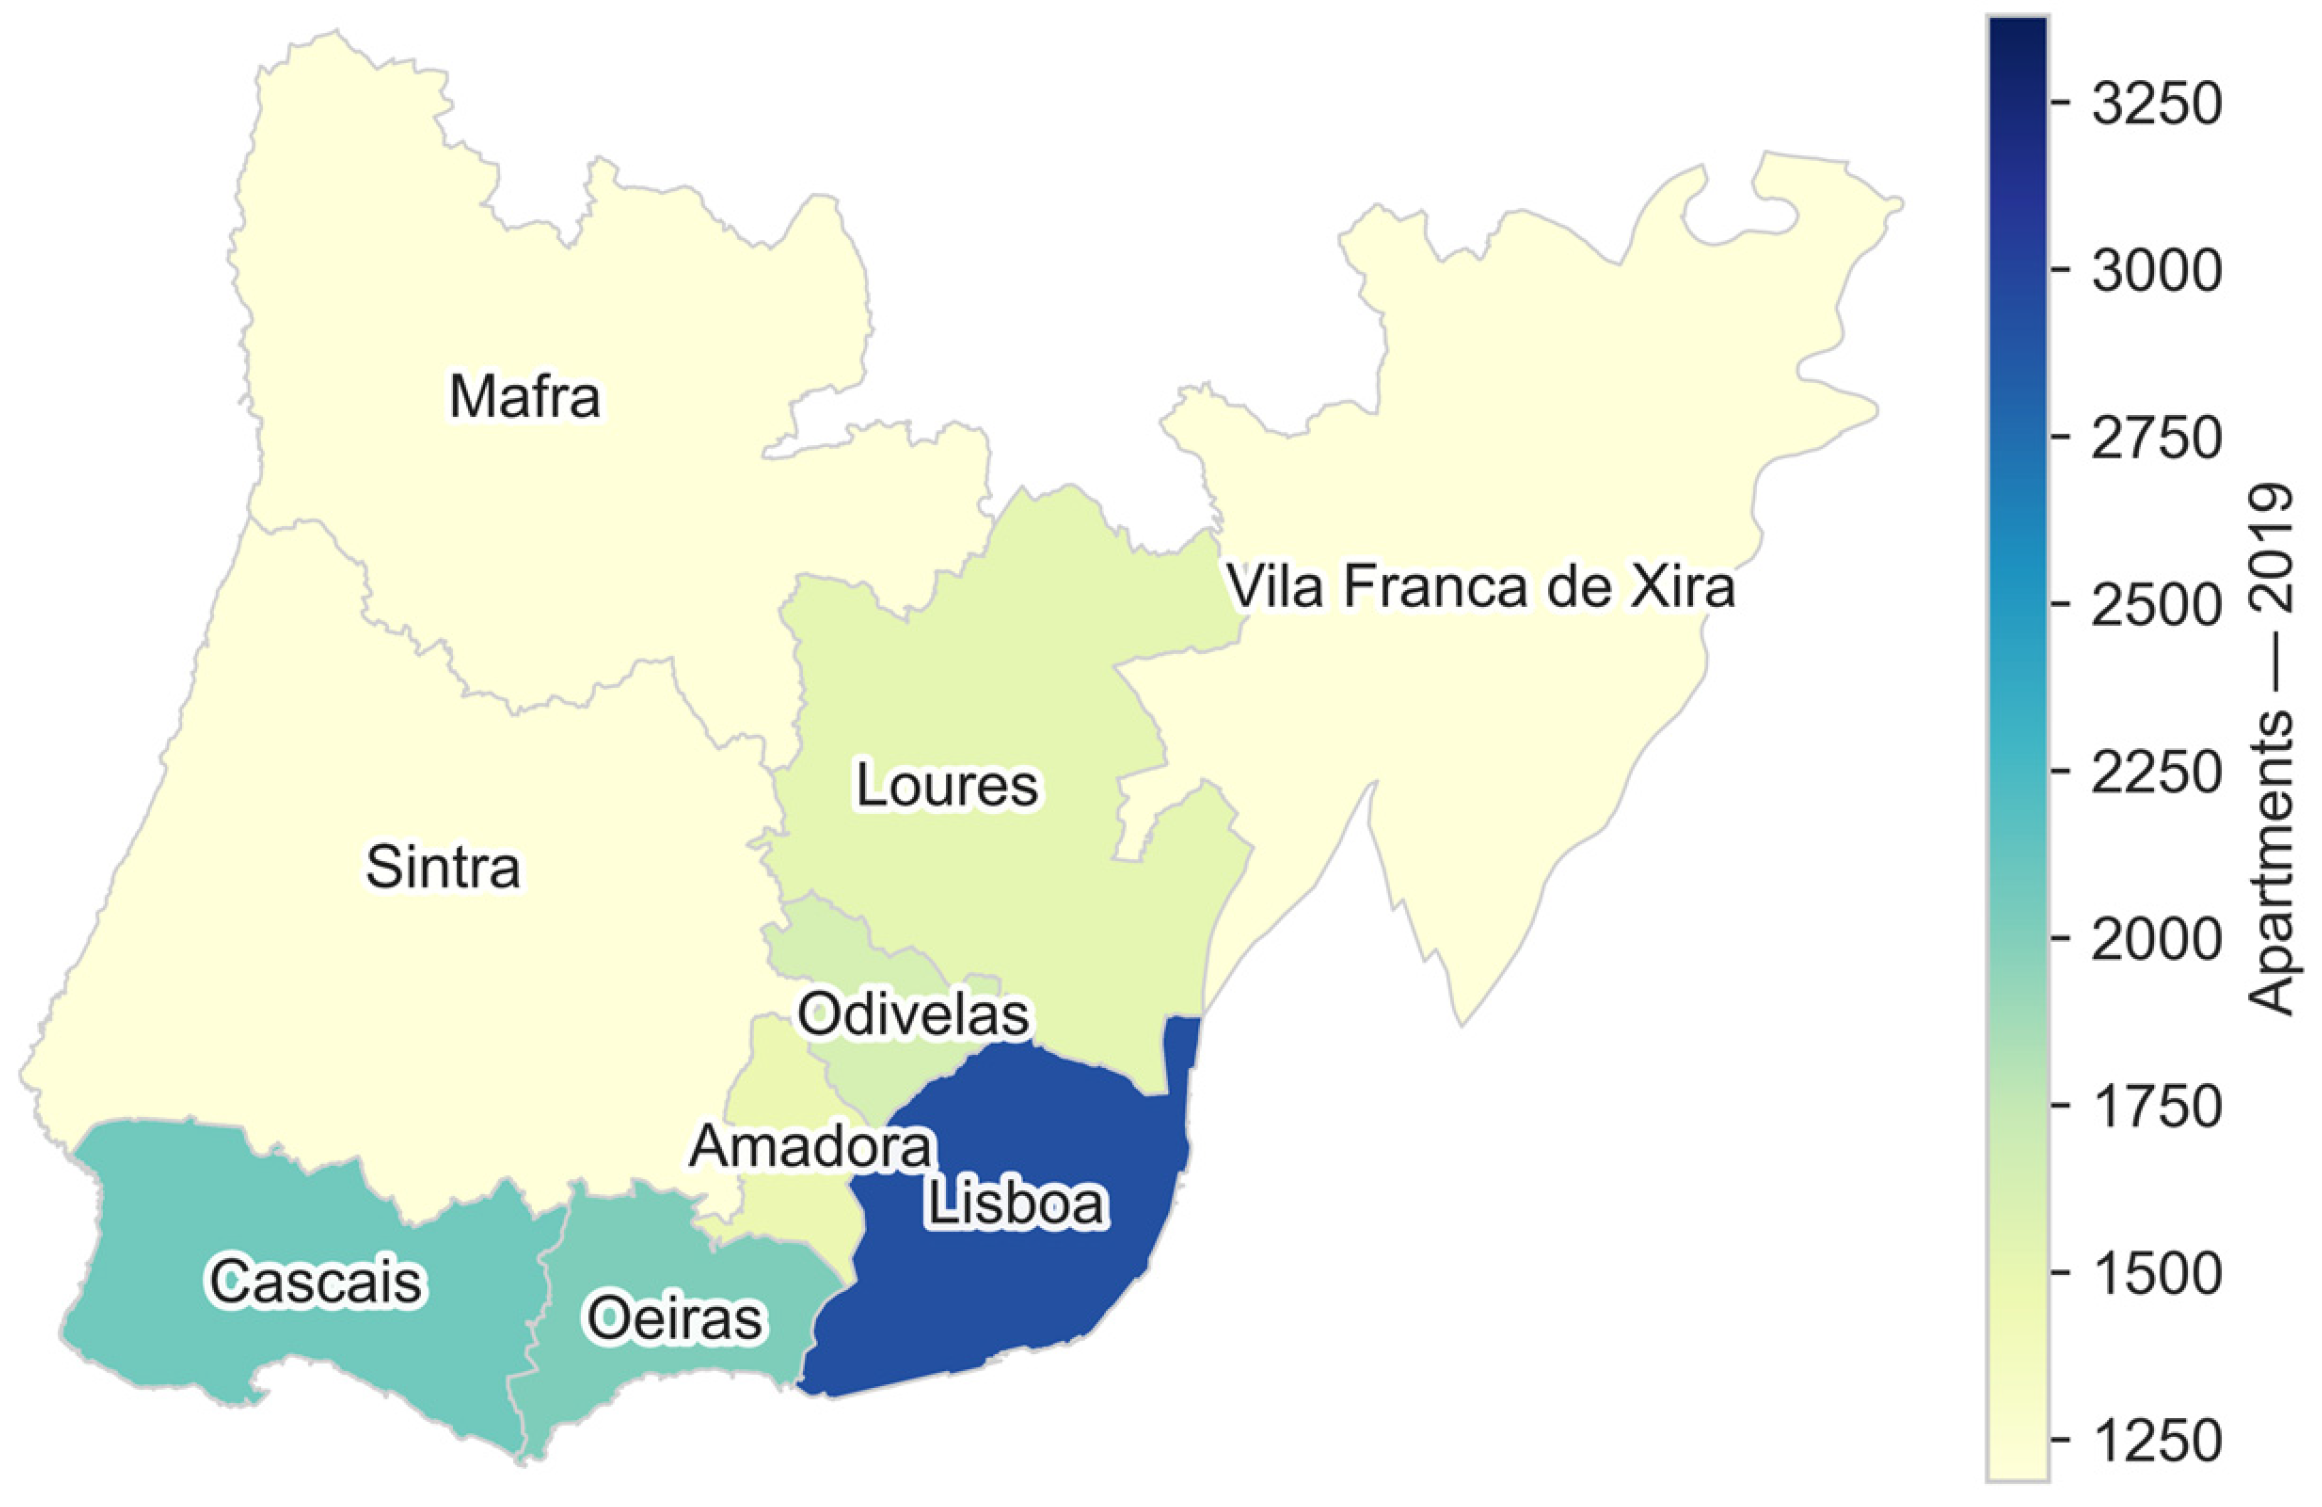
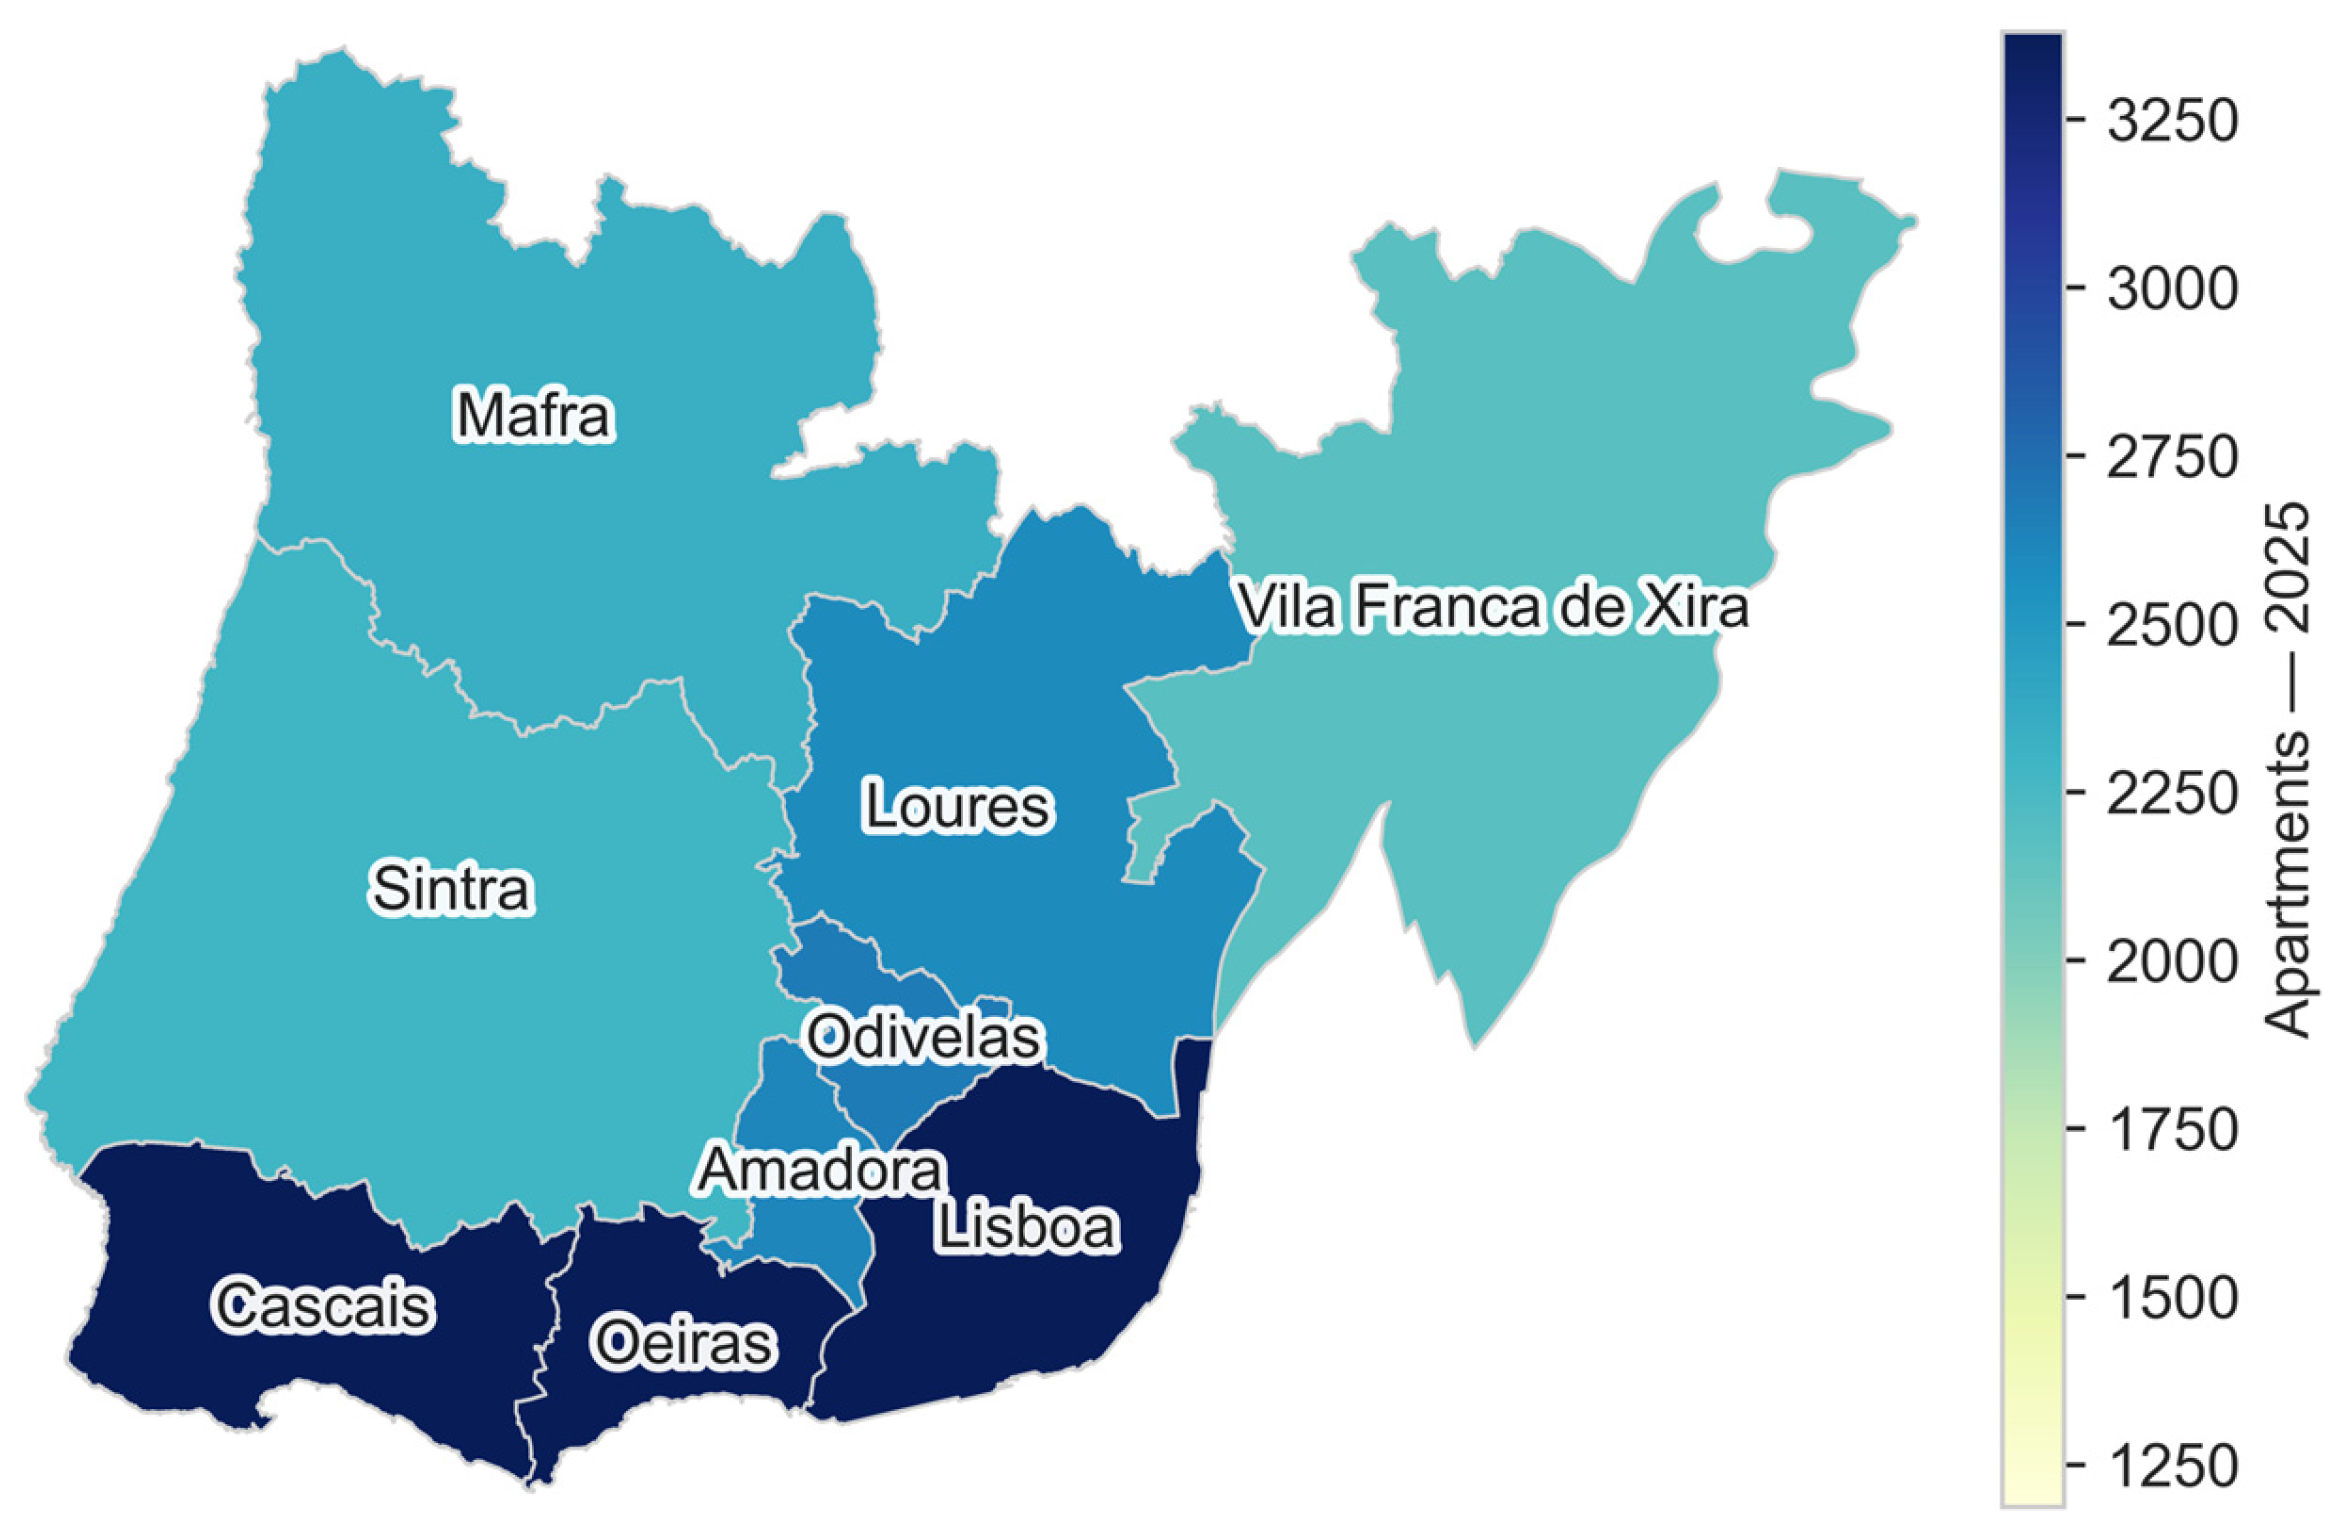
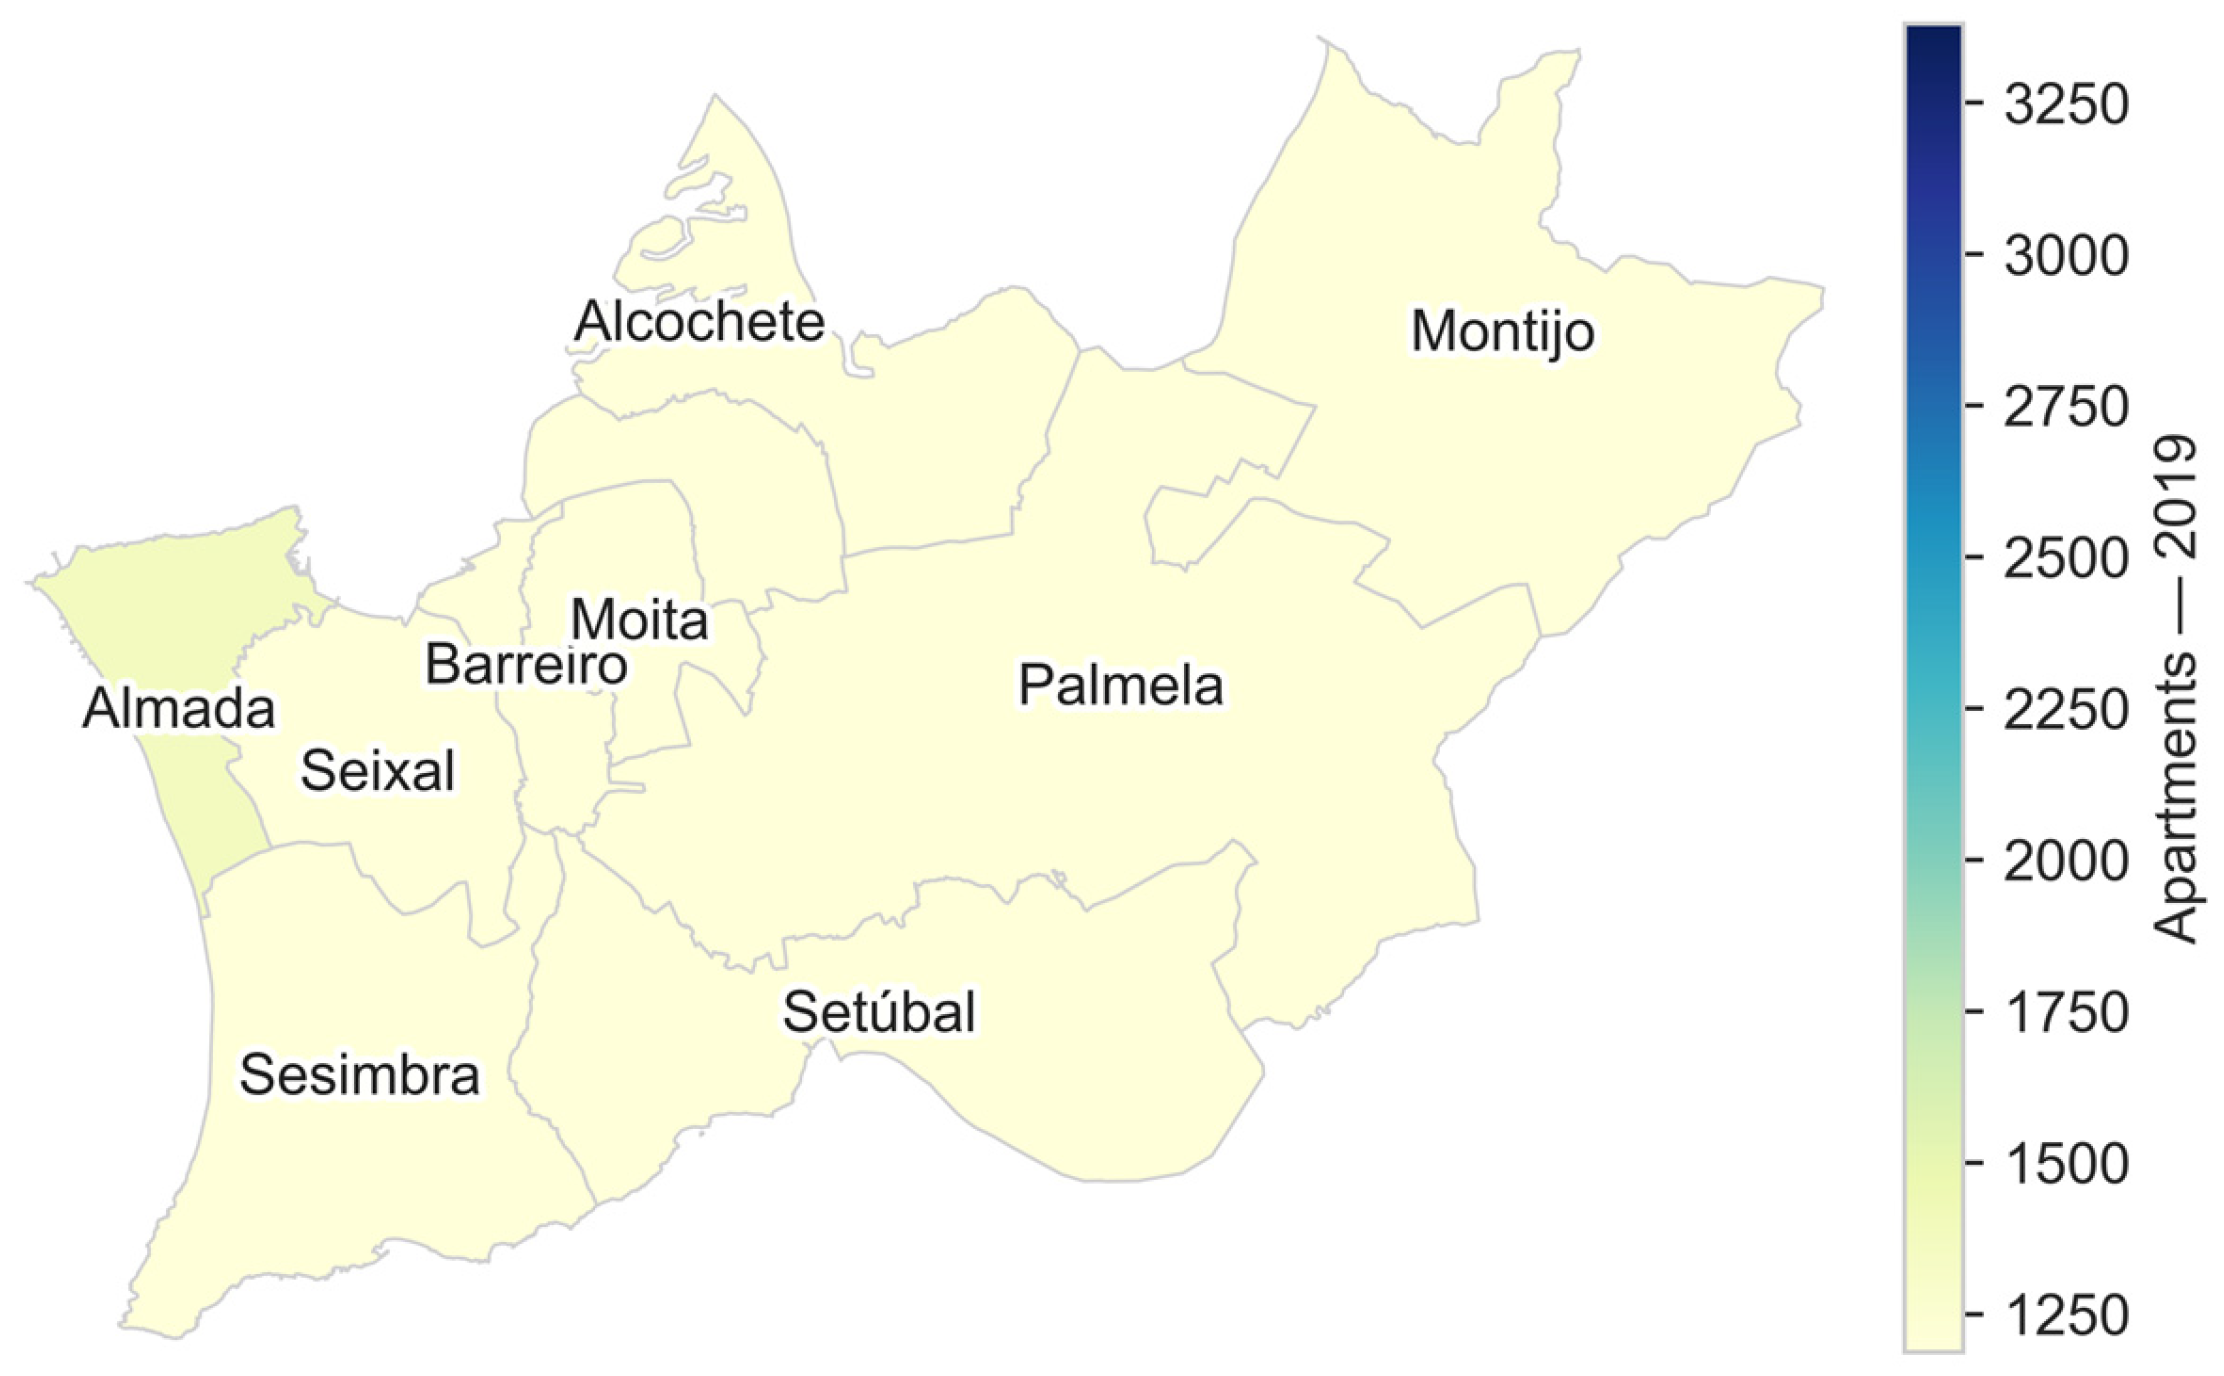
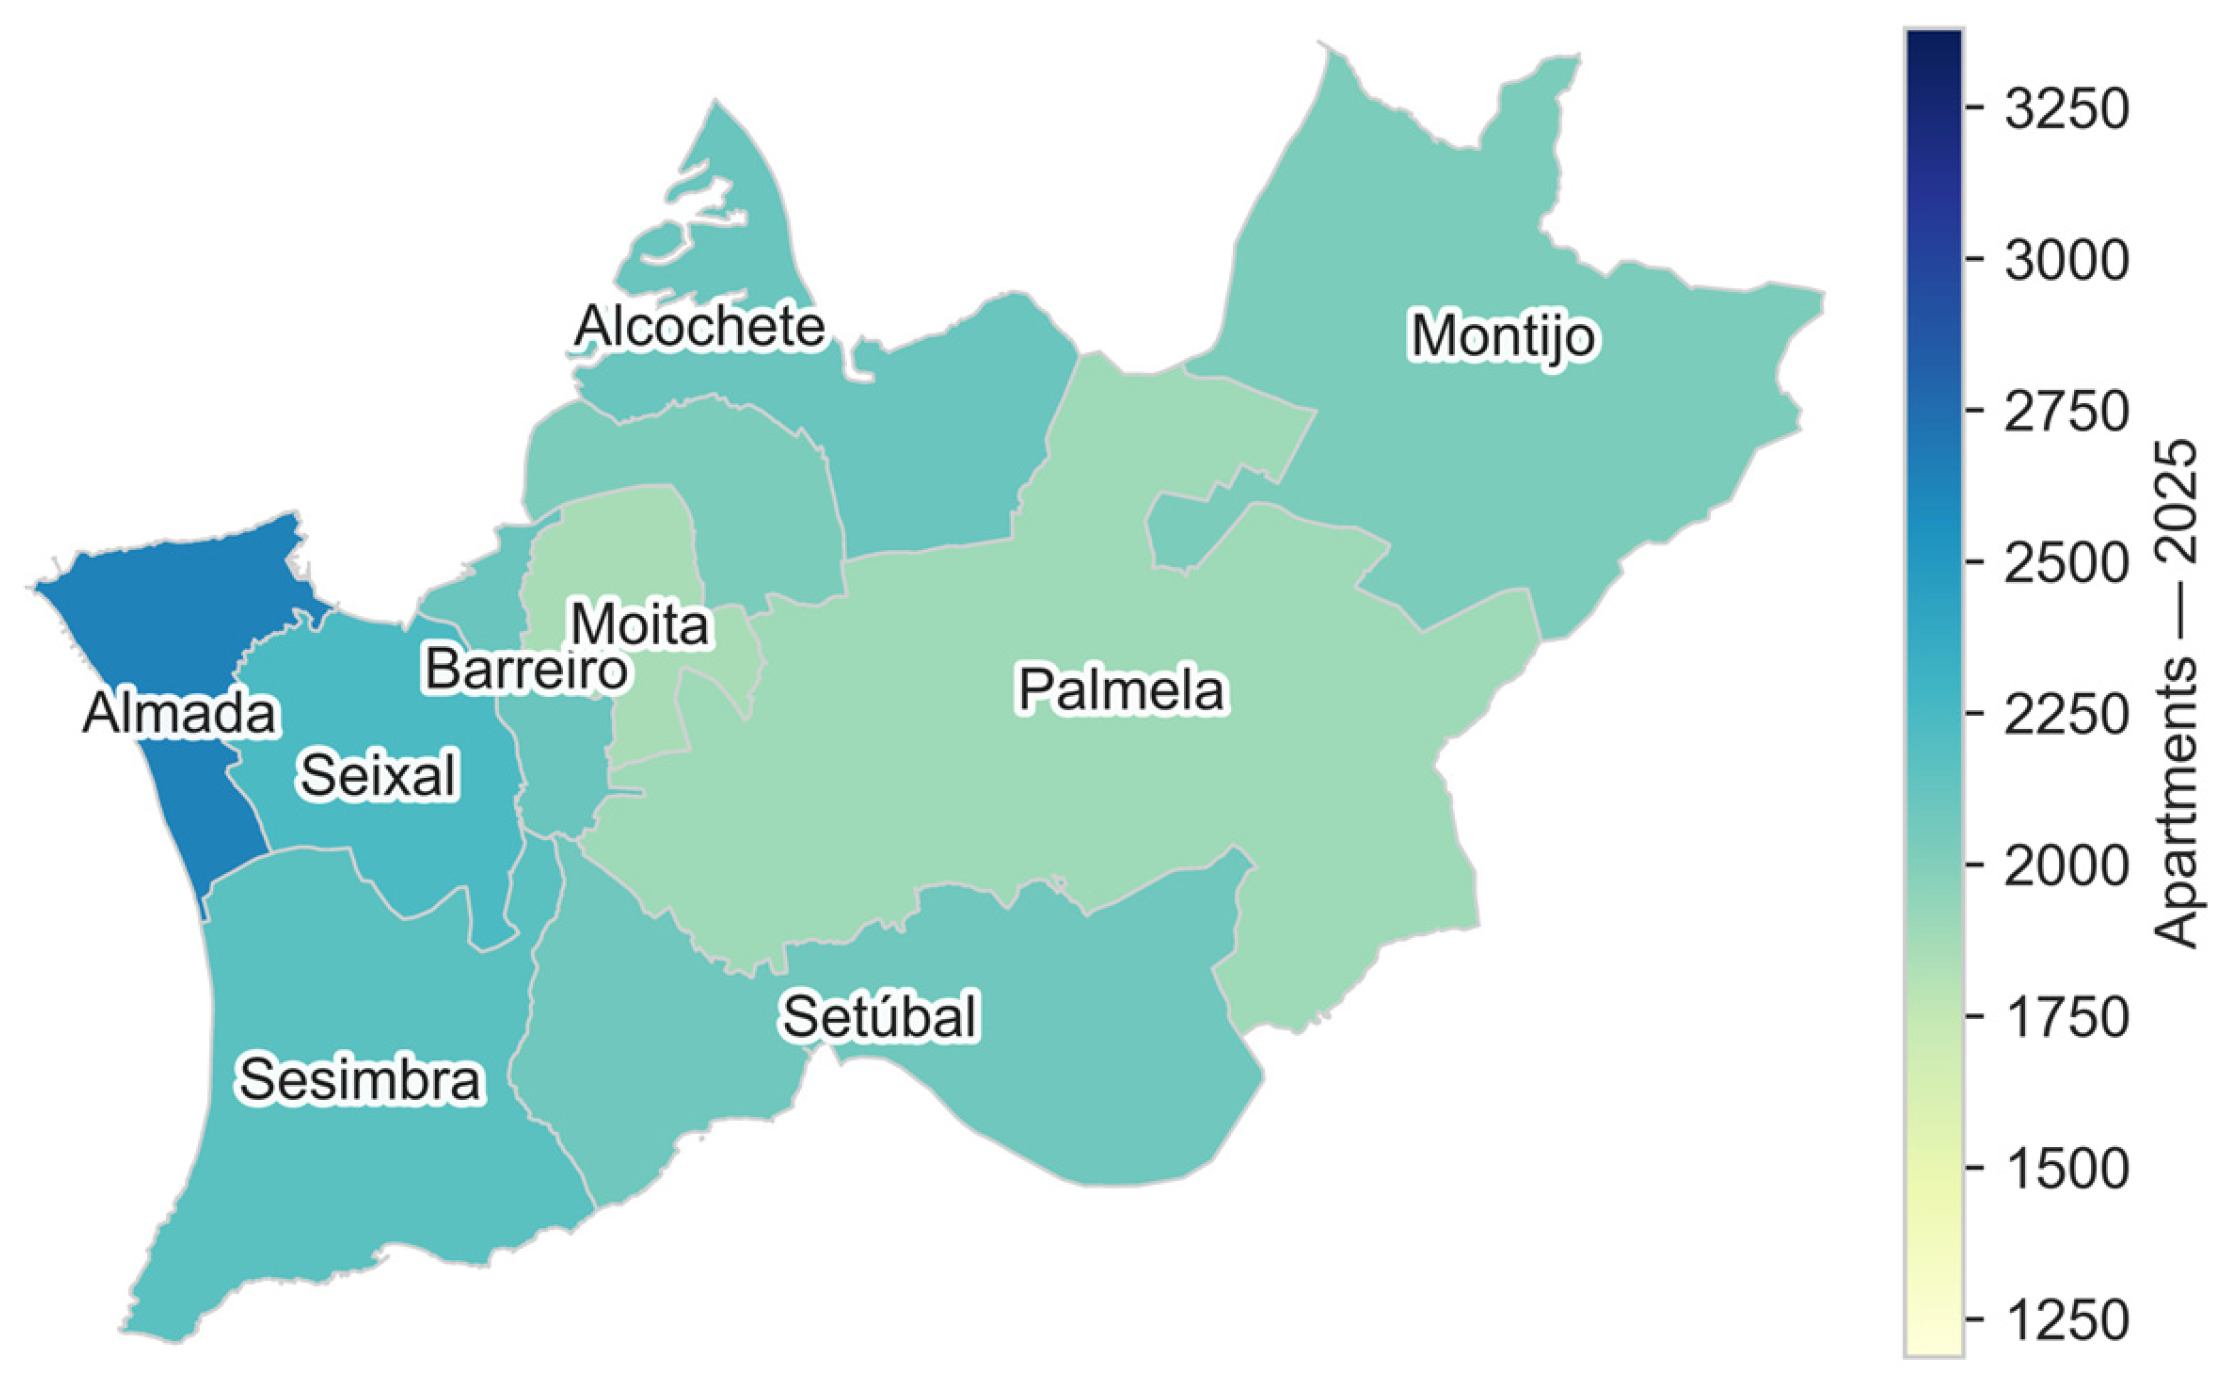
Algarve) to the NUTS III level and, where granular data permits, to specific municipalities. This granular approach is essential to unmask local inequalities, such as the indirect effects spreading from Lisbon to the adjacent area of
Península de Setúbal, which are hidden in national averages.
Figure 1 displays the different Portuguese regions at the NUTS II level.
3.2. Data Sources
This study relies exclusively on official data sources, integrating two primary data streams:
INE (Statistics Portugal): This source provides detailed national data on housing characteristics, construction activity, and bank valuations. Key datasets include indicators on the number of completed dwellings, building permits, median bank appraisal values per square meter, and housing stock characteristics (e.g., typology and area). These data are used to characterize the supply side of the market and the financial valuation of properties across Portuguese municipalities;
Eurostat: This source contextualizes the Portuguese reality within the European landscape, specifically regarding public expenditure on housing and harmonized social indicators. This allows for a comparative analysis of how Portugal positions itself in terms of public investment and housing affordability relative to other EU Member States.
By combining national micro-data with EU-level indicators, this study builds a multidimensional dataset that captures local housing dynamics, while positioning them within broader EU trends.
3.3. Method
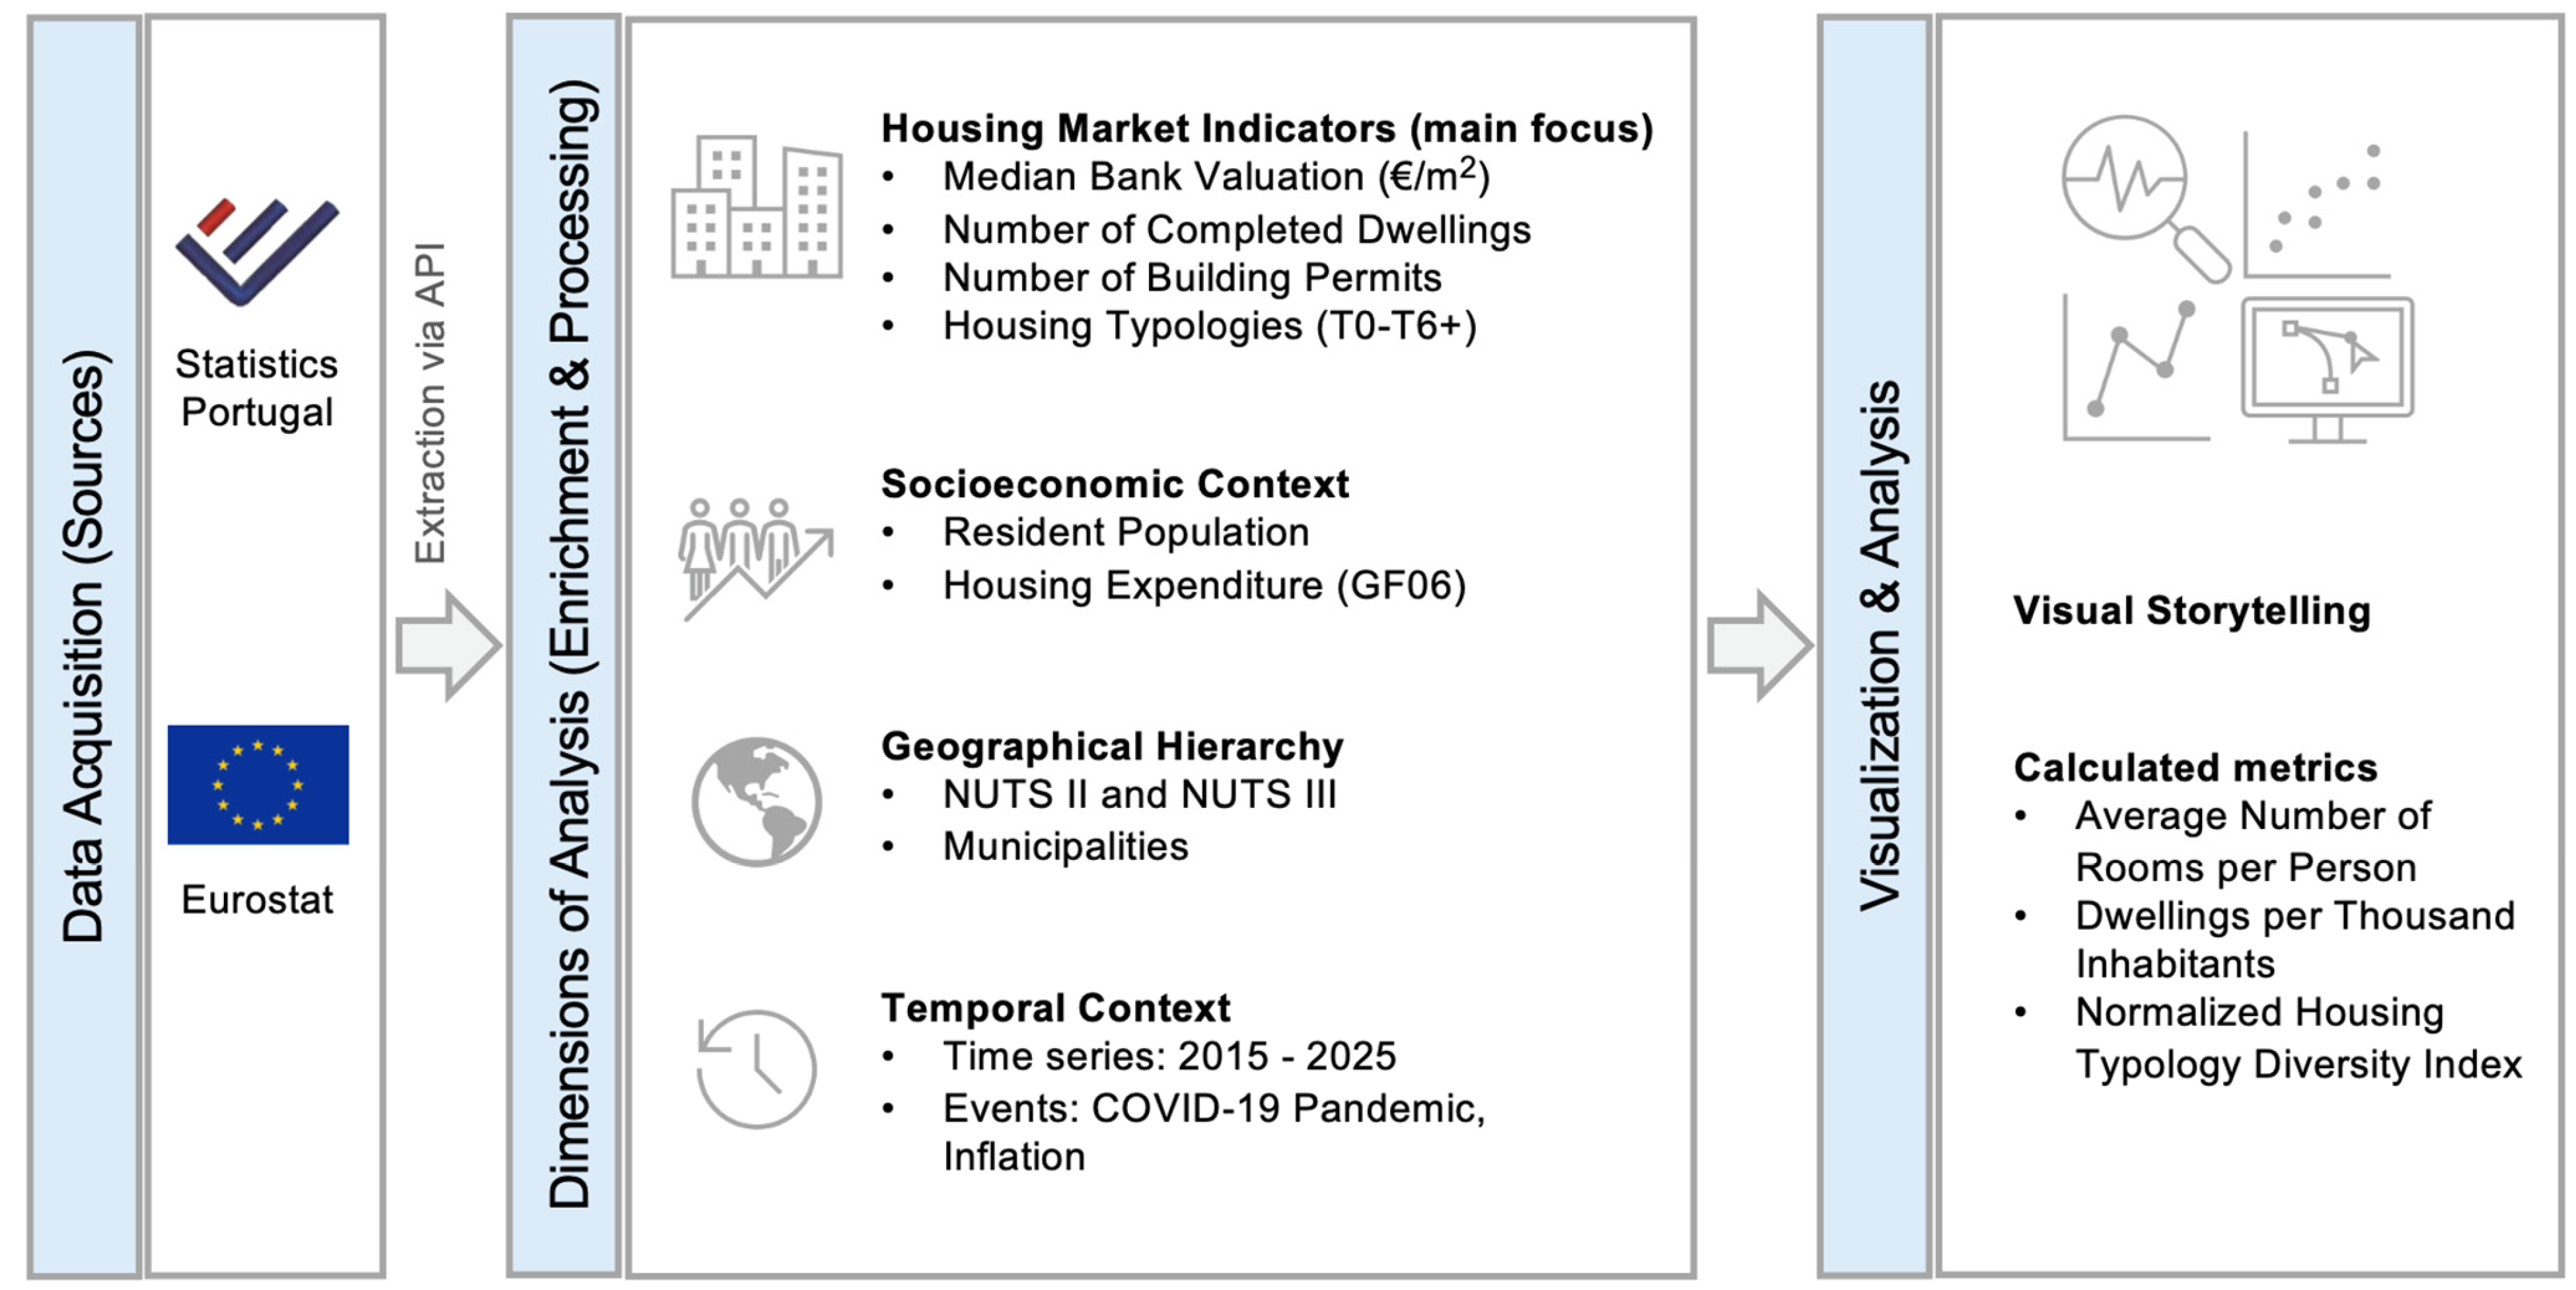
Figure 2 illustrates the methodological workflow developed for this study, transforming raw data into actionable insights. The approach is grounded in the CRISP-DM (Cross-Industry Standard Process for Data Mining) methodology, adapted for social data analysis and public policy monitoring.
As depicted in
Figure 2, the workflow is organized into three sequential stages:
Data Acquisition (Sources): The process begins with the automated ingestion of data from INE and Eurostat via their respective APIs. This stage involves handling query parameters to retrieve specific indicators related to banking valuations, construction statistics, and government expenditure;
Dimensions of Analysis (Enrichment and Processing): This is the core transformation phase. Raw data is cleaned, normalized, and enriched across four dimensions:
Housing Market Indicators: The primary focus, containing the hard metrics of value and supply;
Socioeconomic Context: Adding layers of population density and income to understand the “demand” side;
Geographical Hierarchy: Mapping data to NUTS II, NUTS III, and Municipalities (Concelhos, in Portuguese) to allow for spatial analysis;
Temporal Context: Organizing data into consistent time series (2015–2025) to identify trends and shocks (e.g., COVID-19 and inflation);
Visualization and Analysis: The final output involves the calculation of additional indicators and the generation of visual storytelling elements to detect inequality trends and patterns.
3.4. Data Understanding
The Data Understanding phase focused on exploring the structure, granularity, and quality of the available data. An initial assessment of the INE API revealed that while data is extensive, it is often fragmented across different levels of detail that require careful mapping and aggregation. For instance, the indicator for Bank Valuation allows for segmentation by “Type of Building” (Apartments vs. Houses) and “Geography” (NUTS/Municipality).
An important outcome of this phase was the identification of temporal and spatial gaps. Unlike typical “big data” scenarios where missing values might be imputed, in the context of territorial inequality, a missing value (e.g., no bank valuations in a rural municipality for a specific month) is a finding that indicates a dormant market or a lack of liquidity. Therefore, the strategy adopted was to preserve these nulls to highlight regional exclusion rather than masking them with artificial averages.
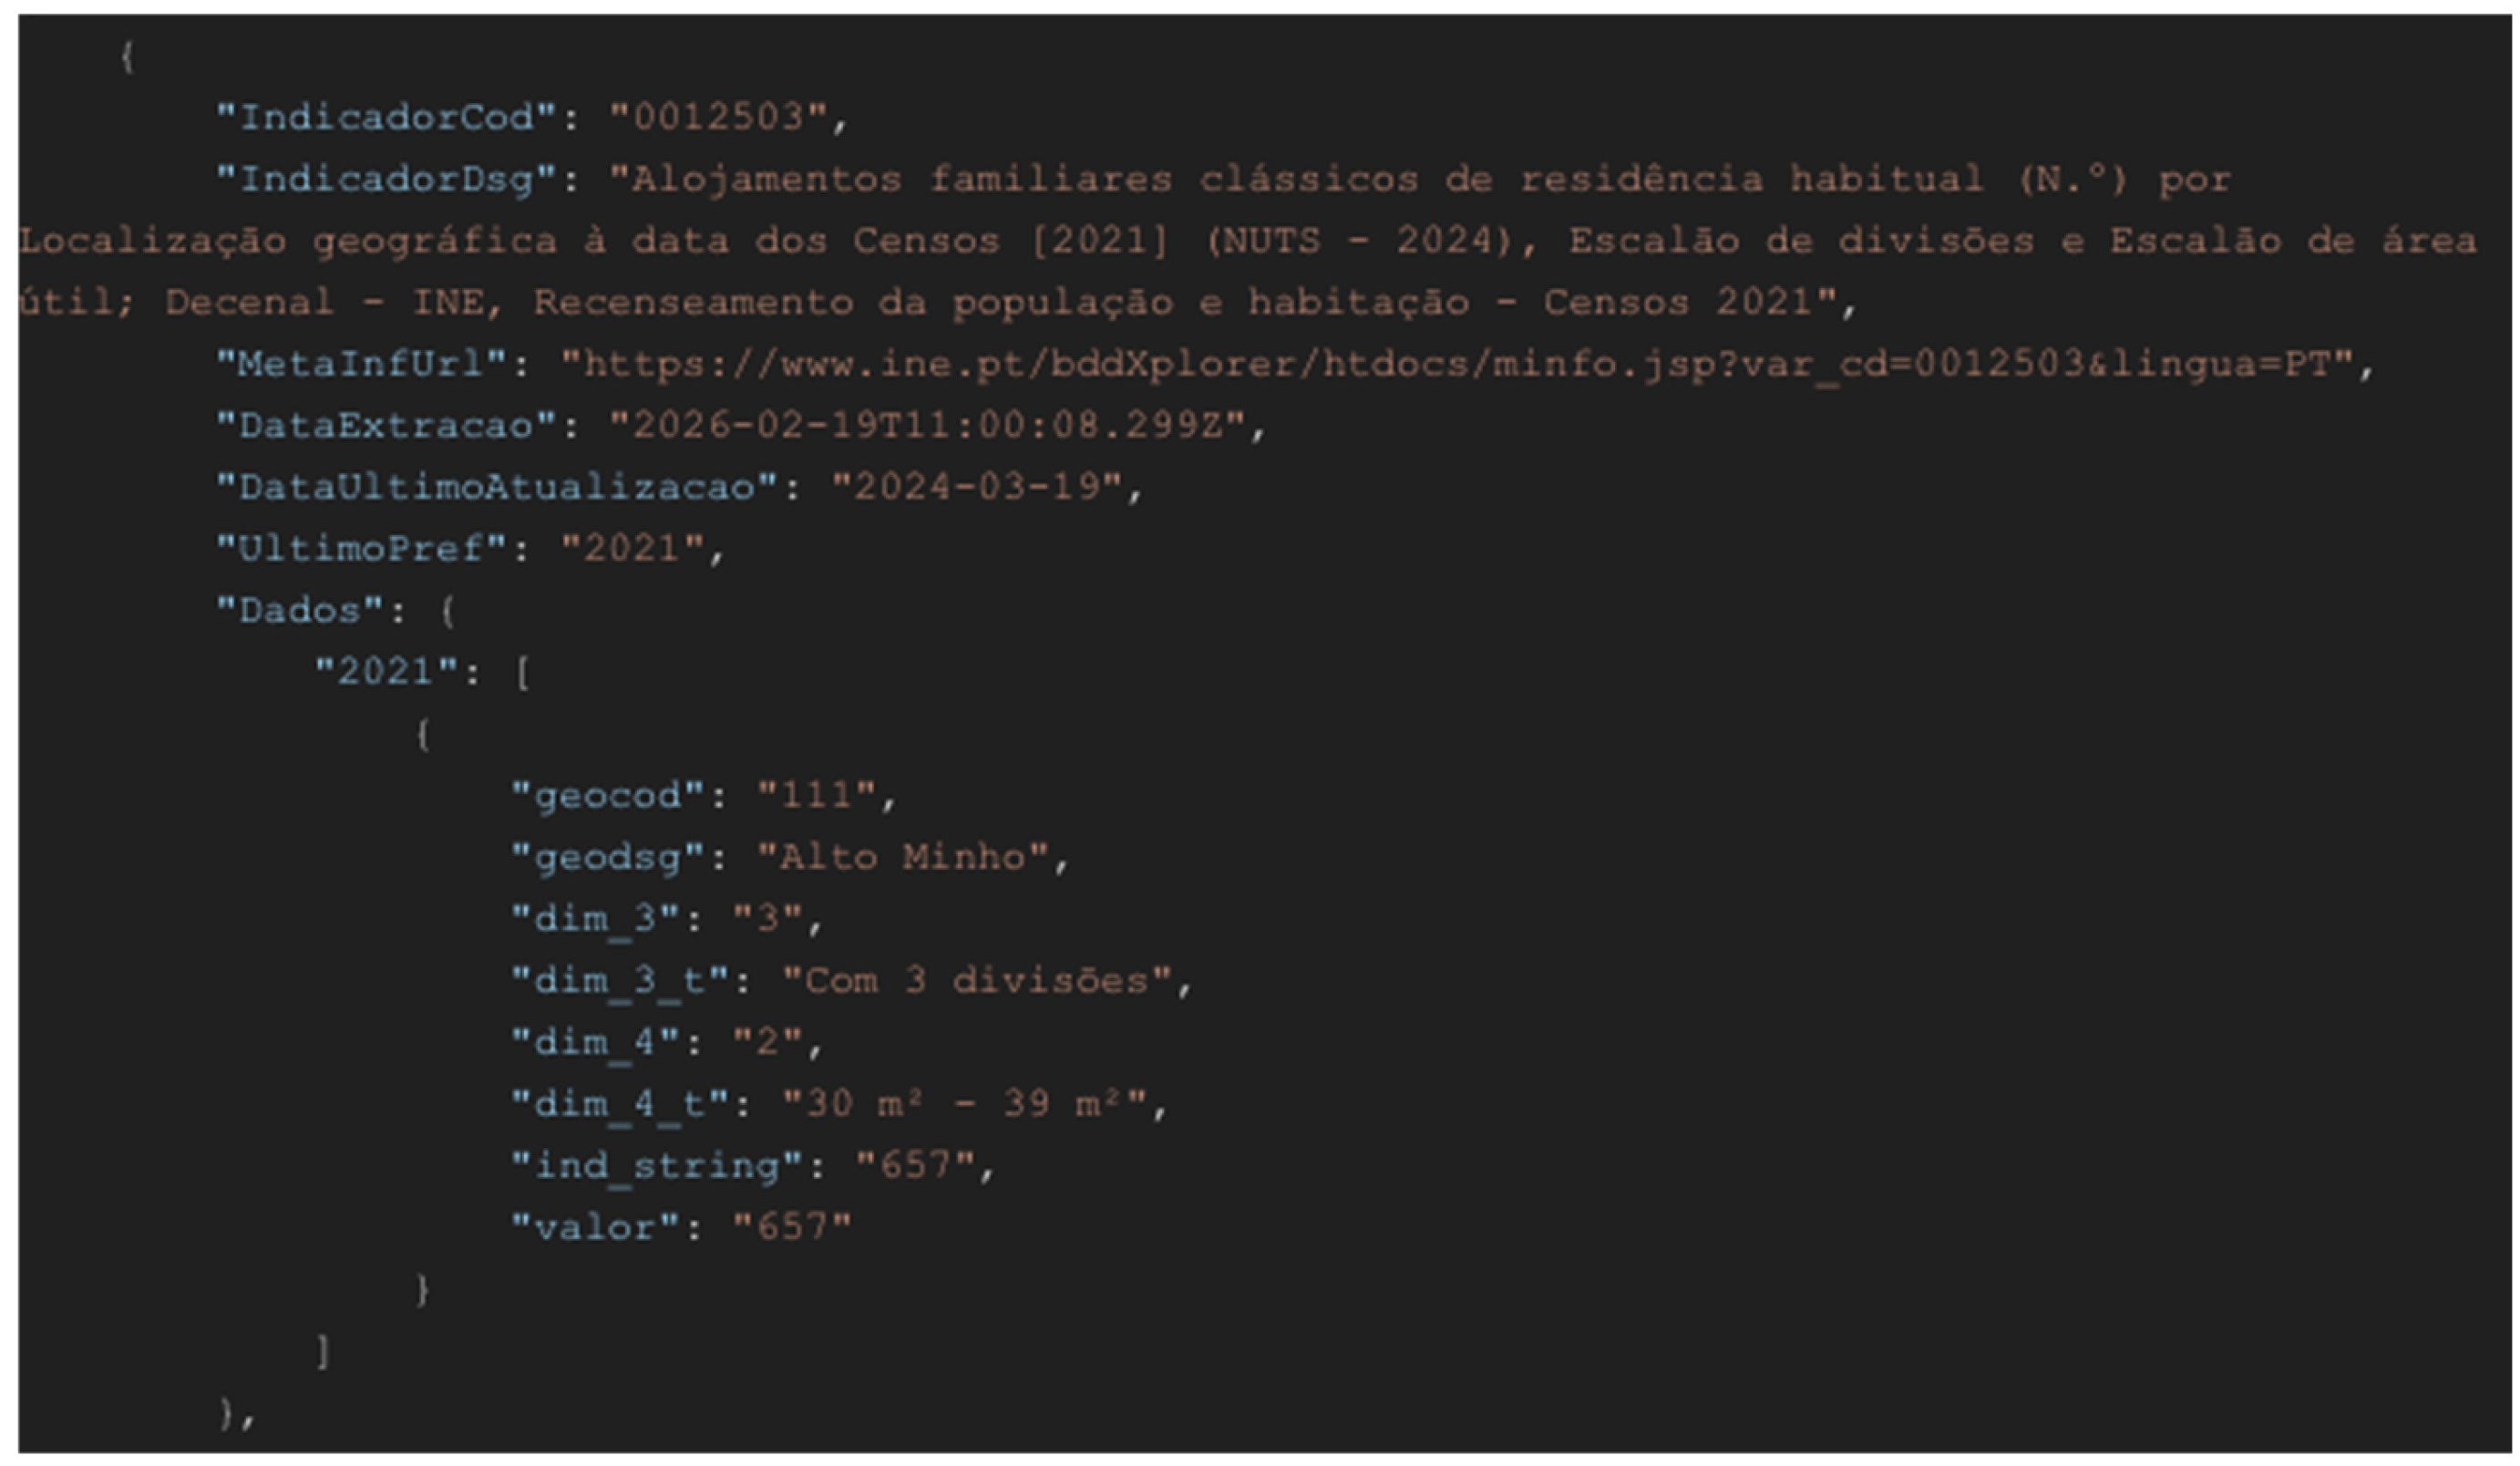
Data retrieval was performed through direct service invocations to the INE public API, where each request explicitly specifies the indicator code (varcd) and the relevant analytical dimensions.
Figure 3 shows the JSON response of calling the API (the parametrized service endpoint used is
https://www.ine.pt/ine/json_indicador/pindica.jsp?op=2&varcd=0012503&Dim1=S7A2021&Dim2=111&Dim3=3&Dim4=2&lang=PT, accessed on 18 February 2026 where parameter varcd=0012503 identifies the housing indicator under analysis, Dim1=S7A2021 defines the period of reference, and Dim2=111 constrains the extraction to a specific territorial unit at the NUTS III level. The remaining parameters (Dim3 and Dim4) correspond to structural housing characteristics, namely the number of divisions and the dwelling area class, while the parameter lang=PT ensures consistency in metadata labelling.
This parameterized structure was consistently applied across all INE indicators used in the study, with variations only in the number and type of dimensions, depending on the statistical definition of each indicator. Such an approach guarantees full control over temporal and spatial disaggregation while maintaining comparability across datasets.
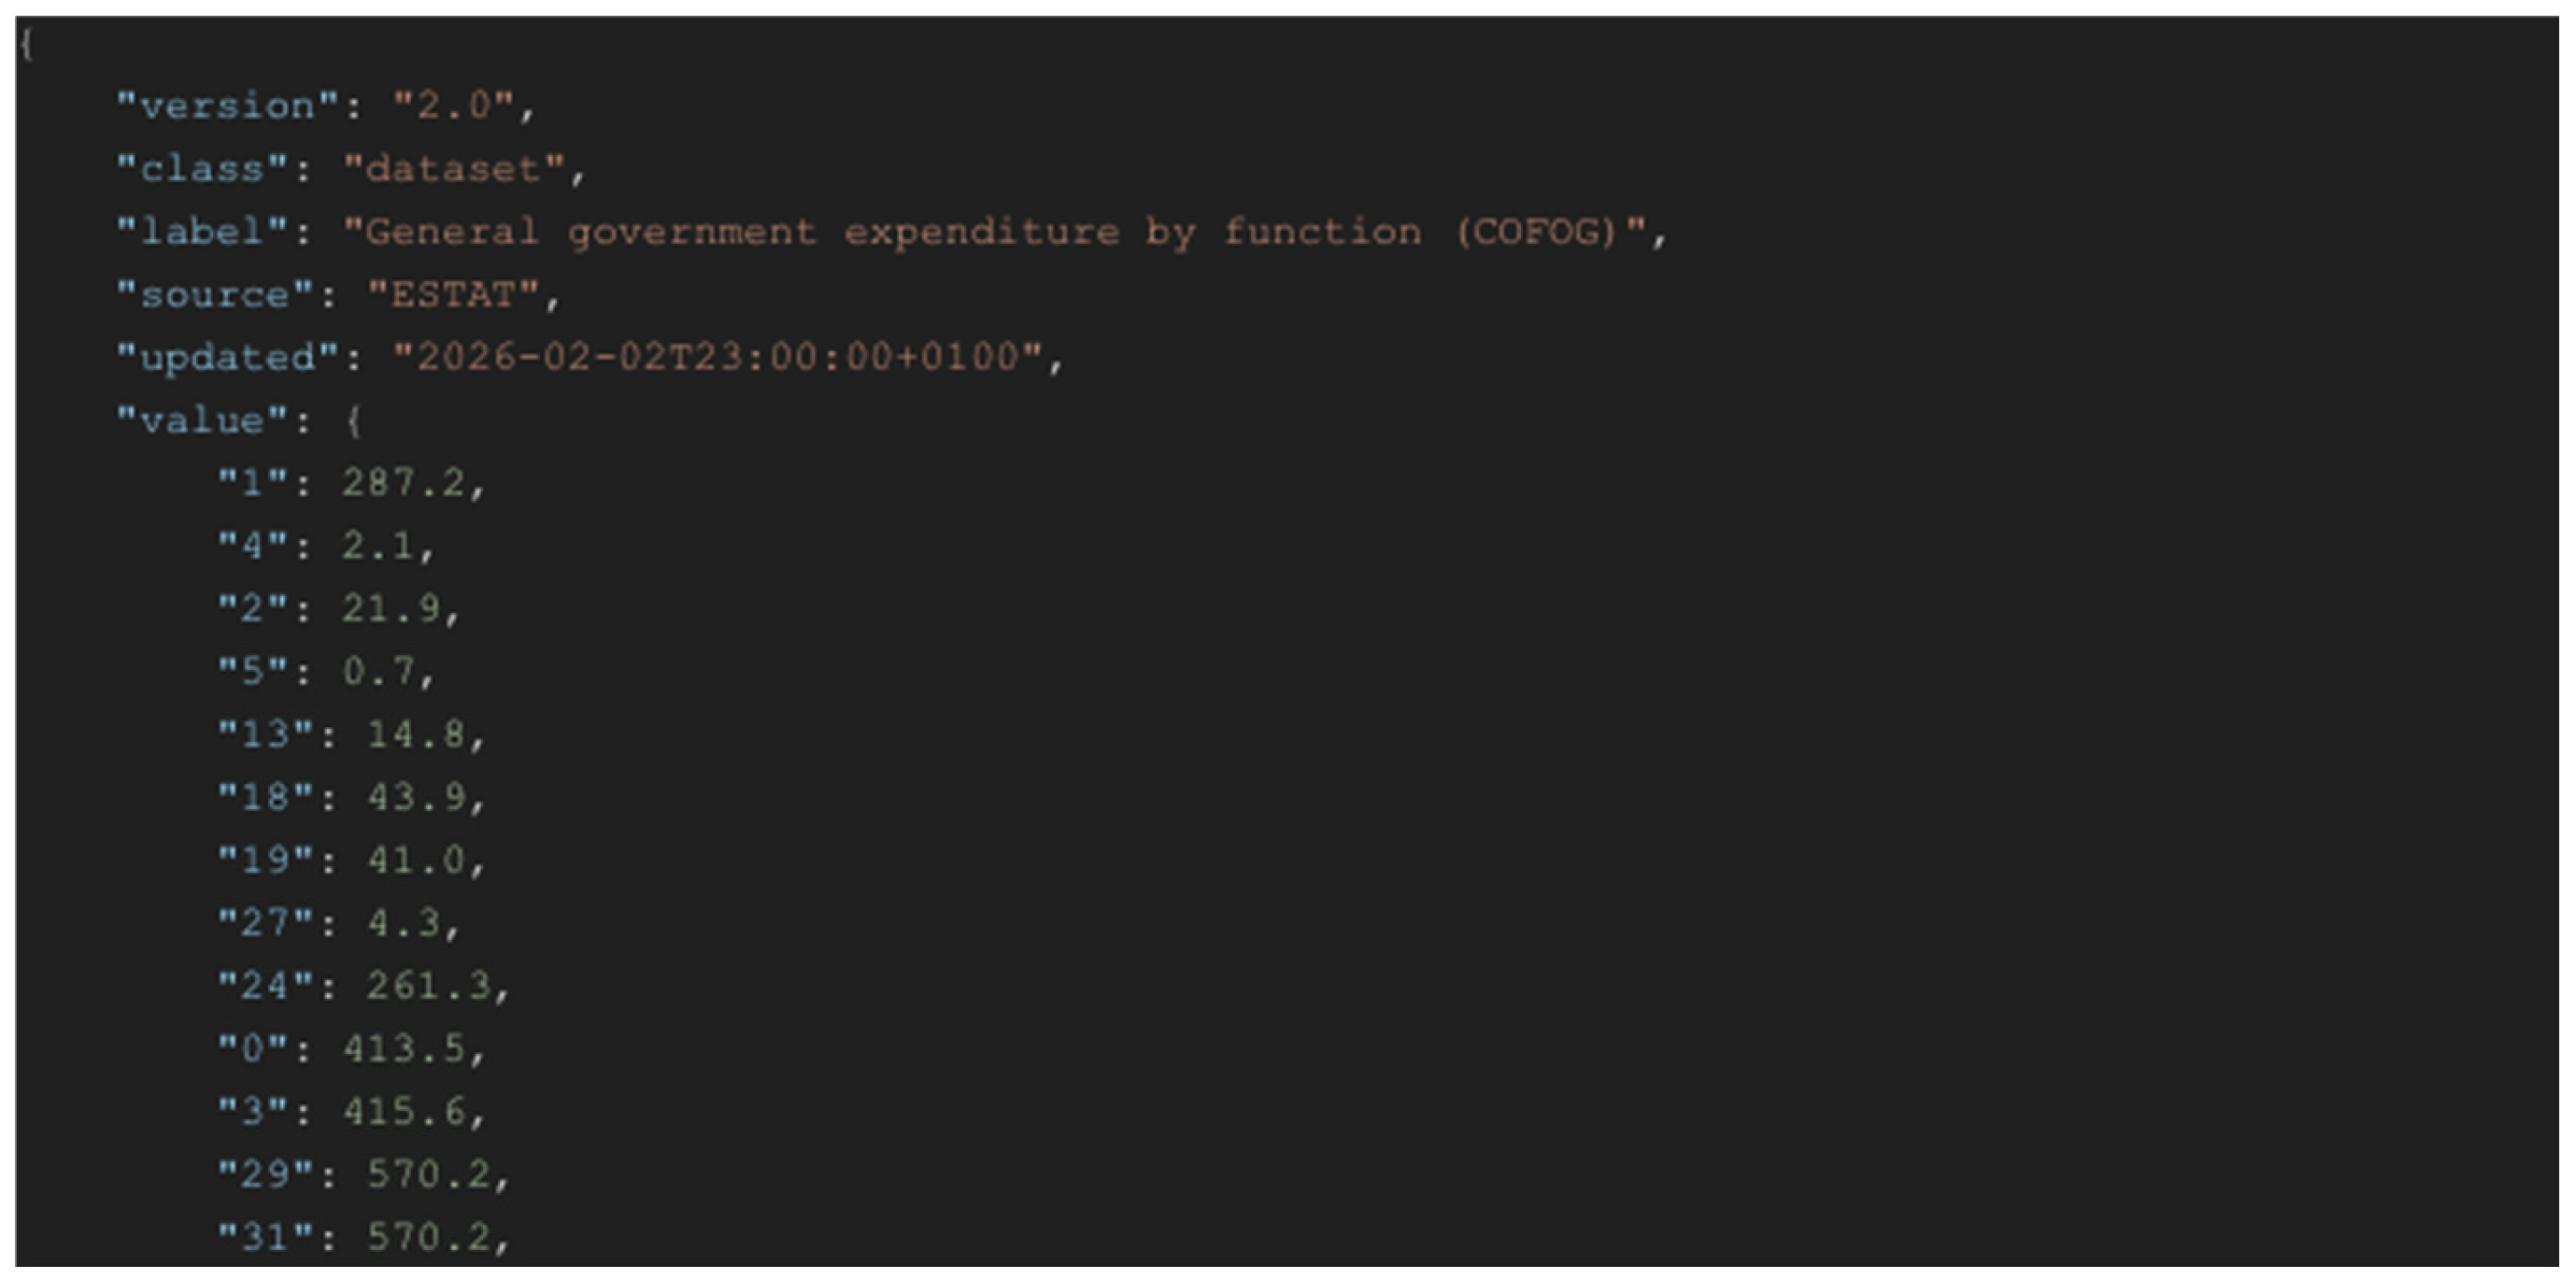
A similar approach was adopted for the extraction of EU-level data from Eurostat. Data was accessed through the Eurostat Statistics API, which allows programmatic queries with explicit control over temporal, spatial, and thematic dimensions. In this study, the dataset gov_10a_exp (the dataset is available at
https://ec.europa.eu/eurostat/databrowser/product/page/GOV_10A_EXP, with a persistent identifier
https://doi.org/10.2908/GOV_10A_EXP, accessed on 18 February 2026, was used, focusing on the COFOG (
COFOG is an international classification of general government expenditure by function;
GF06 refers to
Housing and community amenities) 1999 function
Housing and community amenities (GF06).
Figure 4 shows the JSON response of calling the API (the parametrized service endpoint used is
https://ec.europa.eu/eurostat/api/dissemination/statistics/1.0/data/gov_10a_exp?format=JSON&lang=en&cofog99=GF06&geo=PT&time=2020, accessed on 18 February 2026, where the parameter gov_10a_exp identifies the statistical dataset under analysis. The parameter cofog99=GF06 restricts the extraction to public expenditure associated with housing and community amenities, ensuring thematic alignment with the objectives of this study. The parameter time=2020 defines the temporal reference, while geo=PT limits the extraction to a specific territorial unit at the national level. The parameters format=JSON and lang=en specify the response format and the language used for metadata labelling, respectively. This request retrieves public expenditure on housing and community amenities for a specific country and year, following the same principle of explicit dimensional control applied to the INE data. The same parameterized structure was used consistently across all Eurostat indicators included in the analysis, with adjustments limited to the temporal range (2019–2025); geographical scope; and, where applicable, additional analytical dimensions such as the unit of measurement or institutional sector.
Table 1 presents the key variables included in the final dataset, detailing their source, measurement unit, and role in the analysis. This study adopts a hierarchical territorial classification (NUTS II, NUTS III, and municipality) for spatial aggregation. The empirical analysis is restricted to Mainland Portugal (NUTS I) due to data limitations affecting the remaining NUTS I regions, namely the autonomous regions of the Azores and Madeira.
3.5. Data Enrichment
In the Data Enrichment phase, the objective was to transform isolated administrative figures into meaningful socioeconomic indicators. This process was implemented in Python 3.13, including data cleaning, standardization, spatial–temporal integration, and feature engineering through the calculation of synthetic indices.
The initial step of standardization entailed the harmonization of disparate coding systems from the primary data sources. Administrative codes returned by the APIs were mapped to human-readable designations using metadata dictionaries, ensuring that the final output was intelligible for decision-makers. Regarding missing data, unlike standard big data approaches that often impute missing values, this study explicitly preserved null values. In the context of housing inequality, the absence of transactional data in rural municipality is not a system error but a significant finding, signaling a dormant market, a lack of liquidity, or deep territorial exclusion.
Following standardization, the integration of spatial and temporal dimensions was necessary to visualize the “two-speed” reality of the Portuguese housing market. Geographically, all micro-data from INE was already aligned with the current NUTS 2024 classification system (the previous NUTS classification system was valid since 2013). This hierarchical mapping enabled the analysis to seamlessly drill down from broad national trends to specific NUTS II regions and, where data quality permitted, to the municipal level. Temporally, the disparity between monthly bank valuations and annual construction statistics was resolved by aggregating data into consistent quarterly and annual averages. This synchronization created a time series spanning from 2015 to 2025, enabling the correlation of housing market behaviors with macro-economic disruptions, such as the COVID-19 pandemic or fluctuations in interest rates.
To move the analysis beyond simple descriptive statistics, feature engineering was applied to create three metrics to capture the structural dimensions of inequality, based on the source variables displayed in
Table 1.
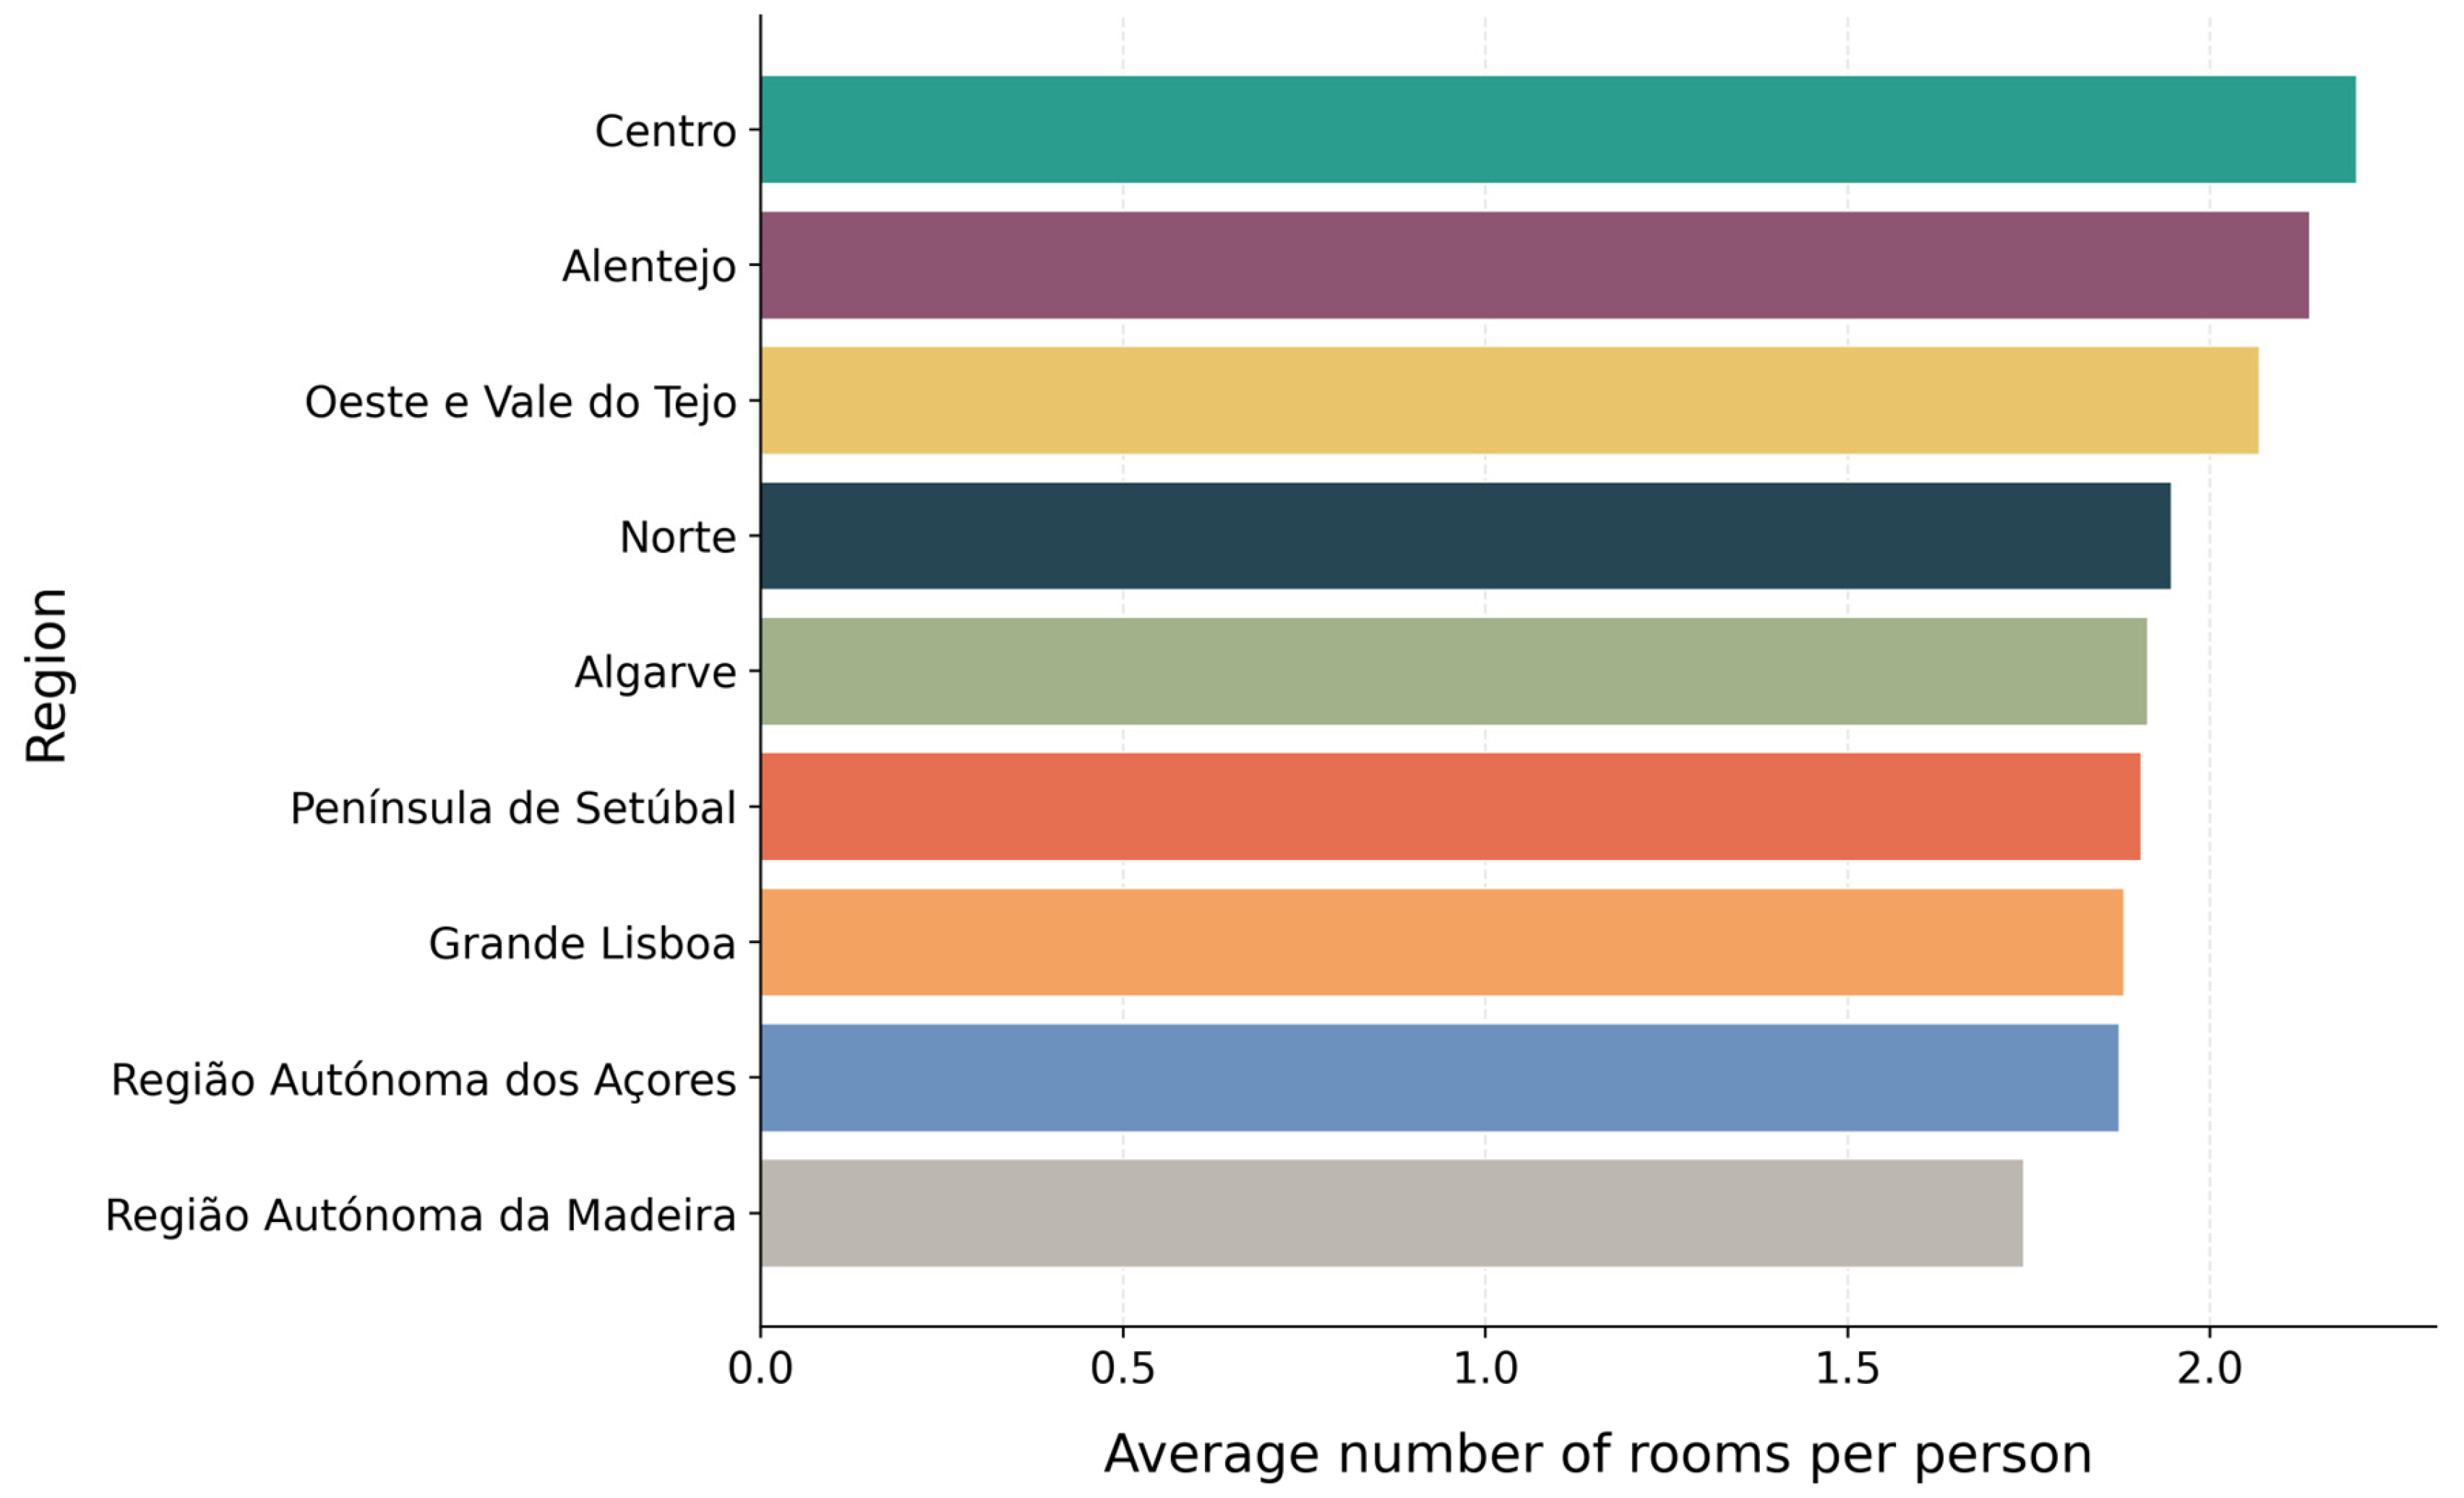
First, the “Average Number of Rooms per Person” metric [
29] was computed to assess the availability of residential space at the individual level and to capture potential housing pressure and crowding conditions within the housing stock (Equation (1)). This metric, used by Eurostat and the OECD in the analysis of housing conditions, relates the total number of habitable rooms in occupied dwellings to the total number of residents. Higher values indicate a greater availability of living space per person and are generally associated with higher housing standards and lower levels of overcrowding. Conversely, lower values suggest more constrained living conditions, reflecting higher residential density and increased pressure on the housing stock, typically observed in high-demand urban or metropolitan areas. By normalizing dwelling size by household composition, this indicator allows for consistent comparisons across regions with different demographic structures and settlement patterns.
Second, the “Dwellings per Thousand Inhabitants” indicator [
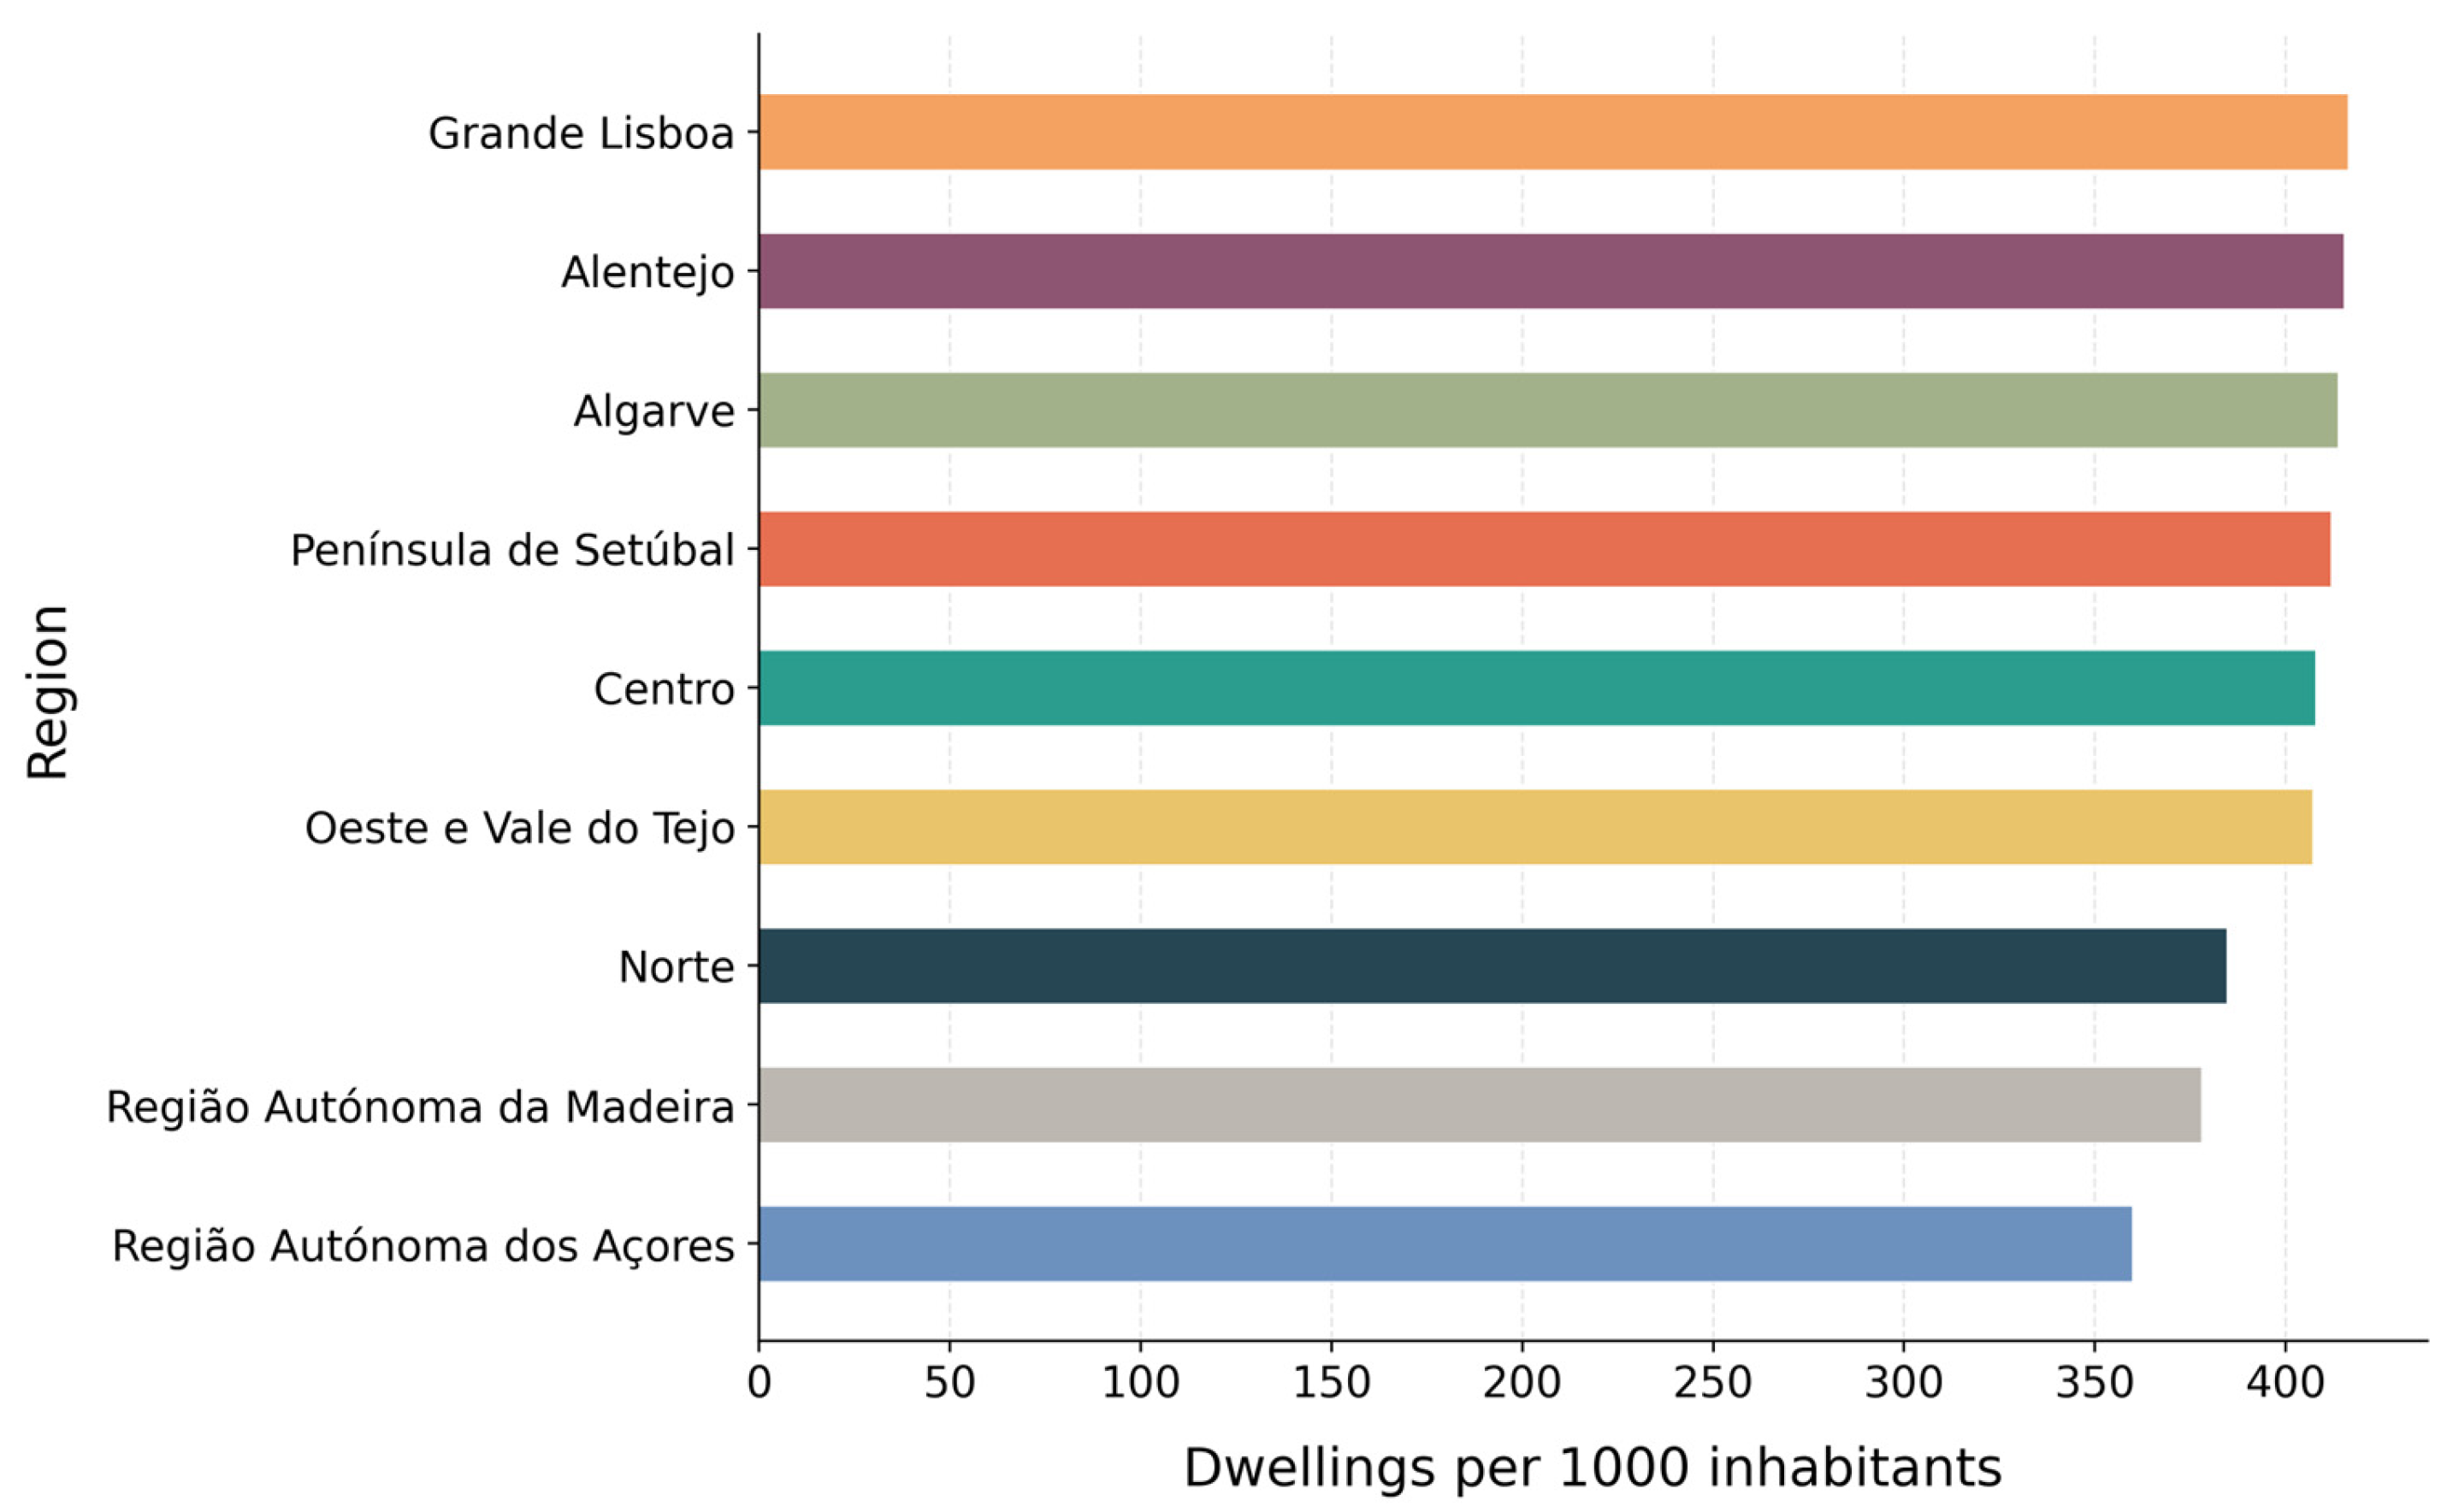
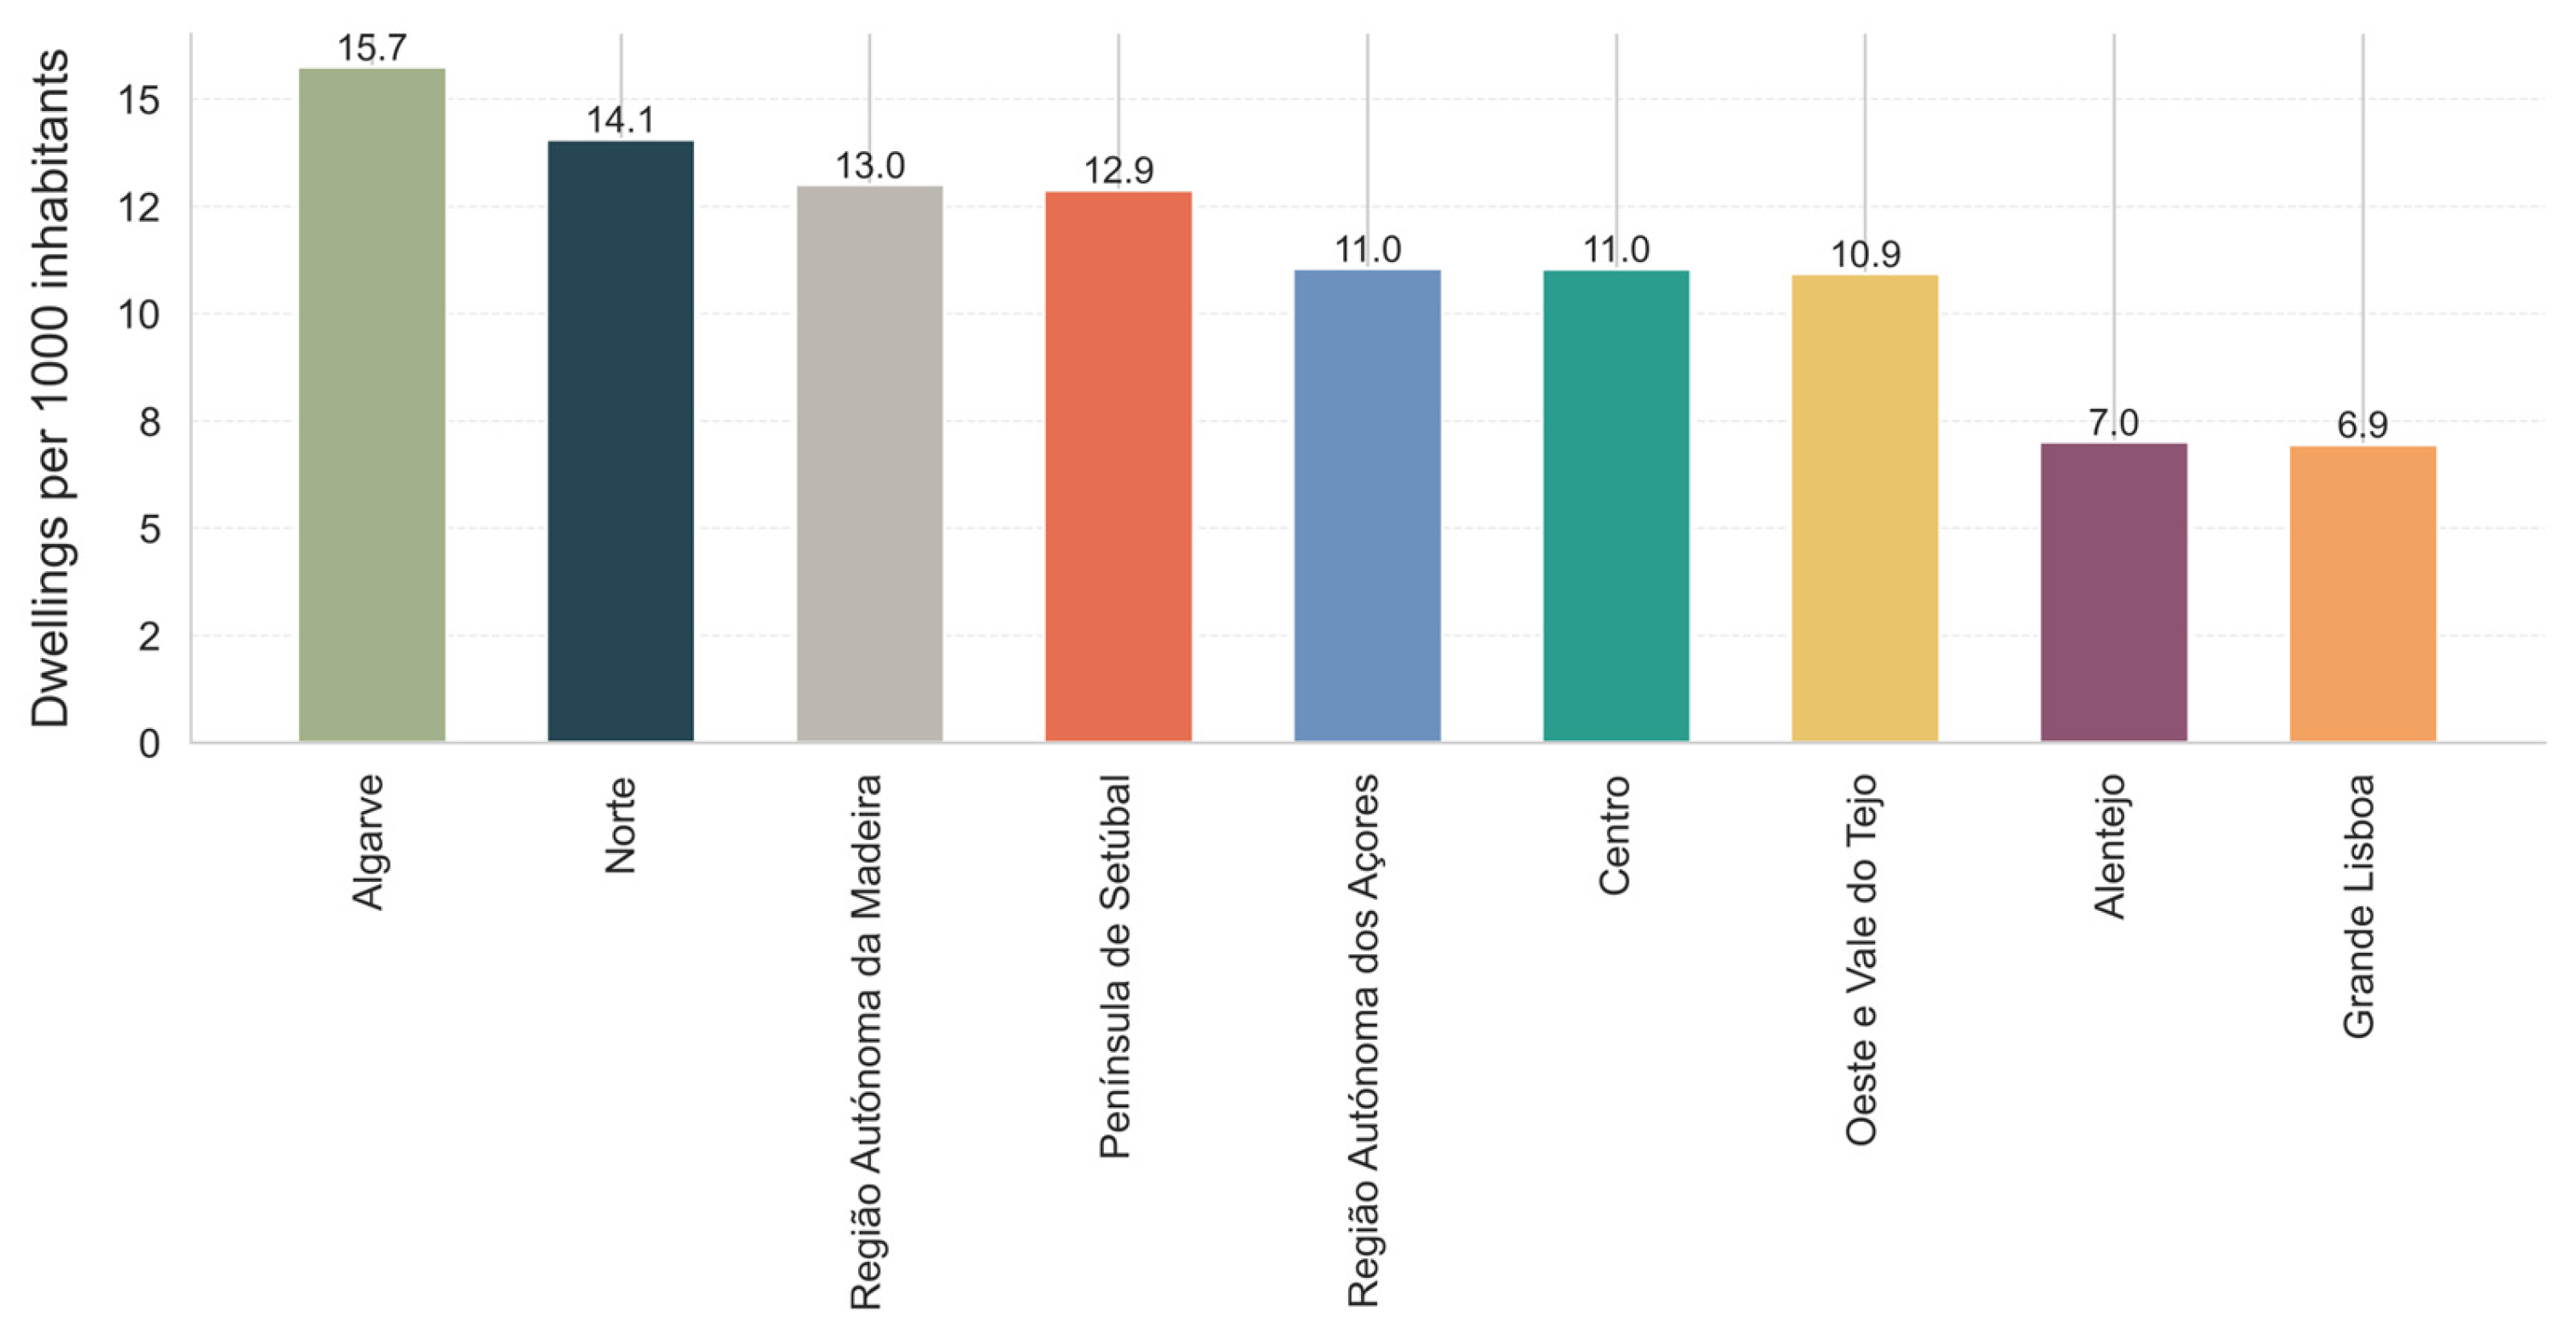
30] was computed to assess the availability of housing stock relative to population size and to capture structural pressures in housing markets (Equation (2)). This indicator is widely used by the OECD in the analysis of housing supply conditions, housing adequacy, and long-term developments in residential construction. The indicator relates the total number of classic dwellings of habitual residence to the total resident population, expressing the result per 1000 inhabitants. By measuring the housing stock relative to population, it provides a standardized indicator of housing supply intensity that allows for meaningful comparisons across countries and regions with different population sizes and demographic dynamics. Higher values indicate a relatively larger housing stock compared to the size of the population and are generally associated with lower structural housing shortages and greater availability of dwellings. Conversely, lower values suggest tighter housing markets, potentially reflecting insufficient housing supply, higher demographic pressure, or rapidly growing populations. By normalizing the number of dwellings by the number of inhabitants, this indicator enables consistent cross-country and cross-regional comparisons, independently of absolute population size.
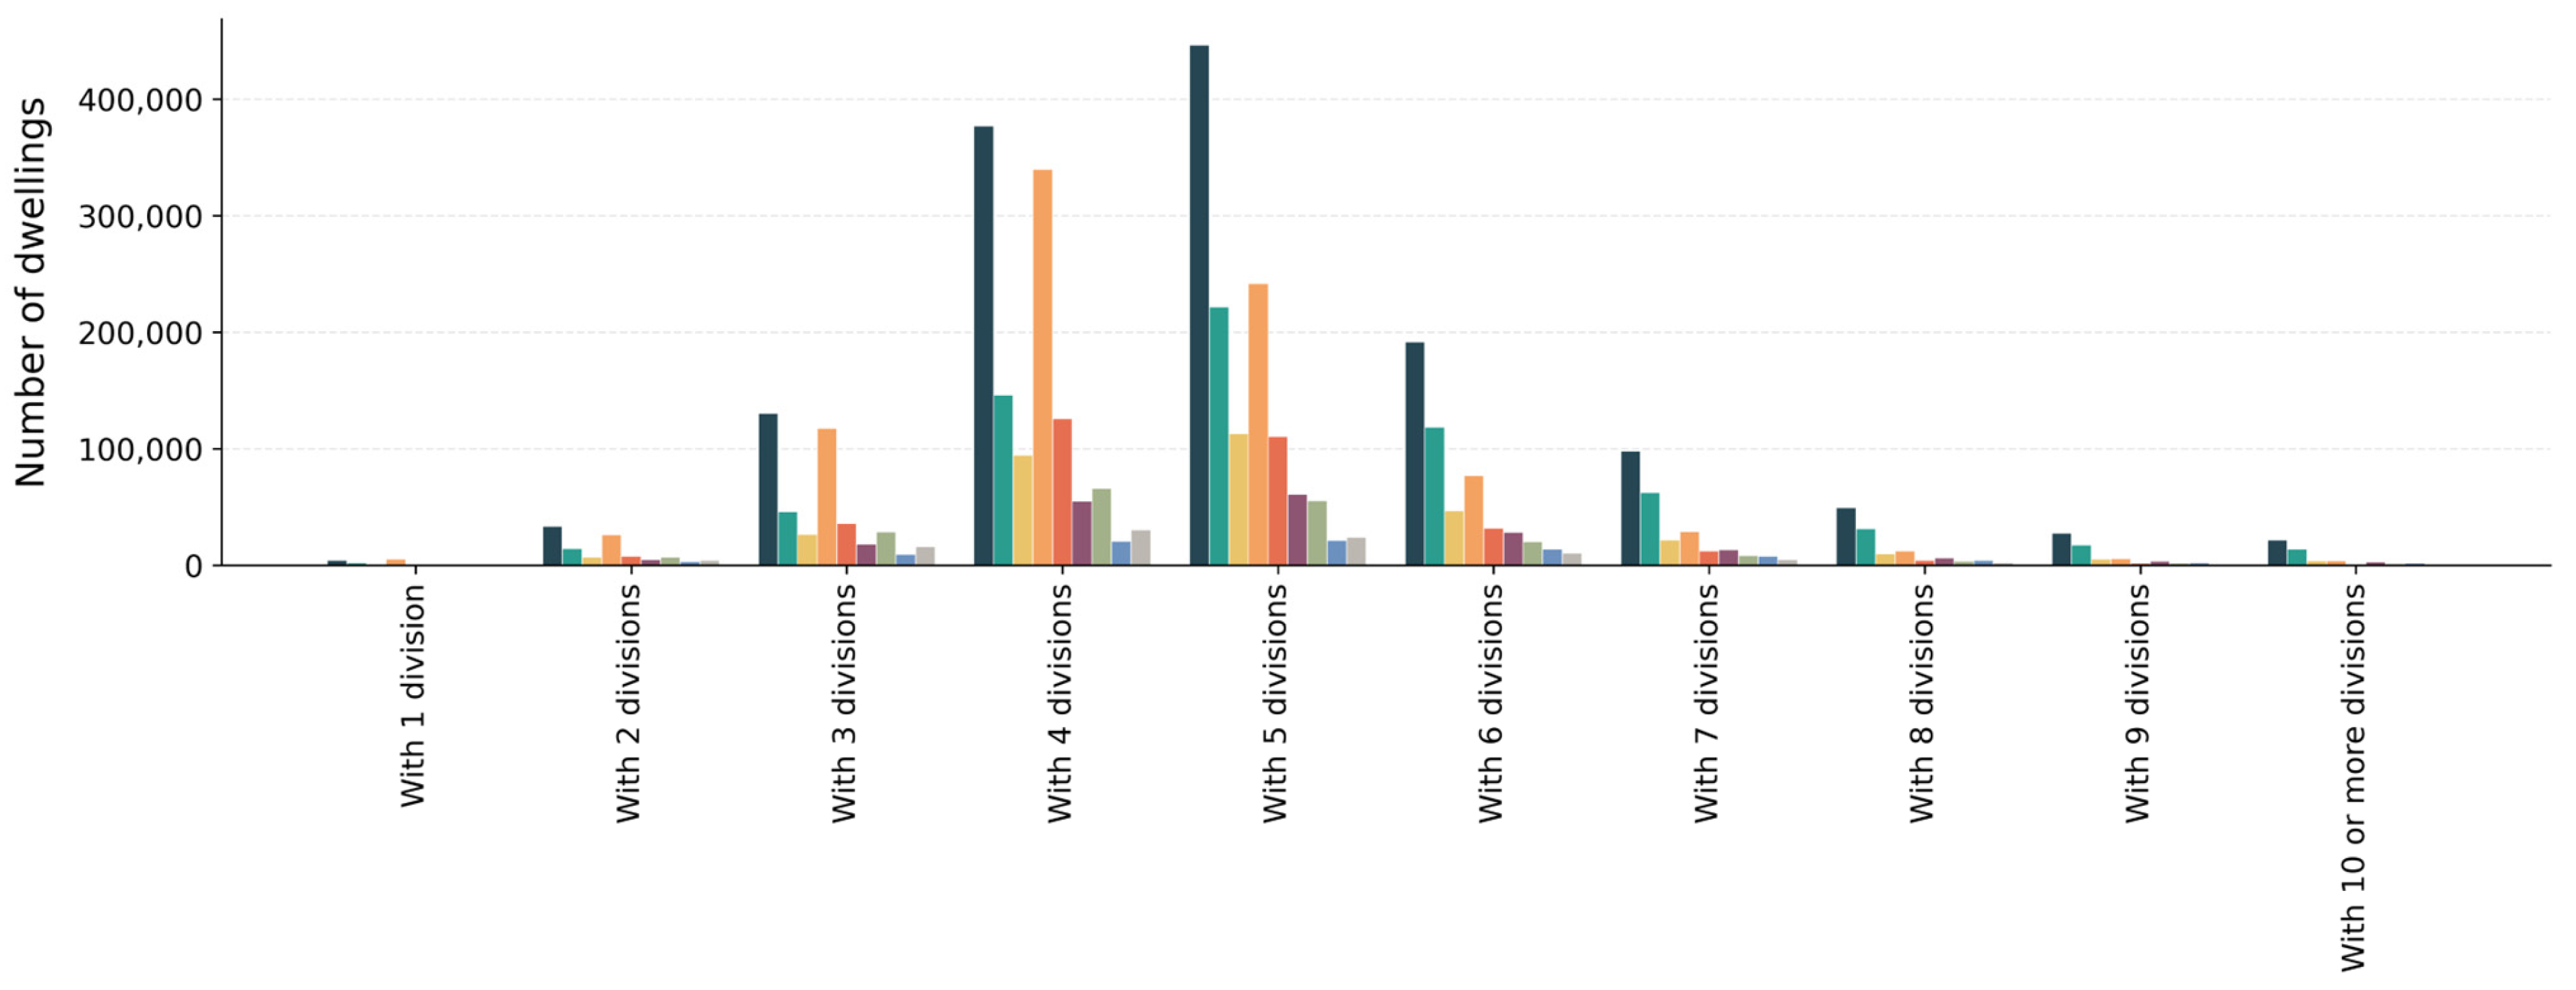
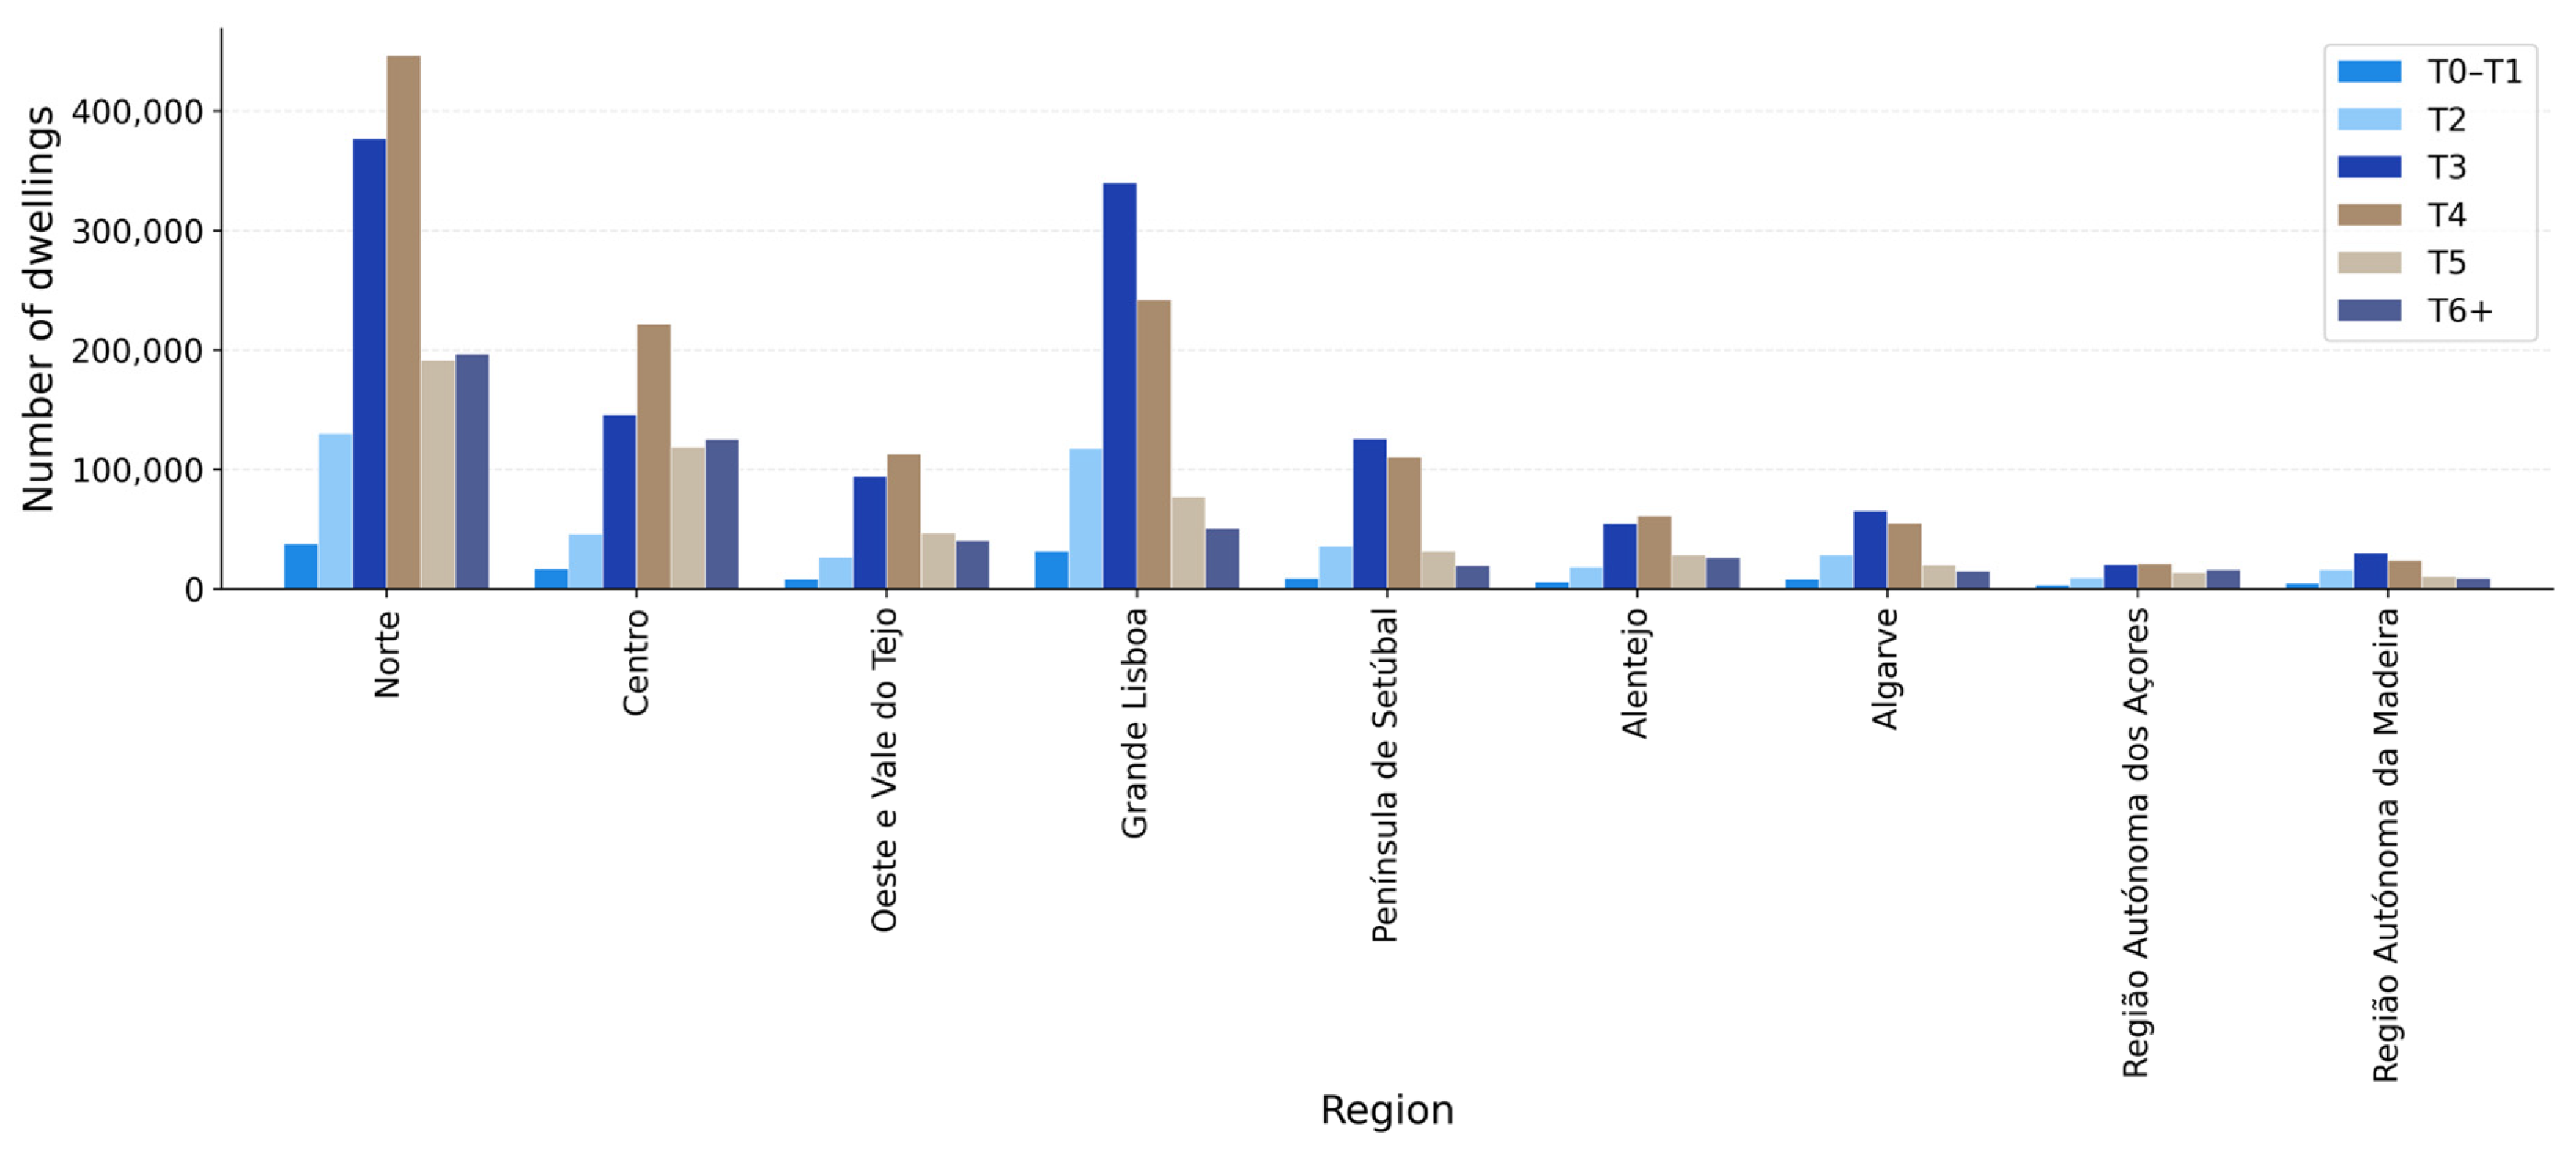
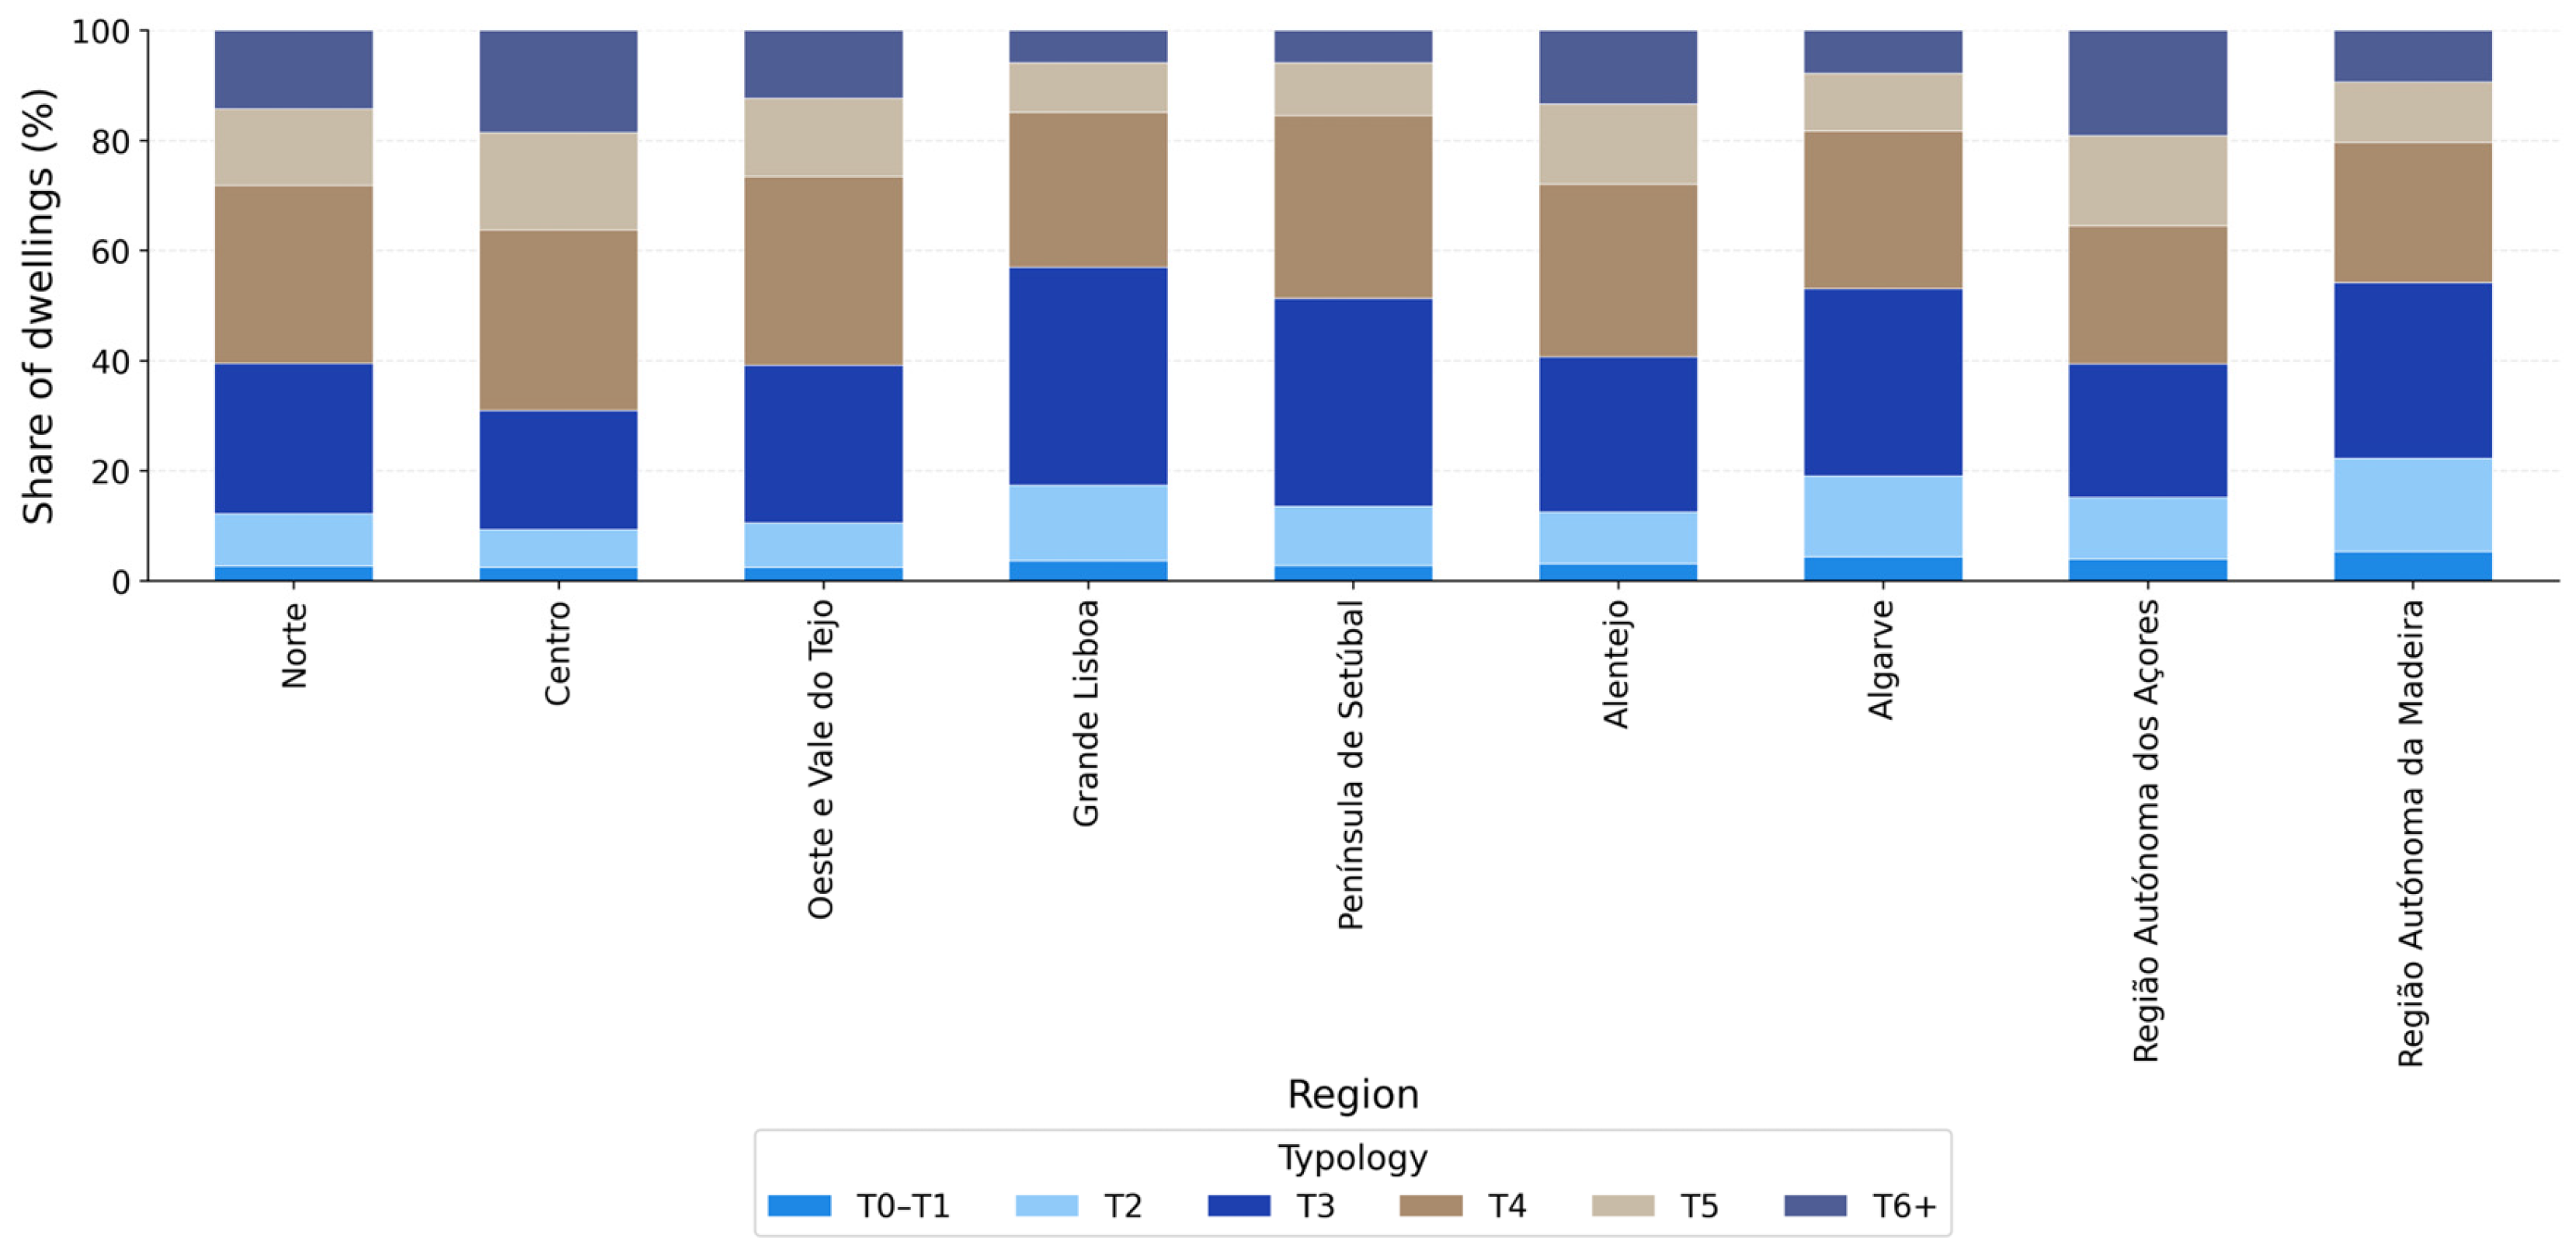
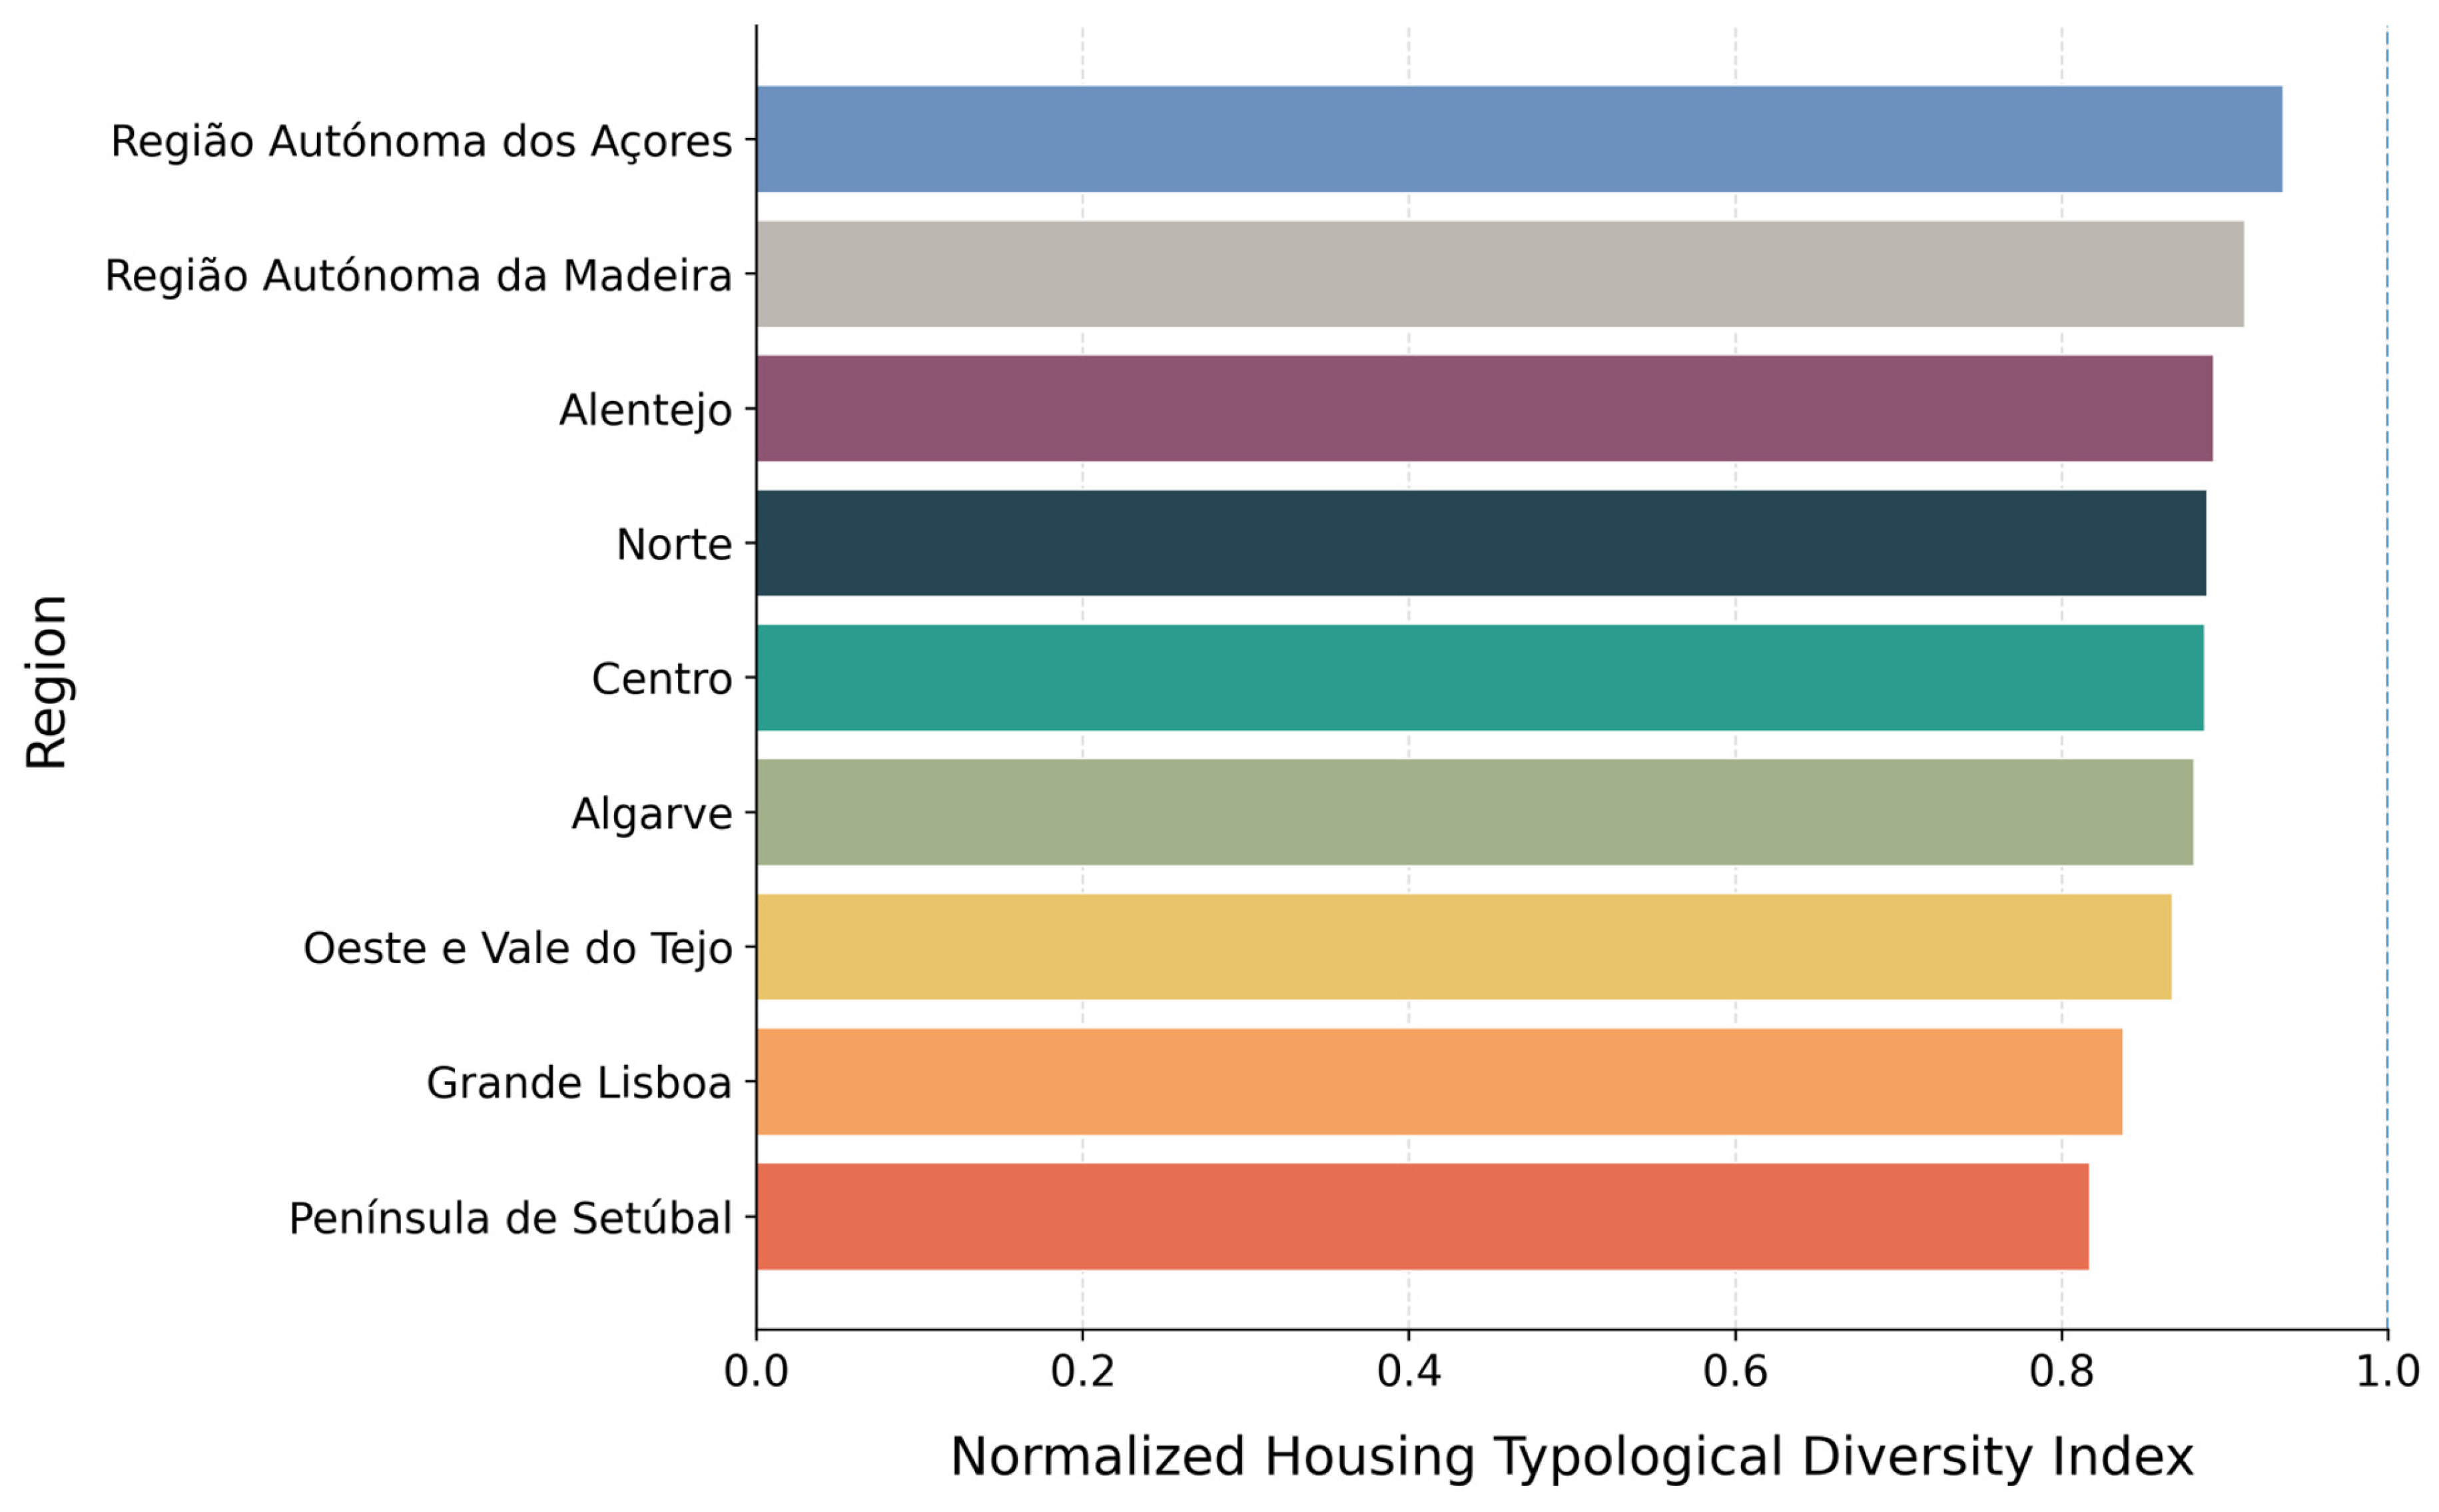
Finally, the “Normalized Housing Typology Diversity Index” [
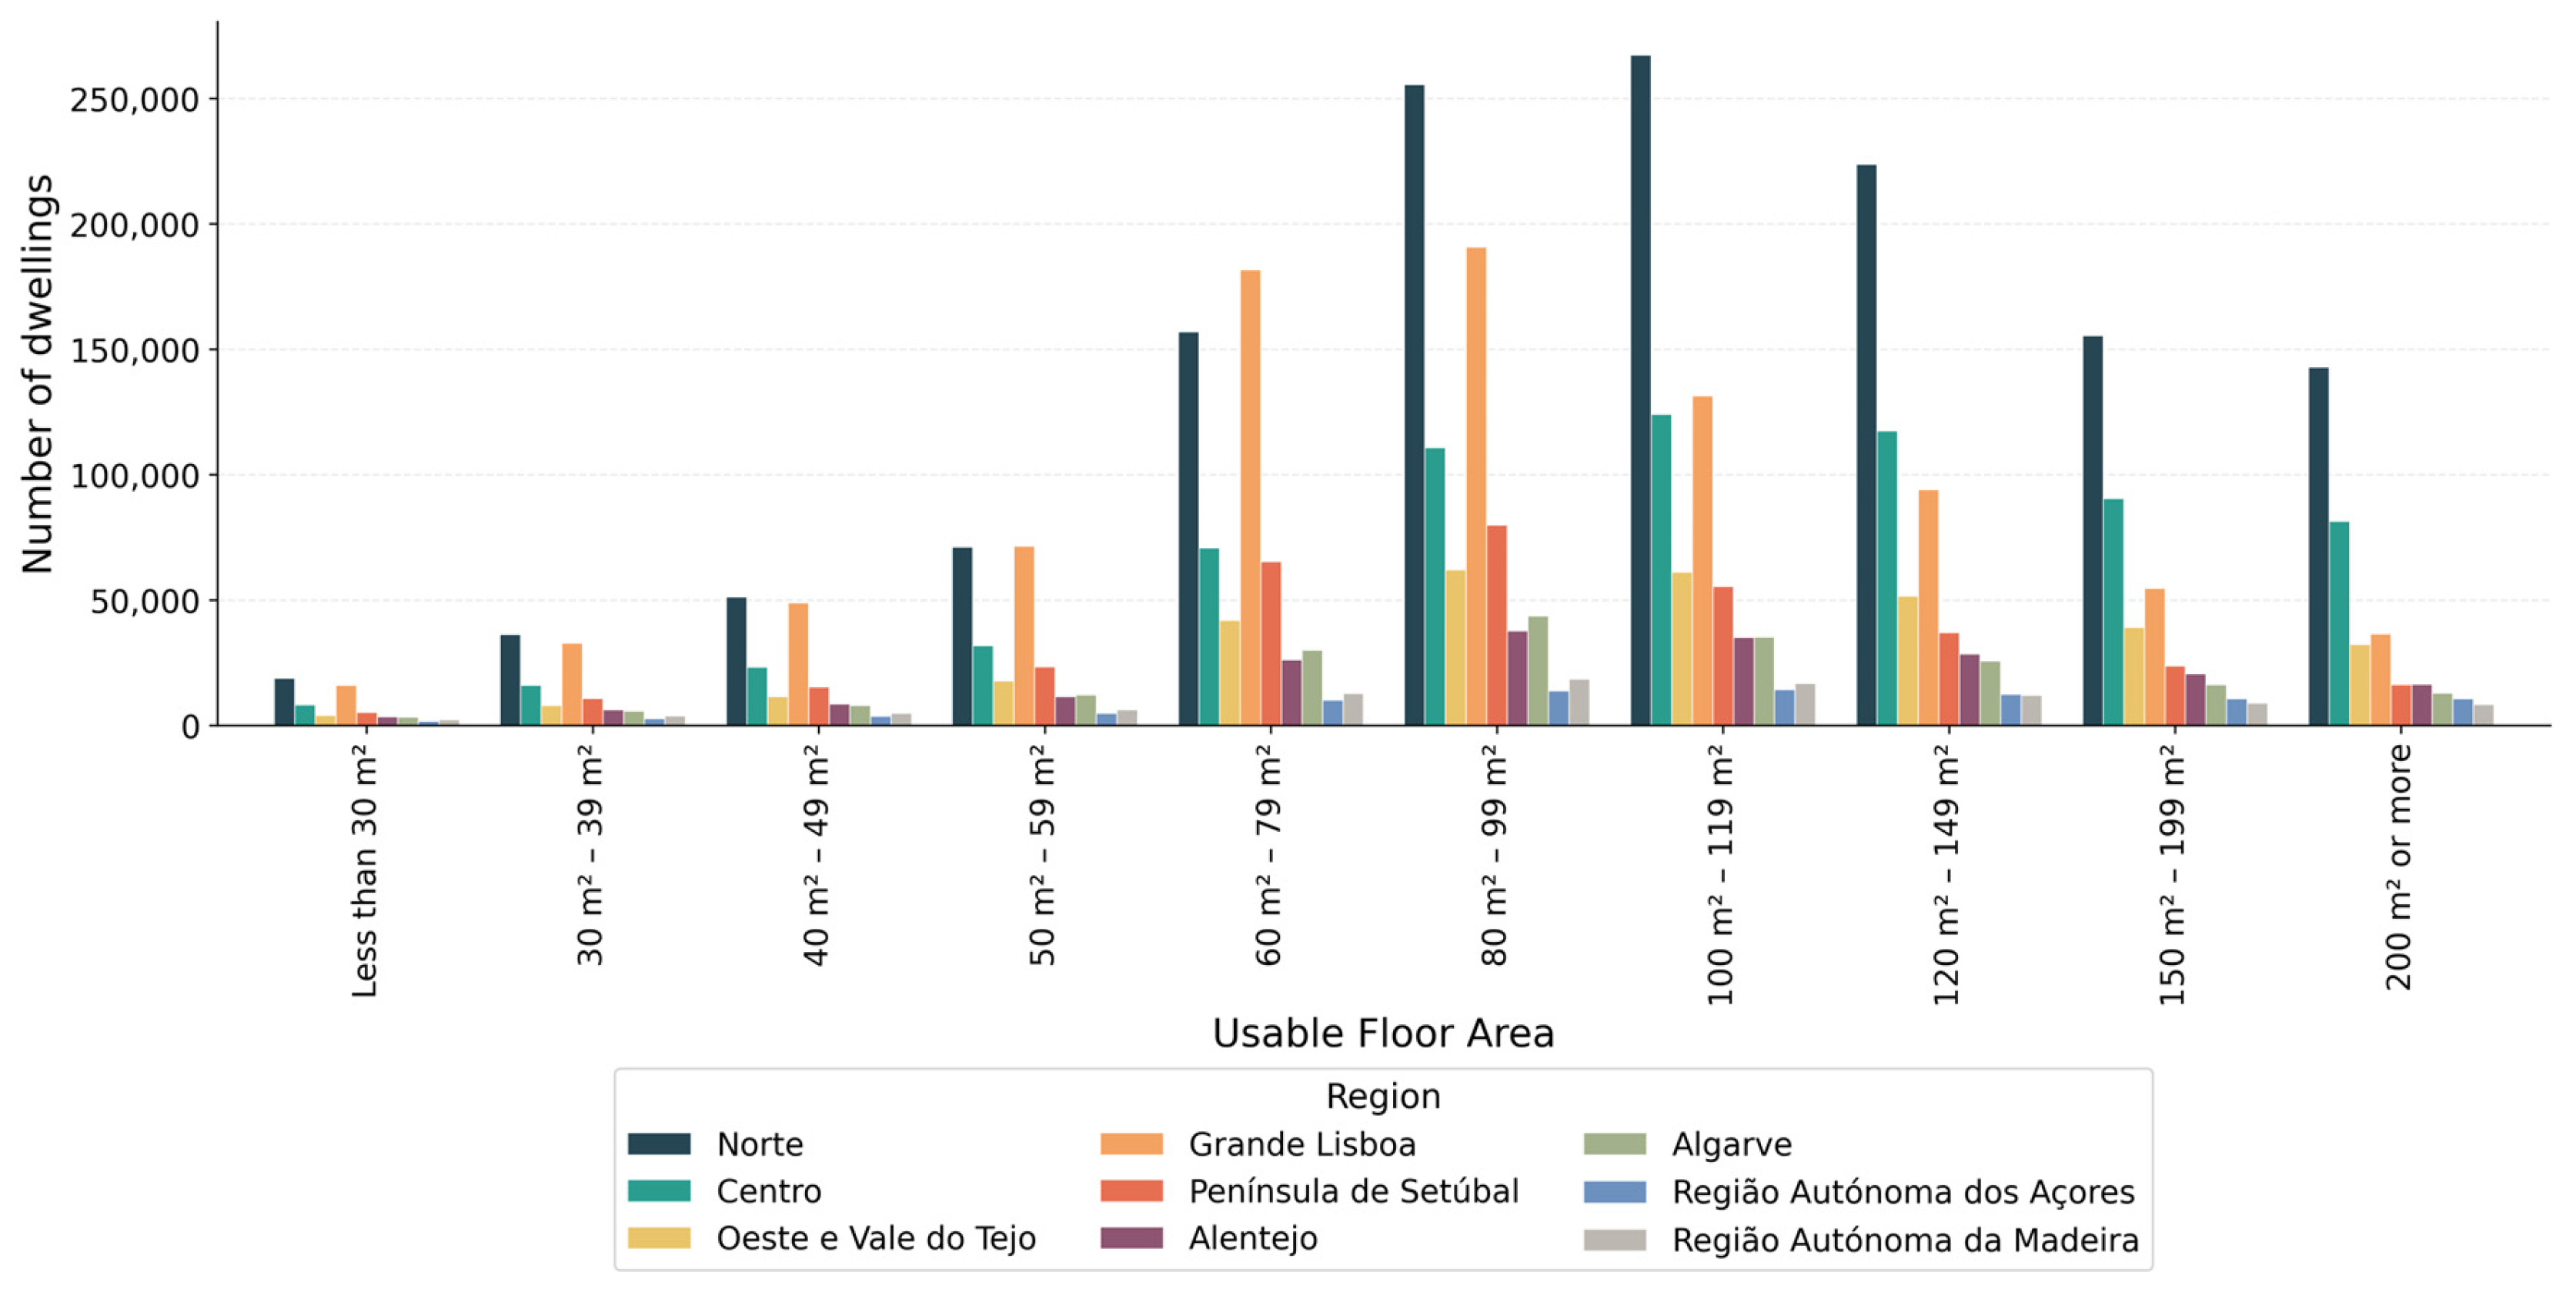
31], based on Shannon entropy, was computed using official housing data from the INE to assess the degree of heterogeneity in housing typologies across regions (Equation (3)). Specifically, using the indicator Number of Classic Dwellings of Habitual Residence (Cod: 0012503), dwellings were then classified into six mutually exclusive typological categories (T0–T1, T2, T3, T4, T5, and T6+), constructed by combining information on useful floor area and number of rooms. This typological aggregation allows for a consistent representation of the structural composition of the housing stock while ensuring comparability across territorial units. The indicator captures the evenness of the distribution of housing units across typologies, rather than their absolute quantity. Higher values reflect a more diversified and balanced typological structure, indicating the coexistence of multiple housing typologies within the same region. Conversely, lower values signal a concentration of the housing stock in a limited number of typologies, suggesting a more specialized or homogeneous housing structure. To ensure comparability across regions and time, Shannon entropy is normalized by its theoretical maximum, in this case, ln(6), yielding a dimensionless index bounded between 0 and 1.
5. Discussion
The findings of this study can be considered in the context of a broader European and international discussion on housing inequality, affordability pressures, and uneven housing-market adjustment. Even though the analysis is focused on Portugal, the patterns observed are not particularly unusual. Similar developments have been identified in other settings, especially the widening gap between housing costs and household purchasing power, the concentration of pressure in metropolitan and other high-demand areas, and the limited capacity of housing supply to respond at the same speed as demand [
34,
35,
36]. Recent comparative research has shown that affordability has worsened across European countries and urban regions, as prices, rents, and related housing costs have increased faster than household incomes, often with significant territorial differences within the same national context [
34,
35]. Evidence from the Lisbon area points in the same direction, suggesting that the Portuguese case should be understood as part of a wider pattern of spatially uneven housing-market adjustment rather than as a singular national trajectory [
36].
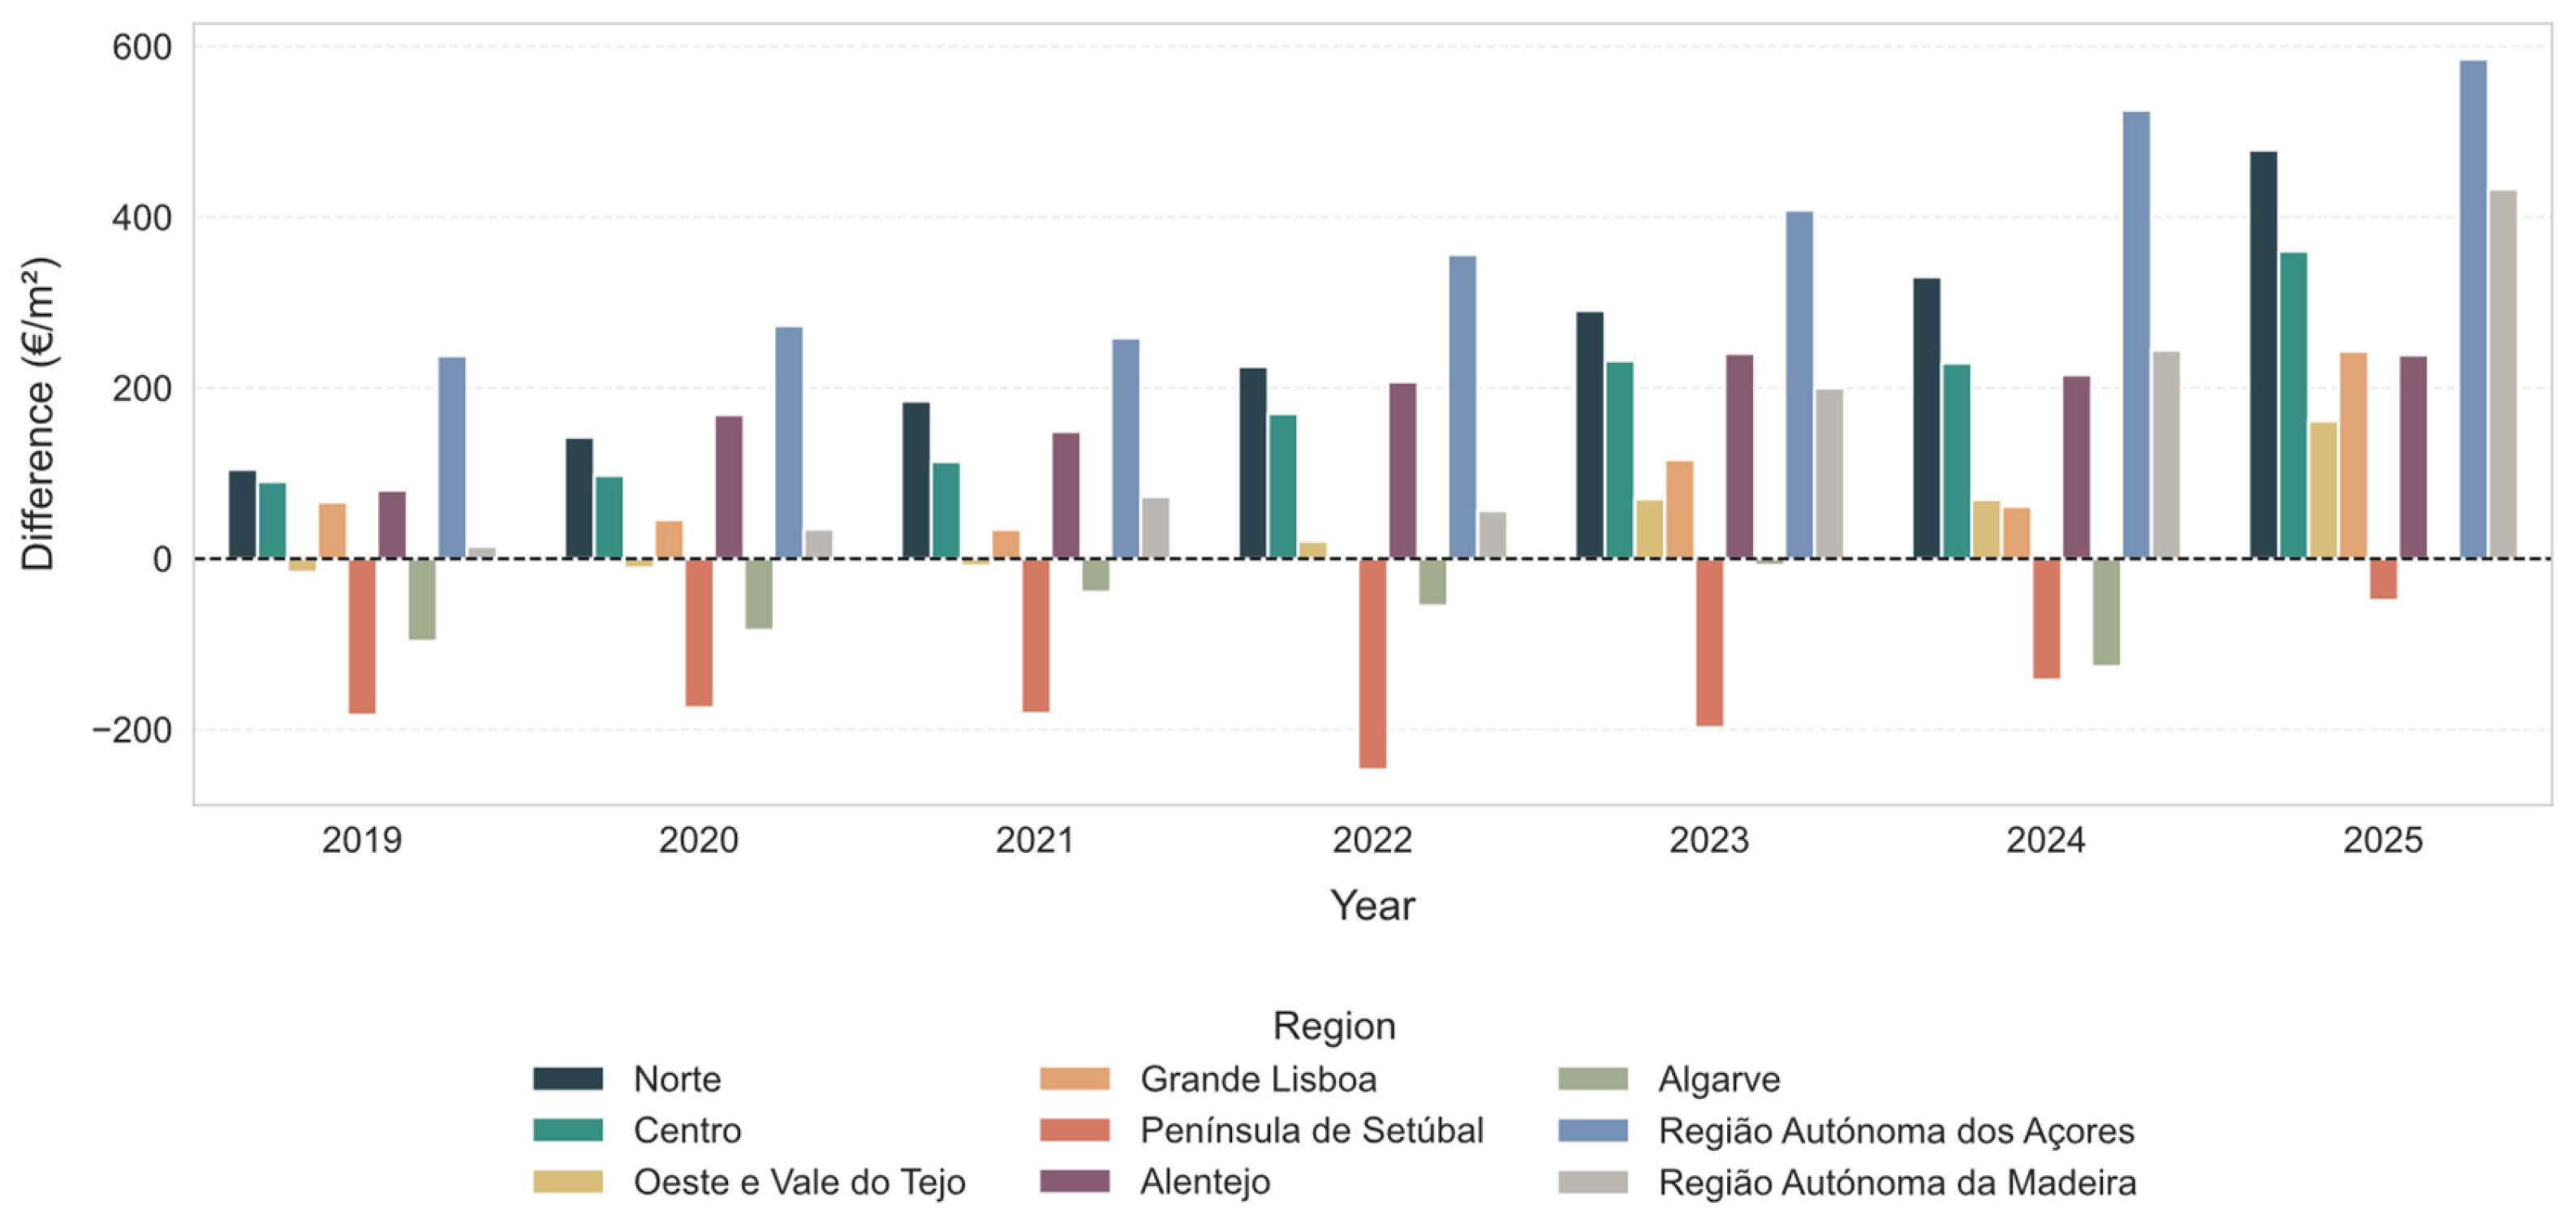
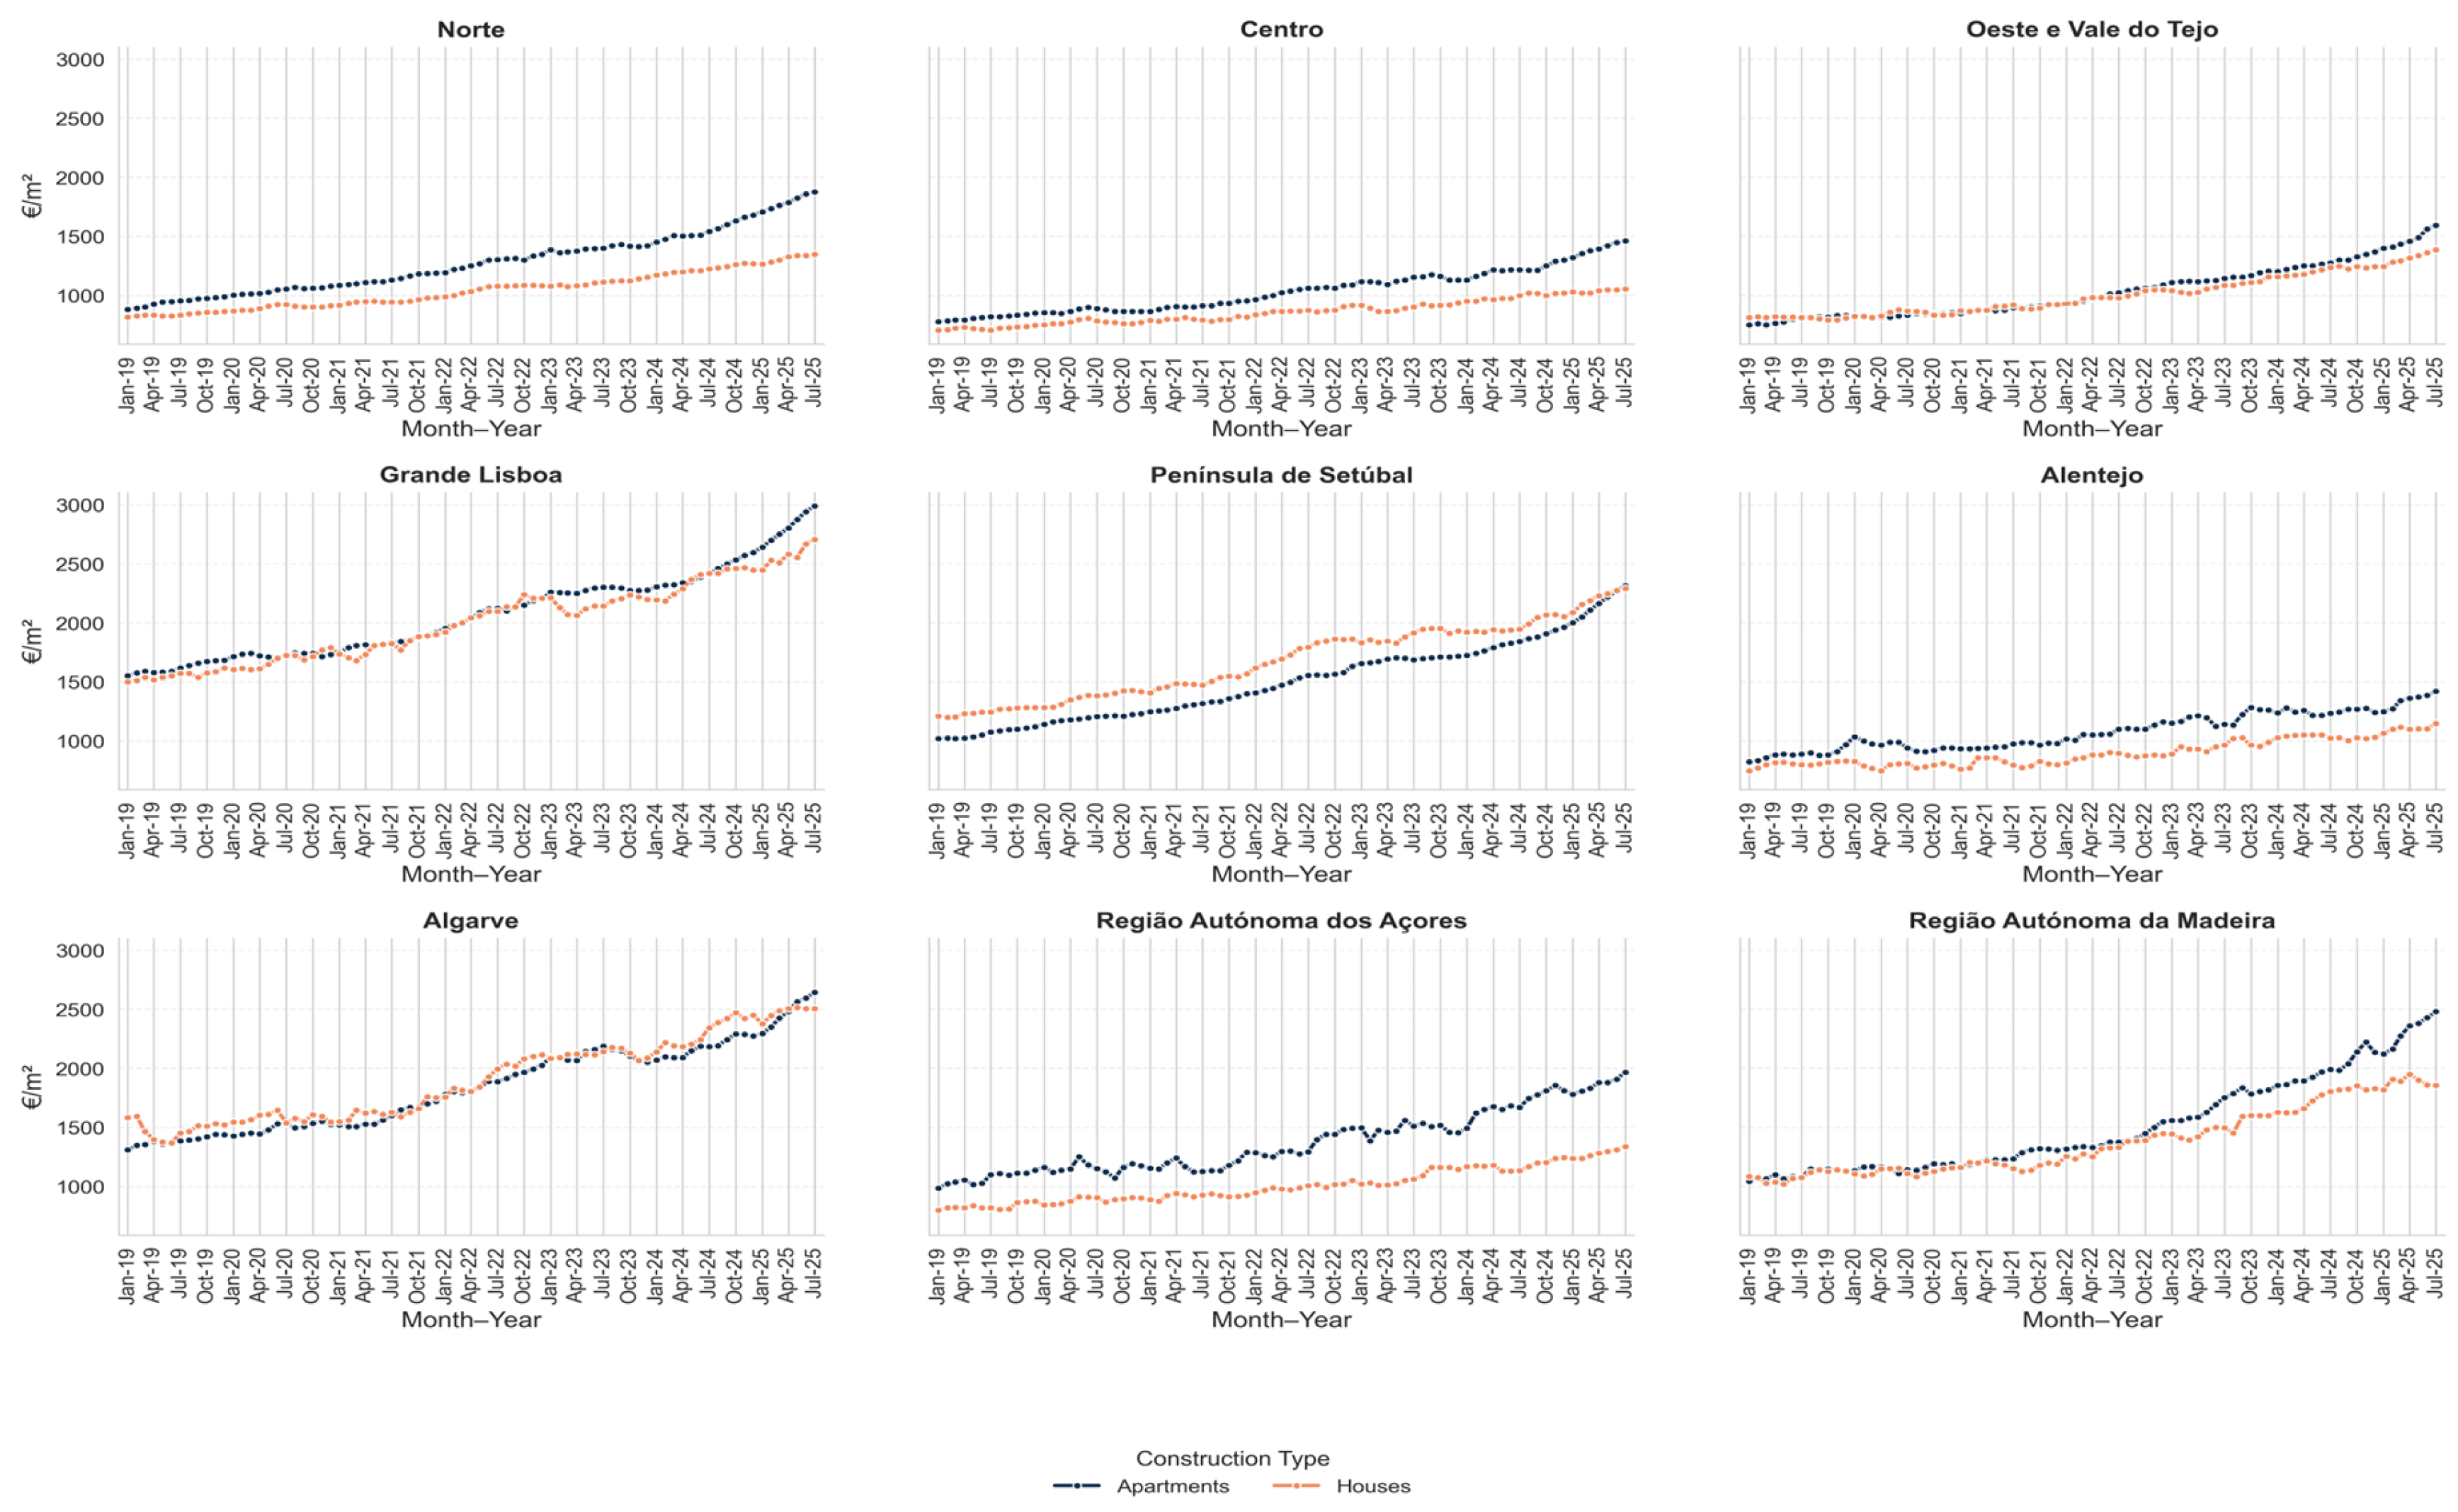
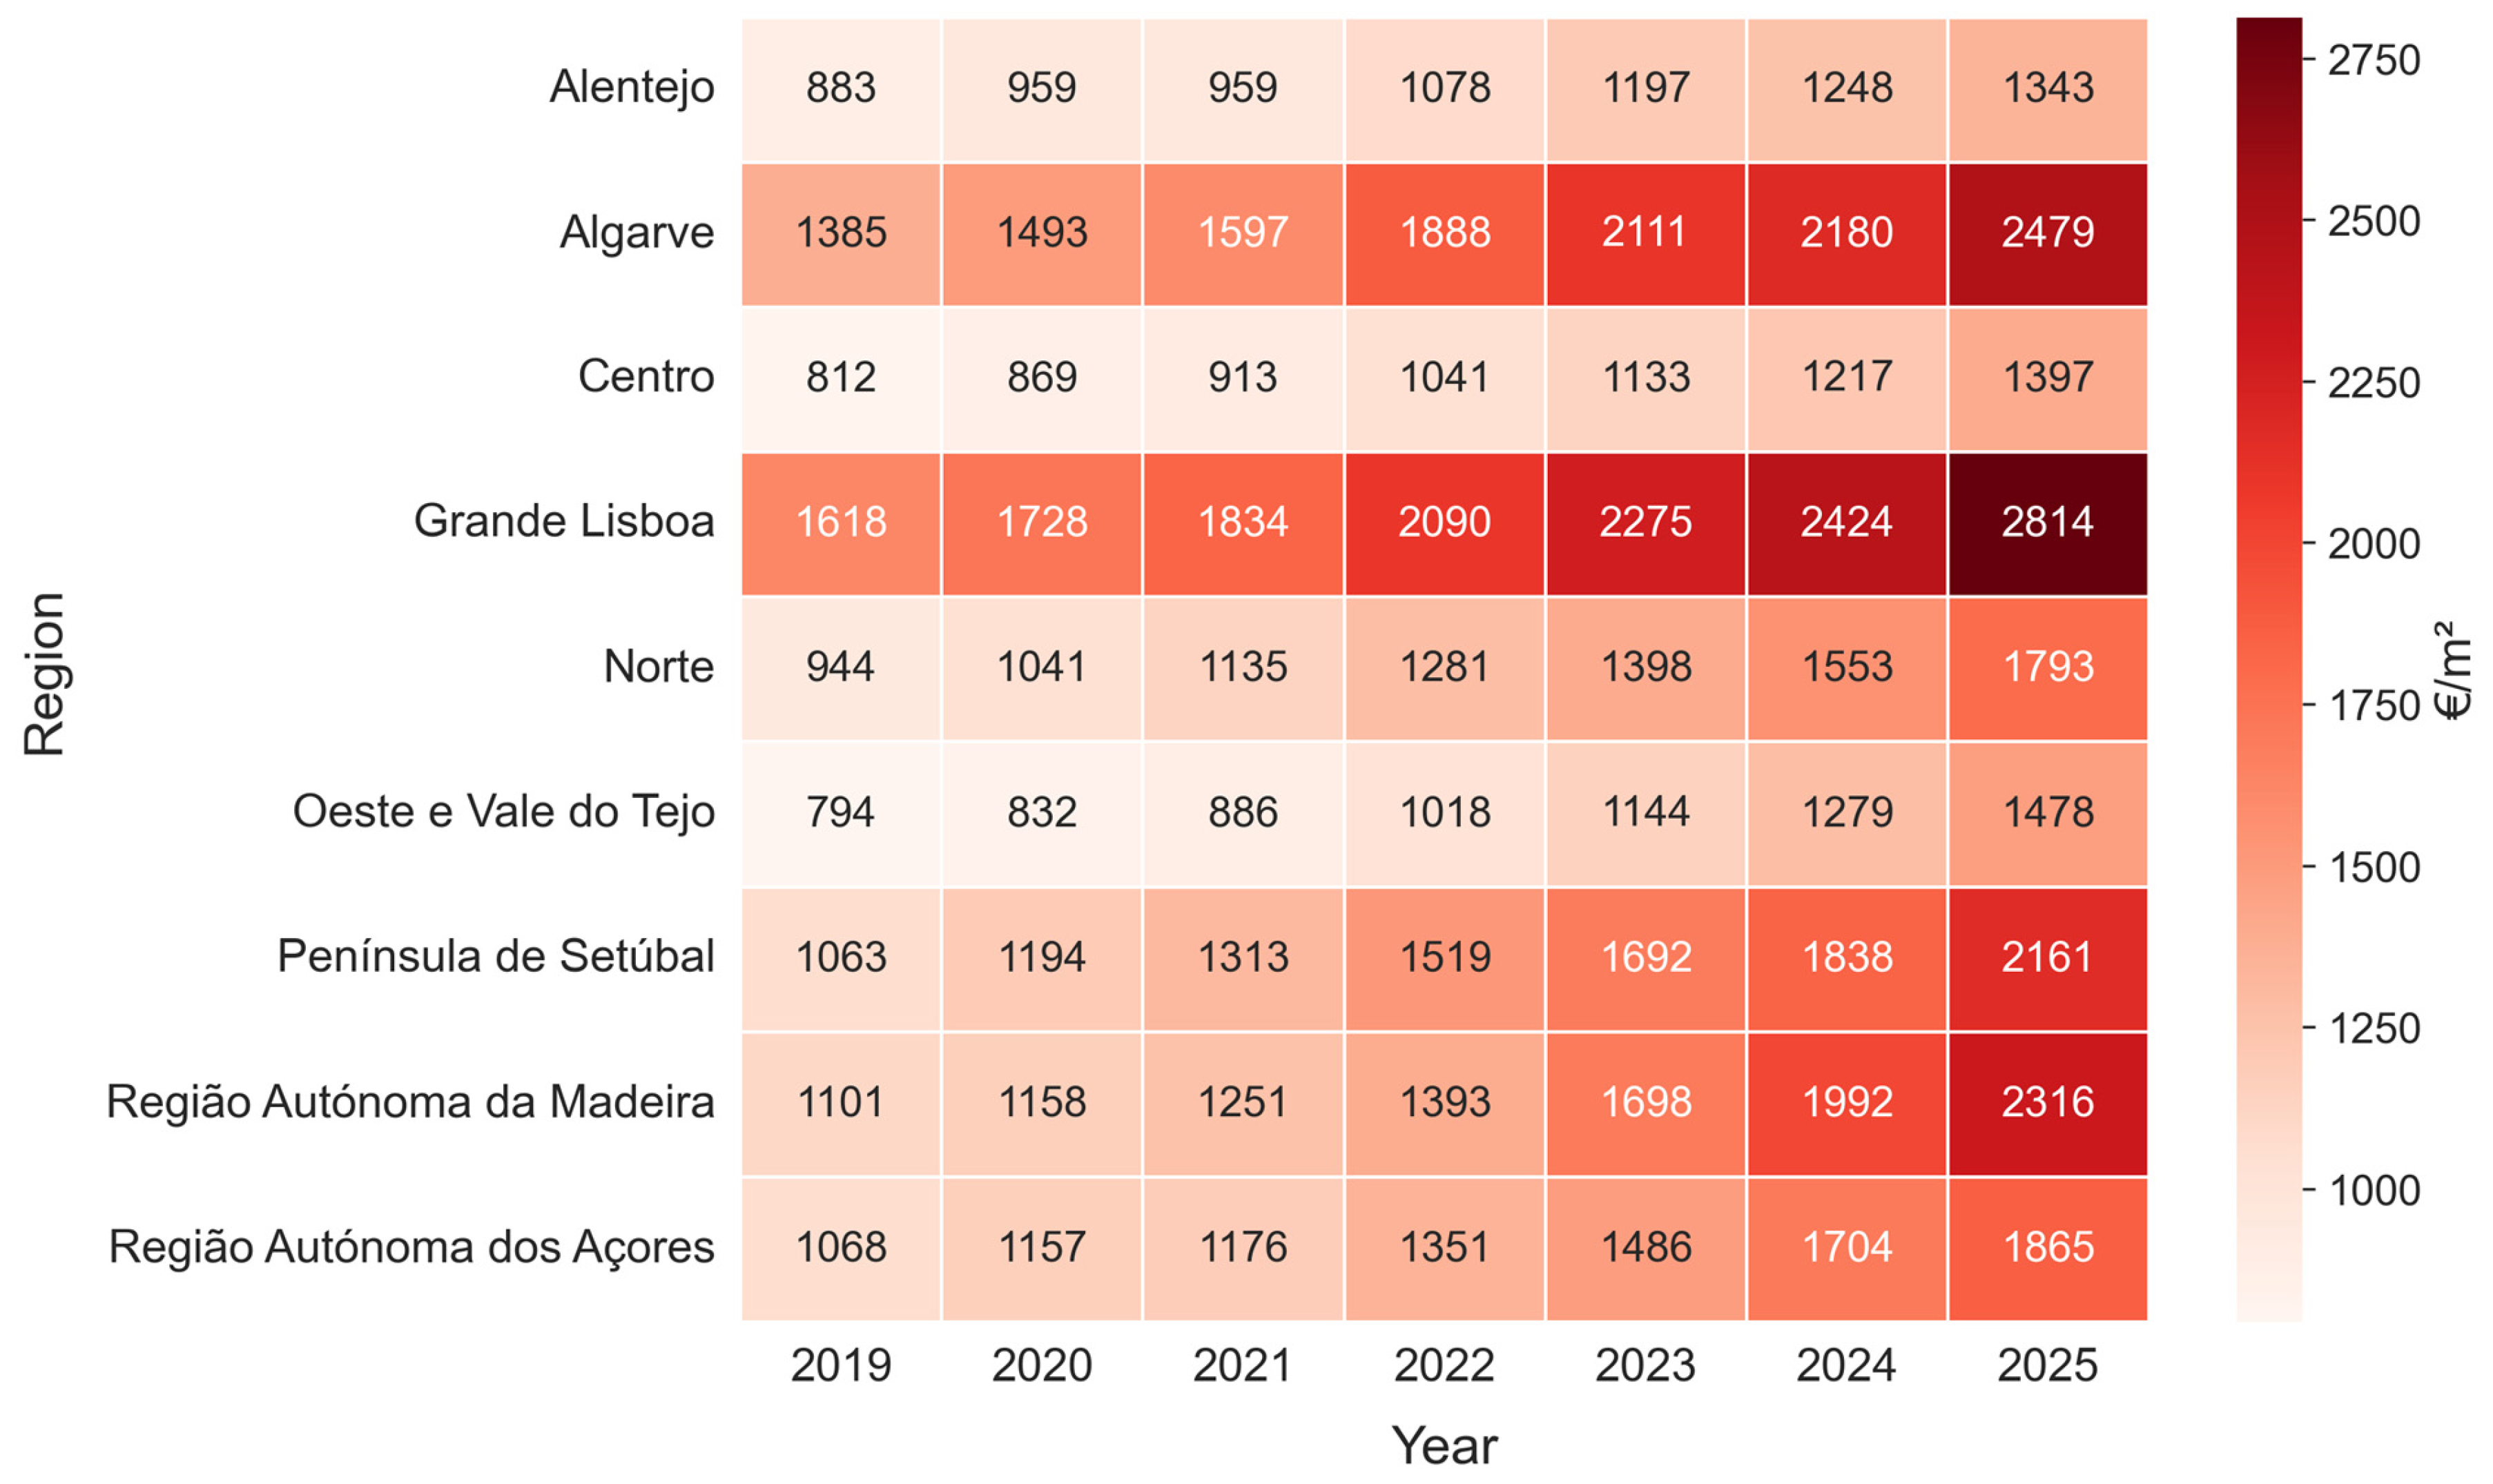
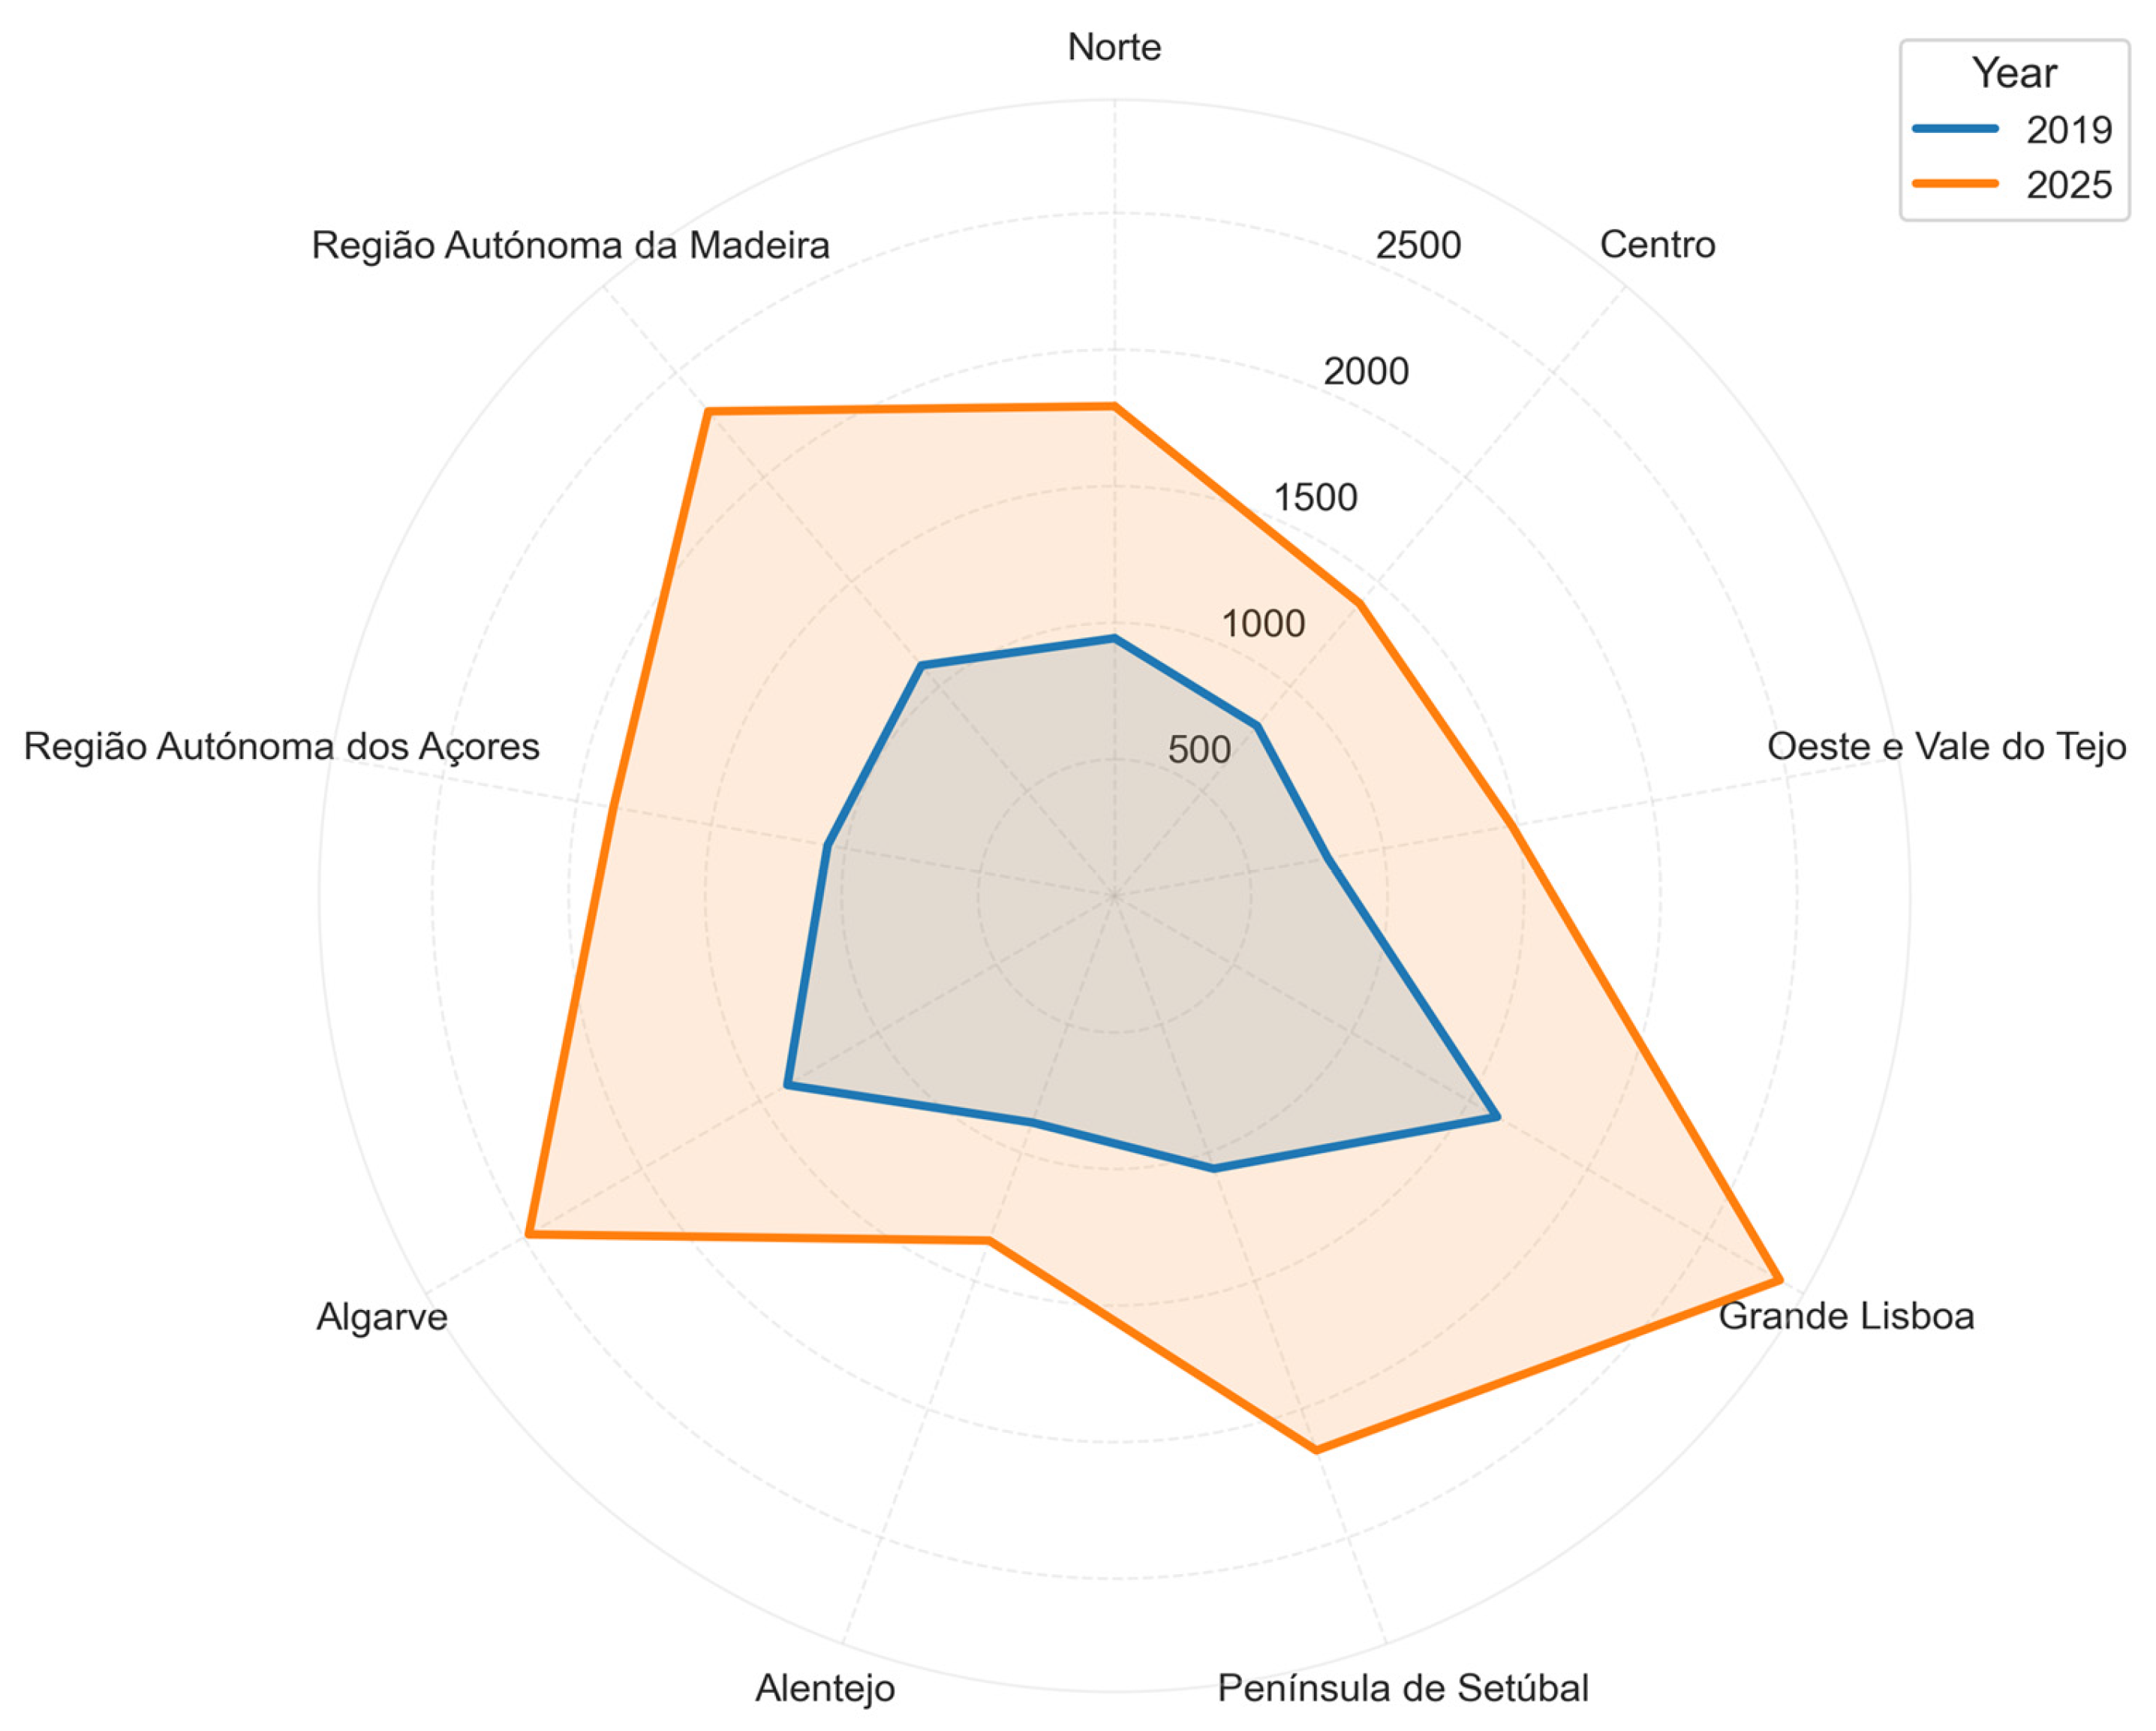
Portugal does not appear to be an exception so much as a clear example of broader structural pressures currently affecting housing markets. The valuation growth identified in
Grande Lisboa,
Península de Setúbal,
Algarve, and other high-pressure territories is consistent with what has been described in the literature as housing-market polarization, where metropolitan concentration, tourism-related demand, and uneven investment dynamics tend to reinforce differences in access to housing [
36,
37]. More recent work has also argued that housing inequality is increasingly shaped by the combined effect of territorial concentration, market pressure, and the growing role of housing as an asset, rather than only as a basic social good [
1,
37]. In that sense, the Portuguese case helps to illustrate wider dynamics that can also be found elsewhere in Europe [
36].
The results also suggest that housing inequality cannot be understood through prices alone. When valuation dynamics are read together with housing stock characteristics, completed dwellings, and the territorial differences identified in the analysis, what emerges is a more complex process in which economic, spatial, and demographic pressures overlap and reinforce one another. This reading is in line with recent work showing that housing inequalities are produced through several dimensions, including affordability constraints, territorial disparities, and unequal access to adequate housing conditions, rather than through a single market indicator [
38,
39,
40].
A further contribution of this study lies in the way the analysis is operationalized. A large part of the literature on housing inequality is either conceptual or focused on specific empirical outcomes, but fewer studies focus on the construction of reproducible monitoring workflows based on official statistics and scalable analytical procedures. The workflow followed in this manuscript adds not only empirical evidence on Portugal but also a transferable way of integrating public data and communicating territorial patterns through visual analytics [
39,
40].
In terms of implications for policy makers, the results reinforce the need to move beyond national aggregates. The concentration of housing pressure in specific territories, together with the uneven response of new construction, suggests that housing policy needs to be more sensitive to place and scale. Metropolitan areas and territories shaped by strong tourism demand are unlikely to respond to the same instruments in the same way as lower-pressure regions. The Portuguese case reflects a wider governance problem that is not unique to one country: how to turn fragmented official data into usable and comparable intelligence for policy design, monitoring, and evaluation [
39,
40].
The results are broadly consistent with what has been discussed in the international literature. First, housing pressures are becoming increasingly territorialized, rather than evenly distributed across space. Second, supply does not always adjust at the same speed as demand and price escalation. Third, the policy value of housing analysis depends heavily on the availability of harmonized and interpretable monitoring tools that can support comparison over time and across territories [
34,
39,
40].
6. Conclusions
This paper contributes to the study of housing inequalities by coupling empirical evidence with a reproducible, data science-oriented analytical architecture designed to monitor territorial dynamics. Using Portugal as a case study, the analysis shows how Business Intelligence (BI) and urban analytics methodologies can be used to transform fragmented official statistics into policy-relevant insights.
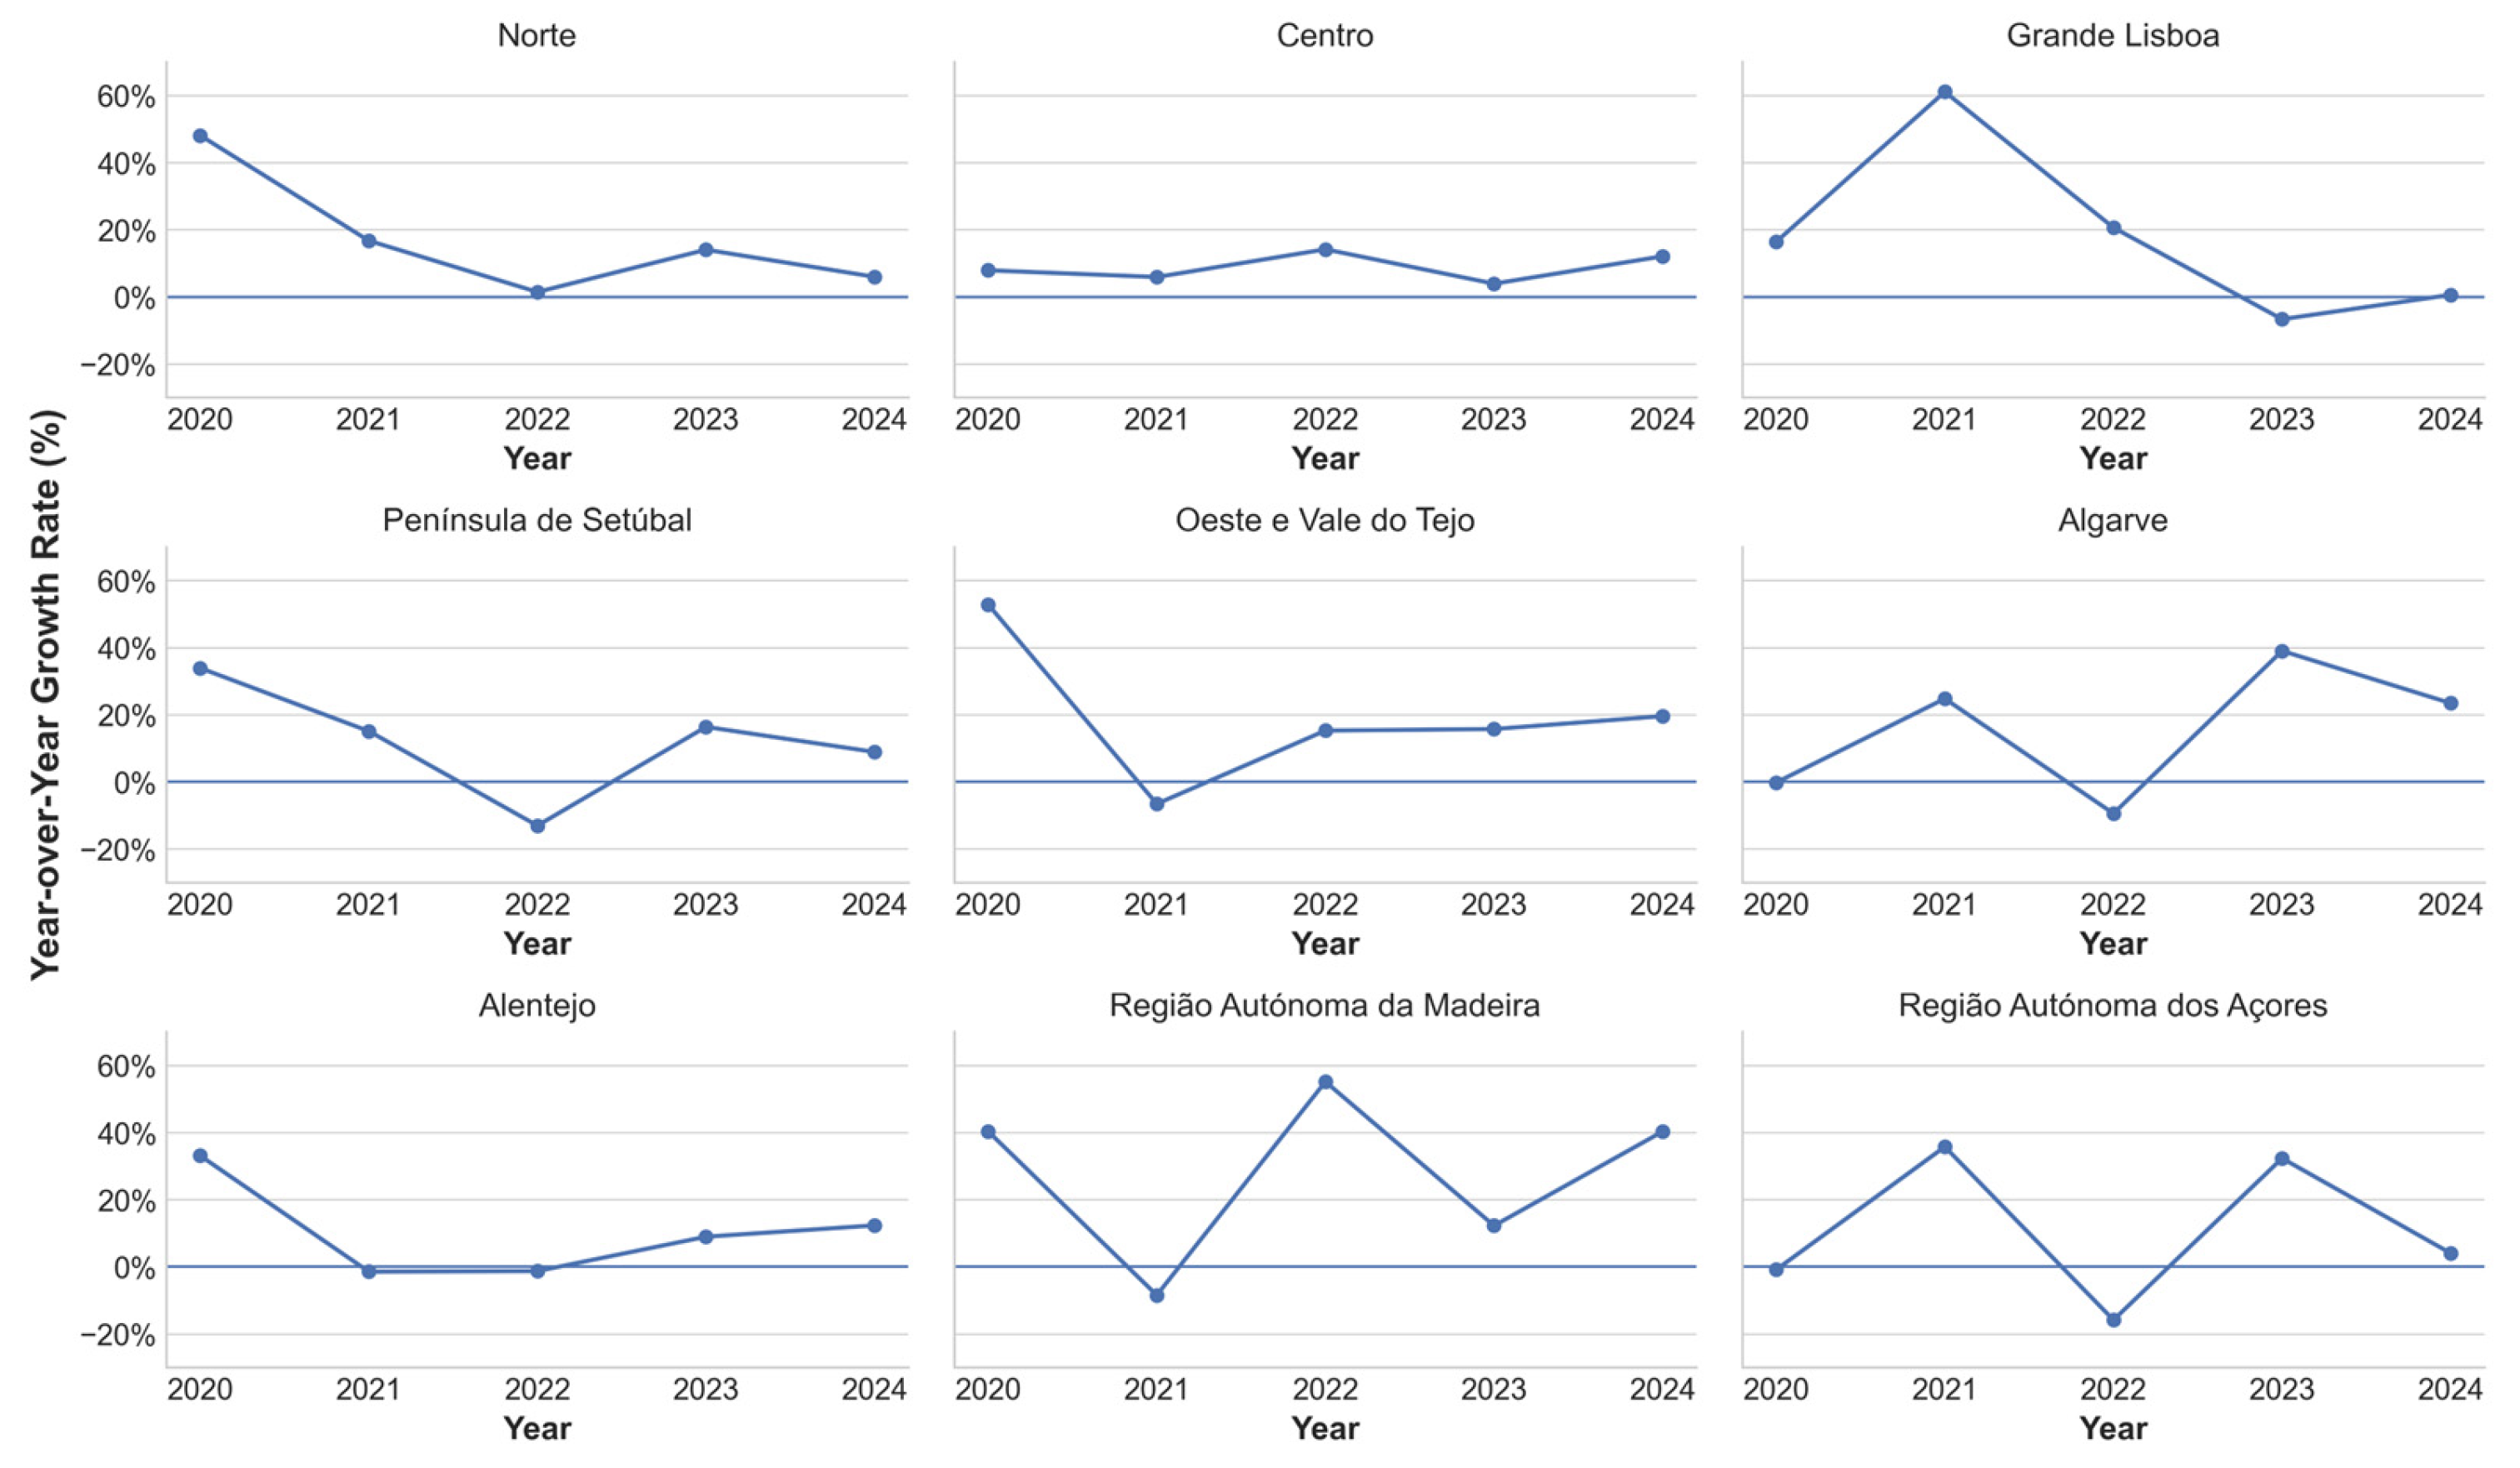
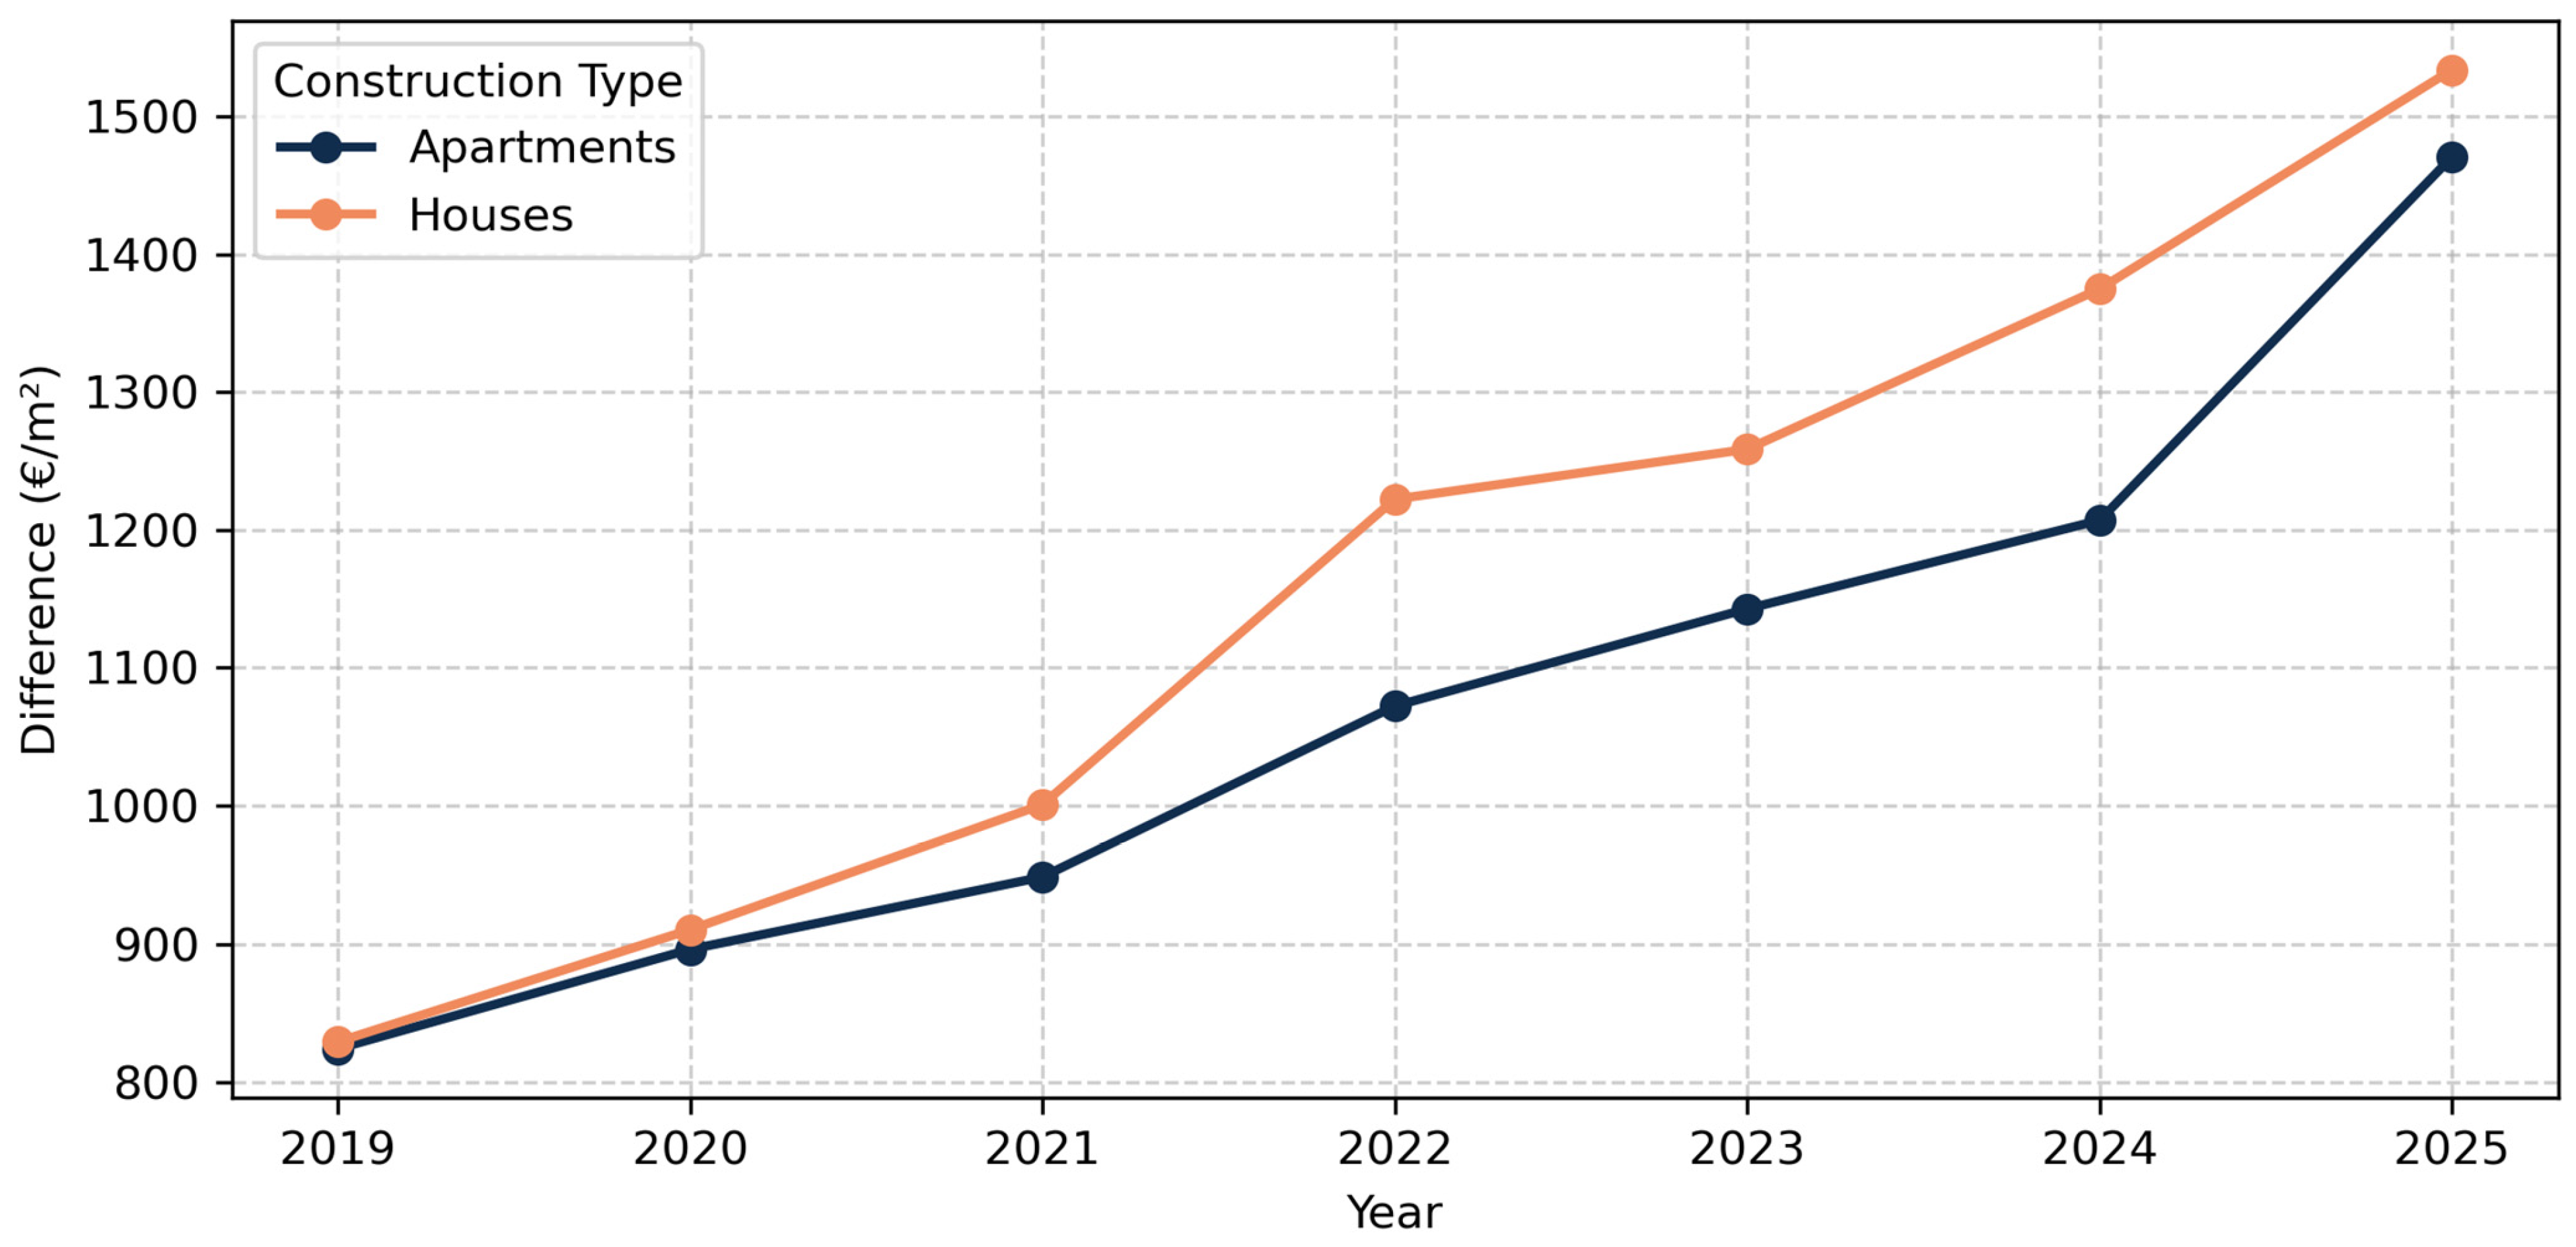
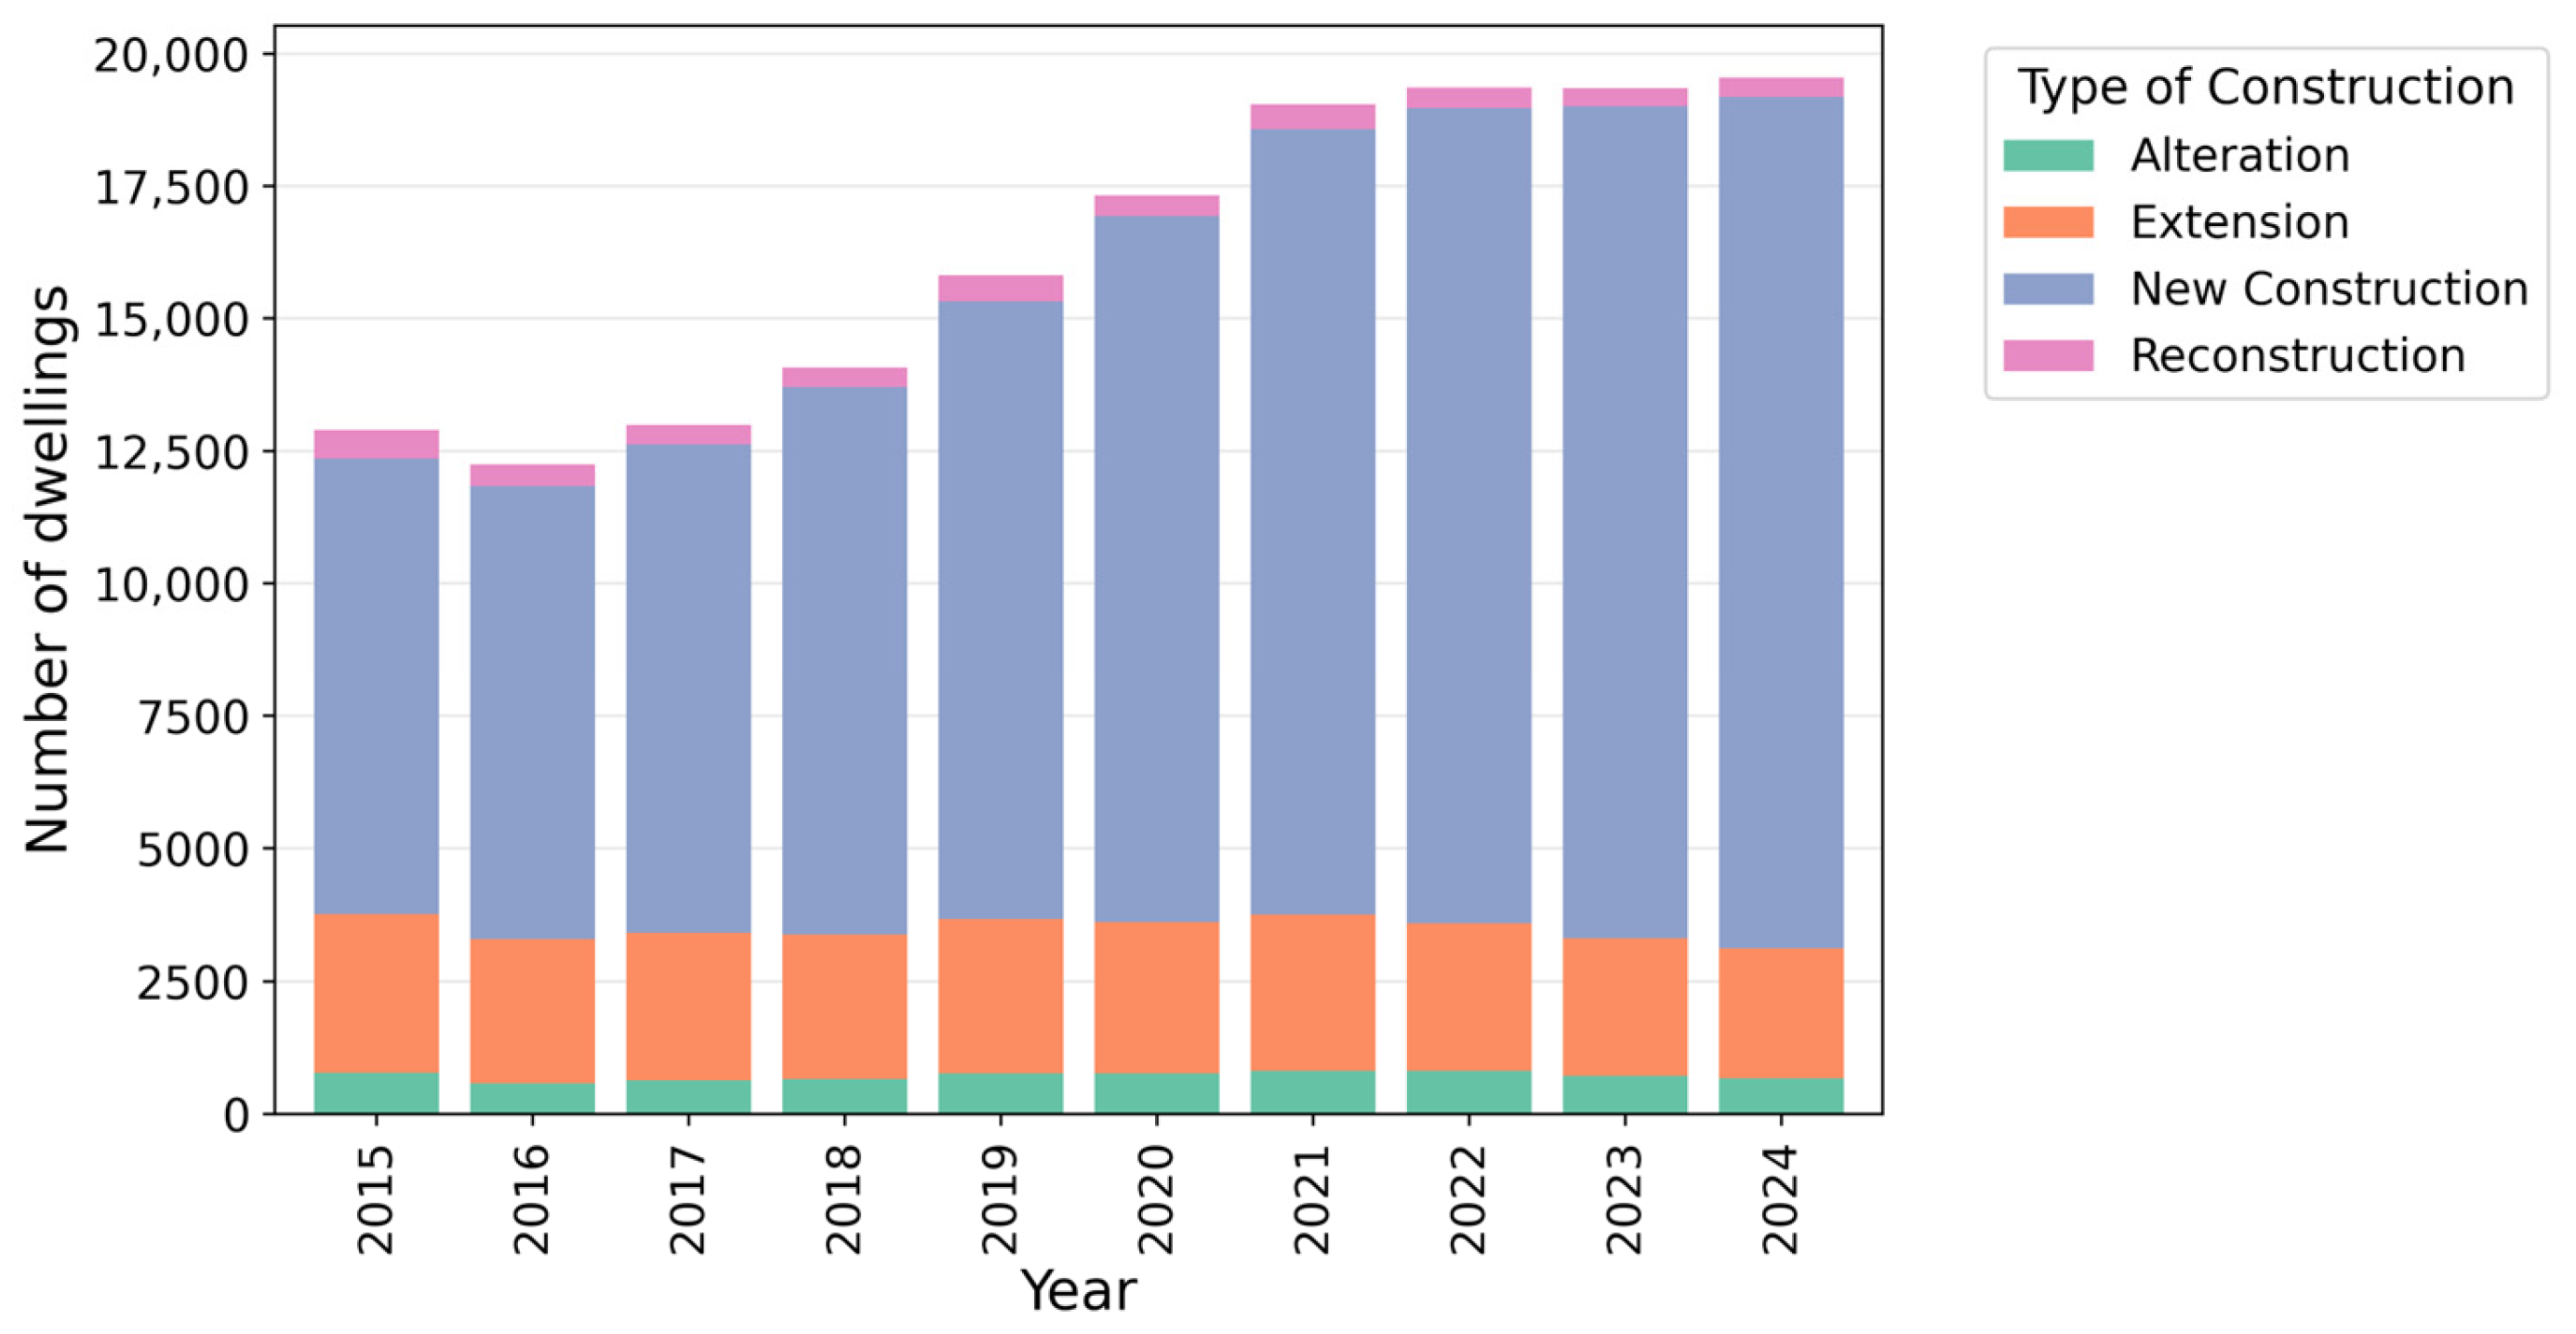
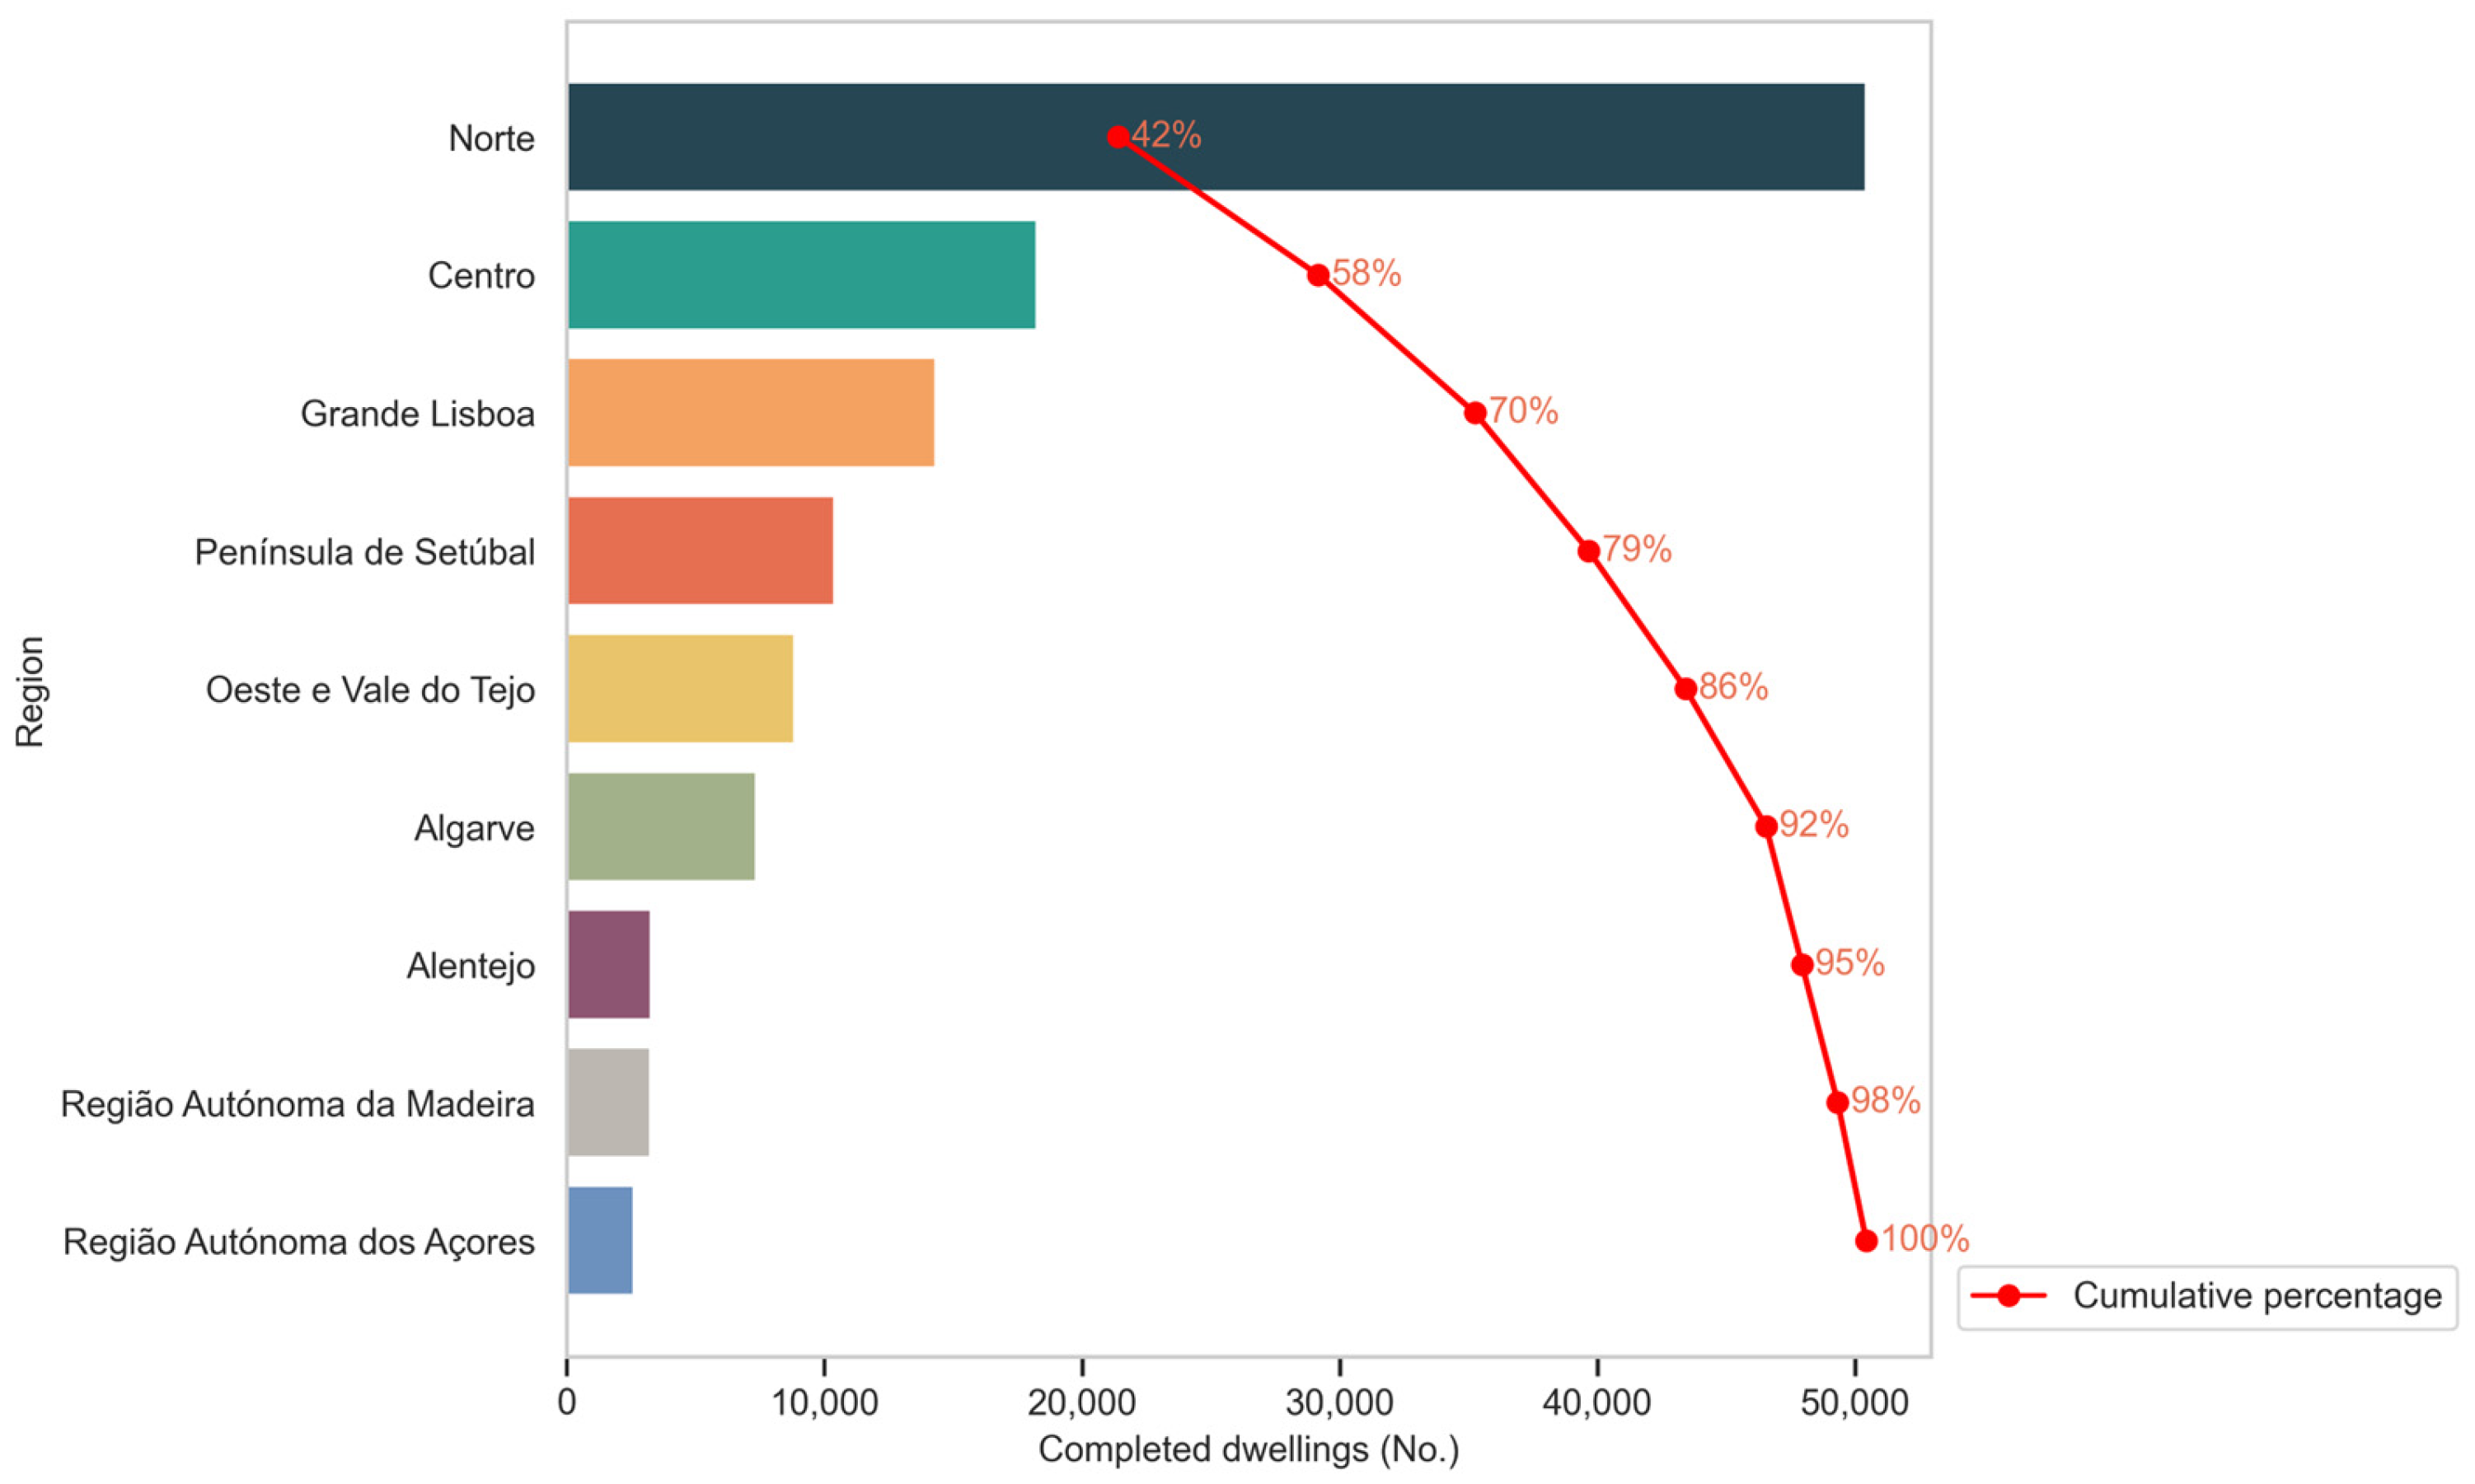
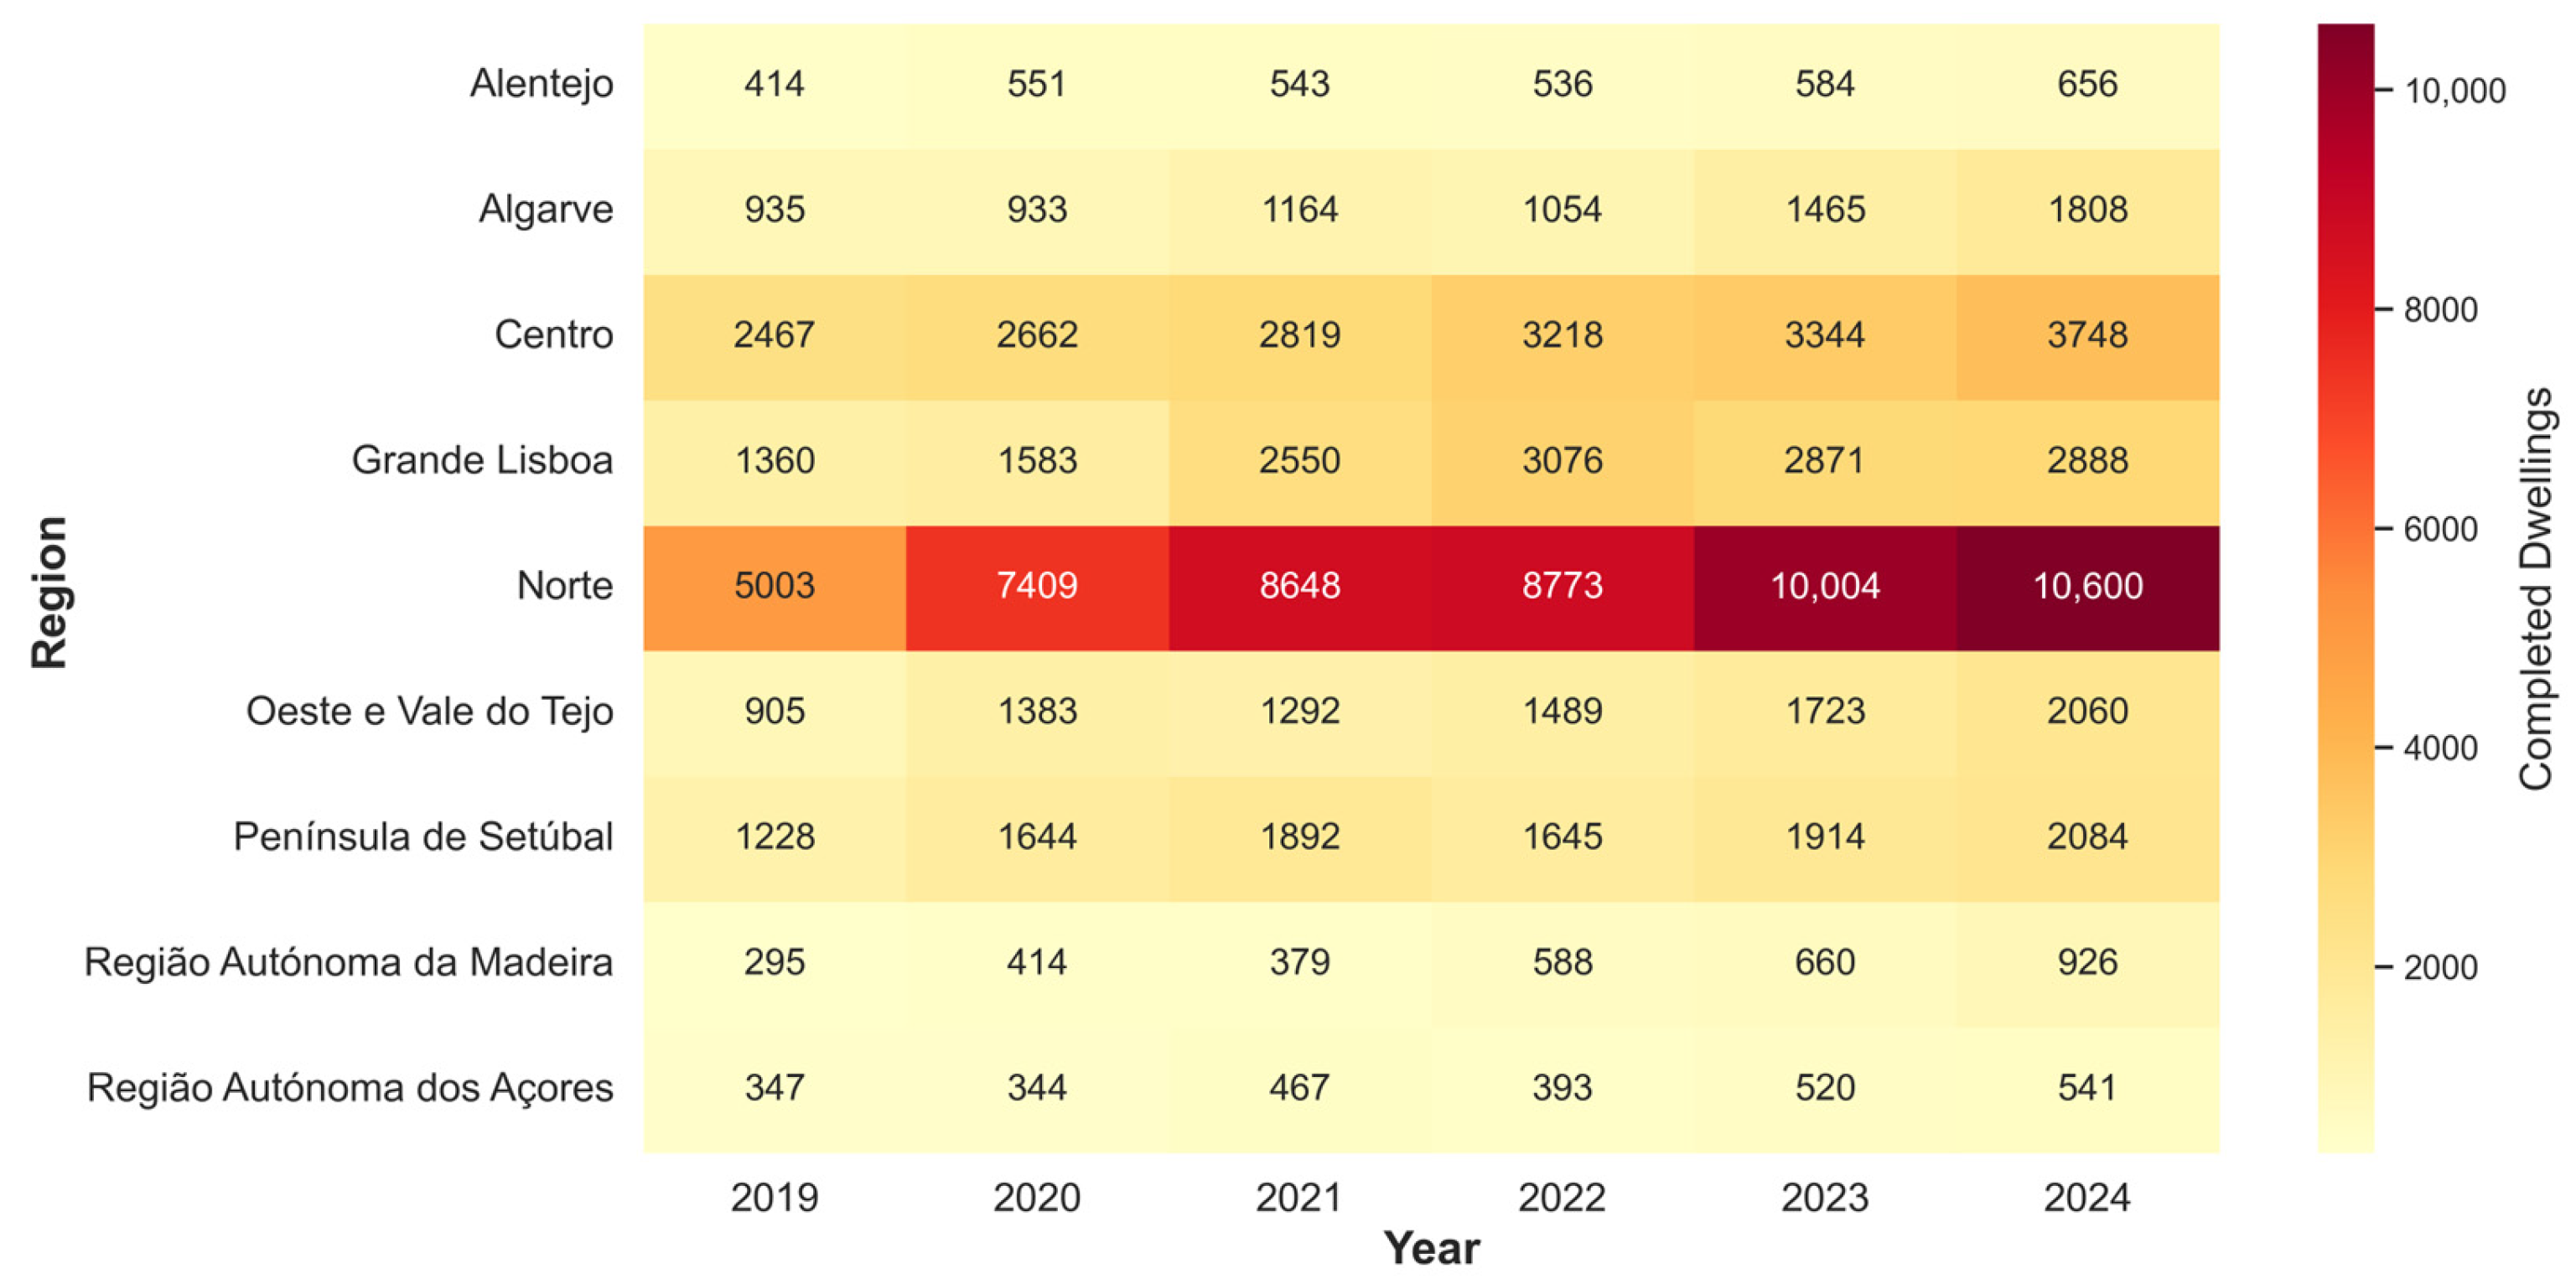
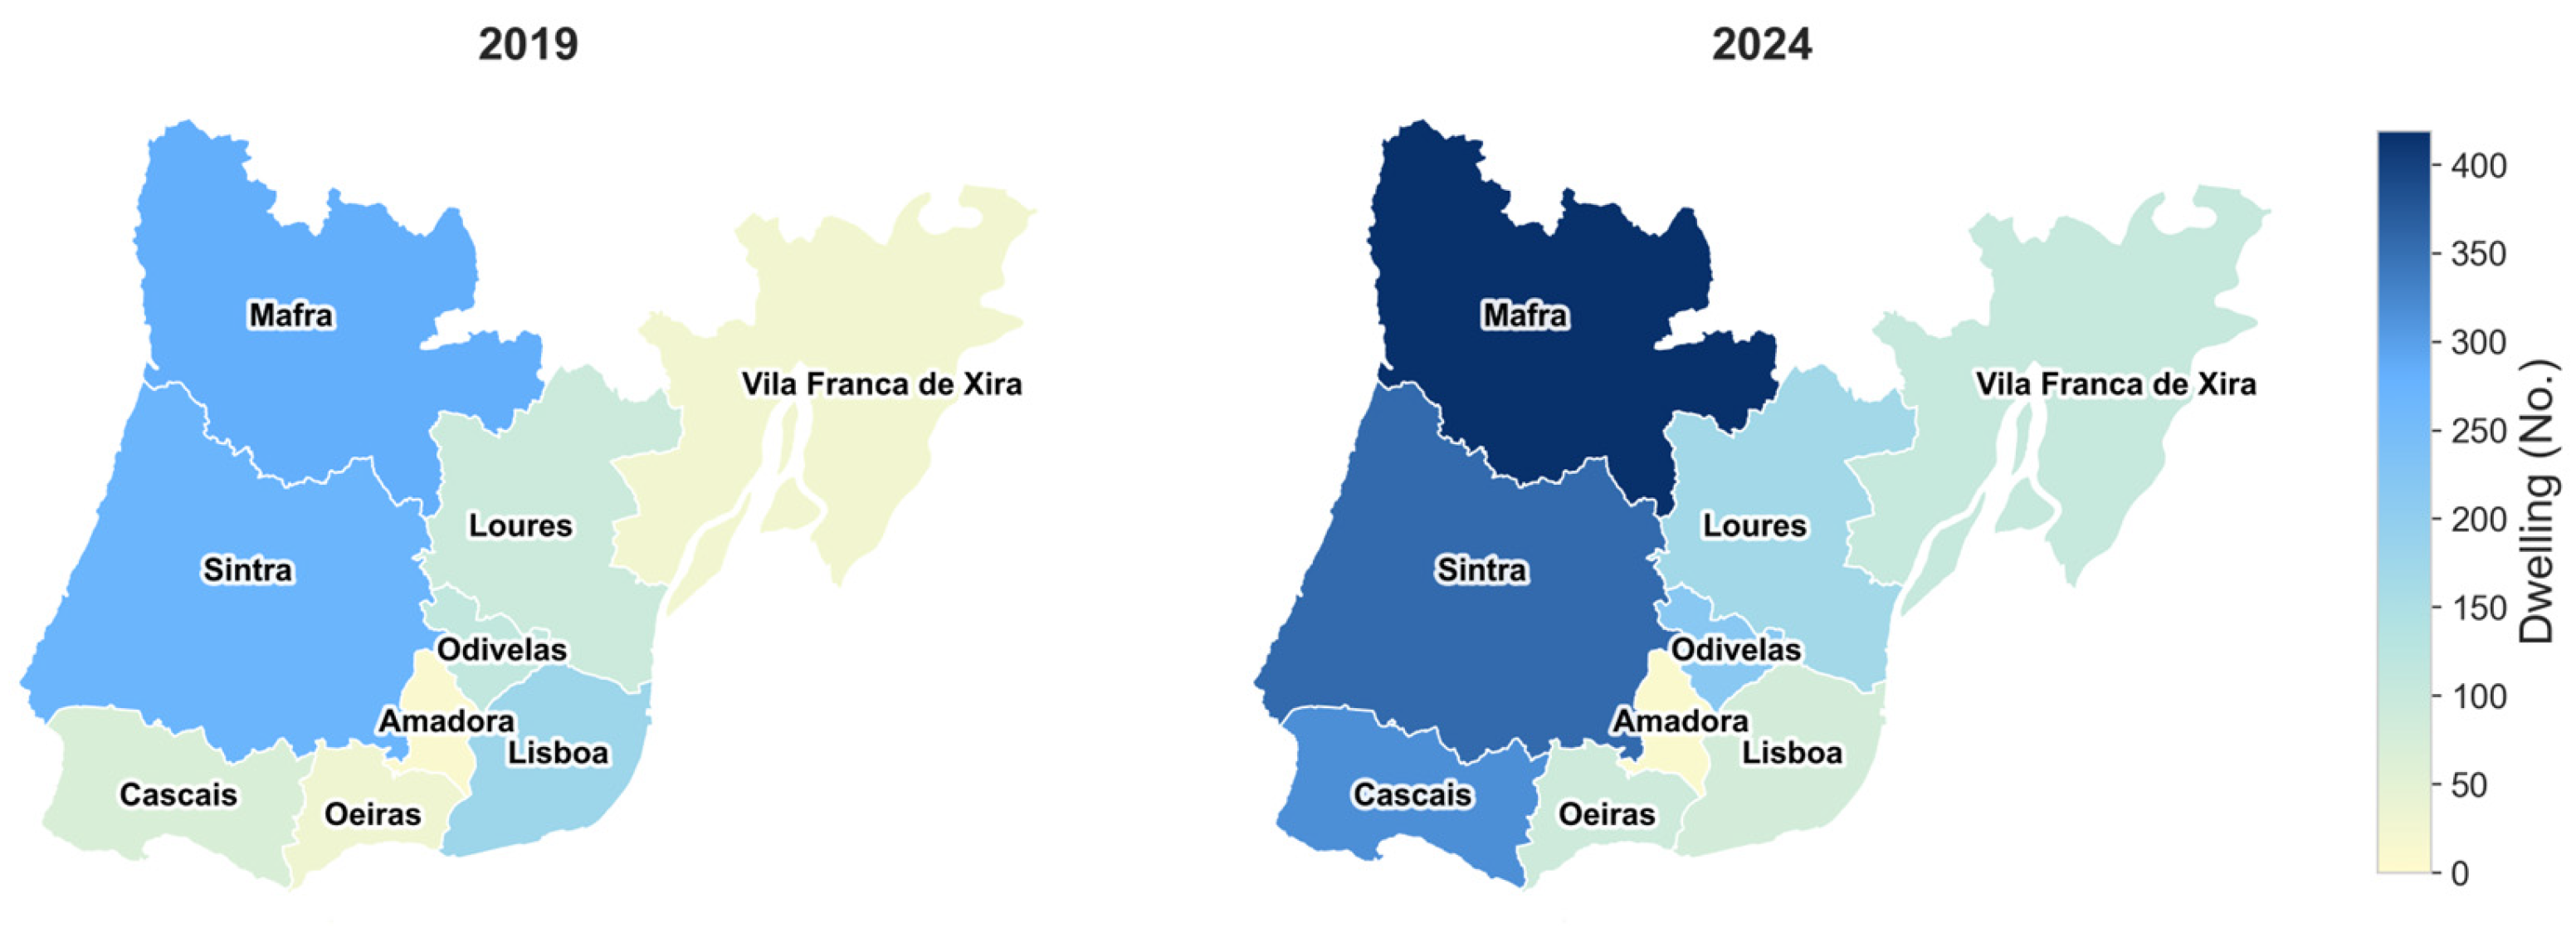
From an empirical perspective, the results reveal a structurally polarized housing market between 2015 and 2025. Housing valuations increased across all regions, yet at highly heterogeneous rates, reinforcing territorial inequalities rather than promoting convergence. Metropolitan and tourism-intensive regions—namely Grande Lisboa, Península de Setúbal, Algarve, and Região Autónoma da Madeira—experienced accelerated appreciation, while spatial spillover effects propagated housing pressure to adjacent territories. On the supply side, although completed dwellings continued to increase nationwide, year-over-year growth rates decelerated after 2021–2022, suggesting a weaker supply response to sustained demand pressures and growing demographic concentration.
From a methodological standpoint, the main contribution of this study is the design and implementation of a workflow, encompassing automated data ingestion from official statistical APIs, schema harmonization, spatial–temporal alignment, feature engineering, and visual analytics. This workflow follows a CRISP-DM-inspired process adapted to official public-sector data. This pipeline ensures adaptability and replicability, allowing the proposed framework to be used in other contexts and data sources.
One important methodological choice concerns data governance and the treatment of missing values. Rather than applying conventional imputation techniques, the framework explicitly preserves null observations when they reflect territorial realities, such as market inactivity or structural exclusion in low-liquidity regions. This decision avoids the artificial smoothing of spatial inequalities and aligns with best practices in small-area and territorial data analysis.
The feature engineering stage transforms raw administrative data into indicators that capture housing space availability, housing stock intensity, and typological diversity. These indicators enable multidimensional assessments of housing inequality that extend beyond price-based measures, capturing structural and spatial dimensions of housing adequacy. Their normalization allows consistent comparison across regions with heterogeneous population sizes, settlement patterns, and housing structures, reinforcing the robustness of cross-territorial analysis.
Visual analytics play an important role within this framework. Heatmaps, Pareto distributions, radar plots, and temporal growth visualizations are employed as exploratory and diagnostic instruments, supporting pattern recognition, anomaly detection, and the identification of non-linear dynamics in housing markets. This visual storytelling approach improves interpretability for decision-makers while preserving analytical depth, bridging the gap between advanced data processing and evidence-based urban governance.
Despite the contributions of this study, limitations should also be acknowledged. The reliance on aggregated data and the lack of granular household-level microdata prevented a direct causal analysis between socioeconomic characteristics and housing outcomes. Moreover, the limited availability and consistency of data at the municipal level restricted a more detailed spatial analysis, constraining the assessment of intra-regional disparities. Additional data gaps in specific NUTS II regions—most notably in the Algarve—further hindered a fully homogeneous territorial reading. These constraints constituted a major limitation of this study and ultimately led to a focus exclusively on the NUTS II of Mainland Portugal, as the available data for the Região Autónoma da Madeira and the Região Autónoma dos Açores were particularly scarce and fragmented. Additionally, the bank appraisal value indicator used as a proxy for the housing market prices, introduces a bias in the analyses. On one hand, it may under- or overestimate the real market value, depending on the region. On the other, as this indicator is an estimation made by banks, there may be a time gap between the actual market values and the estimations.
These limitations point to several directions for future research. One relevant extension would be the integration of additional data sources, such as administrative microdata, geospatial information, or alternative indicators such as affordability (price-to-income ratios and housing overburden rates) and short-term rentals, to better capture emerging forms of housing pressure. Future work could also expand the analytical framework to a comparative, cross-country setting, enabling systematic assessments of housing inequalities. In this respect, the reliance on harmonized official statistics offers a clear advantage for international replication. Finally, the framework could be further developed to support prospective and scenario-based analysis, linking housing indicators to demographic projections, policy interventions, or macroeconomic conditions.
This work constitutes the foundation for the development of an online interactive visual storytelling tool developed for PLANAPP to support policy monitoring and communication of housing inequalities to policymakers and other stakeholders.
In conclusion, this study shows that integrating BI pipelines, data science methodologies, and urban analytics techniques into the analysis of official housing statistics substantially improves the capacity to diagnose, monitor, and communicate housing inequalities. Although applied to a single country in this manuscript, the proposed framework is transferable across territorial contexts, offering a scalable template for data-driven housing observatories and public-sector analytics.
More broadly, this study shows that the joint analysis of valuation dynamics, housing stock, and construction trends can help identify economic, social, and spatial inequalities in housing in a systematic and scalable way. The use of official data sources and BI-oriented analytical pipelines creates the basis for a comparable monitoring architecture that may support housing observatories, territorial diagnostics, and evidence-based policy design across different institutional contexts.
Finally, the Portuguese patterns identified in this paper, namely, price polarization, territorial mismatch between pressure and supply, and stronger metropolitan concentration, should be interpreted as part of wider international housing trends rather than as an isolated national phenomenon. For that reason, the results are relevant to a global audience concerned with affordability pressures, uneven territorial development, and the need for more robust public-sector tools to monitor housing policy and inequality.