Abstract
The objective of this study is to analyze the current situation of out-of-home catering (OHC) in Germany concerning the use of regional organic food using a case study; we also aim to determine the potential and challenges that exist in increasing the proportion of regional organic food in OHC. The food purchasing data from three canteens of the company were analyzed concerning regionality, seasonality, and organic share. The companies’ employees were asked about their willingness to pay and their attitude towards regional organic food using an online questionnaire. A price comparison between organically and conventionally grown food was carried out with food wholesalers’ product price lists. The study confirms the potential to increase the share of regional organic food in OHC. With their private purchasing behavior, eating habits and willingness to pay a surcharge for organic quality in the company restaurants, the consumers confirm that they support an increase in the regional organic share. Regional organic food could be purchased from (organic) wholesalers. However, the study also shows that the cost of sourcing organic food is on average 50% higher than that of conventional food and that this price markup is the main reason for consumers not buying organic food.
1. Introduction
Human nutrition leads to highly relevant material flows on Earth. Along with these flows, substantial environmental and other sustainability impacts can be observed: worldwide agriculture for food production requires half of habitable land [1] and about 70% of all freshwater withdrawals [2], and it is responsible for 26% of all greenhouse gas emissions worldwide [3]. A change in the global food system is therefore necessary to reduce the negative environmental impact and resource consumption of the agricultural and food system.
The European Union is promoting the transition to a sustainable food system with the Farm to Fork Strategy as part of the European Green Deal [4]. At the national level in Germany, the Good Food for Germany Nutrition Strategy, which aims to make quality food accessible to every citizen, was passed [5]. The Federal Government has adopted the 2030 Organic Strategy, a national strategy to reach a 30% share of Organic Food and Farming by 2030. The strategy’s central objective is to increase the proportion of organic farmland from 11% (2022) to 30% by 2030 and to facilitate the expansion of organic food in out-of-home catering (OHC). The OHC sector consists not only of hotel and restaurant catering, but also of fast-food catering, event catering, and canteens at workplaces. Public OHC facilities are a promising and large sales market for additional organically grown food, so the share of organic food in these facilities should also increase to at least 30% by 2030. To support this, the strategy includes measures such as setting organic procurement targets, developing practical guidelines for kitchen staff, and funding training programs to facilitate the transition to organic menus in institutional settings [6].
The out-of-home catering sector is Germany’s second-largest sales channel for the food industry. In 2022, sales of EUR 6.5 billion were generated in work and training gastronomy alone [7]. At the same time, the average share of organic food in OHC facilities in Germany is estimated to reach a maximum of 1.3% [8]. In retail sales, in contrast, organic food accounts for 6.3% of retail sales in Germany, which makes it the leading national market for organic food in Europe [9]. Consequently, there is significant potential to increase the share of organic food in OHC facilities with leverage effects on the German food system due to its market volume. As approximately 82% of the sales volume of the OHC sector is accounted for by the workplace canteens, the efforts to increase the share of organic food in workplace canteens can be a transformative driver towards the transition to a sustainable food system [10].
Experiences from other European countries highlight the transformative potential of increasing the share of organic products within the OHC sector. In Denmark, the organic market share in OHC reached 13% in 2022, representing a substantial annual growth rate of 41%. Notably, workplace canteens accounted for approximately 20% of organic food sales in the foodservice segment, underscoring their relevance as strategic leverage points for promoting sustainable food systems [11]. Austria has set ambitious procurement targets for public catering facilities operated by federal institutions in its National Action Plan for Sustainable Procurement, aiming to implement a minimum organic share of 30% by 2025, while also striving, where feasible, to source 100% of food from regional origins [12].
The objective of this study is, therefore, to generate detailed insights into the current status of OHC in Germany concerning the use of regional organic food; we use a field case study and determine the potential and challenges that exist in increasing the proportion of regional organic food in OHC facilities.
The research questions to be answered are:
- To what extent are the quality criteria of regionality, seasonality, and organic farming taken into account when sourcing food in OHC?
- What attitudes and willingness to pay do guests of the OHC have towards regional organic food?
- What is the difference in purchase price between organic and conventional food in food wholesalers?
Research was carried out in collaboration with the company catering department of a large industrial company in southwest Germany. The food product purchasing data from three canteens of the company catering department from one year were assigned to food categories and analyzed with regard to regionality, seasonality, and the organic share. To cover the consumer level, the employees of this industrial company were asked about their willingness to pay and their attitude towards regional organic food using an online questionnaire. On the supply side level, a price comparison between organically and conventionally grown food was carried out with the help of food wholesalers’ product price lists. The results of the analyses were discussed and supplemented with representatives from across the food value chain to identify recommendations for further action.
2. State of Knowledge and Definitions
2.1. Consumer Attitudes
Since 2002, the German Federal Ministry of Food and Agriculture (BMEL) has commissioned an annual representative survey on the consumption of organic food, the Eco-Barometer. According to the latest publication, the Eco-Barometer 2022, the majority of respondents would like to continue buying organic food in future. The most important reasons given for consuming organic food were “animal welfare, food that is as natural as possible, regional origin and a healthy diet”. The willingness of respondents to pay a surcharge for an organic lunch in canteens and cafeterias varies: 6% stated that they would pay a surcharge of up to EUR 0.50 for lunch, 20% between EUR 0.50 and EUR 1.00, 19% between EUR 1.00 and EUR 1.50, 18% between EUR 1.50 and EUR 2.00, and 17% more than EUR 2.00. Moreover, 21% are not willing to pay a surcharge [13].
In its annual Nutrition Report, the BMEL asks consumers what is important to them regarding food and shopping. In the Nutrition Report from 2023, 59% of those surveyed stated that they look out for whether food carries an organic label when buying food for consumption at home. Regional origin is a decisive purchasing criterion, especially for eggs, fresh fruit and vegetables, bread and baked goods, and meat and sausage products, as well as milk and dairy products. When eating out, flavor is the decisive selection criterion, but origin, regionality, and seasonality also play an increasingly important role. Almost half of those surveyed already eat a flexitarian diet, while 8% are vegetarians and 2% are vegans [14].
In their study, Brümmer and Zander argue that a growing market share for organic food can only be achieved by reaching new groups of buyers. To address young adults (18–30 years), which, in their opinion, is the most promising group, they researched the attitudes of this target group using an online mixed-methods approach. The most important reasons for buying organic food for young adults are high animal welfare standards, health, freshness, and environmental protection. The main reasons against buying organic food are the high price and lack of trust. Young adults also favor regional products and, in some cases, prefer them to organic ones [15].
2.2. Regionality and Seasonality of Food
Regardless of its frequent use and growing popularity, no uniform definition of the terms “regional” or “regional food production” exists, so its definition proves to be difficult [16]. In the German food market, there are no binding criteria for the product and process quality of regional foods [17]. The most common definition of regional food found in literature refers to the geographical distance travelled by a food product, although the defined distance can vary significantly. Political borders, such as national borders, are used as a further possible definition [18].
According to Thiedig (1996), quoted from [19] a regional product can be categorized according to the geographical principle and the principle of the value chain. These two principles are defined in Table 1.

Table 1.
Regional products: differentiation possibilities.
Dorandt [20] defines regional food as “[…] products produced, processed, refined and possibly packaged, appropriately labelled and sold in the survey region.” According to this definition, value creation and the consumption of the product take place in the same region, which also includes the holistic perspective of economic, social and environmental policy [2]. The holistic perspective is also reflected in Fahrner’s definition. He defines a regional food as a food “whose production and processing can be geographically delimited by a defined region.” [21]. Sauter and Meyer [22] define “regional products as those whose origin can be geographically located—and recognised by consumers.” They go on to explain that, in the case of unprocessed foods (such as fresh fruit and vegetables), it is usually possible to trace whether the entire value chain of the food, from cultivation to the end consumer, lies within the defined region. With processed foods, it is often difficult to trace whether only the processing into the end product or also the cultivation of the preliminary products took place in the defined region. In the case of processed foods, it is often impossible to ensure that all ingredients are completely regionally sourced [22]. In terms of what the different definitions of regional food have in common, the geographical reference is always listed as a criterion [20]. Although various publications discuss the term seasonality, its definition remains difficult. Foster et al. [23], Macdiarmid [24], and Röös and Karlsson [25], all highlight the inconsistency in the definition, which depends on numerous factors, including context and intended use of the term. The definition of seasonality presented here combines several definitions: Fresh fruit and vegetables that are subject to seasonal variations are defined to be in season at different times of the year. These foods can be grown outdoors without additional energy and are then considered seasonally grown. The seasonality of each type of fruit or vegetable depends on the climatic conditions in the respective growing region [26,27].
The review of existing definitions of the terms regionality and seasonality highlights the absence of standardized, universally applicable definitions. This conceptual ambiguity complicates cross-study comparisons and limits policy transferability. At the same time, it presents an opportunity to define these concepts in context-specific and operationally precise ways, enhancing the robustness and reproducibility of findings. The current study contributes to this discourse by adopting operational definitions.
Food is considered to be regional if it bears the Baden-Württemberg quality label. Processed products with the Baden-Württemberg quality label generally contain 90% ingredients from Baden-Württemberg, according to the labelling criteria. In contrast, mono-products, i.e., foods that consist of only one ingredient, with this quality label are 100% originated from Baden-Württemberg [28]. Seasonality is defined according to the seasonal calendar of the Verbraucherzentrale: fresh fruits and vegetables are considered seasonally produced if their production has taken place outdoors or in protected cultivation where the plants are covered with foil or fleece. Production in a greenhouse (heated or not heated) or fruits and vegetables that are put into storage are not regarded as seasonally produced [29].
2.3. Organic and Conventional Food Production
Crop cultivation and livestock husbandry can be carried out either conventionally or according to organic standards. Since 1991, the European Union’s organic production regulation has set out how organic food must be produced, controlled, imported into Europe, and labelled [30]. The completely revised Regulation (EU) 2018/848 on organic production and the labelling of organic products came into force in January 2022 [31]. The guidelines of various organic farming associations such as Bioland, Naturland or Demeter go even further than those of the EU [32]. A food product can therefore be labelled “organic” if its production at least meets the requirements of the EU organic regulation. There is no single definition of conventional agriculture, so farming systems of varying intensity are included [32].
In this study, organic food is defined as food that, at minimum, meets the requirements of the EU organic food Regulation (EU) 2018/848.
2.4. Price Difference Between Organic and Conventionally Sourced Food
Organically grown food is, in most cases, more expensive than conventionally grown food, e.g., due to the lower area yields of organic systems. The price difference is particularly high for food of animal origin [33]. According to the market report of the German organic food industry published in 2023 by the Bund Ökologischer Lebensmittelwirtschaft e.V. (BÖLW), prices for organic food were significantly more stable than those for conventional food during 2023. The constant prices can be attributed to factors such as value chains that are more regionally oriented, long-term supplier contracts, and a resource-conserving circular economy that avoids the purchase of synthetic fertilizers and pesticides as much as possible and can therefore be less dependent on price fluctuations for such primary products [34].
3. Research Methods
The real-life example on the demand side is the company catering department of a large industrial company in south-west Germany with various locations. The individual locations each have one to three company restaurants, meaning that a total of 14 company restaurants are managed. In 2019, around 16,446 meals were sold per day in all 14 company restaurants combined.
3.1. Survey of the Attitudes and Willingness to Pay of Company Restaurant Guests
Employees of the industrial company were surveyed at three locations to determine the attitudes and willingness to pay for regional organic food of OHC guests. A quantitative study was conducted and a standardized procedure was used with an online questionnaire. The research meets ethical requirements and protects the welfare of the study participants. The field phase lasted for two weeks in spring 2023. At the beginning of this field phase, employees received an email to their company email address containing the link to the questionnaire. In addition, posters and displays with a QR code were put up at the entrances to the company restaurants. The questionnaire comprises three parts: part one deals with the private consumption of regional organic food and the reasons for and against buying it, part two addresses the utilization of company restaurants and the desire for a regional organic food offering, and part three deals with the willingness to pay for such food. To determine willingness to pay, the participants were presented with the dish “goulash” as a description, supplemented by a photo and the current price. Using the van Westendorp Price Sensitivity Meter (PSM) as a guide, two questions were asked to find out how much the participants are willing to pay for the same dish of 100% organic quality [35]. In the second part, a direct method was also used to openly ask participants how much more they are willing to pay for the individual components of a dish. In addition, socio-demographic data such as age, gender, level of education, and current pay grade are collected. The field phase was preceded by a pretest with a standard observation test and five cognitive pretest interviews.
After the field phase, the data collected were cleansed using Excel and SPSS Version 29.0 in the first step by removing all incomplete questionnaires from the dataset. In addition, “speeders” are removed, i.e., questionnaires with a short processing time of less than 6.02 min, whereby it must be assumed that the questions were at most read superficially by the participants and that answers were accordingly chosen at random [36]. The remaining data were checked for “errors” and “outliers”, i.e., characteristic values that are far removed from the rest of the distribution and would distort the arithmetic mean. Values identified as such are recorded as “missing values” and are therefore not included in the analysis [37].
Socio-demographic characteristics are categorized and analyzed descriptively, as shown in Table 2.

Table 2.
Categorization of socio-demographic characteristics.
3.2. Food Quantity Analysis of Company Restaurant Supply Chain
The food purchasing data for 2019 are provided for the three company restaurants of the industrial company under research. The data were provided based on calendar weeks with individual product names and quantities. Within the calendar year analyzed, a total of over 2100 different food products were used. The assumption was made that food products purchased were immediately used for food preparation, neglecting tentative storage processes. The reference year 2019 was chosen, as it provides the most up-to-date data without being influenced by the COVID-19 pandemic.
No information is provided on suppliers or the exact place of origin or cultivation of the food. If the label “BW” is attached to the name of the food product, the purchased product bears the Baden-Württemberg quality label. A food product was classified as originating from organic farming if the label “BIO” preceded the name listed. No additional research beyond the purchasing date list information was undertaken.
A product categorization system with 18 food categories as presented in Table 3 was applied to classify the purchasing data.

Table 3.
Food categories for the systematization of food purchasing data.
To analyze the food purchasing data, each food is assigned to a food category. The relative shares of the food categories in the total amount of food purchased and the food composition of the individual food categories are analyzed. An actual analysis of the share of regionality is carried out based on the information on the Baden-Württemberg quality label. The relative proportion of organic products in the total amount of food purchased in 2019 is determined and the proportion that was used seasonally is analyzed for the food categories “vegetables and salad” and “fruit”. Following the actual analysis, an estimation of the potential is made about the regionality share, taking seasonality into account.
3.3. Price Comparison of Food from the Organic and Conventional Cultivation of the Company Restaurant Supply Chain
To compare the prices and food availability of organically and conventionally grown food, the product range lists of a German wholesaler of conventional food and a southern German wholesaler of organically grown food are compared. The wholesaler with organically grown food has a product range list including prices for 2023 with over 8000 food products. For fresh fruit and vegetables and salad, the product range lists including prices are available for calendar weeks 6, 18, 30 and 42. A product range list including prices as of 13 November 2023, with over 55,000 food products, is provided by the wholesaler of conventionally grown food.
The price comparison is carried out for the five food categories that in sum account for 80% of the total amount of food consumed, which are frozen food, starch supplements, vegetables and salad, milk and dairy products, meat and meat products. From each of these five food categories, food products are selected that account for at least 5% of the total quantity of this category or at least 50% of the total mass. For each selected food product, an average price is calculated for organic and conventional origins. The average prices are derived from the prices per kilogram of food products stated in the product range price lists. To ensure the best possible comparability, foods with the same name and the same degree of processing are selected from both product range price lists wherever possible.
The prices in the conventional product range list are used as reference prices and the price markup for the (identical) products in organic quality is calculated as a percentage markup on the (conventional product) reference price. Once the price markups for the individual food products have been calculated, the average price markup is calculated for all food categories, weighted according to the number of food products within a food category. The average weighted price increase for 100% organic quality, with no changes in the menu, is calculated by weighting the price markups of the food categories according to the mass share of the total mass. The price increase for the 30% regional organic scenario is also calculated.
For fresh vegetables of organic quality, we conduct an analysis of regional availability, taking seasonality into account.
3.4. Discussion Rounds with Practitioners
The discussion and verification of the results and findings from the literature research, survey, food quantity analysis, and price comparison takes place in the form of discussion rounds. These are attended by representatives from the entire food value chain. The participants include representatives of an organic farming association, a southern German organic wholesaler, a southern German dairy company, representatives of the Badischer Landwirtschaftlicher Hauptverband e.V. (regional agriculture and forestry umbrella organization) and representatives of a large southern German catering company. A total of three discussion rounds are held in an online format in 2023 and early 2024. In each discussion round, an update of the latest results and findings is given by the research team. The participants are then asked to evaluate the results from their practical viewpoint and supplement the presented results.
4. Canteen User Survey
Of the 8629 employees at the three participating locations, 5764 opened the link or the QR code. In total, 2273 people answered all questions, which corresponds to a completion rate of 39.43%. Only the data from the fully completed questionnaires are taken into account for the analysis.
The data from 2057 participants at the three locations were analyzed. Of these, 69.2% were male and 28% female respondents. 2.8% were diverse or did not wish to specify their gender. The average age was 44.62 years and the age range was between 18 and 65 years. In terms of educational qualifications, 3.2% of respondents belong to the “low education” category, 13.3% to the “medium education” category and, at 78.5%, more than three-quarters of respondents are categorized as “highly educated”. Additionally, 5% did not wish to provide any information or selected the option “other”.
4.1. Personal Attitudes of the Interviewees
The question “Which of the following types of diet best describes your diet?” (with a single choice) results in the distribution shown in Table 4.

Table 4.
Nutritional behavior of the participants according to socio-demographic data.
In total, 36.2% of employees state that they are trying to reduce their meat consumption and 8.1% have a vegetarian or vegan diet. Among men, the proportion of vegetarians is 5.2%, while it is 9.2% among women. The proportion of vegetarians decreases with increasing age: while the share among young adults is 13.6%, the share among middle-aged participants is only 6.1%. Among older participants, the share is 4.4%.
4.2. Profiles of Company Restaurant Guests
The participants answered the question “How important are the following criteria to you when choosing a dish in your company restaurant?” as shown in Figure 1.
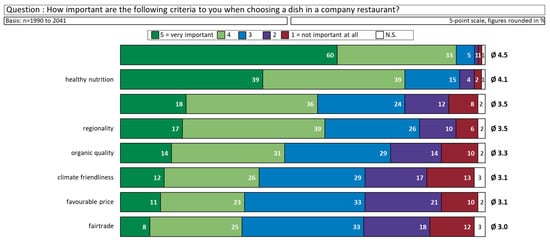
Figure 1.
Criteria for selecting a dish in a company restaurant (percentage share of answering categories).
The decisive factor in choosing a dish in the company restaurant is primarily flavor. It achieved an average score of 4.5 on the five-point scale, followed by the criterion of healthy eating with a score of 4.1. Regionality and organic quality are in the middle places with average scores of 3.5 and 3.3, respectively.
The question “Would you prefer dishes in your company restaurant that are prepared entirely or partly with regional organic food?” was answered by 39% with “yes, in general”, 52.5% with “it depends on the price”, and only 8.5% with “no”. Among women, 46.9% answered “yes, generally”, while only 36.3% of men answered “no” (Table 4). Furthermore, the proportion of those answering “yes, in general” increases with age. While the proportion among “young adults” is 27.7%, it rises to 44.4% among “older adults”. The same effect can be observed for income. While the proportion in the “lower wage group” is 34.5%, it rises to 49.2% in the “high wage group”.
Regarding willingness to pay, Figure 2 gives the results for two questions.
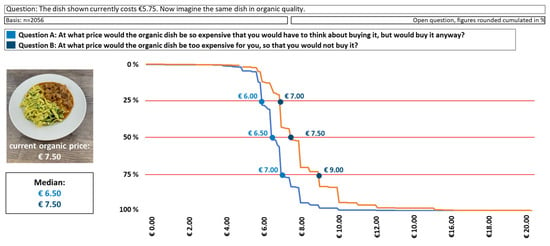
Figure 2.
Willingness to pay for dishes made from organic food.
When asked “At what price would the organic dish be so expensive that you would have to think about buying it, but would buy it anyway?”, 88.3% of respondents stated a value above the original EUR 5.75. They are therefore prepared to spend more money on an organic meal, even if only to a small extent. The amounts that these respondents are willing to pay range between EUR 5.76 and EUR 13.00, with the median being EUR 6.50 and the outlier-sensitive arithmetic mean value being EUR 6.76.
In response to the question “At what price would the organic dish be too expensive for you, so that you would not buy it?”, the median is EUR 7.50 and the arithmetic mean is EUR 7.91. The current retail price would be around EUR 7.50.
To prevent prices from rising too sharply for the customers of the company restaurants, there are two possibilities, which are assessed using an example. In response to the question “One way to offer organic dishes at a lower price would be to reduce the amount of meat in the dish. How would you like that?”, 68.2% of respondents answered “yes, I would like that”. Moreover, 23.7% said “No, the amount of meat in the dish should not be reduced” and 8.1% did not express an opinion on this matter.
The answers to the second question (“Another option would be not to produce the entire dish in organic quality, but to offer only individual components in organic quality. How much more would you be prepared to pay depending on the component?”), which was answered openly, are given in Table 5.

Table 5.
Willingness to pay for individual components of organic quality.
5. Food Consumption Analysis
5.1. Status Quo
5.1.1. Total Consumption Quantity
The allocation of more than 2100 different food products to the 18 food categories results in the following distribution: the frozen food category accounts for the largest share of the total food mass at 26%, followed by starch side-dishes (19%), vegetables and salad (16%), milk and dairy products (10%), and meat and meat products (9%). In total, these five food categories account for 80% of the total food mass (cf. Figure 3).
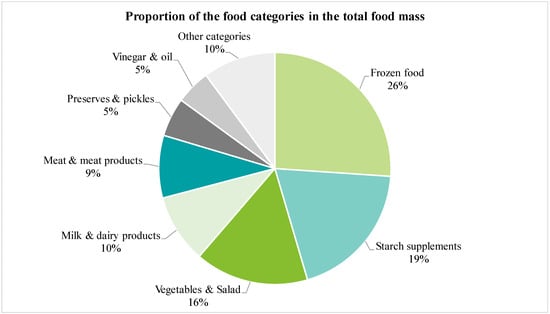
Figure 3.
Proportion of the food categories in the total food mass (weight percentage).
Over 30% of the frozen food sourced is from the vegetables and salad category. Foods from the starch side-dishes category account for 26% and meat and meat products 16%. The proportion of frozen goods per food category varies between 96% for baked goods and zero per cent for food categories in which no food is purchased as frozen goods (cf. Figure 4).
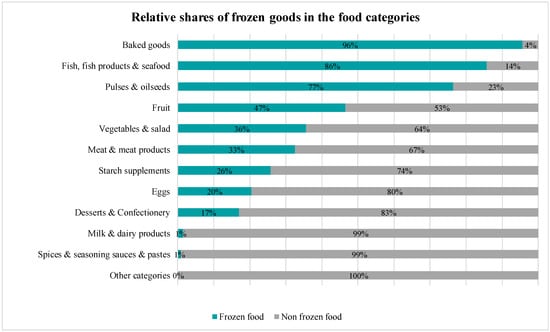
Figure 4.
Relative shares of frozen goods in the food categories (weight percentage).
5.1.2. Organic Food Use
The proportion of food labelled as “organic” is 0.15% of the total food mass used based on the 2019 consumption data. Moreover, 74% of this organic food comes under the food category of plant-based alternatives and 15% under the food category of starch supplements (cf. Figure 5).
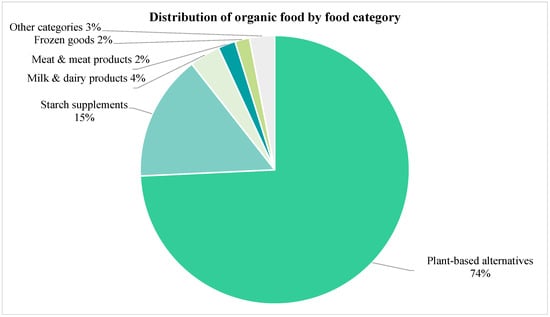
Figure 5.
Distribution of organic food by food category (weight percentage).
5.1.3. Regional Food Use
In total, 9% of the food consumed in 2019 is verifiably sourced from Baden-Württemberg, as it is labelled with the Baden-Württemberg quality mark [38]. These food products can be assigned to 12 different food categories. As Figure 6 shows, over 60% belong to starch supplements, while milk and dairy products account for 10%.
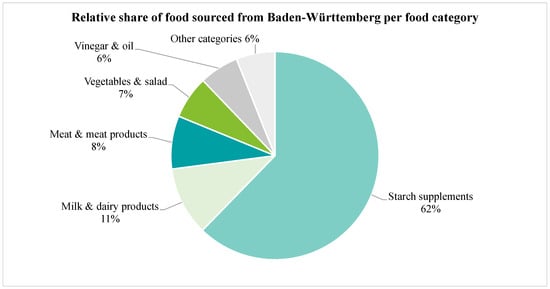
Figure 6.
Relative share of food sourced from Baden-Württemberg per food category (weight percentage).
The largest proportion of the total food mass within a food category that is verifiably sourced from Baden-Württemberg is from the food category of starch supplements at 30%. For eggs and vinegar and oil, 17% and 12% of the total mass of the food category is sourced from Baden-Württemberg, respectively; for milk and dairy products and baking ingredients, it is 10% each (cf. Figure 7).
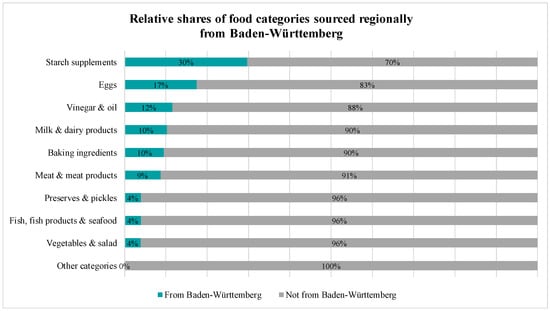
Figure 7.
Relative shares of food categories sourced regionally from Baden-Württemberg (weight percentage).
5.1.4. Seasonal Food Use
The proportion of fresh fruit and vegetables and salad currently used in line with the regional seasonal calendar can be evaluated by analyzing the food quantities consumed every month.
An example of the consumption of fresh tomatoes over the year is shown in Figure 8. Actual consumption values standardized to the arithmetic mean of monthly tomato consumption are shown here, i.e., bars above the x-axis represent months with higher-than-average monthly tomato consumption. The seasonal months of tomato production are highlighted in blue. The regional, protected cultivation of tomatoes is possible from June to September. In all other months, tomatoes are either grown regionally in slightly heated or heated greenhouses or imported from other regions, where they are grown without additional heating or with heating. Currently, only 36% of the total quantity of tomatoes used is grown seasonally.
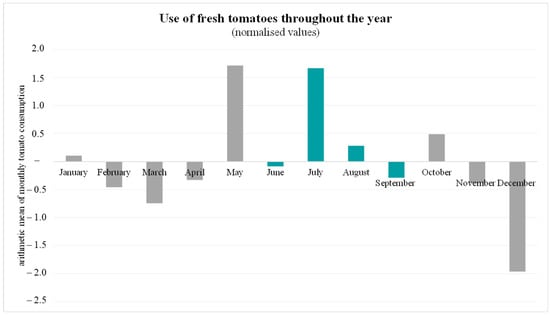
Figure 8.
Use of fresh tomatoes throughout the year.
Of the 90% of fresh vegetables and salad by mass, 50% is currently used seasonally. Salad, various types of cabbage, mushrooms, and leeks are used almost 100% seasonally. Peppers and eggplants cannot be grown regionally without additional heating and therefore cannot be sourced seasonally, according to the seasonality definition used here. The months in which the vegetables can be grown seasonally are shown in Table 6 and are marked with green bars.

Table 6.
Seasonal mass share used per vegetable type over the year.
One example of the use of fresh fruit is the apple, which accounts for almost 20% of the total mass share of fresh fruit. Fresh regionally grown apples can be purchased from August to November. In all other months, apples are either stored or imported from the southern hemisphere from spring onwards. The analysis in Figure 9 shows that the largest quantity of apples per month is currently used in February, March, and May. Only 25% of the apples consumed are currently used seasonally, and the lowest consumption values occur almost exclusively in the apple season.
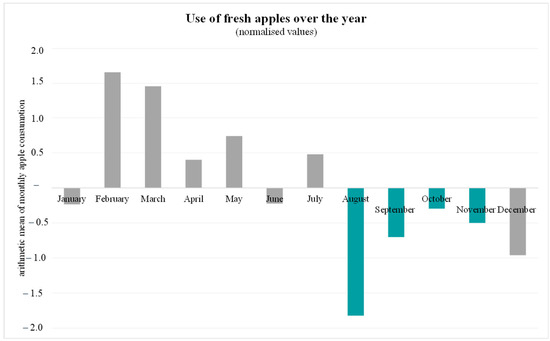
Figure 9.
Use of fresh apples over the year.
An analysis of fresh fruit varieties that can be grown regionally shows that 14% of 50% of fresh fruit by mass is currently used seasonally. The proportion of strawberries used seasonally is 95%. For all other types of fruit, however, the proportion used seasonally is less than 40%. Apples, as well as grapes, pears, and plums, are in season in the autumn months in the region, but they are currently also used at all other times of the year, meaning that the fluctuations in the quantity used over the year cannot be attributed to the seasonality of the fruit varieties. In Table 7, the green bars show the months in which the fruit varieties are considered to be grown seasonally in Baden-Württemberg.

Table 7.
Seasonal mass share used per fruit type over the year.
6. Price Differences Between Organic and Conventionally Sourced Food
The price comparison considers the five food categories that account for up 80% of the total mass, as shown in Figure 10.
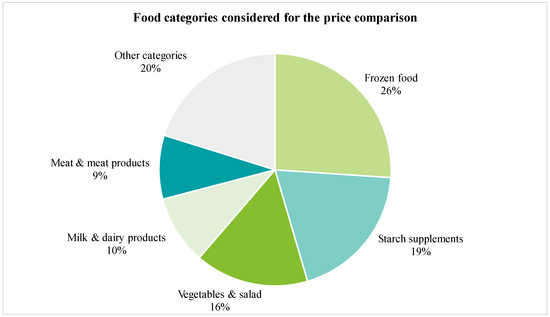
Figure 10.
Food categories considered for the price comparison.
From each of these five food categories, those food products are selected that account for at least 5% of the total mass of this food category or as many foods that at least 50% of the total mass of the food category are considered. For example, potatoes, pasta, spaetzle and rice are considered for the starchy side-dishes food category. These account for a total of 95% of the total mass of the food category. As not all individual foods containing potatoes can be included in the analysis, these food products are all summarized under the food name “potato”. All the different types of pasta used are summarized under the food name “pasta” (cf. Figure 11).

Figure 11.
Example food selection process for the food category of starchy side-dishes.
A similar procedure for assigning the individual food products used to superordinate food names is applied to the food products from the four other food categories. Figure 12 identifies for each food category the individual food products considered in the analysis.
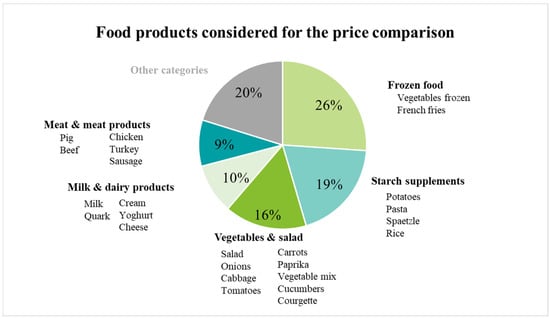
Figure 12.
Food products considered for the price comparison.
6.1. Calculation of Price Markup for Individual Food Products
In the next step, the markup is calculated for each of the food products listed. As an example, the calculation of the price markup for “French fries” and “frozen vegetables” is described below and illustrated in Figure 13. For “French fries”, the price per kilogram of fries is researched in both product range lists. A price of EUR 2.65 is given for one kilogram of organic fries. As the conventional product range list contains different variants of fries with different prices, two representative variants are selected and an arithmetic average price of EUR 2.20 is calculated. The price markup of conventional-quality fries compared to organic-quality fries is +EUR 0.45, or +21% (2023 data price base).
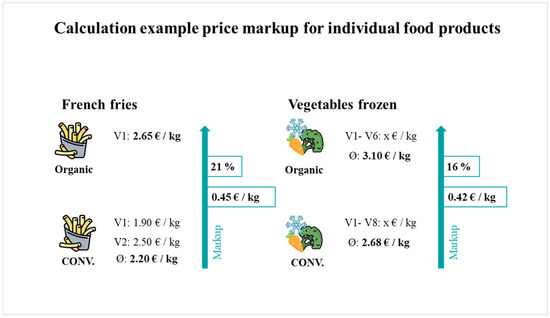
Figure 13.
Calculation example price markup for individual food products.
For “frozen vegetables”, six different variants are considered for an average price in organic quality of EUR 3.10, and an average price of EUR 2.68 is calculated from eight variants from the conventional product range list. The price markup amounts to +EUR 0.42 or +16%.
6.2. Calculation of the Average Price Markup per Food Category
An average price markup can be calculated for each food category using the price markups for the individual food products. To calculate the average markup, the sum of the markups of the food products is divided by the number of food products included in the food category.
In the frozen food category, for example, the foods “French fries” and “frozen vegetables” are taken into account. The sum of the price markups divided by the number of two results in an absolute price markup of +EUR 0.43 or a relative price markup of +18% per kilogram of frozen food (cf. Figure 14).
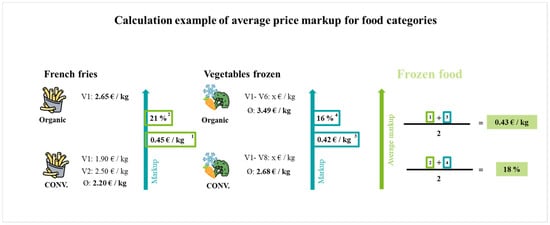
Figure 14.
Calculation example of average price markup for food categories.
Figure 15 shows the average relative markup for all food categories. The markups vary between 18% for frozen food and 84% for meat and meat products. The arithmetic mean of the markups for all food categories is 48% based on 2023 wholesale price lists. Organic foods from the five food categories compared are, on average, almost twice as expensive as those from conventional farming.
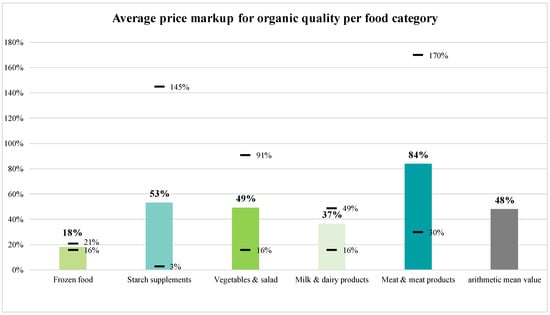
Figure 15.
Average price markup for organic quality per food category (black markings represent the minimum and maximum markups of individual food products within the food category).
The fluctuation range of the markups is shown in Figure 15 using black horizontal lines for each food category, representing the respective minimum and maximum markups. In the vegetables and salad food category, the markup varies between 16% (courgettes) and 91% (onions). The average markup of 53% for starchy side-dishes is because the markup for potatoes is 145%, while the markup for pasta is only 3%. Markups ranging from 30% (pork) to 170% (turkey) between products of organic and conventional origins result in an average markup of 84% in the meat and meat products food category.
6.3. Calculation of Average Weighted Price Markup for 100% Organic Share
To calculate the price markup per kilogram of food, if 100% of the food used were to be sourced in organic quality, in the first step, a weighted markup is determined for each of the five food categories:
The frozen food category is made up of 16% “French fries” and 40% “frozen vegetables”. The simplifying assumption made was that the sum of these two food products of 56% corresponds to 100% of the mass of the food category. To calculate the weighted price markup, the absolute price markup for one kilogram of “French fries” of EUR 0.45 is multiplied by the mass share of 16% and added to the product of the absolute price markup for “frozen vegetables” of EUR 0.42 and its mass share of 40%. This sum is divided by the total mass percentage of 56%. The weighted markup for frozen food shown in Figure 16 amounts to EUR 0.43 or 17% per kilogram of food.
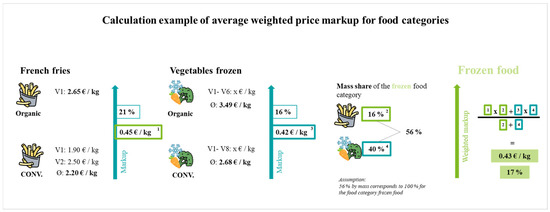
Figure 16.
Calculation example of the average weighted price markup for food categories.
Figure 17 shows the average weighted price markups for the food categories, which vary between 17% for a kilogram of food from the frozen food category and 90% for a kilogram of food from the starchy side-dishes food category. Based on an arithmetic mean, an organic share of 100%, i.e., switching exclusively to organic products without making any other changes to the menu, would lead to a price markup of 50%.
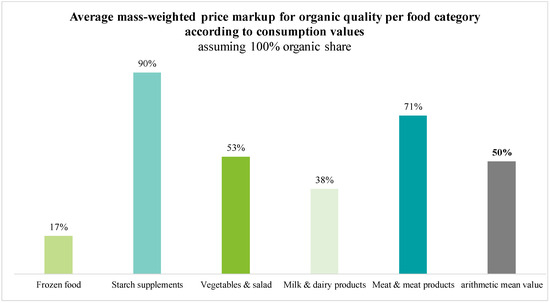
Figure 17.
Average mass-weighted price markup for organic quality per food category according to consumption values, assuming 100% organic share.
6.4. Price and Availability Analysis for Organic Vegetables
A detailed price and availability analysis of organic vegetables and salad is carried out. In Table 8, the dark green bars indicate when the top 10 foods in this food category are considered to be grown seasonally by mass percentage. In addition, it is indicated for each food for all four seasons whether there is a supply and, if so, where the food supply comes from: regional, Germany or other EU countries. The table shows that the availability of the analyzed food products of regional origin and organic quality is very good in the summer months. At this time of year, the selected foods are all in season and available in the region, which is why almost all food products can be grown without additional heating. Regional availability is also very good in late spring and early autumn. Some food products are available regionally all year round because they can be stored or are also in season in the region in winter.

Table 8.
Temporal (the upper half of the product row is green in case of seasonal availability) and spatial availability (the lower half of the product row indicates tentative origin) of the top 10 food products from the food category “vegetables and salad” in organic quality for the state of Baden-Wuerttemberg (CW = calendar week).
In the off season, fresh regional organic vegetables are more expensive than ones imported from other EU countries. This is because only small quantities of regional organic vegetables are available on the market at these times.
The price analysis for ready-cut vegetables shows that they are subject to smaller price fluctuations over the year than unprocessed vegetables. The lower price fluctuations can be explained by the high, constant processing costs and the rare price adjustments at the processing companies. The price difference between ready-cut vegetables and non-processed vegetables is, on average, around EUR 5 per kilogram of vegetables, as peeling and cooking losses and high processing costs are factored in for ready-cut vegetables.
7. Discussion Rounds with Practitioners
The results described in chapters 0, 0, and 0 were presented by the scientists during the three discussion rounds and received significant interest from the participants, who confirmed the relevance of these findings for practice. The results and the recommendations for practical action developed and discussed in these meetings can be considered valid due to the chosen method. In addition to the obstacles to increasing the proportion of regional organic products, which can be derived from the survey conducted, the food consumption volume analysis, and the price comparison, the participants also identified additional obstacles not directly derived from the research work. These are:
- The availability of regional organic food at the required convenience level is not guaranteed.
- The difficulty in increasing the regional organic share in OHC to initiate the conversion process.
- The problem with large OHC facilities is that orders must be placed with a supplier for a minimum order value for this supplier to be included as a supplier.
- Food waste measurements have only been carried out sporadically so far, and the potential for savings is not yet known.
- Organic food is not available in the required container size and the desired degree of processing, or it is not available in sufficient quantities for OHC.
- In addition to primary producers and consumers, processing companies (e.g., washing and cutting companies) and packers play an important role in the value chain and also in the switch to regional organic sourcing: “Our problem is not regional purchasing, but pre-processing!”
- The lead time of several weeks between meal planning and cooking is a fundamental obstacle to the use of seasonal products.
- The price of the dish is an important factor in deciding in favor of or against a dish in terms of organic quality. Possible additional parameters such as climate impact labelling, the modification of meat content, the labelling of regional products, and specific information campaigns should be systematically recorded and examined for their impact.
In addition to these obstacles, the participants also suggested various solutions. These proposed solutions have been included in the recommendations for action listed in Section 9.
8. Discussion
8.1. Discussion of the Survey of Attitudes and Willingness to Pay
The most important reason for respondents in this study to buy organic food is animal welfare, closely followed by the avoidance of pesticide residues, regional origin, fewer additives, a healthy diet, and food that is as natural as possible. These results are consistent with the data from the Eco-Barometer 2022 [13] and the Nutrition Report of 2023, where animal welfare also ranks second after taste in the criteria for food choice [14]. A recent survey examining the impact of organic and animal welfare labels on consumer choices confirmed that the likelihood of participants selecting a dish that contains meat increases when the two labels were displayed in the workplace canteen [39]. A cross-national survey of private households conducted by Góralska-Walczak et al. [40] found that the main motivations for adopting more sustainable dietary habits are increasing the consumption of seasonal fruits and vegetables, choosing locally produced foods, and reducing meat intake. In the study carried out by Brümmer and Zander [15], animal welfare was also at the top of the list. However, it is followed by reasons such as “being healthy” and “being fresh”. As these two scientists also note, the great importance of animal welfare is to some extent at odds with the preference for organic food. According to the respondents in this study, these food products include eggs, vegetables and fruit in particular. Meat follows in fourth place. Brümmer and Zander attribute this to the significantly higher price markups for meat, among other things. This assumption can be supported by the fact that both the study by Brümmer and Zander and this study concluded that the high prices for organic food are the most important reason for not buying organic food [15]. The study conducted by Góralska-Walczak et al. [40] also concludes that high prices, along with mistrust in certifications and insufficient availability, are the main barriers to purchasing organic food among private households. In terms of willingness to pay, the median price markup that respondents are willing to pay for goulash with organic ingredients is +EUR 0.75. If only individual components are of organic quality, the additional willingness to pay for meat and vegetables is +EUR 1.00 each and +EUR 0.50 for pasta. This result also partially overlaps with that of the Eco-Barometer, which found price markups of between +EUR 0.50 and more than +EUR 2.00 and the survey from Möstl et al. [39], which found that participants were willing to pay moderately higher prices. A study conducted in 2017 already indicated that 34% of the surveyed workplace canteen users were willing to pay an additional EUR 0.50 to EUR 1.00 per lunch meal to support improved food quality or sustainability standards [41]. Despite the higher price, 39% of employees state that they would generally like to see regional organic food in their company restaurant. While only 9% of the employees are against regional organic food in the company restaurant, the figure for the results of the Eco-Barometer is far higher at 31% [13]
8.2. Discussion of the Price Differences Between Organic and Conventionally Sourced Food
At 84%, the highest price markup for organic quality must be paid on average for food of the category “meat and meat products”. The results of this study are consistent with the findings of the AMI consumer price index survey, which found that food products with large differences in animal welfare have a higher price markup for organic quality [42]. It is not only German OHC facilities that have to pay a surplus for organic quality; in Switzerland, catering facility mangers stated that the price premium for organic quality is the most important barrier to buying it. The study found that, when the analyzed canteens in Zurich procure organic food, they primarily purchase dairy products, while organic fruits and vegetables are rarely included. This suggests that, despite higher costs, animal-based products are more likely to be sourced organically—likely due to their perceived importance among guests [43].
The fact that prices for organically grown food are more stable than prices for conventionally grown food, as presented in the market report of the German organic food industry 2023 [30], are neither confirmed nor contradicted in this study, as only the product range price lists for 2023 were analyzed.
The use of meat and meat products in the context of the increase in the regional organic share is reflected from different perspectives: on the one hand, the survey of the industrial company’s employees revealed that animal welfare is the most important reason for buying organic-quality food and, at the same time, that the willingness to pay a markup for organic quality is higher in the case of meat. On the other hand, the price comparison between conventionally and organically produced foods shows that the average price markup for organic quality in the meat and meat products category is 84% higher than for all other food categories. Another factor is that animal-based foods, and meat and meat products in particular, have a larger carbon footprint than plant-based food products. Animal-based food products also have a greater negative impact on other environmental impact categories, such as water consumption or land use, than plant-based food products [44].
9. Summary and Conclusions
To determine the extent to which the quality criteria of regionality, seasonality, and organic farming taken into account when sourcing food in OHC, we analyzed the food consumption for three company restaurants of an industrial company in south-west Germany from 2019. The analysis showed that the frozen food category accounts for the largest share of the total mass at 26%, followed by starchy side-dishes at 19%, and vegetables and salad at 16%. Currently, less than 10% of the food in demand by mass is labelled with the regionality seal “Schmeck den Süden”, meaning that it is sourced regionally within the borders of the state of Baden-Württemberg. The organic share of all food consumed in the company restaurants is less than one percent (by mass). An estimate of the potential shows that the proportion of regionality, taking into account seasonality, could be increased by 50% for fresh vegetables and 87% for fresh fruit.
We conducted a survey with the employees of the industrial company to determine the attitudes and willingness of guests of the OHC regarding regional organic food. The survey shows that the majority of the company restaurant guests would like a regional organic offering. However, this only applies on the condition that the prices remain within an affordable range. The acceptable markup if single components of a dish are sourced in organic quality lies between EUR 0.50 and EUR 1.00. On average, respondents are willing to pay 13% more for goulash made with organic ingredients, which amounts to EUR 6.50. The consumers’ main reasons for wanting organic food are animal welfare, closely followed by the avoidance of pesticide residues, regional origin, fewer additives, a healthy diet, and food that is as natural as possible. Eggs, vegetables, and fruit are particularly popular organic foods. Although people also like to buy organic meat, the particularly high price markup has a deterrent effect.
We analyzed the difference in purchase price between organic and conventional foods from food wholesalers by comparing the product range list of a conventional wholesaler and an organic wholesaler. The analysis shows that food from organic production is, on average, twice as expensive as conventionally produced food. If 100% of the food consumed were of organic quality, the price per kilogram of food would rise by 50%. If 30% of the total food mass were sourced regionally and organically, the price markup for the organically sourced food would reach 39%, as 10% out of the 30% would be potatoes, which have a price markup of 145%.
The analyses carried out as part of this study confirm that there is potential to increase the share of regional organic food in OHC. With their private purchasing behavior, their eating habits, and, most of all, their willingness to pay a surcharge for organic quality in the company restaurants, the consumers show that they support an increase in the regional organic share. Regional organic food could be purchased by OHC facilities from wholesalers and organic wholesalers. However, the study also shows that the cost of sourcing organic food products is, on average, 50% higher than that of sourcing conventional food products and that this price markup is the main reason for consumers not to buy organic food.
According to the analyses of this study, the political demand to achieve a regional organic share of 30% by 2030 is theoretically possible because consumers are open to an increase in the regional organic share, and agriculture and trade can provide the necessary goods. Even if some of the additional costs for organic food can be passed on to consumers, a variety of measures must be implemented by the OHC facilities to control the additional costs.
10. Recommendations
This section explains which recommendations for action can be used by OHC facilities to overcome the remaining obstacles to increasing the regional organic share. The aim of the recommendations is to provide decision makers in (OHC) facilities with guidance on potential starting points for action. The recommendations are intentionally kept general, as each OHC facility is at a different stage of development and faces unique challenges.
10.1. Identified Obstacles and Recommendations for Action
By analyzing the results of the survey on attitudes and willingness to pay for organic food, the analysis of food consumption quantity, the price comparison between food from organic and conventional production, and the discussions with practitioners, three main obstacles to the introduction of organic food in the OHC were identified:
- The higher cost of sales required for organic food compared to conventionally grown food.
- The reduced availability of organic food for the OHC.
- The need to initiate a process of change in the catering concept.
The obstacle of the higher cost of sales was identified, on the one hand, by comparing the prices of organically and conventionally grown food products. On the other hand, this obstacle was also confirmed in dialogue with practitioners and is the most frequently cited argument against the purchase of organic food in the survey.
10.1.1. Seasonality
When increasing the proportion of fresh fruit and vegetables of organic quality and regionally sourced, attention should be paid to their seasonal use. As seasonal cultivation does not involve any additional heating or long periods of storage, less energy is required per kilogram of food, which, in turn, has a positive effect on costs and climate impact.
Over the year, short-term fluctuations in the availability of fresh fruit and vegetables can occur due to weather conditions or changes in demand. If it is possible to react flexibly to seasonal fluctuations, fruit and vegetables can be purchased when availability is particularly high and the price is therefore lower. Soft claims such as “pasta with seasonal vegetables” can be used in the menu to provide flexibility in sourcing. Kitchen staff must be trained to use fruit and vegetables creatively and flexibly in food preparation.
10.1.2. Use of Meat
The absolute price difference for animal-based foods, and meat in particular, is higher than for other food categories. There are several ways to reduce the additional costs of using organic animal products: the mass of meat, fish or dairy products per portion can be reduced. Dishes with meat or fish can be replaced by vegetarian or vegan dishes. Meat or fish can be offered as an additional component to a vegetarian or vegan dish. As the number of flexitarians, vegetarians, and vegans in Germany is over 50% [14] and the conducted survey comes to a similar conclusion, it can be assumed that plant-based dishes are in demand. In addition to seasonality, flavor and health aspects should be the focus when choosing plant-based dishes.
10.1.3. Components
When increasing the proportion of regional organic food products, it makes sense to first switch to those food categories where the price difference between organic and conventional food is small and, second, to those food categories where guests are prepared to pay a higher price for regional organic quality. The survey carried out in this study shows that the absolute price markup is the lowest for the food categories of frozen food and dairy products. Within the food categories, the food products with the lowest price markup and high availability in organic quality should also be replaced first. Pasta, for example, should be replaced before rice. It is also advisable to switch to regional organic quality for animal products, as animal welfare is the most important reason for buying organic food [13]. It can therefore be assumed that guests are more willing to pay a higher price per dish if animal products are included.
A price difference between dishes with organic ingredients and conventional ingredients can be prevented by a mixed calculation. This involves a revenue transfer from conventional to organic ingredients and, if necessary, the price for all dishes can be increased. This strategy prevents dishes with organic ingredients from not being selected by guests due to their higher prices.
10.1.4. Food Waste
A long-term reduction in the amount of food waste has a positive effect on the environment but also on the cost of goods sold. By measuring production waste, overproduction and plate waste, the current situation can be assessed and long-term measures to reduce the amount of food waste can be determined [45]. The costs saved through the reduced use of goods can then be invested in regional organic food.
The reduced availability of organic food for OHC was confirmed by comparing the product range lists, as the organic wholesaler’s product range is less extensive. At the same time, practitioners confirmed that organic food is not available in the required container size and degree of processing, or it is available in insufficient quantities.
A sensible initial measure to increase the availability of goods involves communicating with stakeholders along the entire value chain, but also increasing commitment and flexibility in procurement and the use of food.
10.1.5. Suppliers
Contact with current suppliers should be sought early, as the planning stage of the transition towards more regional organic food begins. By actively asking suppliers about regional organic food, information can be obtained about the currently available range of organic products and a demand for regional organic food can be signaled. If the OHC facility has a large volume of demand because several thousand meals are prepared per day or several OHC facilities request regional organic food, the suppliers are motivated to adapt and expand their range accordingly.
In addition to current suppliers, contact with potential new suppliers can also be helpful when planning the changeover process. If they are wholesalers of organic food, they not only have a large range of organic goods but also the expertise and experience to increase the regional organic supply.
The availability of goods throughout the year can be requested by the wholesaler and then taken into account when planning the changeover process and, in particular, when planning menus. Particular care should be taken to ensure that the entire value chain is located within the area defined as regional for the largest possible share of organic food.
10.1.6. Value Chain
If a food product that could theoretically be grown and possibly processed regionally is not yet available in the desired quantity or to the desired degree of processing, new regional value chains need to be established. It is important to establish whether the required quantity of the food in demand can already be grown regionally and whether the downstream process steps, such as bundling, processing, and transport, need to be established or whether the value chain needs to be rebuilt starting with cultivation. In any case, concluding long-term contracts with producers and processors promotes stable supply relationships and often offers favorable purchasing conditions.
If it is not feasible for an OHC facility to set up its own value chains due to human resources, a lack of background knowledge, or the excessively large quantity required, cooperation with processing companies in the case of fresh fruit and vegetables or cooperation with organic wholesalers and organic growers’ associations can take place. In many cases, it may also be necessary to set up bundling structures.
10.1.7. Degree of Convenience
The degree of convenience of fresh fruit and vegetables used in OHC facilities is often high. The food consumption quantity analyzed in this study showed that 93% of the fresh vegetables used are purchased pre-processed and the proportion of frozen food in the total food volume is 26%. Accordingly, organically grown fruit and vegetables should also be processed in the region wherever possible. New value chains for processed fruit and vegetables can be established through direct dialogue between the OHC facilities and traders, producers, growers, and processors. In particular, OHC facilities should cooperate with fresh fruit and vegetable processing companies, as these often bundle goods from many producers. To be able to process organic food, the processing companies must be certified. The assurance of long-term cooperation with a processing company can motivate it to carry out this kind of certification and switch its production to organic food. The number of organic processing companies in Germany is growing [34], increasing the choice of potential cooperation partners for OHC facilities.
Increasing the proportion of organic food in an OHC facility goes hand in hand with a changeover process in the catering system. The inhibition threshold to initiate this process is high and many different stakeholders need to be involved and informed. This obstacle was identified in the dialogue with the practitioners, and the survey results also suggest this.
The process of changing over the catering system can be supported and facilitated by the following measures.
10.1.8. Communication
The success of any planned change depends largely on whether all affected and involved stakeholders are in favor of and support it. The common goal of increasing the proportion of regional organic food should therefore be communicated to all stakeholders in a way that is appropriate for the target group. In addition to internal communication with guests and employees, external communication is also highly important. The OHC facility can be a magnet for potential employees and act as a role model for other OHC facilities (“Do good and talk about it!”).
The price difference between organically and conventionally produced food is due to stricter guidelines for the cultivation of plant-based foods and the keeping of animals. The impact of this difference in the value chain of individual ingredients should be communicated to guests as transparently as possible. For example, pictures of the field where the potato used in the dish to make mashed potato was grown can be shown, or the distance to the place of cultivation can be illustrated. Such communication measures can promote an understanding of the price difference among diners and increase their willingness to pay.
10.1.9. Networking
There are individual facilities throughout Germany that have set themselves the goal of increasing their organic food share, so experiences could be exchanged between these OHC facilities regarding their development process. Networking can prevent the mistakes made by one OHC facility during the conversion process from being repeated by another.
Regional networks and exchange formats can be used to achieve networking along the entire value chain, with, e.g., research institutes and other relevant organizations and individuals. In Baden-Württemberg, for example, there are model regions that promote the development of organic value chains at the regional level. Round tables, which can be used for networking, are offered as part of many research projects that deal with the topic of establishing regional organic value chains. In research projects, there is also the opportunity to participate as a practice partner and thereby increase the regional organic share under scientific supervision.
10.1.10. Future Thinking
At the beginning of the changeover process, the current food consumption quantities should be analyzed. On the one hand, the analysis should focus on when in the year fresh fruit and vegetables are used and in what quantities, in order to make a statement regarding seasonal use. The degree of processing of fresh fruit and vegetables should also be analyzed. The origin of the food used should be requested from the supplier, if not available, so that the current regionality percentage can be determined. As animal-based foods play an important role in the conversion process, their use should also be analyzed in more detail. Potential for improvement and a strategy for increasing the regional organic share can be derived from this analysis of the current situation. The exact action plan and objectives should be developed in a team and in consultation with the relevant stakeholders to support them.
Subsidies for the development of regional value chains could help businesses along the entire value chain to switch to more regional organic food products.
Digitization approaches should be promoted—in particular, to create interfaces between merchandise management systems and regional product ranges.
Author Contributions
All authors contributed to the study’s conception and design. Material preparation, data collection, and analysis were performed by M.B. and S.S. The first draft of the manuscript was written by M.B. and all authors commented on previous versions of the manuscript. All authors have read and agreed to the published version of the manuscript.
Funding
This research was conducted as part of the Strategiedialog Landwirtschaft Baden-Württemberg and funded by the state government of Baden-Württemberg.
Institutional Review Board Statement
The research meets ethical requirements and protects the welfare of the study participants.
Informed Consent Statement
Respondents were informed of the purpose of the research and how the data collected would be processed. No sensitive data were collected.
Data Availability Statement
The datasets generated and/or analyzed in the current study are available from the corresponding author on reasonable request.
Acknowledgments
The authors would like to thank the company catering department of the large industrial company for providing food product purchasing data for one year and for the opportunity to interview its employees. Thanks are also due to the two wholesalers who provided product list prices for the food products they offered. The authors are thankful for the co-operation with Stroebele-Benschop within the Strategiedialog Landwirtschaft and her support with the elaboration of the questionnaire. Additionally, we appreciate the support of Wehner in the preparation of the questionnaire and the implementation and evaluation of the survey.
Conflicts of Interest
The authors declare no conflicts of interest.
References
- Ellis, E.C.; Klein Goldewijk, K.; Siebert, S.; Lightman, D.; Ramankutty, N. Anthropogenic transformation of the biomes, 1700 to 2000. Glob. Ecol. Biogeogr. 2010, 19, 589–606. [Google Scholar] [CrossRef]
- Food and Agriculture Organisation of the United Nations. Water for Sustainable Food and Agriculture: A Report Produced for the G20 Presidency of Germany; Food & Agriculture Org.: Rome, Italy, 2018; Available online: https://openknowledge.fao.org/items/41d13416-d012-47b2-9ea6-5731949b65c5 (accessed on 29 January 2024).
- Poore, J.; Nemecek, T. Reducing food’s environmental impacts through producers and consumers. Science 2018, 360, 987–992. [Google Scholar] [CrossRef] [PubMed]
- European Union. Farm to Fork Strategy. For a Fair, Healthy and Environmentally-Friendly Food System. 2020. Available online: https://food.ec.europa.eu/document/download/472acca8-7f7b-4171-98b0-ed76720d68d3_en?filename=f2f_action-plan_2020_strategy-info_en.pdf (accessed on 11 January 2024).
- Federal Ministry of Food and Agriculture (BMEL). Gutes Essen für Deutschland—Ernährungsstrategie der Bundesregierung. 2024. Available online: https://www.bmel.de/SharedDocs/Downloads/DE/_Ernaehrung/ernaehrungsstrategie-kabinett.pdf?__blob=publicationFile&v=7 (accessed on 13 February 2024).
- Federal Ministry of Food and Agriculture (BMEL). Extract from the 2030 Organic Strategy: National Strategy for 30% Organic Food and Farming by 2030. 2024. Available online: https://www.bmel.de/SharedDocs/Downloads/EN/Publications/2030-organic-strategy.pdf?__blob=publicationFile&v=8 (accessed on 5 February 2024).
- Bundesvereinigung der Deutschen Ernährungsindustrie e.V. BVE-Jahresbericht 2023. 2023. Available online: https://www.bve-online.de/presse/infothek/publikationen-jahresbericht/bve-jahresbericht-ernaehrungsindustrie-2023 (accessed on 15 February 2024).
- Gider, D.; Betzenbichler, E.; Böhm, M.; Keller, J.; Schmalen, C.; Haus, A.; Schaer, B.; Wirz, A.; Strobel-Unbehaun, T. Produktions-und Marktpotenzialerhebung und—Analyse für die Erzeugung, Verarbeitung und Vermarktung ökologischer Agrarerzeugnisse und Lebensmittel aus Baden-Württemberg. 2020. Available online: https://mlr.baden-wuerttemberg.de/fileadmin/redaktion/m-mlr/intern/dateien/PDFs/Landwirtschaft/Oekologischer-Landbau/EVA-BIOBW-2030_Endbericht.pdf (accessed on 14 February 2024).
- Willer, H.; Trávníček, J.; Schlatter, B. (Eds.) The World of Organic Agriculture. Statistics and Emerging Trends 2025; Research Institute of Organic Agriculture FiBL, Frick, and IFOAM—Organics International: Bonn, Germany, 2025; Available online: https://www.fibl.org/fileadmin/documents/shop/1797-organic-world-2025.pdf (accessed on 20 April 2025).
- Gvpraxis, Foodservice, & Allgemeine Hotel- und Gastronomie-Zeitung. Poster Außer-Haus-Markt 2024. Poster. 2024. Available online: https://www.dfv-fachbuch.de/Poster-Ausser-Haus-Markt-2024/AHMP2024 (accessed on 19 April 2025).
- Jørgensen, B.; Bossen, H.; Kallmeyer, V.; Laursen, M.G. (Eds.) Organic Market Report 2024; Organic Denmark: København, Denamrk, 2025; Available online: https://www.organicresearchcentre.com/news-events/news/organic-market-report-2024/ (accessed on 20 April 2025).
- Federal Ministry of Agriculture and Forestry, Climate and Environmental Protection, Regions and Water Management (BMLUK). (n.d.). Federal and Provincial Governments Switch to Regional Procurement. Available online: https://www.bmluk.gv.at/en/topics/food/federal-and-provincial-governments-switch-to-regional-procurement.html?utm_source=chatgpt.com (accessed on 19 April 2025).
- Federal Ministry of Food and Agriculture (BMEL). Öko-Barometer 2022 Umfrage zum Konsum von Bio-Lebensmitteln. 2023. Available online: https://www.oekolandbau.de/fileadmin/redaktion/dokumente/erzeuger/oeko-barometer-2022.pdf (accessed on 11 January 2024).
- Federal Ministry of Food and Agriculture (BMEL). Deutschland, wie Es Isst; Der BMEL-Ernährungsreport 2023. 2023. Available online: https://www.bmel.de/SharedDocs/Downloads/DE/Broschueren/ernaehrungsreport-2023.pdf?__blob=publicationFile&v=4 (accessed on 18 January 2024).
- Brümmer, N.; Klawitter, M.; Zander, K. Values, Attitudes and Preferences of Young Adults for Organic Farming and Its Products. 2020. Available online: https://orgprints.org/id/eprint/37784/1/37784-15OE001-vTI-zander-2019-JuBio.pdf (accessed on 30 December 2023).
- Deutscher Bundestag. Zum Begriff der Regionalität bei der Lebensmittelerzeugung. 2016. Available online: https://www.bundestag.de/resource/blob/421390/fbe9c9758380c056946fbc59edb3d77b/wd-5-022-16-pdf-data.pdf (accessed on 15 December 2023).
- Wiesmann, J.; Vogt, L.; Lorleberg, W.; Mergenthaler, M. Erfolgsfaktoren und Schwachstellen der Vermarktung regionaler Erzeugnisse. Forschungsberichte Fachbereichs Agrarwirtsch. Soest 2015, 35, 146. [Google Scholar] [CrossRef]
- Feldmann, C.; Hamm, U. Consumers’ perceptions and preferences for local food: A review. Food Qual. Prefer. 2015, 40, 152–164. [Google Scholar] [CrossRef]
- Gebhardt, B. Akzeptanz und Erfolg kleinräumiger Systeme der Lebensmittelversorgung im urbanen Umfeld am Beispiel Stuttgart: Empirische Untersuchungen von Verbrauchern und Unternehmen, Hohenheimer Agrarökonomische Arbeitsberichte, No. 22. Universität Hohenheim, Institut für Agrarpolitik und Landwirtschaftliche Marktlehre. 2012. Available online: https://www.econstor.eu/bitstream/10419/121802/1/haa-nr22.pdf (accessed on 15 January 2024).
- Dorandt, S. Analyse des Konsumenten-und Anbieterverhaltens am Beispiel von Regionalen Lebensmitteln: Empirische Studie zur Förderung des Konsumenten-Anbieter-Dialogs; Kovač: Hamburg, Gemrany, 2005. [Google Scholar]
- Fahrner, A. Potentialanalyse für die b2b-Vermarktung Regionaler Lebensmittel (mit Hilfe Ausgewählter Analyseinstrumente) im Wechselland. Ph.D. Thesis, Universität Wien, Wien, Austria, 2010. Available online: https://services.phaidra.univie.ac.at/api/object/o:1267274/get (accessed on 25 January 2024).
- Sauter, A.; Meyer, R. Potenziale zum Ausbau der Regionalen Nahrungsmittelversorgung: Endbericht zum TA-Projekt “Entwicklungstendenzen bei Nahrungsmittelangebot und -Nachfrage und ihre Folgen” (Arbeitsbericht Nr. 88). 2003. Available online: https://www.itas.kit.edu/pub/v/2003/same03a.pdf (accessed on 15 February 2024).
- Foster, C.; Guében, C.; Holmes, M.; Wiltshire, J.; Wynn, S. The environmental effects of seasonal food purchase: A raspberry case study. J. Clean. Prod. 2014, 73, 269–274. [Google Scholar] [CrossRef]
- Macdiarmid, J.I. Seasonality and dietary requirements: Will eating seasonal food contribute to health and environmental sustainability? Proc. Nutr. Soc. 2013, 73, 368–375. [Google Scholar] [CrossRef] [PubMed]
- Röös, E.; Karlsson, H. Effect of eating seasonal on the carbon footprint of Swedish vegetable consumption. J. Clean. Prod. 2013, 59, 63–72. [Google Scholar] [CrossRef]
- Freyer, B.; Dorninger, M. Bio-Landwirtschaft und Klimaschutz in Österreich: Aktuelle Leistungen und Zukünftige Potentiale der Ökologischen Landwirtschaft für den Klimaschutz in Österreich. 2008. Available online: https://www.edugroup.at/fileadmin/DAM/Gegenstandsportale/HLFS/Biologische_Landwirtschaft/Dateien/BIO_AUSTRIA_Klimastudie-2.pdf (accessed on 30 December 2023).
- Koerber, K.W.; von Männle, T.; Leitzmann, C.; von Weizsäcker, E.U.; de Haen, H.; Franz, W.; Becker, U. Vollwert-Ernährung: Konzeption einer Zeitgemäßen und Nachhaltigen Ernährung (11., Unveränd. Aufl. der 10. Vollst. Neu Bearb. und Erw. Aufl. von 2004); Karl F. Haug: Pfullendorf, Germany, 2012. [Google Scholar]
- MBW Marketinggesellschaft mbH. (o. D.b). Was Ist das Qualitätszeichen? Gemeinschaftsmarketing Baden-Württemberg. Available online: https://www.gemeinschaftsmarketing-bw.de/qualitaetszeichen-bw/was-ist-das-qualitaetszeichen/ (accessed on 11 December 2023).
- Verbraucherzentrale Nordrhein-Westfalen. Heimisches Obst und Gemüse: Wann Gibt es Was? 2022. Available online: https://www.verbraucherzentrale.de/sites/default/files/2023-01/vz-saisonkalender.pdf (accessed on 2 February 2024).
- Bund Ökologische Lebensmittelwirtschaft e.V. Branchen Report 2023 Ökologische Lebensmittelwirtschaft. 2023. Available online: https://www.boelw.de/fileadmin/user_upload/Dokumente/Zahlen_und_Fakten/Broschuere_2023/BOELW_Branchenreport2023.pdf (accessed on 11 January 2024).
- Regulation (EU) 2018/848 of the European Parliament and of the Council, Pub. L. No. L150/1. 2022. Available online: https://eur-lex.europa.eu/legal-content/EN/TXT/?uri=CELEX:32018R0848 (accessed on 11 February 2024).
- WBAE—Wissenschaftlicher Beirat für Agrarpolitik, Ernährung und gesundheitlichen Verbraucherschutz beim BMEL. Politik für Eine Nachhaltigere Ernährung: Eine Integrierte Ernährungspolitik Entwickeln und Faire Ernährungsumgebungen Gestalten. Berichte über Landwirtschaft-Zeitschrift für Agrarpolitik und Landwirtschaft. 2020. Available online: https://www.bmel.de/SharedDocs/Downloads/DE/_Ministerium/Beiraete/agrarpolitik/wbae-gutachten-nachhaltige-ernaehrung.pdf?__blob=publicationFile&v=3 (accessed on 15 February 2024).
- Janson, M. So Viel Teurer Sind Bio-Lebensmittel. Statista. 2021. Available online: https://de.statista.com/infografik/24615/preisaufschlaege-fuer-bio-lebensmittel-in-deutschland/ (accessed on 13 January 2024).
- Bund Ökologische Lebensmittelwirtschaft e.V. EU-Öko-Verordnung—Das Bio-Grundgesetz. 2024. Available online: https://www.boelw.de/themen/eu-oeko-verordnung/#:~:text=Seit%201991%20legt%20das%20Bio,vor%20Irref%C3%BChrung%20bei%20Bio%2DProdukten (accessed on 11 January 2024).
- Bremer, L. Drei Starke Methoden zur Erhebung von Zahlungsbereitschaften—Wie Sie die Optimale Methode für Ihre Fragestellung Finden. 2017. Available online: https://www.marktforschung.de/marktforschung/a/drei-starke-methoden-zur-erhebung-von-zahlungsbereitschaften-wie-sie-die-optimale-methode-fuer-ihre-fragestellung-finden/ (accessed on 10 December 2023).
- Theobald, A. Praxis Online-Marktforschung: Grundlagen—Anwendungsbereiche—Durchführung; Springer Gabler: Wiesbaden, Germany, 2017. [Google Scholar] [CrossRef]
- Völkl, K.; Korb, C. Deskriptive Statistik: Eine Einführung für Politikwissenschaftlerinnen und Politikwissenschaftler; Springer: Berlin/Heidelberg, Germany, 2018. [Google Scholar] [CrossRef]
- MBW Marketinggesellschaft mbH (o. D.a). “Schmeck den Süden. Baden-Württemberg”–Geprüfter Lieferant; Gemeinschaftsmarketing Baden-Württemberg: Stuttgart, Germany, 2023; Available online: https://www.gemeinschaftsmarketing-bw.de/gepruefter_lieferant (accessed on 11 December 2023).
- Möstl, A.; Janssen, M.; Zander, K. Consumer preferences for organic, animal welfare-friendly, and locally produced meat in workplace canteens: Results of a discrete choice experiment in Germany. Food Qual. Prefer. 2025, 127, 105463. [Google Scholar] [CrossRef]
- Góralska-Walczak, R.; Stefanovic, L.; Kopczyńska, K.; Kazimierczak, R.; Bügel, S.G.; Strassner, C.; Peronti, B.; Lafram, A.; El Bilali, H.; Średnicka-Tober, D. Entry Points, Barriers, and Drivers of Transformation Toward Sustainable Organic Food Systems in Five Case Territories in Europe and North Africa. Nutrients 2025, 17, 445. [Google Scholar] [CrossRef] [PubMed]
- handelsdaten.de (n.d.). “Wie viel Würden Sie pro Mittagessen für ein Biogericht Mehr Bezahlen?” Antworten der Befragten Deutschen Verbraucher im Jahr 2017. Available online: https://www.handelsdaten.de/reform-und-biomaerkte/zahlungsbereitschaft-fuer-bio-kantinengerichte-2017 (accessed on 18 April 2025).
- Ökolandbau.de. Preisaufschläge für Bio-Produkte. Ökolandbau.de. 2021. Available online: https://www.oekolandbau.de/handel/marketing/preis/preisaufschlaege-fuer-bioprodukte/ (accessed on 8 December 2023).
- Schleiffer, M.; Landert, J.; Moschitz, H. Assessing public organic food procurement: The case of Zurich (CH). Org. Agric. 2022, 12, 461–474. [Google Scholar] [CrossRef]
- Noleppa, S. Klimawandel auf dem Teller. Ernährung—Nahrungsmittelverluste—Klimawirksamkeit; WWF Deutschland: Berlin, Germany, 2012; Available online: https://www.wwf.de/static/content/e-learning/data/studie_klimawandel_auf_dem_teller.pdf (accessed on 20 December 2023).
- von Borstel, T.; Prenzel, G.K.; Welte, B. Food Waste 4.0 Zwischenbilanz 2020 Reduktionsziele Warenverlust Umweltkennzahlen. 2020. Available online: https://www.united-against-waste.de/downloads/united-against-waste-zwischenbilanz-2020-einzelseiten.pdf (accessed on 5 February 2024).
Disclaimer/Publisher’s Note: The statements, opinions and data contained in all publications are solely those of the individual author(s) and contributor(s) and not of MDPI and/or the editor(s). MDPI and/or the editor(s) disclaim responsibility for any injury to people or property resulting from any ideas, methods, instructions or products referred to in the content. |
© 2025 by the authors. Licensee MDPI, Basel, Switzerland. This article is an open access article distributed under the terms and conditions of the Creative Commons Attribution (CC BY) license (https://creativecommons.org/licenses/by/4.0/).