1. Introduction
Implementation of Internet of Things (IoT) technologies has become a cornerstone of Industry 4.0 [
1], aiding the integration of digital systems into manufacturing and industrial operations. By enabling seamless communication, real-time data analysis, and automation, the IoT transforms traditional industries into smart, interconnected ecosystems, thereby enhancing efficiency, productivity, and innovation [
2]. The adoption of low-power wide-area network (LPWAN) devices and wearable sensors is projected to exceed three billion by 2050, underscoring the rapid growth of the IoT across diverse sectors [
3].
Within this context, the IoT has demonstrated considerable potential across a range of applications. In smart agriculture, for example, the IoT enables the optimization of water use in greenhouse environments [
4]. In environmental monitoring, the IoT combined with unmanned aerial vehicle (UAV) systems has been used to detect and prevent illegal logging [
5]. Other impactful implementations include wildlife monitoring [
6], smart healthcare systems [
7], and intelligent transportation networks for improving urban mobility [
8].
Several wireless communication technologies support these applications, including ZigBee, Bluetooth, Sigfox, Wi-Fi, and Long Range (LoRa) [
9,
10,
11,
12,
13]. Among these, LoRaWAN has emerged as one of the most widely adopted LPWAN technologies due to its scalability, low power consumption, and extensive communication range. Its growing adoption is largely attributed to its effectiveness in wide-area IoT deployments, particularly in large-scale wireless sensor networks (WSNs). A comparative analysis of LoRaWAN, Sigfox, and NB-IoT is presented in [
12] and summarized in
Table 1.
A key advantage of LoRaWAN is its operation within unlicensed frequency bands, which reduces regulatory and financial barriers to deployment. This promotes innovation and supports a wide variety of IoT use cases. Due to its extensive communication range and ease of integration, LoRaWAN is particularly effective in scenarios requiring reliable connectivity in large geographic areas, such as rural and remote environments [
16]. In addition, LoRaWAN provides adequate bandwidth for non-real-time data transmission, such as image snippets used in rural surveillance and livestock monitoring [
17]. These attributes make it a strong candidate for low-power, wide-area multimedia sensing applications.
Despite widespread adoption of LoRaWAN, most academic and open-source monitoring tools remain uplink-centric and rely on manual offline post-processing. Current platforms rarely record downlink statistics, rarely offer integrated georeferencing, and lack any mechanism to automate parameter sweeps or real-time performance benchmarking. As a result, network engineers must rely on laborious field surveys, which prevent them from the continuous optimization and rapid fault diagnosis required by large-scale IoT deployments.
To close this gap, this work introduces and experimentally validates a layered architecture that automates real-time bidirectional performance analysis of LoRaWAN networks. The solution integrates (i) firmware with a dynamic scan scheduler, (ii) an MQTT-based acquisition pipeline, (iii) a cloud-resident MySQL engine for persistent storage, and (iv) a Grafana dashboard that georeferences every data point. This architecture is implemented in a custom software platform that captures key link-quality metrics such as RSSI, SNR, spreading factor, revived packets, bandwidth, and transmit power for both uplink and downlink traffic. The field trials conducted across urban, semi-urban, and rural areas of Loja (Ecuador) confirm interoperability, scalability, and responsiveness, while its automation capabilities markedly reduce the time, effort, and human error associated with conventional measurement campaigns.
Testbeds remain essential for validating LoRaWAN performance under diverse environmental conditions. They enable empirical assessment of system behavior, evaluation of protocol performance, and optimization of communication parameters prior to large-scale deployment. The proposed software addresses a key gap by automating a process that is often performed manually and analyzed offline [
16].
The experimental results were obtained in the Andean region of southern Ecuador. Given the heterogeneous and challenging environmental conditions of the region, the results are considered transferable to other areas with similar geographic and climatic characteristics [
18,
19].
The remainder of this article is structured as follows.
Section 2 reviews the related work and the motivation for this study.
Section 3 describes the architecture of the system and the experimental methodology.
Section 4 presents the key findings, followed by a critical discussion in
Section 5. Finally,
Section 6 concludes the article and outlines future research directions.
2. Related Work
Current knowledge about LoRaWAN performance is dispersed across three partially overlapping research strands, including a review of the literature, field trials centered on propagation, and testbed-oriented system work, each illuminating a different facet of the technology but leaving important practical gaps unaddressed. Alipio et al. [
20] present a complete and systematic survey, mapping more than 100 articles to seven dimensions of evaluation (range, delay, energy, capacity, geolocation, security, and reliability). The authors conclude that fewer than 20% of the surveyed works employ fully instrumented testbeds and that almost none provide bidirectional metrics or visual analytics in real time, an observation that directly motivated the architecture we propose.
A substantial body of work measures RSSI/SNR under specific environmental constraints: El Chall et al. [
16] ran indoor, urban, and rural tests in Lebanon using a single channel gateway, then compared the traces against six classical path loss formulas; they confirmed that no single model fitted all scenarios and recommended environment-adaptive link budgets. Ferreira et al. [
21] performed drive and walk tests on urban, suburban, and forest routes, producing one of the first side-by-side datasets that spanned markedly different land covers. They extracted path-loss exponents for each environment but relied on manual node reconfiguration and store-and-forward logging. Wu et al. [
22] introduced forest metrics, the leaf area index and trunk diameter, into a regression model that predicted RSSI in mixed forests. The campaign, repeated in four seasons, showed that the density of the foliage could increase the median loss by 8 dB in summer versus winter. Myagmardulam et al. [
23] studied a mountainous Japanese forest at 920 MHz; by correlating RSSI with the sky-view factor, they quantified the blocking effect of 23 m tall canopies and highlighted the limits of simple distance-only models. Xu et al. [
24] considered agriculture, fitting path loss curves for 433 MHz LoRa across two dense maize fields and demonstrating that raising the antenna from 1.5 to 3 m cut the median loss by 12 dB.
Collectively, these studies enrich the empirical database for link budget design, yet they are only uplink-based, manually scheduled, and lack real-time geospatial dashboards, as
Table 2 and
Table 3 document. At the opposite end of the spectrum, Faber et al. [
25] derived a closed-form BER expression that incorporated a LoRa code-rate, validated it with an AWGN testbed, and reported excellent agreement between theory and practice.
Table 2.
Comparative overview of LoRaWAN systems’ papers—methodologies and deployments (Part 1).
Table 2.
Comparative overview of LoRaWAN systems’ papers—methodologies and deployments (Part 1).
| Reference | Methodology | Evaluated Parameters | System Architecture | Deployment Context/Key Innovations | Key Gap Our Work Fills |
|---|
| [20] | Systematic literature review of LoRa/LoRaWAN test and evaluation methods (2018–2023) | Range, reliability, delay, energy, geolocation, capacity, RSSI, SNR | Meta-analysis of various network topologies and deployments | Identifies 7 test dimensions; organizes architectures and test strategies (testbed, simulation, modeling) | No empirical testbed; lacks real-time bidirectional metrics and geo-dashboard for large-scale deployments |
| [21] | Drive- and walk-test campaigns in urban, suburban, and forest routes | RSSI, path-loss exponent, coverage range across SFs | Single gateway + mobile node; GPS-tagged logs | First side-by-side dataset contrasting three environment types | Manual, uplink-only metrics, no automated SF/BW sweep, no live geo-dashboard capabilities |
Testbeds aimed at real deployments often pursue niche goals. Yousuf et al. [
26] assembled a standard gateway plus ten sensor nodes, reaching 4.4 km in an urban canyon and showing how payload size and SF affected PDR but without automated sweeps or downlink capture. Delgado-Ferro et al. [
27] prototyped a store-and-forward LoRa mesh for rescue teams. Their pilot project proved feasible in mountainous Spain, yet it focused on delay and energy, not on link-quality analytics. Impagliazzo et al. [
28] integrated LoRa gateways into a FIWARE microservice stack, allowing multi-tenant dashboards for smart-city pilots but leaving the radio layer opaque with no decoder and no RF metrics. Povalac et al. [
29] released the largest passive dataset so far: uplinks, downlinks, and Class B beacons from four European cities, and an open-source sniffer. However, the workflow remained offline and could not trigger immediate corrective actions.
Lack of bidirectional statistics: Downlink performance remains largely unmeasured.
Absence of geo-referenced real-time dashboards: Most datasets are analyzed hours or days later, hindering rapid fault localization.
Manual or single-shot parameter sweeps: Changing SF, bandwidth, or power still requires on-site intervention in nearly all field trials.
Our layered architecture closes all three gaps by streaming uplink and downlink metrics in real time, GPS-tagging every packet, running a firmware-controlled sweep scheduler, and exposing the results through an MQTT, MySQL, and Grafana pipeline. The platform turns laborious stop-and-go surveys into an interactive, continuous monitoring solution suitable for both research and production LoRaWAN networks, thereby providing the empirical backbone that current reviews and propagation studies have identified as missing.
Table 3.
Comparative overview of LoRaWAN systems’ papers—methodologies and deployments (Part 2).
Table 3.
Comparative overview of LoRaWAN systems’ papers—methodologies and deployments (Part 2).
| Reference | Methodology | Evaluated Parameters | System Architecture | Deployment Context/Key Innovations | Key Gap Our Work Fills |
|---|
| [16] | Field evaluation of radio propagation using different models | RSSI, SNR, delivery rate | Single-channel LoRa gateway + multiple mobile/static nodes | Outdoor urban and rural trials in Lebanon contribute realistic propagation parameters for LoRa planning | Does not incorporate automated architecture, no DL statistics or geo-dashboard |
| [25] | Closed-form BER derivation that incorporates LoRa code-rate; single-link field trials | BER, PER RSSI, SNR, and path loss | One end-device (GPS-tagged) ↔ one gateway; data forwarded via 3G to server | First analytic BER that includes code-rate; experimental validation across urban, suburban, and open zones | Link-level only; manual configuration, no automated SF/BW/Ptx sweeps; uplink centric and no real-time geo-dashboard |
| [30] | Two-stage modeling of indoor/outdoor signal propagation | RSSI vs. distance, attenuation, SF reliability | TTN-connected LoRa nodes over long-range links | Ukrainian university campus (multi-floor and open-air); validates indoor and outdoor propagation models | Campus-only coverage evaluation performed manually; lacks automated SF/BW/Ptx sweep, downlink statistics, |
| [23] | On-site 920 MHz measurements in hilly Japanese forest | RSSI vs. distance, SVF and path loss | Mountain ground station + vehicle-mounted transmitter; single link | Shows >23 m canopy blocking and positive RSSI–SVF correlation in real terrain | Manual, unidirectional; lacks config sweep, downlink stats and geo-dashboard addressed by our monitoring system |
| [29] | Real-world field measurements using mobile and static nodes | PDR, SNR, uptime, RSSI logs | Modular low-cost LoRaWAN testbed comprising end nodes, gateways, and a backend network server | Data from the LoRaWAN networks were collected in 4 cities: Liege (Belgium), Graz (Austria), Vienna (Austria), and Brno (Czechia) | Offline analysis; no dashboard; no automated scan |
| [28] | IoT testbed platform designed as a living lab for smart cities | IoT scalability, interoperability, security, visualization | Microservices-oriented design | Implemented in Cagliari, Italy, as part of the Cagliari Digital Lab (CDL) initiative | Generic IoT; no LoRaWAN-specific decoder |
| [22] | Empirical forest path-loss modelling; 4-season RSSI campaigns | Single GW + walking transmitter; star link only | Trunk diameter | First model fusing forestry metrics into LoRaWAN propagation equations | Link-level only; no gateway diversity, no bidirectional traffic, no automated sweep |
Table 4.
Comparative Overview of LoRaWAN System Papers—Methodologies and Deployments (Part 3).
Table 4.
Comparative Overview of LoRaWAN System Papers—Methodologies and Deployments (Part 3).
| Reference | Methodology | Evaluated Parameters | System Architecture | Deployment Context / Key Innovations | Key Gap Our Work Fills |
|---|
| [26] | Low-cost LoRaWAN testbed using off-the-shelf components and open-source software | PDR, SF, payload size, distance and line-of-sight conditions | Star topology, end devices communicate with gateways in a single-hop manner | Field test in mixed urban–suburban terrain, at University of Calgary | Does not include data-retry control, bidirectional link tracking, or coordinated probe sweeps |
| [27] | Field pilot tests in urban/rural/natural areas; chat + geolocation app for rescue teams | Coverage radius, message delay, PDR, energy profile | Portable gateway + star-topology end nodes; MQTT/REST backend | First LoRaWAN person-to-person chat for civil protection in Spanish mountains | No automated SF/BW/ sweep, no live bidirectional geo-dashboard, real-time monitoring |
| [24] | Field trials of 433 MHz LoRa in dense maize crops; antenna-height impact; regression models | RSSI, SNR, packet loss, path loss; Tx/Rx-height effect | Single GW; star WSN across two agricultural sites | First dedicated propagation study for maize fields | Static, one-GW, uplink-only tests; no automated sweep, no real-time bidirectional or geo-dashboard |
| This Work | Real-time testbed-based automation using mobile/fixed probes and bidirectional data collection | RSSI, SNR, SF, bandwidth, transmission power, retry attempts, GPS position, velocity | Star topology with end devices, LoRaWAN gateway (RAK7391), and server with MQTT, MySQL, Grafana | Field deployment in urban, suburban, and rural Ecuador; automation of parameter sweep for link monitoring; supports uplink/downlink in real time | Introduces real-time adaptive link analysis with GPS-tagged probes, bidirectional testing, and retry-loop visibility under mobility |
Table 2,
Table 3 and
Table 4 underscores three recurring gaps: (i) absence of bidirectional statistics, (ii) lack of georeferenced dashboards, and (iii) reliance on manual or delayed post-processing. Our layered architecture closes these gaps by streaming uplink + downlink metrics in real time, geotagging every packet, executing a firmware-controlled scan scheduler, and exposing the results through an MQTT/MySQL → Grafana pipeline. This combination transforms traditional field surveys into an interactive, continuous-monitoring solution that supports both research and production networks.
3. Materials and Methods
The software architecture developed for this study is based on a service-oriented architecture (SoA) model, which adheres to the four-layer structure commonly used in IoT systems [
31]. The automation architecture proposed for the LoRaWAN system, illustrated in
Figure 1, comprises three main components: the gateway, the end devices, and the server. This architecture is designed to support efficient, reliable, and scalable network operation through the seamless integration of hardware and software elements.
The automation system implementation incorporates various hardware components, including power supply modules, communication interfaces, and antennas. Each element contributes to maintaining the stability and overall performance of the system. A detailed description of the functional role of each hardware component is presented in the following subsections.
3.1. Components of the Architecture LoRaWAN
Server: The server consists of a computer running the Windows Server operating system, configured with a fixed IP address for MQTT and HTTPS communication. Its primary functions include database management, real-time data visualization, and secure communication handling. The server is equipped with an Intel Xeon E5640 processor (Intel Corporation, Santa Clara, CA, USA) processor (2.67 GHz), 6 GB of RAM, and 500 GB of storage. Transport Layer Security (TLS) certificates, generated using OpenSSL, version 1.1.1t (OpenSSL Software Foundation,
https://www.openssl.org/) for secure communications. are used to encrypt data transmissions and maintain network integrity.
Gateway: The gateway comprises several integrated components, including a processing unit (Raspberry pi), local storage, a geolocation antenna, and LoRa antennas. The RAK Wireless omnidirectional LoRa antennas (RAKwireless Technology Co., Ltd., Shenzhen, China) operate within the 901–928 MHz frequency band, with a gain of 5.1 dBi and vertical polarization, making them suitable for outdoor deployments.
The gateway receives data from the end devices and forwards them to the server for processing. It enforces network policies, manages access control, and preserves data integrity to ensure reliable communication. Acting as the first line of control, it handles large data volumes efficiently, filters incoming traffic, and routes messages. Connectivity is supported through Ethernet, WiFi, and LTE interfaces, all of which directly influence transmission speed and network resilience.
3.2. Service-Oriented Architecture (SoA) in the Proposed System
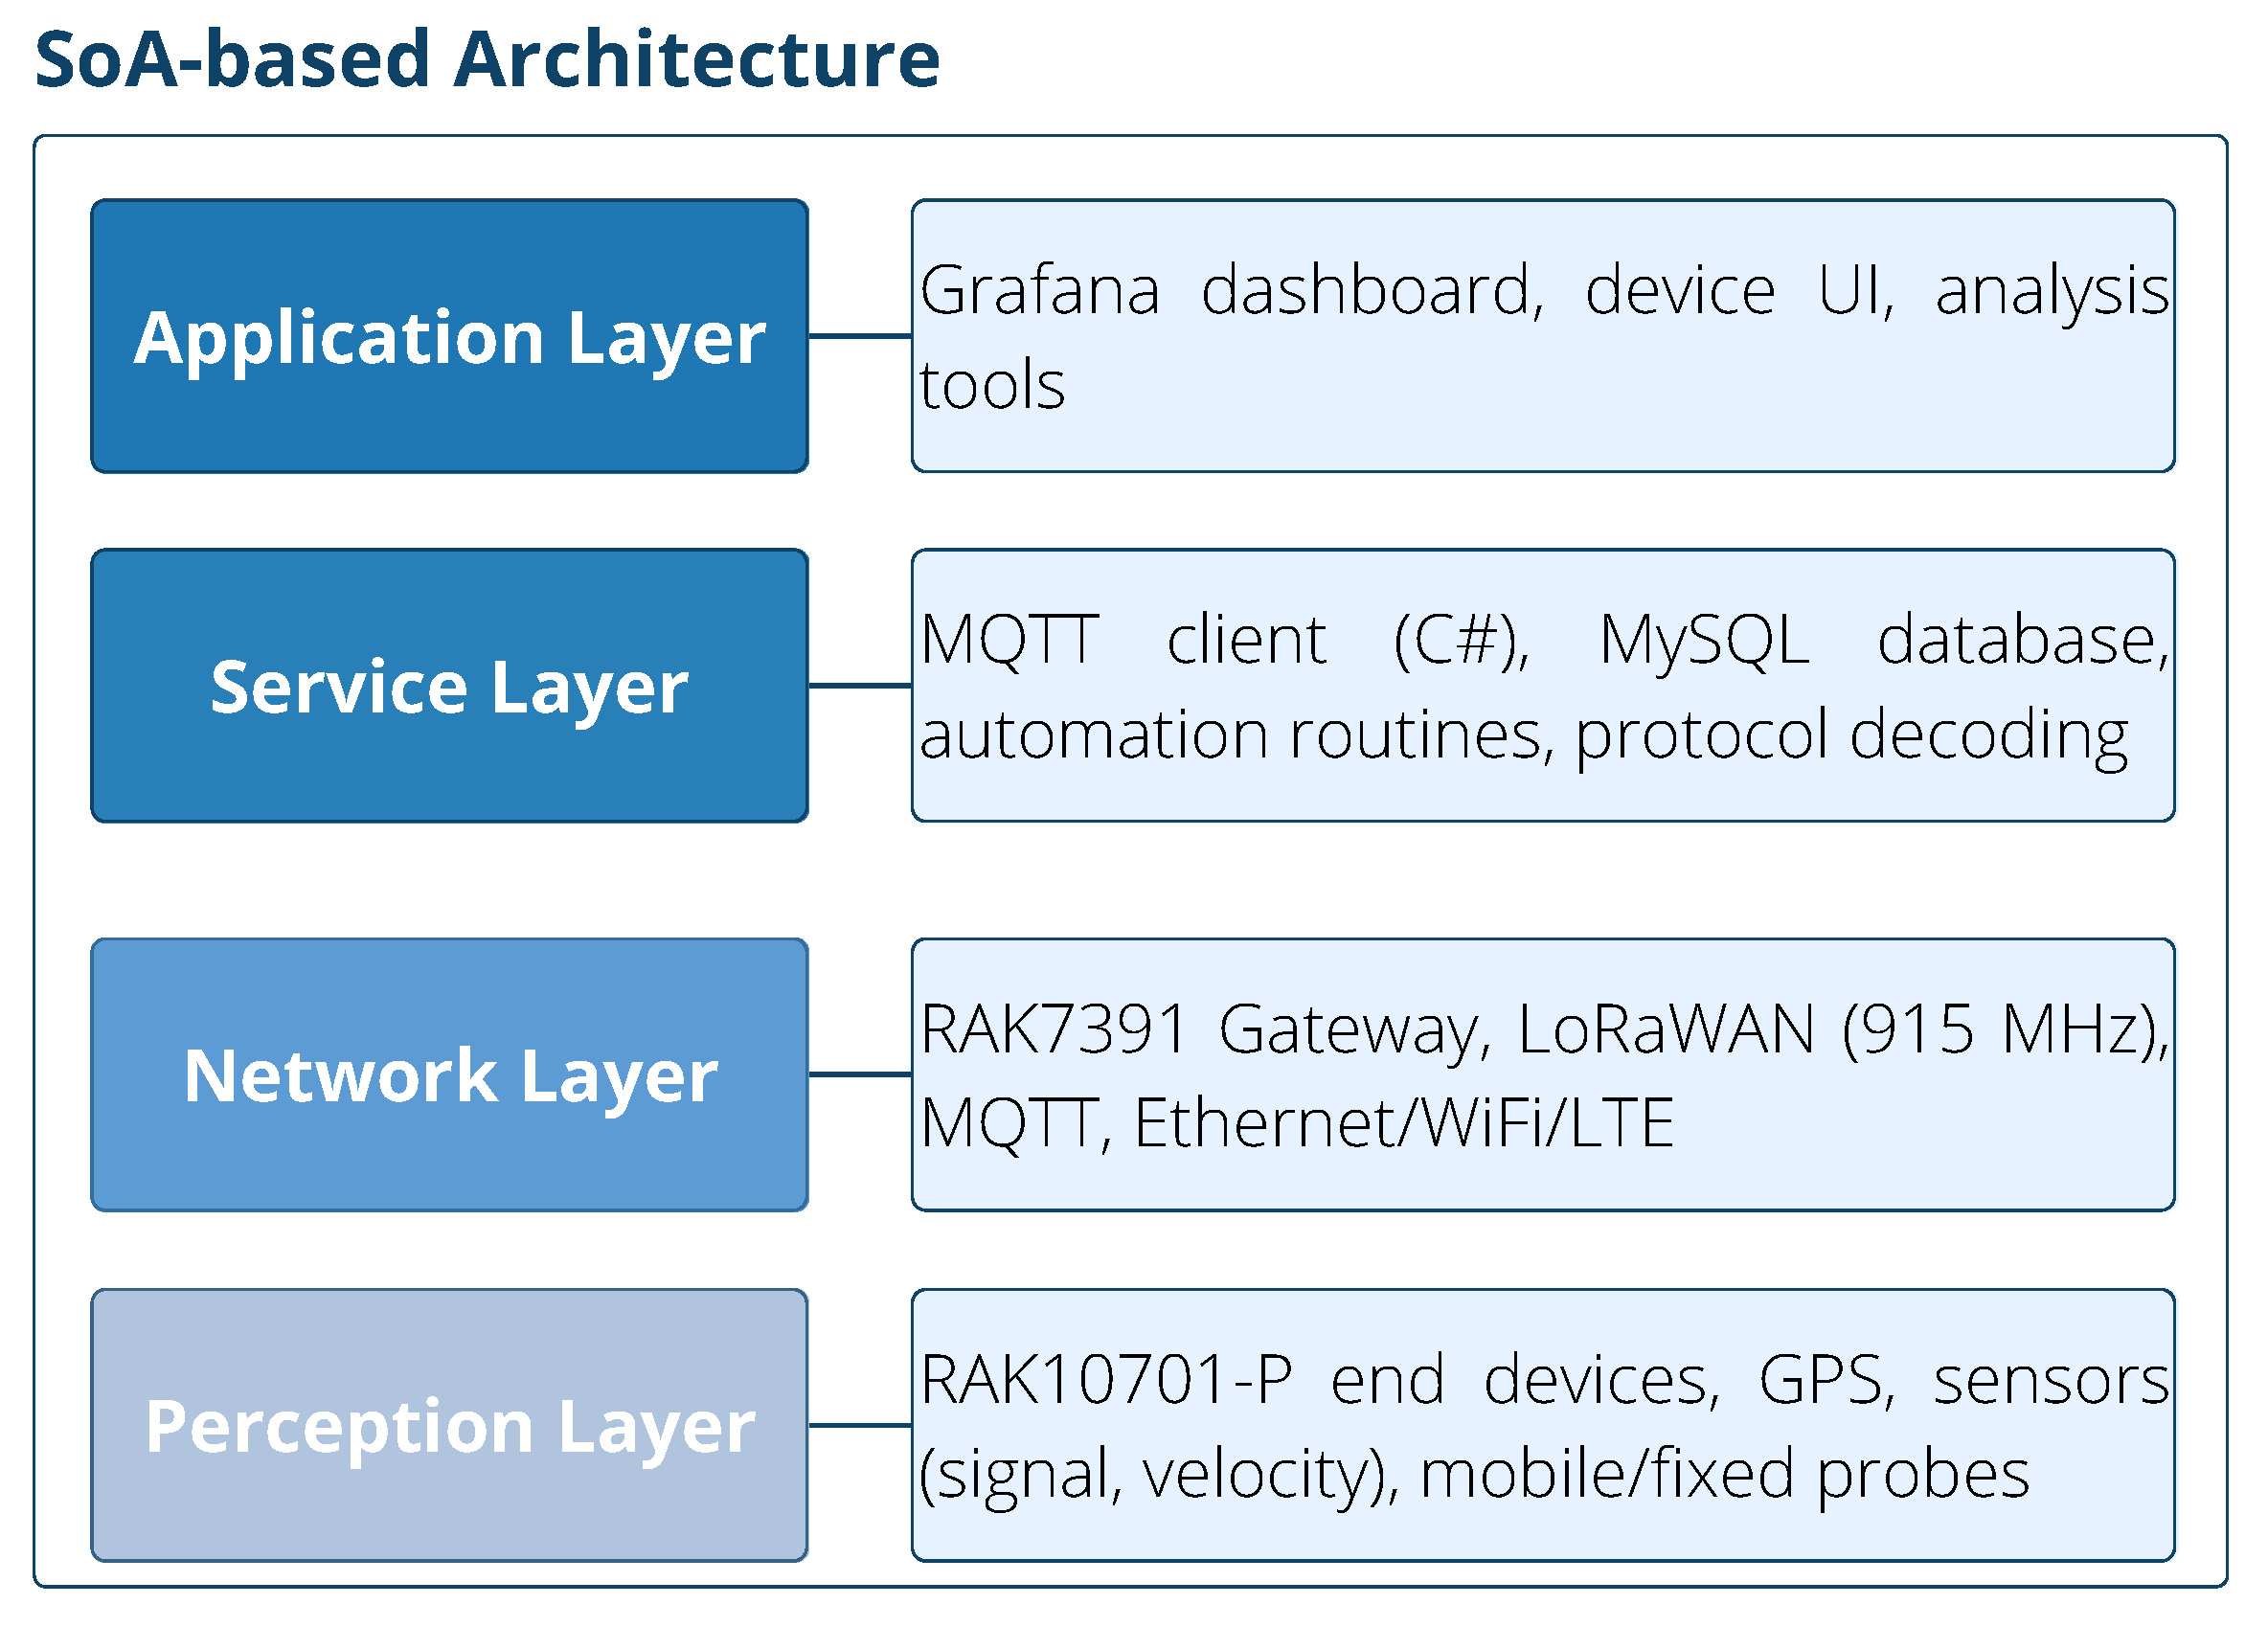
The proposed system is structured according to a four-layer service-oriented architecture (SoA) [
31], which is widely adopted in IoT systems to improve modularity, scalability, and functional separation. Each layer in the architecture corresponds to specific roles and is directly mapped to elements in the implemented platform.
At the base of the architecture, the Perception Layer comprises the RAK10701-P end devices. These devices are responsible for sensing and data acquisition. They measure key link-quality metrics such as RSSI, SNR, transmission power, and spreading factor. The devices can operate in both fixed and mobile modes, enabling adaptable testing in a variety of urban, semi-urban, and rural scenarios.
The Network Layer manages communication between the devices and the backend system. In this implementation, the RAK7391 LoRaWAN gateway—equipped with a Raspberry Pi CM4—performs this role. It supports multiple connectivity interfaces, including Ethernet, Wi-Fi, and LTE. LoRaWAN (operating in the 915 MHz band) is used for long-range communication, while the MQTT protocol facilitates real-time data transmission to the central server.
The system’s intelligence resides in the Service Layer, where automation and data processing are performed. A custom MQTT client, developed using C#, processes and decodes incoming data from the gateway. The system stores this information in a structured MySQL database. A key function implemented in this layer is the sweep mode, which allows the automated adjustment of transmission parameters such as data rate and power level. This mode enables the system to collect link performance data dynamically and efficiently.
At the top, the Application Layer provides user interaction and visualization capabilities. A Grafana-based dashboard presents real-time statistics including RSSI, SNR, transmission power, and GPS location. This layer enables users to analyze network conditions, assess coverage, and optimize deployment strategies through an intuitive interface.
In summary, the SoA-based architecture offers a robust and modular structure that supports real-time monitoring, automation of testing procedures, and effective visualization for LoRaWAN network performance analysis. It provides a scalable foundation for future enhancements and potential integration with cloud services or broader IoT ecosystems. In
Figure 2, the SoA architecture is described with the components of the LoRaWAN system.
3.3. Automatic Scanning Logic in LoRaWAN Terminal Device
This subsection describes the programming logic and control algorithm implemented in the terminal device firmware for automatic coverage scanning in a LoRaWAN network. It also outlines the decoding and processing strategy used by the server for these specific frames.
3.3.1. Device Firmware: Scanning Logic
Upon initialization or user interaction (e.g., button pressing), the terminal device activates an automatic scanning mode. This mode is responsible for evaluating the quality of network coverage by sending test packets under different transmission conditions.
The scanning algorithm performs the following steps:
Initializes the radio parameters: frequency, spreading factor (SF) and transmission power.
Iteratively sends uplink packets using SF values from SF7 to SF12.
Measures signal quality indicators such as RSSI and SNR after each transmission.
Tags each packet with a specific header that indicates that it belongs to a scanning session.
The data are stored or transmitted to the LoRaWAN network server for processing.
3.3.2. Server-Side Algorithm: Frame Decoding and Processing
The network server implements a lightweight and efficient algorithm to decode and process scanning frames. The process includes the following:
Identifying scanning packets based on a predefined frame header or message type.
Extracting relevant metadata: DevEUI, timestamp, frequency, spreading factor, RSSI, SNR.
Inserting the data into a structured database for further analysis or visualization.
Ensuring asynchronous handling to avoid overload from simultaneous incoming data.
This scanning mechanism enables dynamic evaluation of LoRaWAN network performance in real time and under diverse environmental conditions, optimizing gateway deployment, and ensuring robust coverage in rural or mountainous areas.
3.4. Software Implementation
Proper software configuration is essential for achieving optimal performance in LoRaWAN networks. This subsection describes the software setup deployed on the server, gateway, and end devices.
Server
The server hosts a set of core services responsible for communication, data management, and visualization:
Mosquitto: A lightweight MQTT broker that enables real-time communication between IoT devices. Its minimal resource consumption makes it particularly suitable for resource-constrained environments.
MySQL: An open-source relational database management system used to store, manage, and query structured datasets. Its scalability and robustness support both small- and large-scale IoT deployments.
Grafana: A data visualization and monitoring platform used to analyze network performance in real time. Grafana’s customizable dashboards and integrated alerting system provide effective tools for observing key metrics and system health.
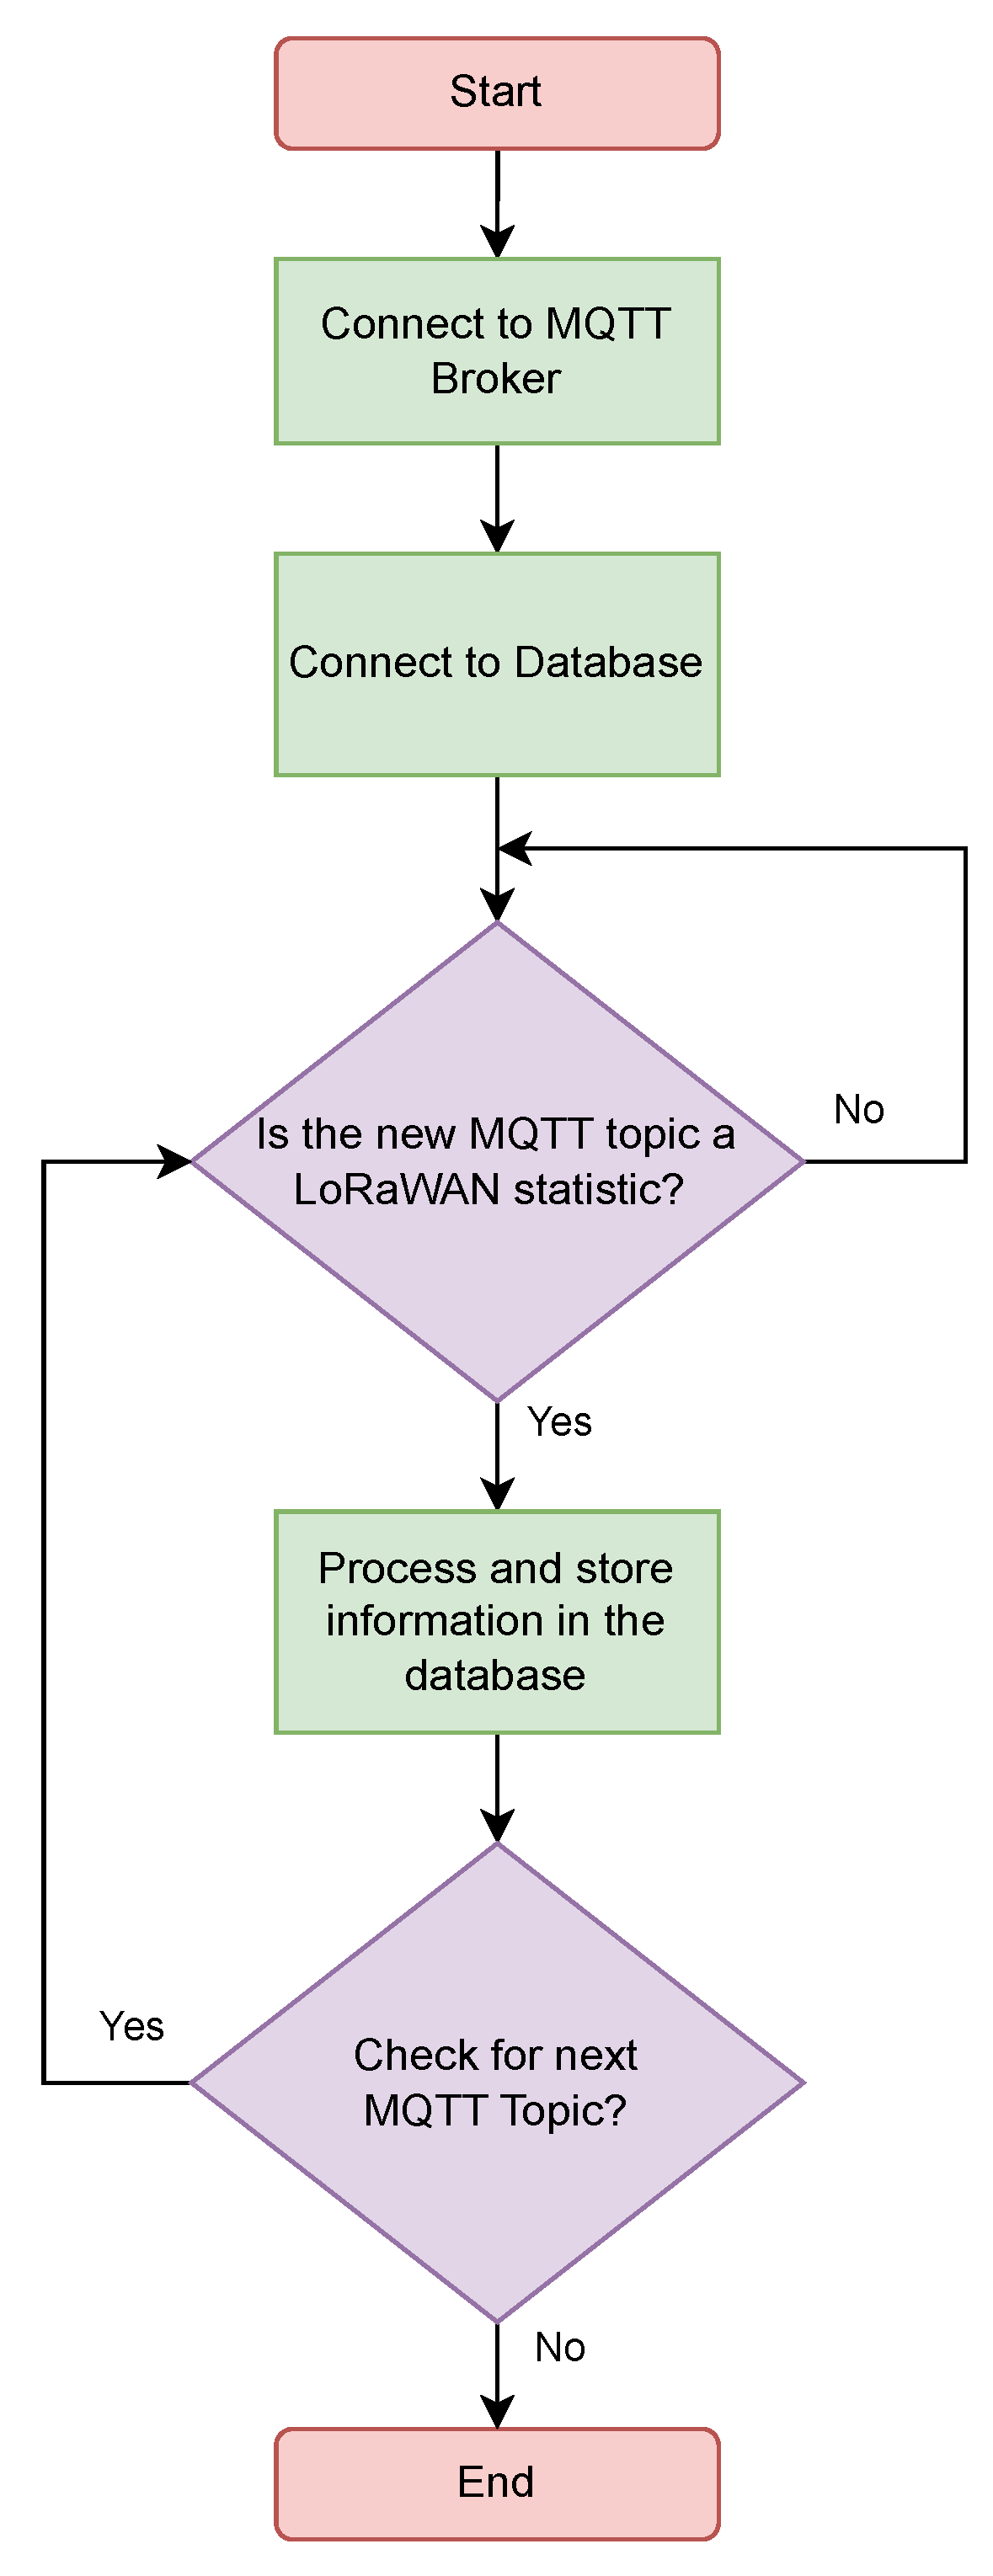
MQTT Client v1.12.0 is a software application developed using the
.NET framework and the C# programming language. As illustrated in
Figure 4, the client monitors predefined MQTT topics, decodes data frames received from the end devices, and stores the processed information in a database for subsequent analysis.
The end device, labeled RAK10701 (RAKwireless Technology Co., Ltd., Shenzhen, China) in
Figure 1, is a LoRaWAN network tester designed to evaluate network deployments in diverse environments. Developed using the
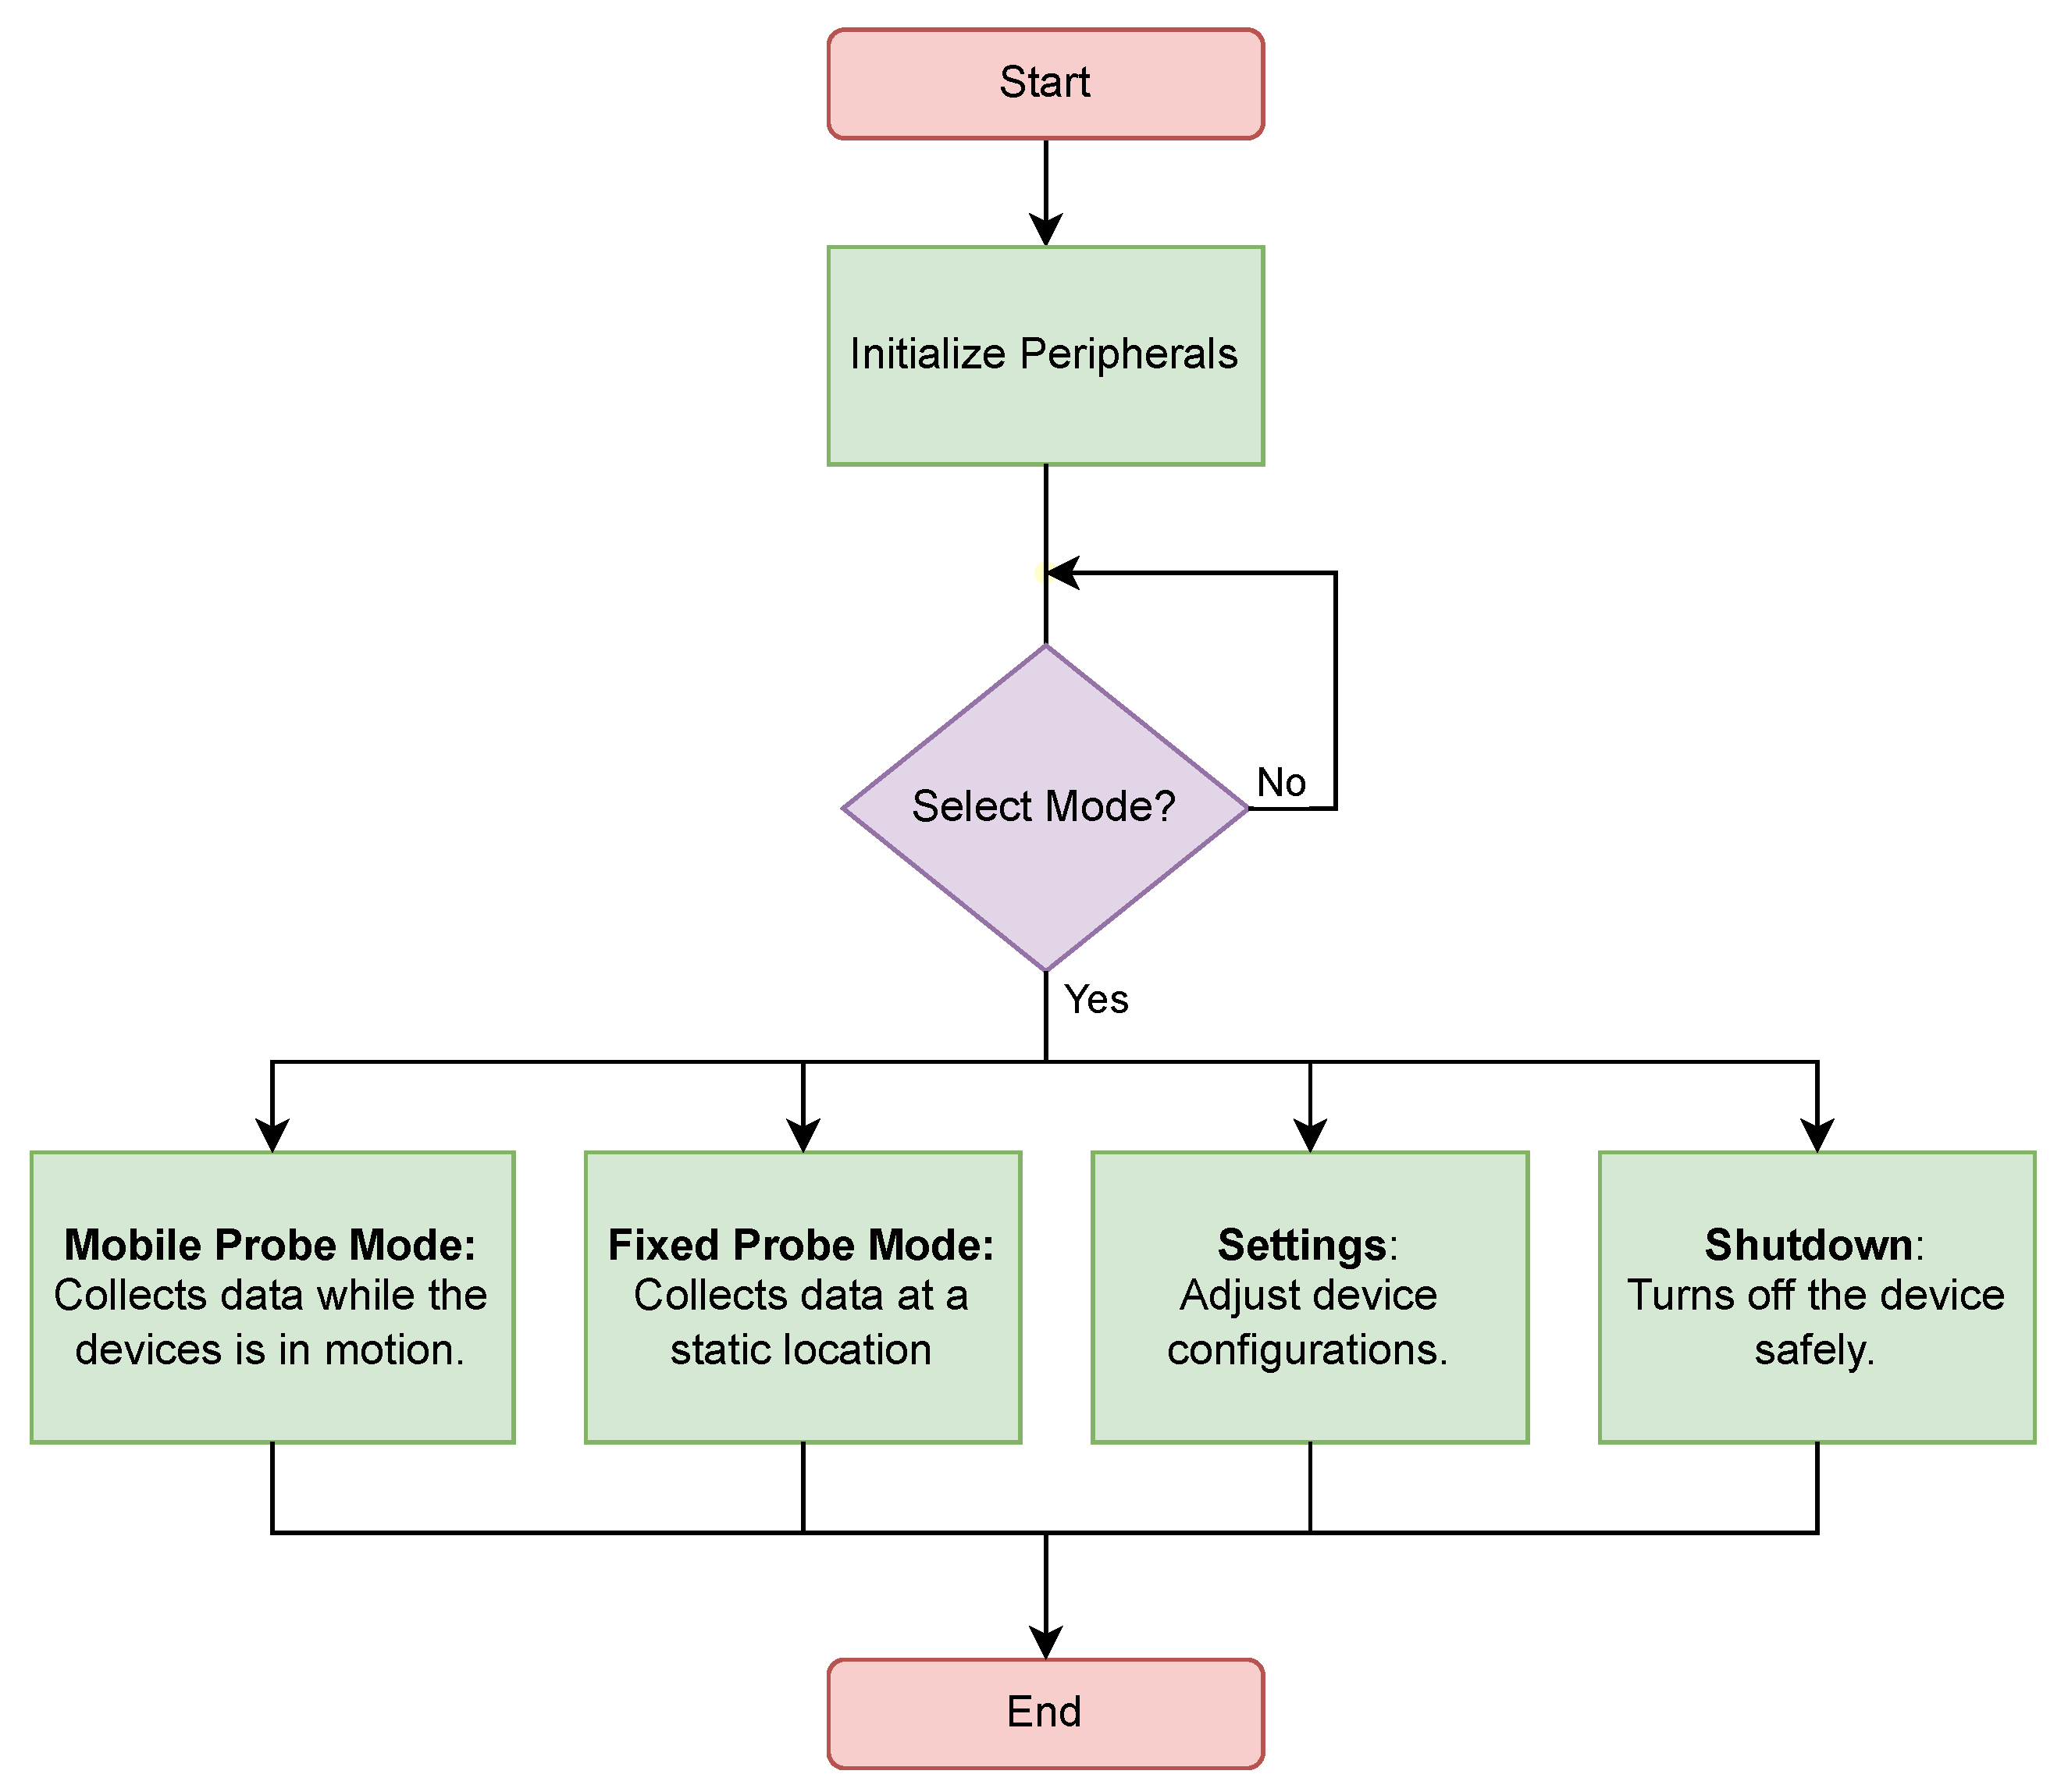
RUI3 framework by RAKWireless (RAKwireless Technology Co., Ltd., Shenzhen, China), the device supports multiple operating modes for flexible data collection. As illustrated in the main menu flowchart in
Figure 5, the configuration interface enables users to select specific operational modes adapted to various testing scenarios and deployment requirements.
3.5. System Testing and Monitoring
The end device performs tests using fixed and mobile probes.
Table 5 summarizes the monitored parameters, such as transmission power, data rate, antenna height, and number of retries during link testing. For mobile probes, additional metrics are included, such as vehicle velocity, to enhance the accuracy of data collection.
The flow chart shown in
Figure 6 describes the operation of the system to track key signal parameters in both the uplink and downlink directions. The system supports statistical analysis and monitoring of the end device in both static and mobile testbed configurations.
The data frame used to transmit LoRaWAN network statistics is structured as a binary-encoded information packet to minimize overhead and ensure efficient transmission over constrained wireless links. Depending on the data volume and configuration, the information may be encapsulated within a single frame or split across two sequential frames to accommodate payload size limitations. Each packet carries key performance indicators required for complete monitoring and evaluation of the network, including metrics such as the RSSI, the SNR, and the number of network connection failures. These metrics provide critical insights into link quality, signal propagation conditions, and overall system reliability, enabling adaptive transmission strategies and performance optimization.
3.6. Software Engineering and System Modeling
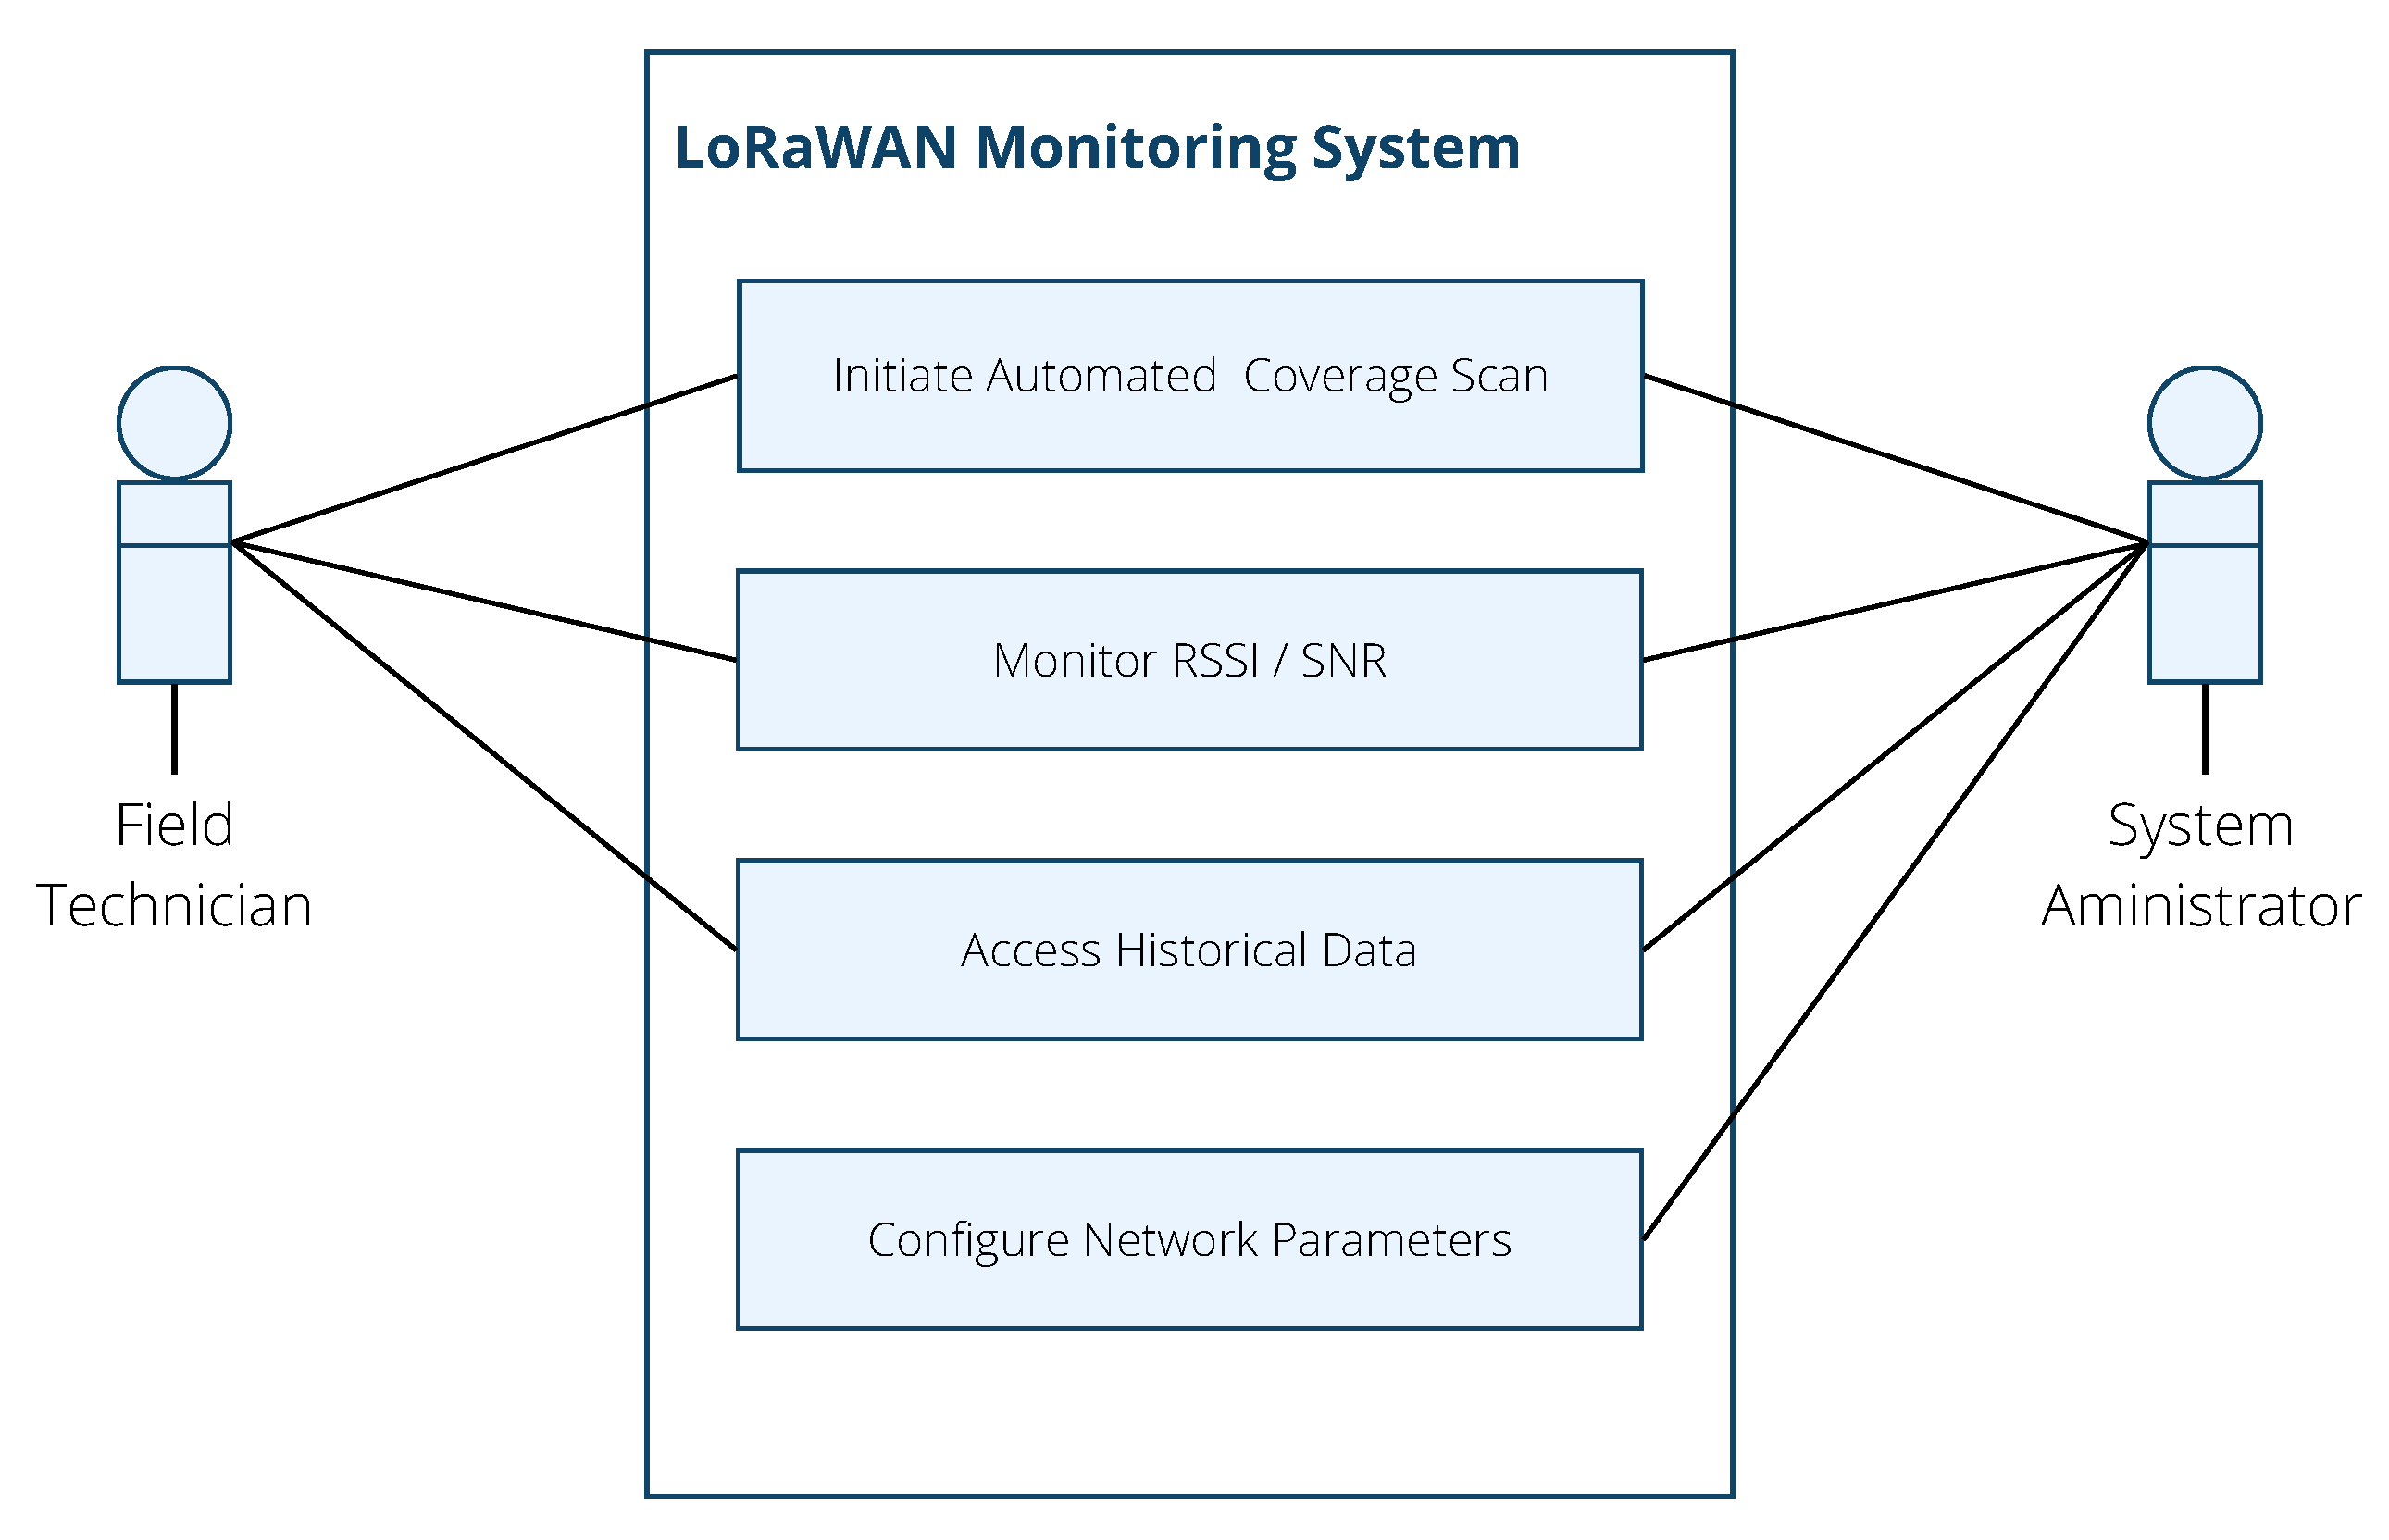
The core implementation focused on the integration of field devices, gateway interfaces, and a central server. The underlying software architecture adopted a service-oriented, layered design consistent with IoT application standards and developed within the application layer. A Unified Modeling Language (UML) approach was adopted to formally describe both the functional and structural aspects of the system (
Figure 7). Specifically, a Use-Case Diagram was designed to illustrate the roles of the primary stakeholders, including field technicians, System Administrators, and LoRaWAN Devices. The diagram delineated user interactions with system functionalities, such as initiating automated coverage scans, monitoring RSSI and SNR in real time, accessing historical performance data, and remotely configuring network parameters.
The use of such models helps clarify the system’s scope, expected behavior, and interaction flows, ensuring a coherent translation from requirements to implementation. These models also support future scalability by enabling the integration of additional IoT devices or services without significant architectural rework.
5. Discussion
An important aspect to consider about the propagation results obtained with our system is the interplay of multiple factors that influence LoRa performance in real deployments. These factors can be grouped into three main categories:
Environmental factors:
The presence of buildings, forest areas, or topographic obstructions can significantly affect the received signal strength (RSSI) and the signal-to-noise ratio (SNR) [
35]. Urban environments tend to introduce more attenuation due to multipath and shadowing, whereas rural or open areas allow longer communication ranges [
36].
Deployment parameters: The placement of the gateway (particularly height), the orientation of the antenna, and the use of mobile versus static probes influence signal propagation [
16].
Protocol-level configuration: LoRa performance is also shaped by transmission parameters such as spreading factor (SF), bandwidth (BW), and transmission power (Tx) [
37]. Increasing the SF improves coverage but reduces data rate and increases airtime. Likewise, increasing the Tx power can overcome propagation losses but impacts energy consumption and regulatory limits.
These categories are not independent; rather, their combined effect determines link reliability and coverage range. Several previous studies have illustrated this interaction. For example, Rivera Guzmán et al. [
38] implemented a LoRa-based monitoring system in the Andean highlands of Ecuador (2910–3040 m above sea level), where steep slopes, eucalyptus forests, and nonlinear sight conditions (NLoS) led to RSSI values as low as −122 dBm and SNR down to −15 dB. Despite these harsh conditions, the PDR exceeded 76% for the uplink and 87% for the downlink at distances of up to 875 m, achieved by careful selection of the SF values (SF9–SF12) and proper alignment of the antenna.
These findings align with our own field results in Loja and further validate the importance of context-aware deployment strategies. In this regard, the proposed automated system offers a practical and scalable solution to characterize propagation conditions in situ. Through the integration of parameter sweep automation, real-time bidirectional monitoring, and georeferenced data collection, the platform supports more precise link planning and adaptive optimization. Although the system was tested in Loja, its modular architecture and propagation-aware features make it easily transferable to other regions with diverse environmental and deployment conditions. As such, it serves as a general-purpose framework for performance evaluation and radio planning in LoRa-based IoT scenarios.
The results of the automated platform developed for real-time data acquisition at LoRaWAN base stations demonstrate its effectiveness in improving network performance in a variety of environments. By automatically monitoring and recording crucial parameters, including RSSI, SNR, SF, bandwidth, and transmit power, for both uplink and downlink communications, the system provides detailed, low-latency insights into network conditions, thereby streamlining optimization efforts.
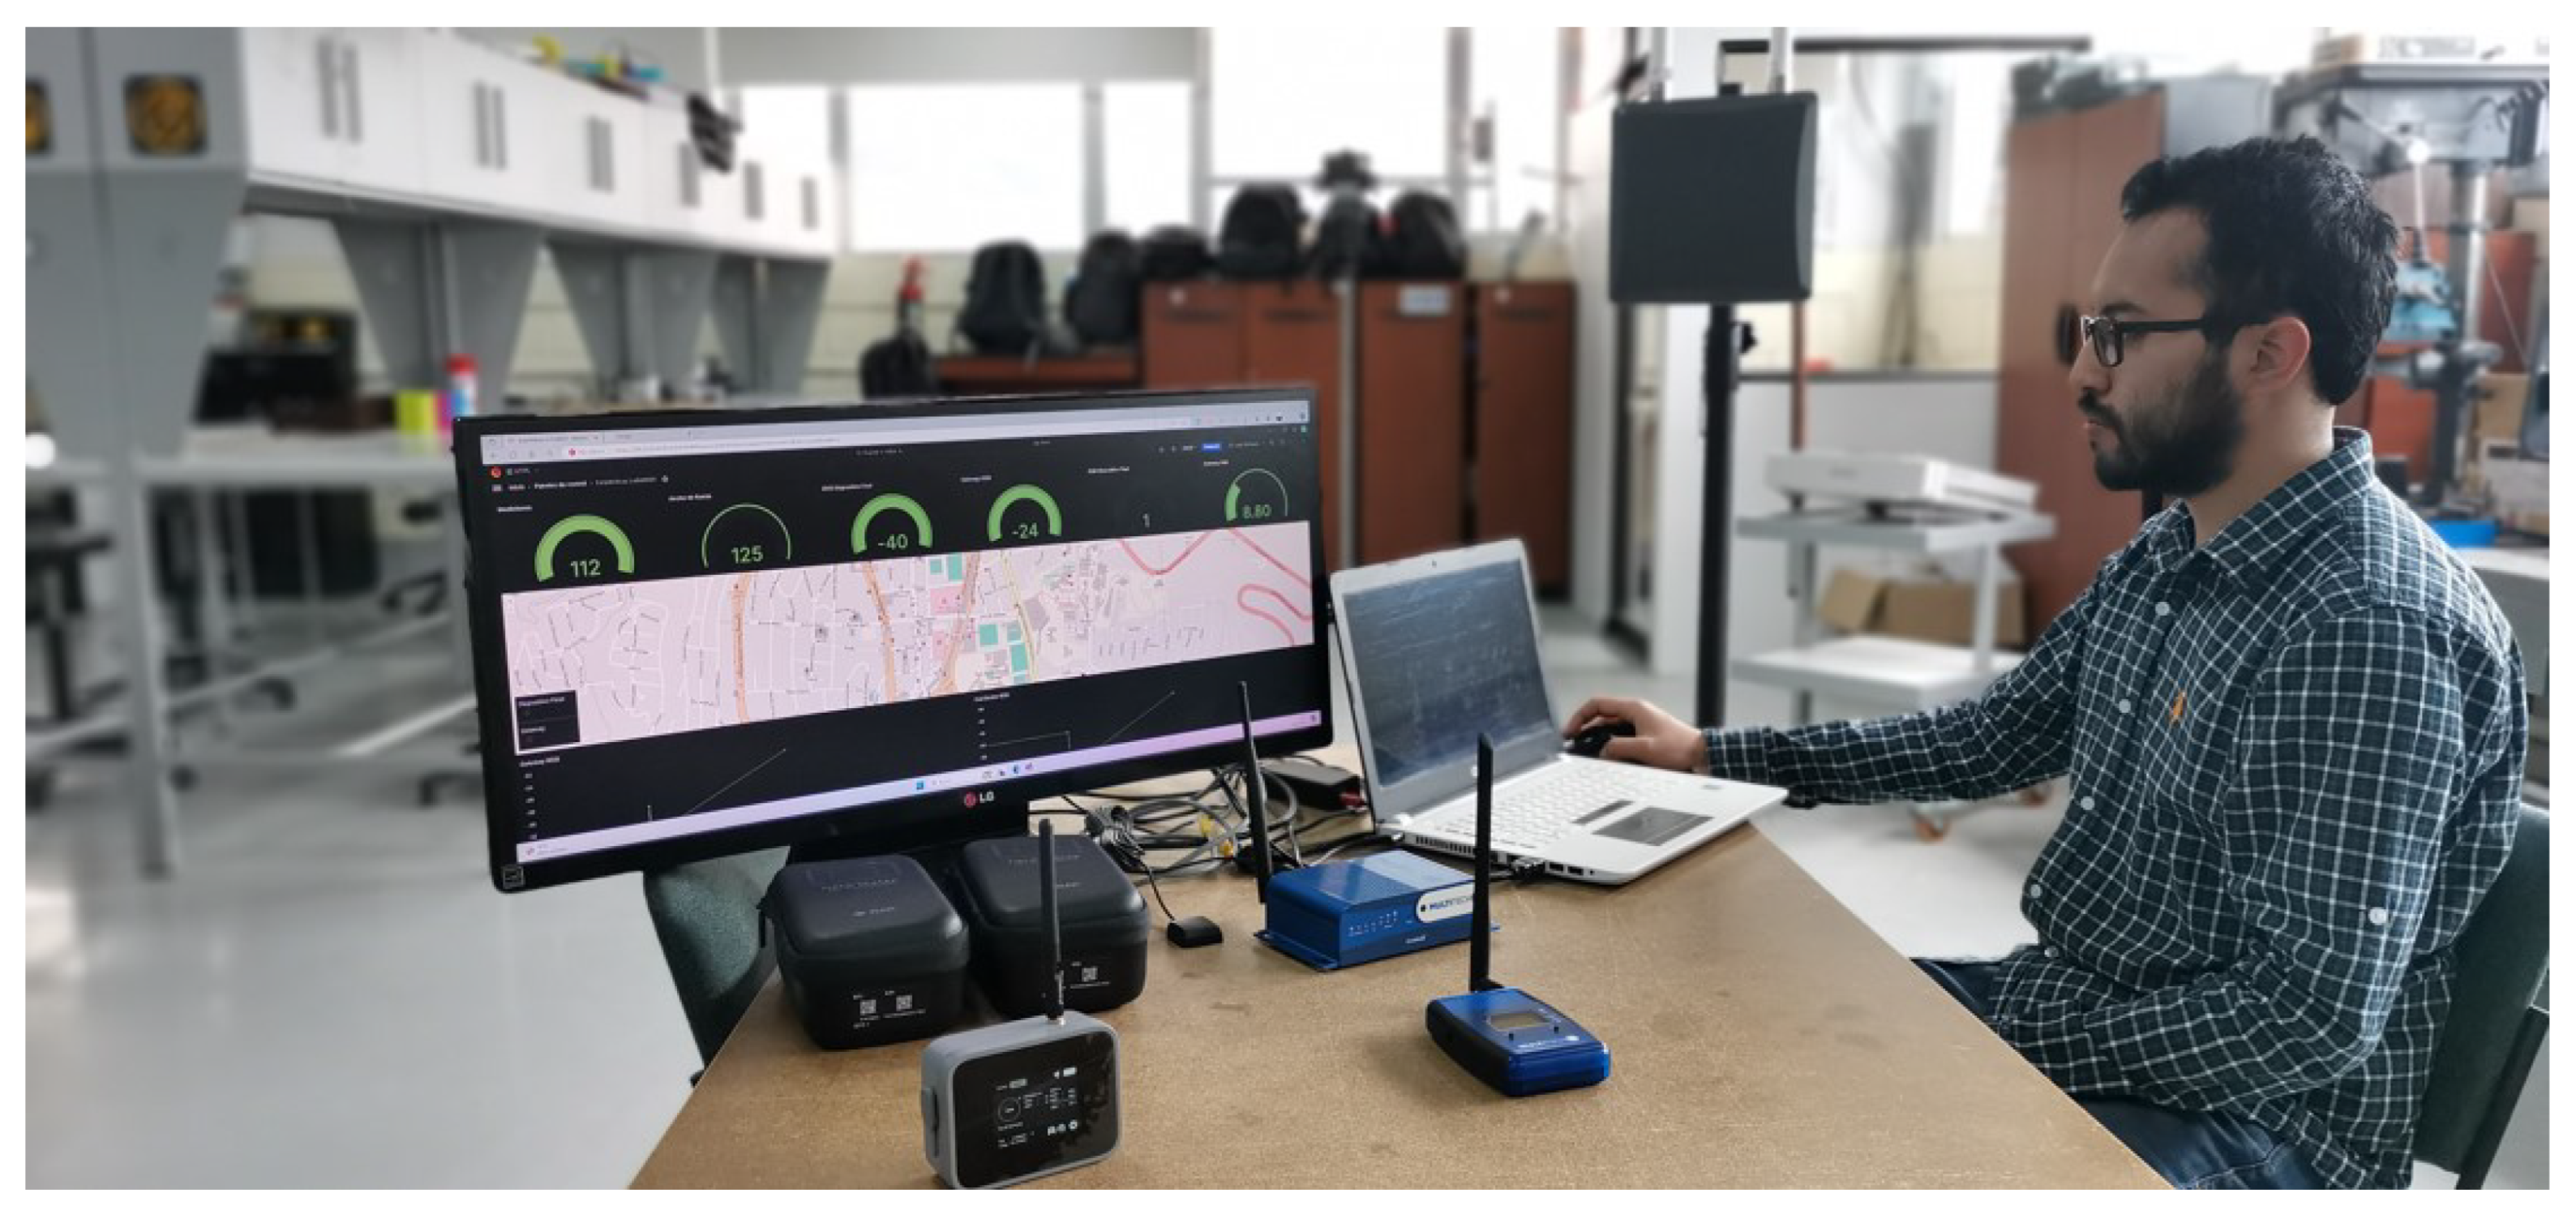
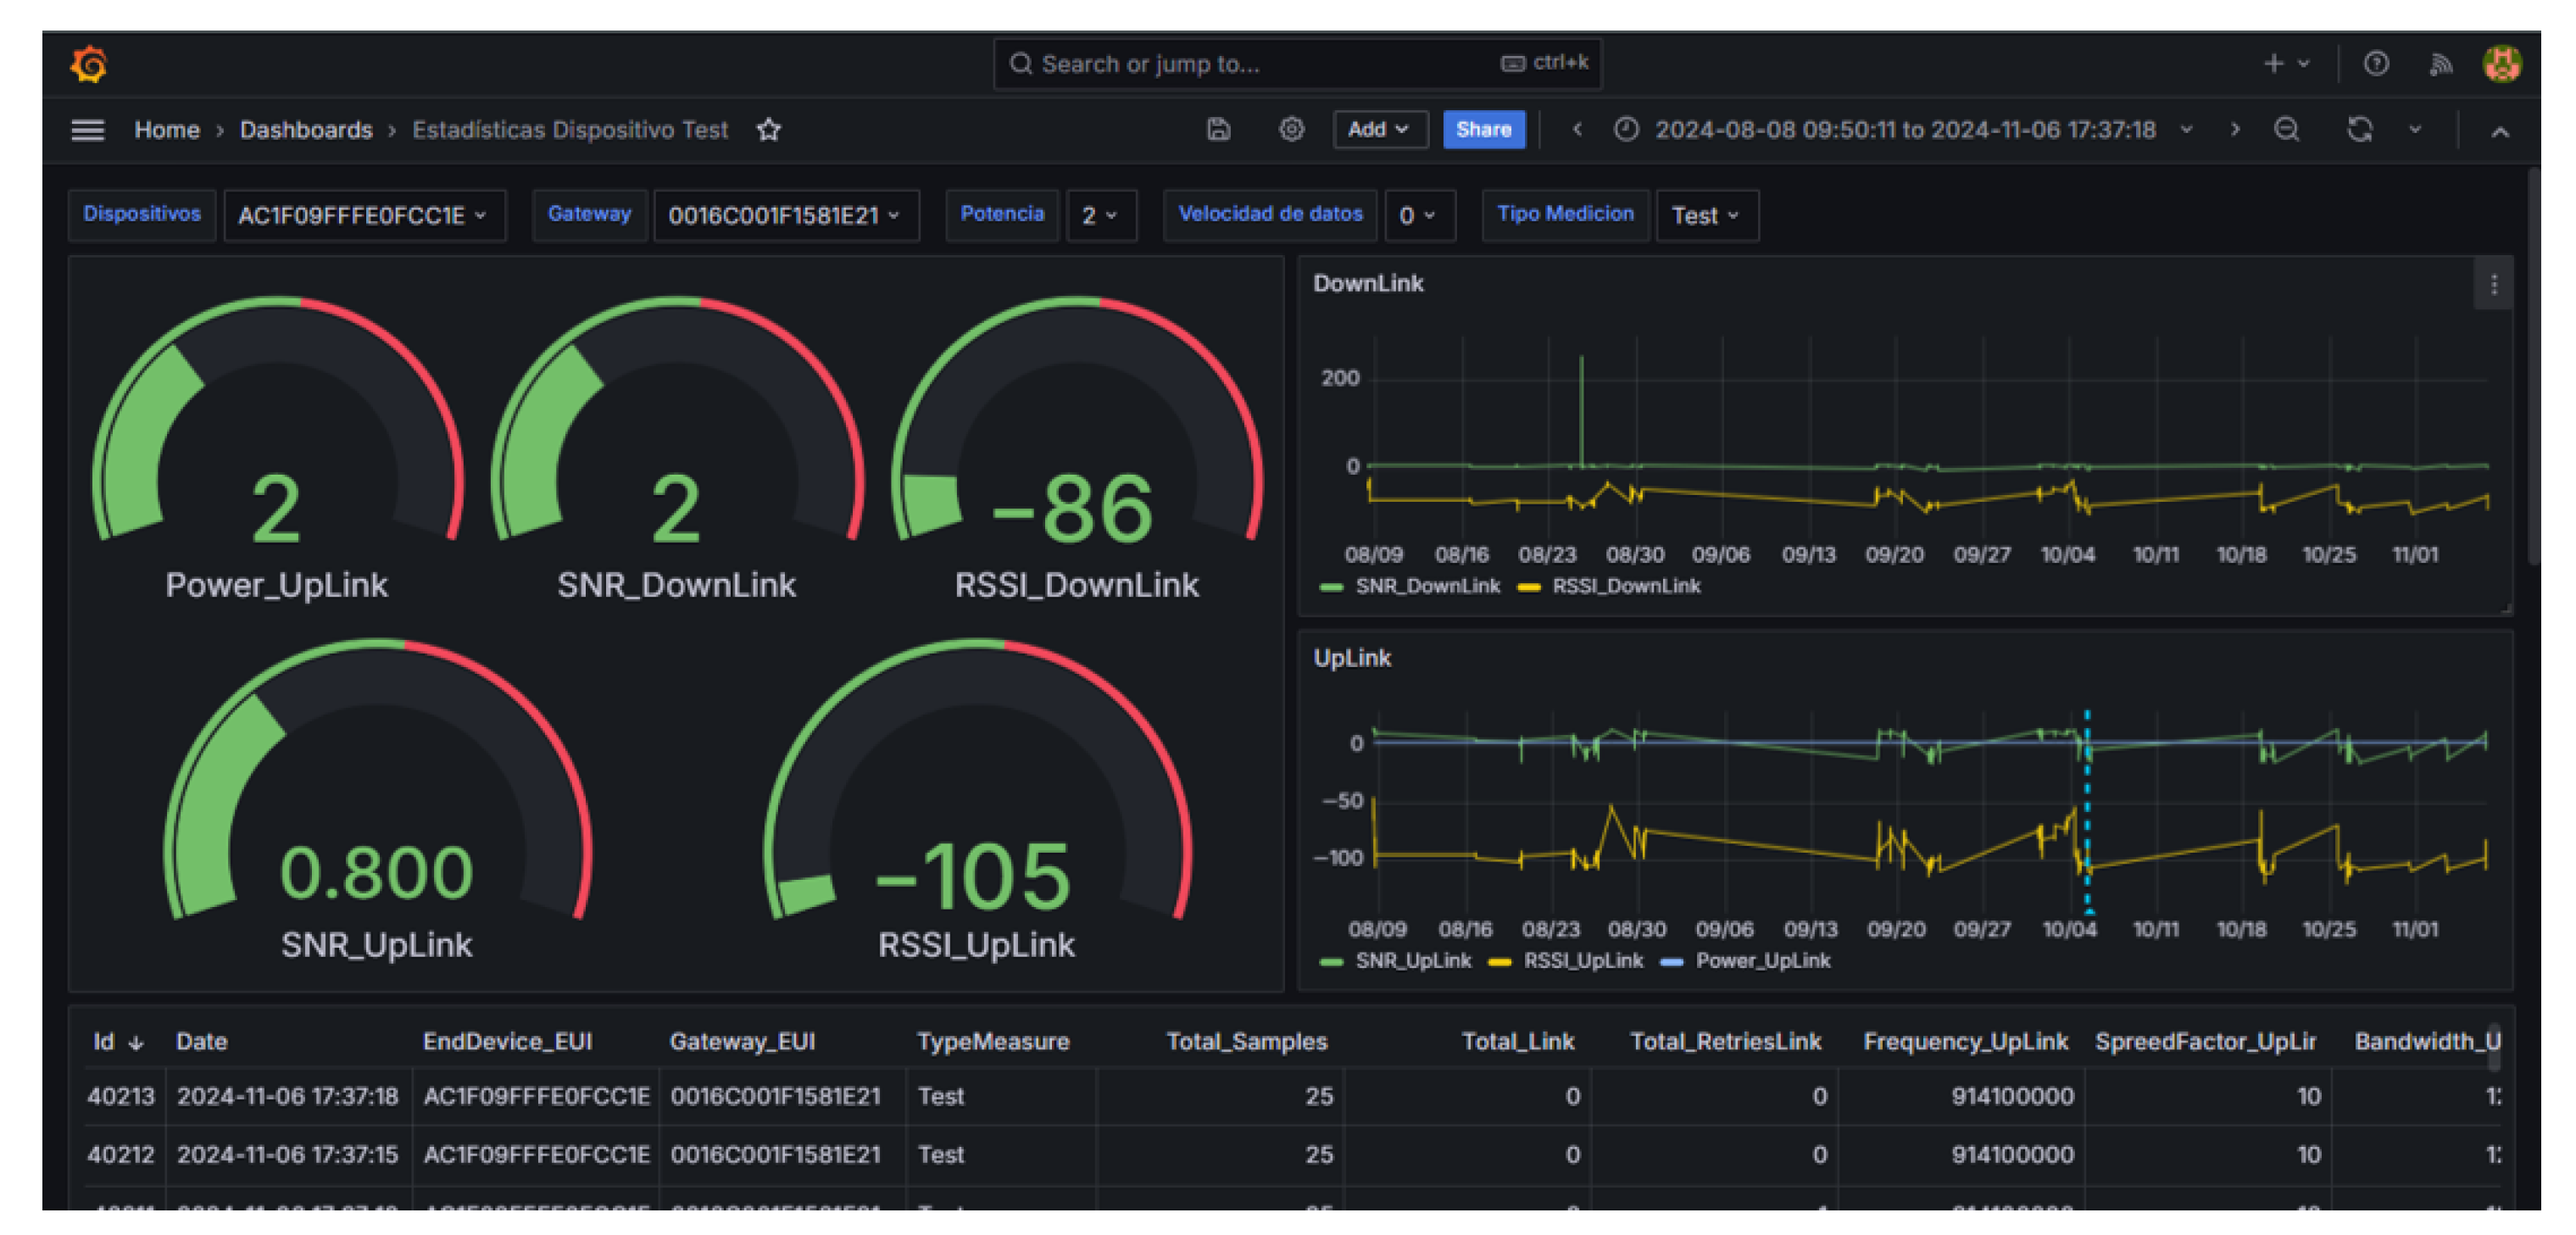
As shown in
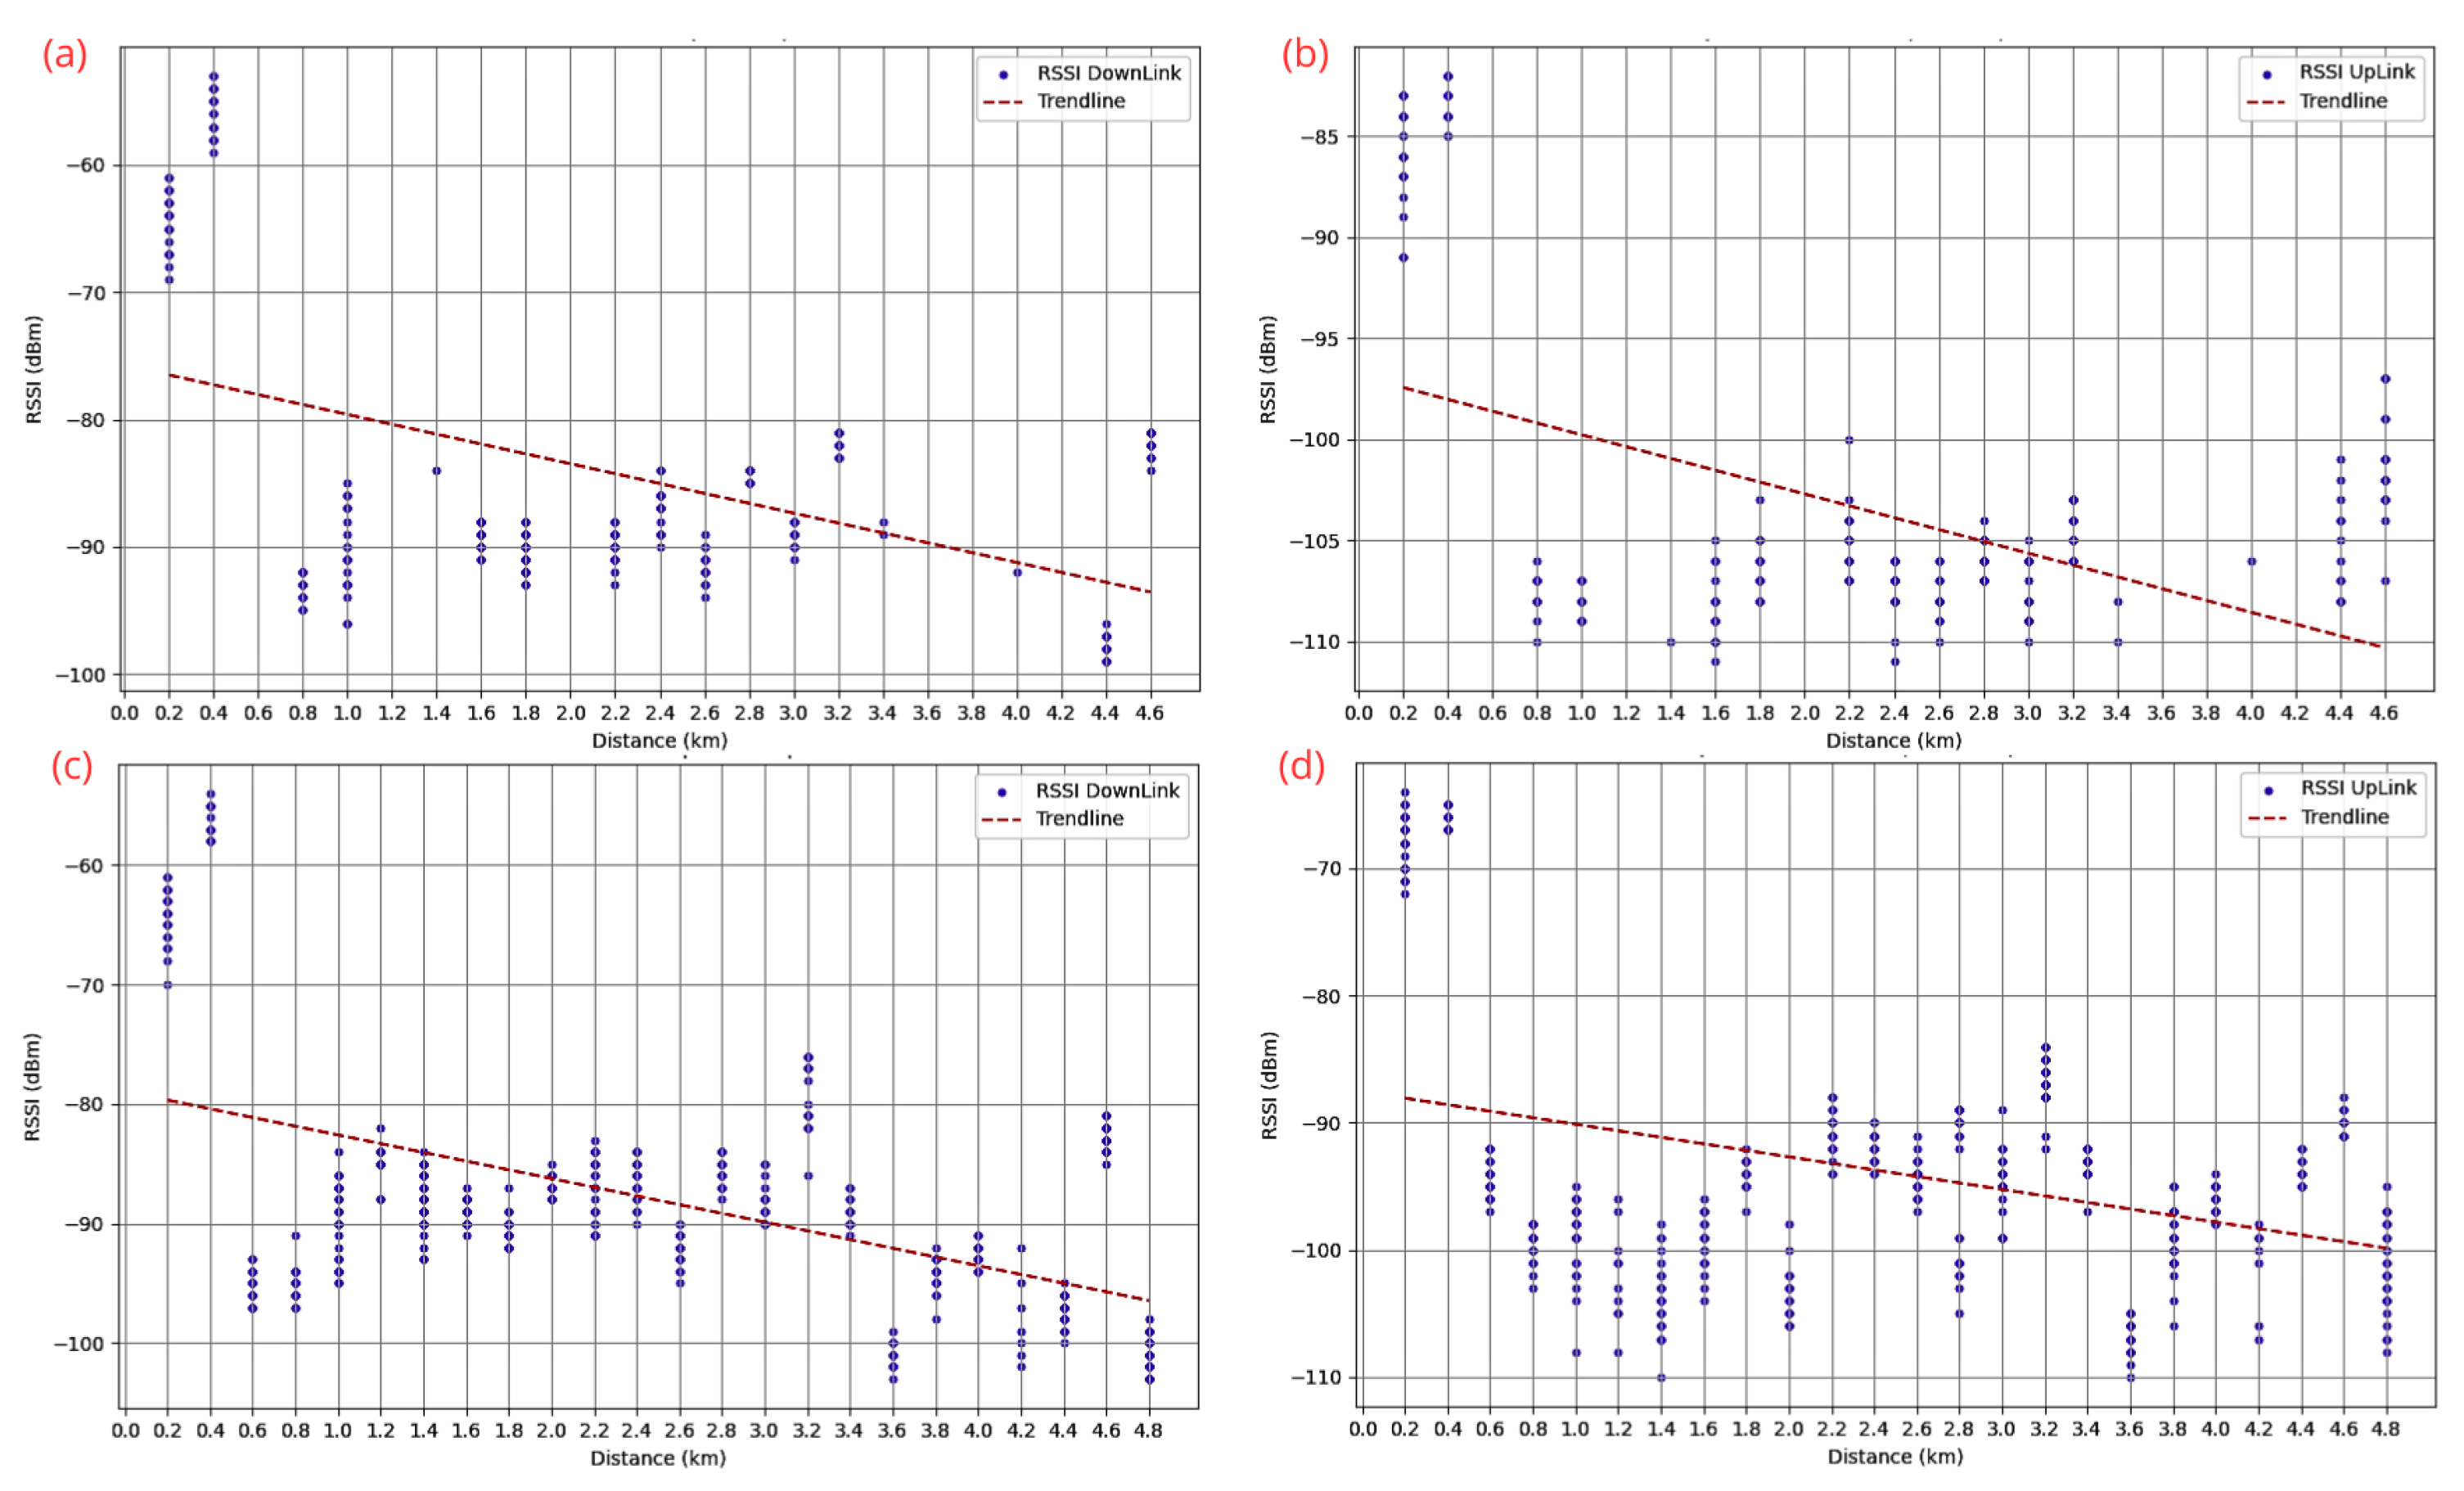
Figure 14, a dedicated and interactive dashboard visualizes these key parameters, providing valuable information on network conditions. Furthermore, the system was evaluated in a broader deployment scenario that included the city of Loja, with the Universidad Técnica Particular de Loja serving as the central reference point. This extended analysis, conducted in a complex urban environment and depicted in
Figure 19, demonstrates the robustness of the solution under various real-world conditions.
Compared to traditional manual measurement methodologies, the proposed system significantly improves data acquisition efficiency by eliminating the need for human intervention and reducing potential measurement errors. The evaluated nodes and link parameters presented in
Figure 19 further validate the capability of the system to support reliable transmission analysis.
In the study mentioned [
27], the TeamUp network represented a practical LoRaWAN use case, which allowed emergency communication in areas without cell coverage. Field tests measuring RSSI, SNR, and PDR were performed to validate message delivery, GPS tracking, and sensor data transmission across urban, rural, and natural terrains.
In contrast, our automated monitoring architecture focuses on real-time, bidirectional data collection to streamline network evaluation. By continuously logging RSSI, SNR, SF, transmit power, retry counts, and GPS data, it accelerates decisions about network availability and signal strength, as referenced in
Figure 19.
These two approaches can be combined to study terrains prone to emergencies. In regions susceptible to natural hazards, such as mountain trails that become critical hotspots for wildfire ignition during prolonged dry seasons, the establishment of high-reliability communication networks is essential. Such infrastructures, designed with fault tolerance and redundancy, can operate as primary or backup channels, ensuring uninterrupted connectivity for emergency services and enabling effective coordination of search and rescue missions in remote forested areas.
Although existing testbeds provide valuable support for the development of IoT applications, the design, implementation, and testing of such systems remain complex and time-consuming [
39]. By enabling automated collection of time-series data, the proposed system facilitates in-depth analysis of network behavior and supports informed decision-making to optimize gateway placement and transmission configurations.
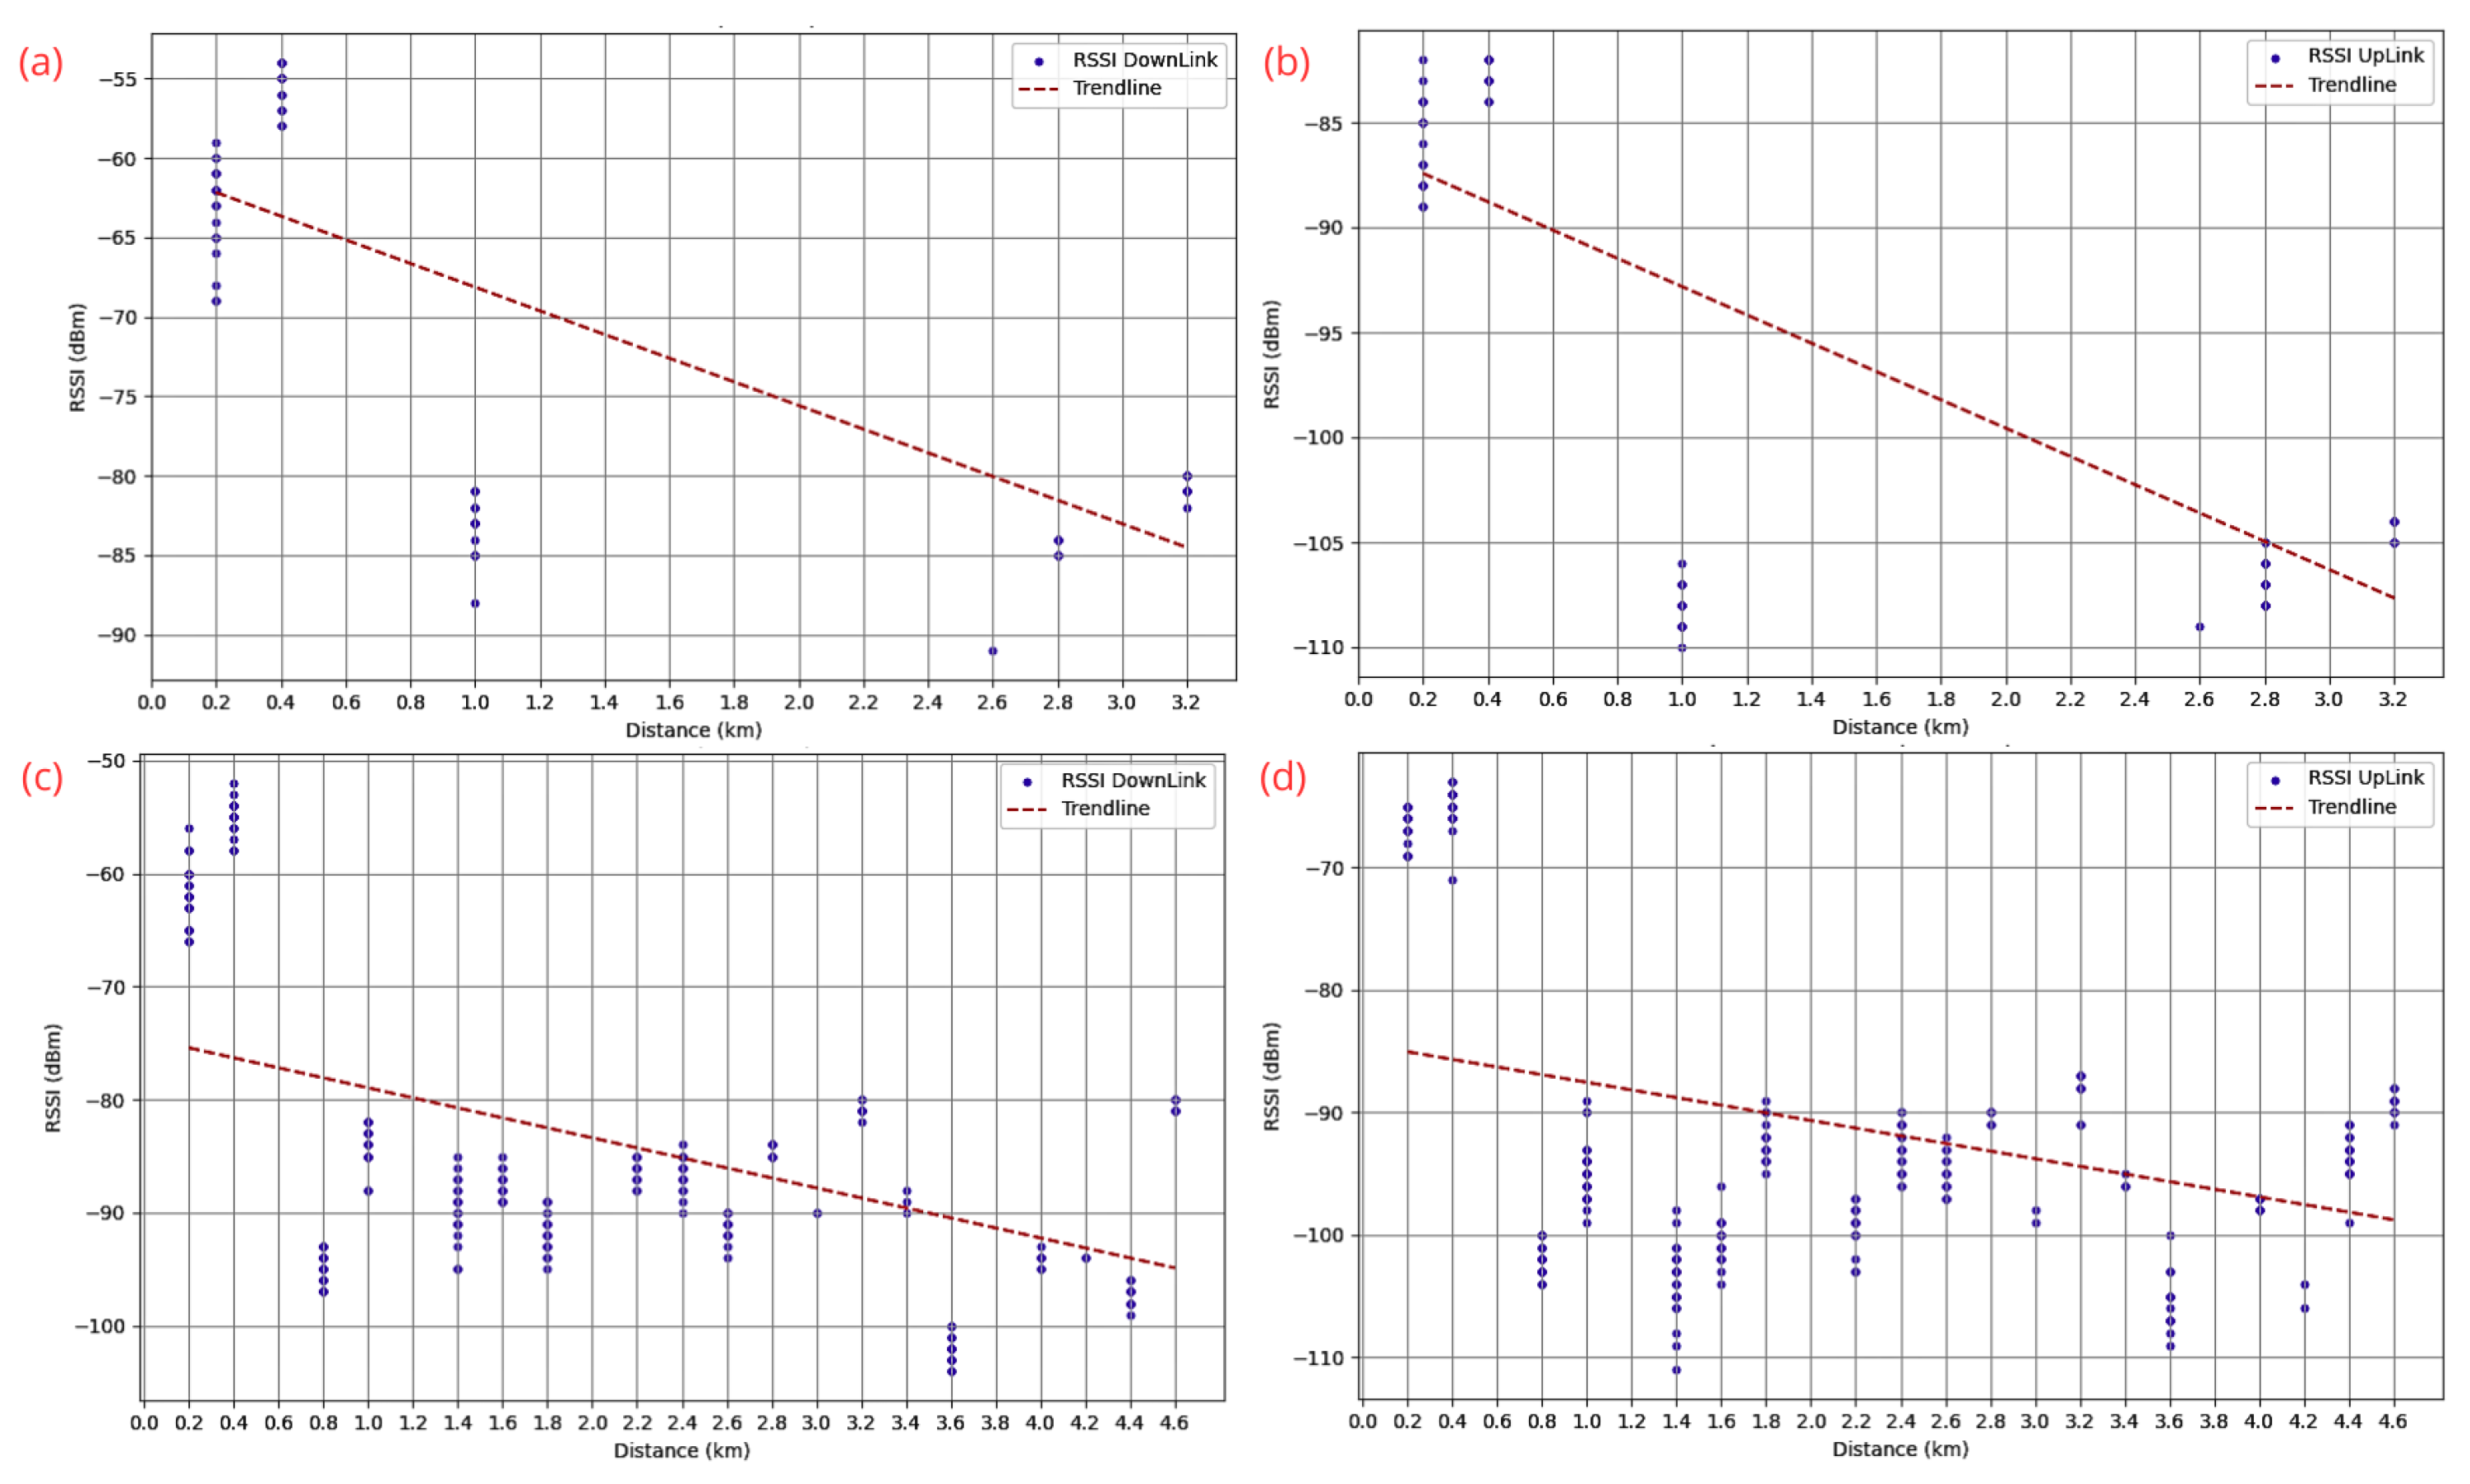
One of the primary strengths of the system is its ability to track and log link statistics in real time, thus enhancing the evaluation of LoRaWAN coverage under various environmental conditions. Field tests carried out in controlled and open environments validated the performance of the system in different deployment scenarios, as illustrated in
Figure 12. The results indicated that transmission power and spreading factor configurations had a significant impact on communication reliability, particularly in areas with challenging topography or high levels of interference.
Despite these advantages, certain limitations were observed. The performance of the system can be limited by the duty-cycle regulations imposed by LoRaWAN standards, which can introduce latency in data transmission. In addition, network congestion and the use of adaptive data rate (ADR) mechanisms can result in variability in link-quality measurements.
If the number of end-devices in a LoRaWAN network were to significantly increase, several potential performance bottlenecks could arise. These bottlenecks would arise primarily from the limitations imposed by airtime, duty cycles, and the available channel resources. For example, with the current TTN Fair Access Policy that limits each device to an average of 30 s of airtime per day [
40], the network may struggle to accommodate a large number of uplink messages from a high density of devices. As the number of devices grows, this constraint could lead to reduced transmission opportunities per device, and devices could be forced to wait longer before they can transmit again.
Another challenge would be network congestion. As more devices join the network, the likelihood of packet collisions will likely increase [
41], especially in dense urban environments or when many devices transmit simultaneously. The LoRaWAN ALOHA random access method, which allows devices to transmit without coordination, could exacerbate this problem, resulting in higher packet loss rates and retransmissions. This could ultimately decrease network throughput and increase overall latency, particularly when a large number of devices contend for limited transmission opportunities.
The network scalability could also be affected by the limited capacity of LoRaWAN gateways. With a finite number of channels available, each gateway can face increasing difficulty in managing a growing number of devices. Gateways, which operate in half-duplex mode, would only be able to transmit one channel at a time, further reducing the ability to handle more devices. If the number of devices increases beyond the gateway capacity, some devices could face delayed transmissions or even packet loss due to congestion.
Devices that rely on low data rates, such as those that use SF12 for long-range communication, would also be significantly affected. The longer transmission times associated with these lower data rates would result in higher airtime usage, further reducing the number of devices that a single gateway can support within the same duty cycle. Although devices using higher data rates (e.g., SF7) might be able to transmit more frequently, they may face challenges in rural or challenging environments where range is a priority over transmission speed [
41].
Energy consumption could become another significant concern as the network scales. Battery-powered devices would need to transmit more frequently to keep up with the increase in traffic load. As the number of devices increases, the overall energy consumption in the network would also increase, which could lead to shorter battery lifespans and the need for more frequent maintenance or replacements [
42].
To address these potential challenges, several coping strategies could be employed. Adaptive data rate (ADR) mechanisms would become increasingly important in dynamically adjusting the data rate based on network conditions, reducing the consumption of airtime for devices closer to the gateway while maintaining the reliability of communications for devices at greater distances [
43]. In addition, to mitigate the risk of collisions and optimize traffic flow, devices could be distributed across multiple frequency channels, and more efficient channel-hopping techniques could be adopted.
The deployment of additional gateways would also play a crucial role in supporting a larger number of devices. Expanding the number of gateways would help alleviate congestion at each individual gateway and allow more devices to be served with fewer transmission conflicts. Optimizing the placement of gateways, particularly in high-density areas, would further enhance the capacity of the network to scale effectively [
44].
Energy consumption could be managed by configuring devices to transmit less frequently when the data requirements are less sensitive to time. Data aggregation, where devices send multiple sensor readings in a single transmission, could reduce the number of transmissions required, thus conserving energy and minimizing airtime usage.
Future improvements could involve the integration of predictive analytics and machine learning algorithms to dynamically adapt network parameters in real time, further enhancing operational efficiency. The need for such adaptive optimization is evidenced by the sweep test results presented in
Figure 8.
The findings of this study are consistent with previous research on LoRaWAN performance evaluation [
20,
39], which reinforces the importance of automated tools for monitoring and optimizing IoT networks. The system’s ability to systematically collect and analyze link-quality metrics positions it as a valuable asset for large-scale IoT deployments, particularly in domains such as precision agriculture, environmental monitoring, and industrial automation.
In this context, it is pertinent to compare our system with the work of Povalac et al. [
29], which also focuses on the evaluation of LoRaWAN networks, although from a different perspective. Povalac et al. proposed passive traffic monitoring, capturing uplink, downlink, and Class-B beacon traffic to analyze protocol compliance, identify security vulnerabilities, and evaluate synchronization performance through Class-B beacons.
In contrast, our research introduces a fully automated real-time data acquisition framework tailored for urban and rural deployments in southern Ecuador. The architecture integrates MQTT, MySQL, and Grafana to facilitate the continuous monitoring of network performance metrics with minimal human intervention. Although Povalac et al. provide a comprehensive protocol-level assessment and contribute a valuable open dataset to the research community, our work emphasizes practical field deployment and real-time monitoring under geographically and topographically diverse conditions.
These two approaches are complementary. Povalac et al. offer insight into large-scale network behavior and protocol adherence, whereas our system delivers a scalable operational solution for real-time diagnostics and performance optimization, particularly in remote or rural environments. Together, these efforts advance the robustness, scalability, and reliability of LoRaWAN-based IoT applications.
The proposed software automation platform has strong potential to evolve into a commercial solution to evaluate LoRaWAN communication metrics in academic, industrial, and field service contexts. It can be used by service providers for gateway placement validation, by municipalities for network monitoring in smart cities, and by field technicians during the deployment and maintenance phases.
The system supports offline operation through local data logging and delayed synchronization. However, real-time dashboards and MQTT-based communication require an active Internet connection. Currently, hardware dependencies on RAKWireless devices (RAK10701-P and RAK7391) may limit portability. This limitation can be addressed by incorporating a local server implemented using a Raspberry Pi, which enables standalone functionality and reduces reliance on external infrastructure.
Technical limitations may arise from the need to maintain multiple open-source components, as well as the current dependency of the platform on Windows servers and C#-based clients. Usability could be enhanced by incorporating graphical configuration interfaces or dedicated mobile applications. While basic security mechanisms such as TLS encryption are implemented, further improvements in user authentication, access control, and secure update mechanisms are essential for production-level deployments.
To enhance portability and scalability, future versions could support containerized deployment, multigateway synchronization, and integration with cloud or edge computing services. The modular design also allows extension to other LPWAN protocols such as NB-IoT or Sigfox. These improvements will help transition the system from a specialized testbed to a commercially viable tool for LoRaWAN diagnostics and optimization.
In general, the proposed system represents a scalable and efficient solution for LoRaWAN link monitoring, constituting a meaningful contribution to the field of IoT network management and performance optimization.
6. Conclusions
The deployment and practical application of an automated system for assessing LoRaWAN network coverage resulted in substantial improvements in efficiency and precision. The tool streams uplink and downlink metrics in real time, allowing engineers to analyze network performance on-site instead of during lengthy post-processing. By automating the coverage evaluation process, the system minimizes human involvement, shortens the time required for measurements, and reduces the inherent errors associated with manual data acquisition, including the storage of data for post-processing.
The integration of open communication protocols such as MQTT enhances the system’s interoperability with diverse IoT platforms, making it highly adaptable across a wide range of applications and environments. Its scalability supports deployment in a variety of scenarios, from high-density urban areas to remote rural regions where connectivity remains a challenge. Field tests further revealed that signal quality in densely populated environments was often degraded due to interference, emphasizing the need for adaptive network configurations.
Despite these strengths, certain limitations persist. Regulatory restrictions, such as duty-cycle restrictions, can introduce delays in data transmission. Furthermore, network congestion and the use of adaptive data rate (ADR) mechanisms contribute to variability in link-quality measurements. Furthermore, the difficulty of the terrain can introduce a challenging testbed to be studied. To address these challenges, future research should focus on incorporating predictive analytics and machine learning techniques to dynamically optimize network parameters, enhancing both efficiency and resilience.
This study highlights the vital role of automation in optimizing LoRaWAN deployments. By supporting large-scale data collection and real-time analysis, the proposed system offers a robust and scalable solution for IoT applications that require extensive coverage, such as smart agriculture, environmental monitoring, and industrial automation. Future work should explore the integration of multigateway architectures and hybrid LPWAN technologies to further enhance network robustness and scalability. In addition, the implementation of advanced data visualization frameworks will support improved decision-making and operational efficiency.
In conclusion, this research contributes a practical, scalable, and efficient software solution for LoRaWAN network monitoring, advances the state of IoT network management, and provides a solid foundation for future innovations in wireless communication technologies.

