
Real-Time Object Classification on an Enamel Paint Coating Conveyor Line Using Mask R-CNN


Abstract
1. Introduction
1.1. Background
1.2. Problem Definition
- We introduce a technique to automatically classify manufactured metal parts on an enamel paint-coating conveyor line, thus eliminating the need for repetitive human intervention.
- A trained Mask R-CNN model is proposed for object detection and classification tasks, which is a sophisticated deep learning technique known in the literature for its accuracy in detecting and segmenting objects in captured images.
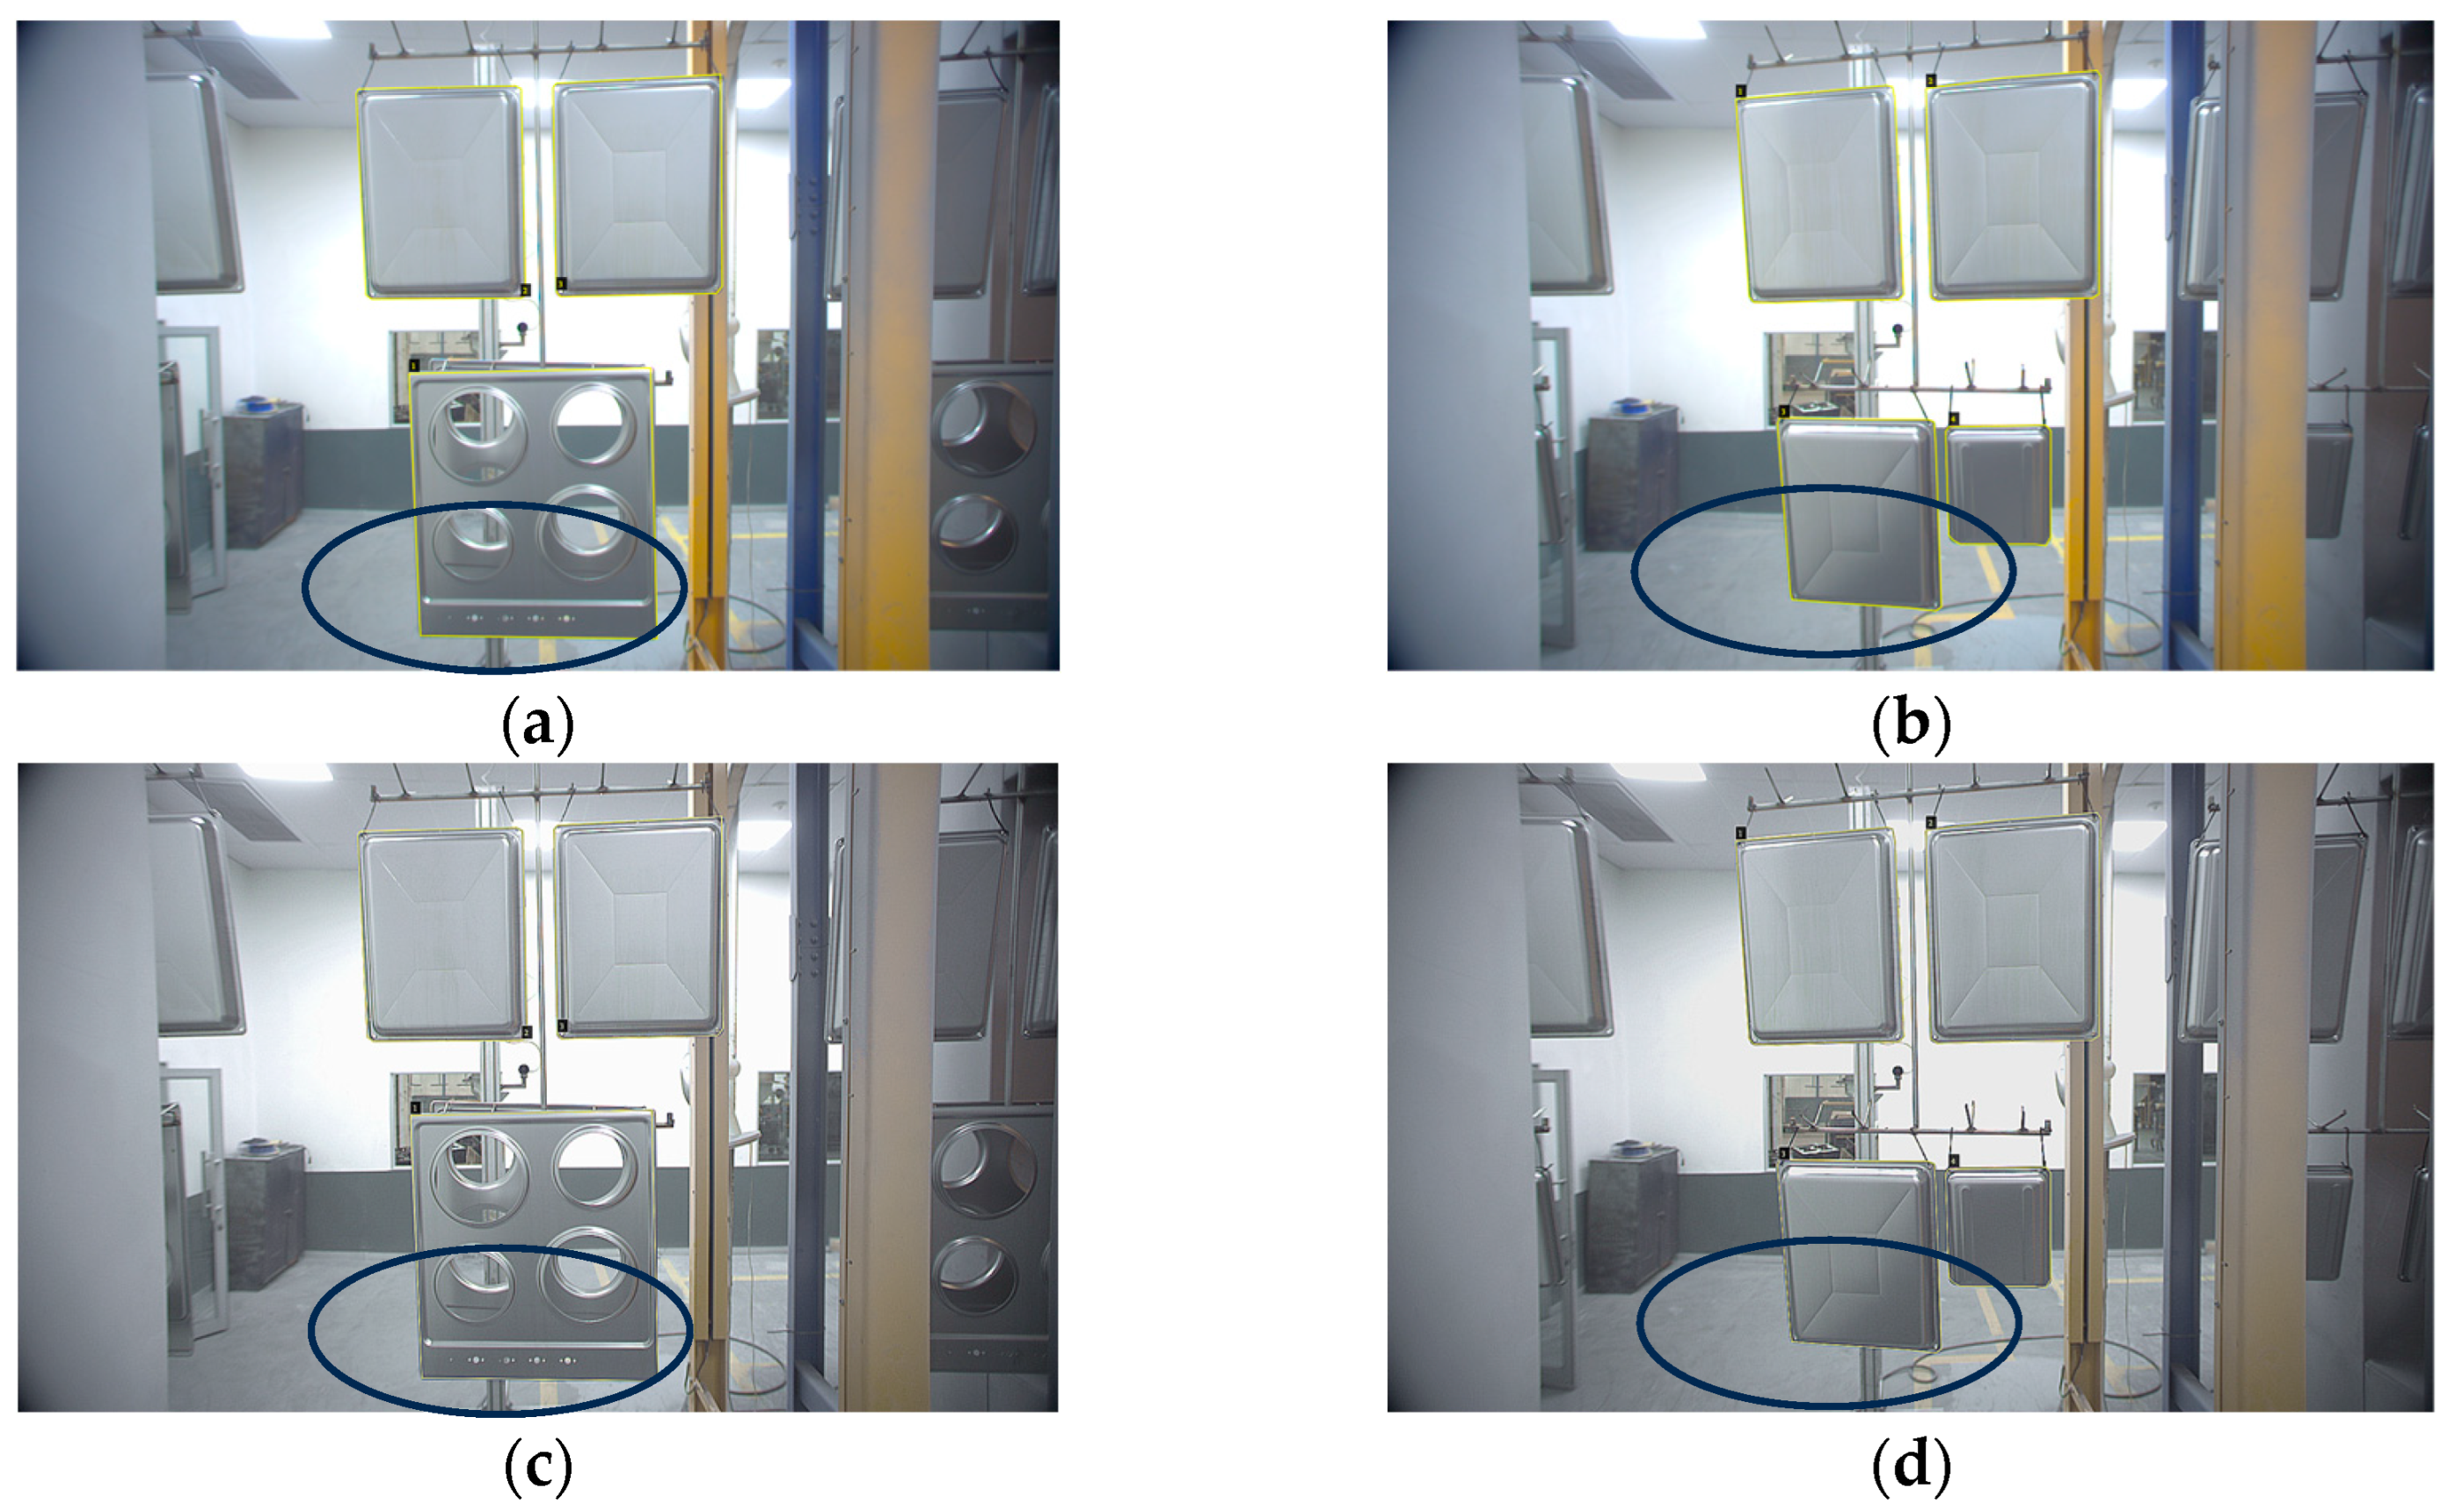
- The study addresses the challenges of objects being outside the area of interest and shadows that distort the features of objects in an image.
- Based on production requirements, variability in different classes of objects is accounted for, meaning that the system can accurately adapt to changing production requirements.
- Finally, the proposed system achieves high average precision and overall accuracy to meet the stringent demands of quality requirements.
2. Related Work
2.1. Traditional Methods for Object Detection on a Conveyor Line
2.2. Computer Vision Approaches for Object Detection in the Manufacturing Industry
2.3. Applications of Mask R-CNN-Based Vision Systems
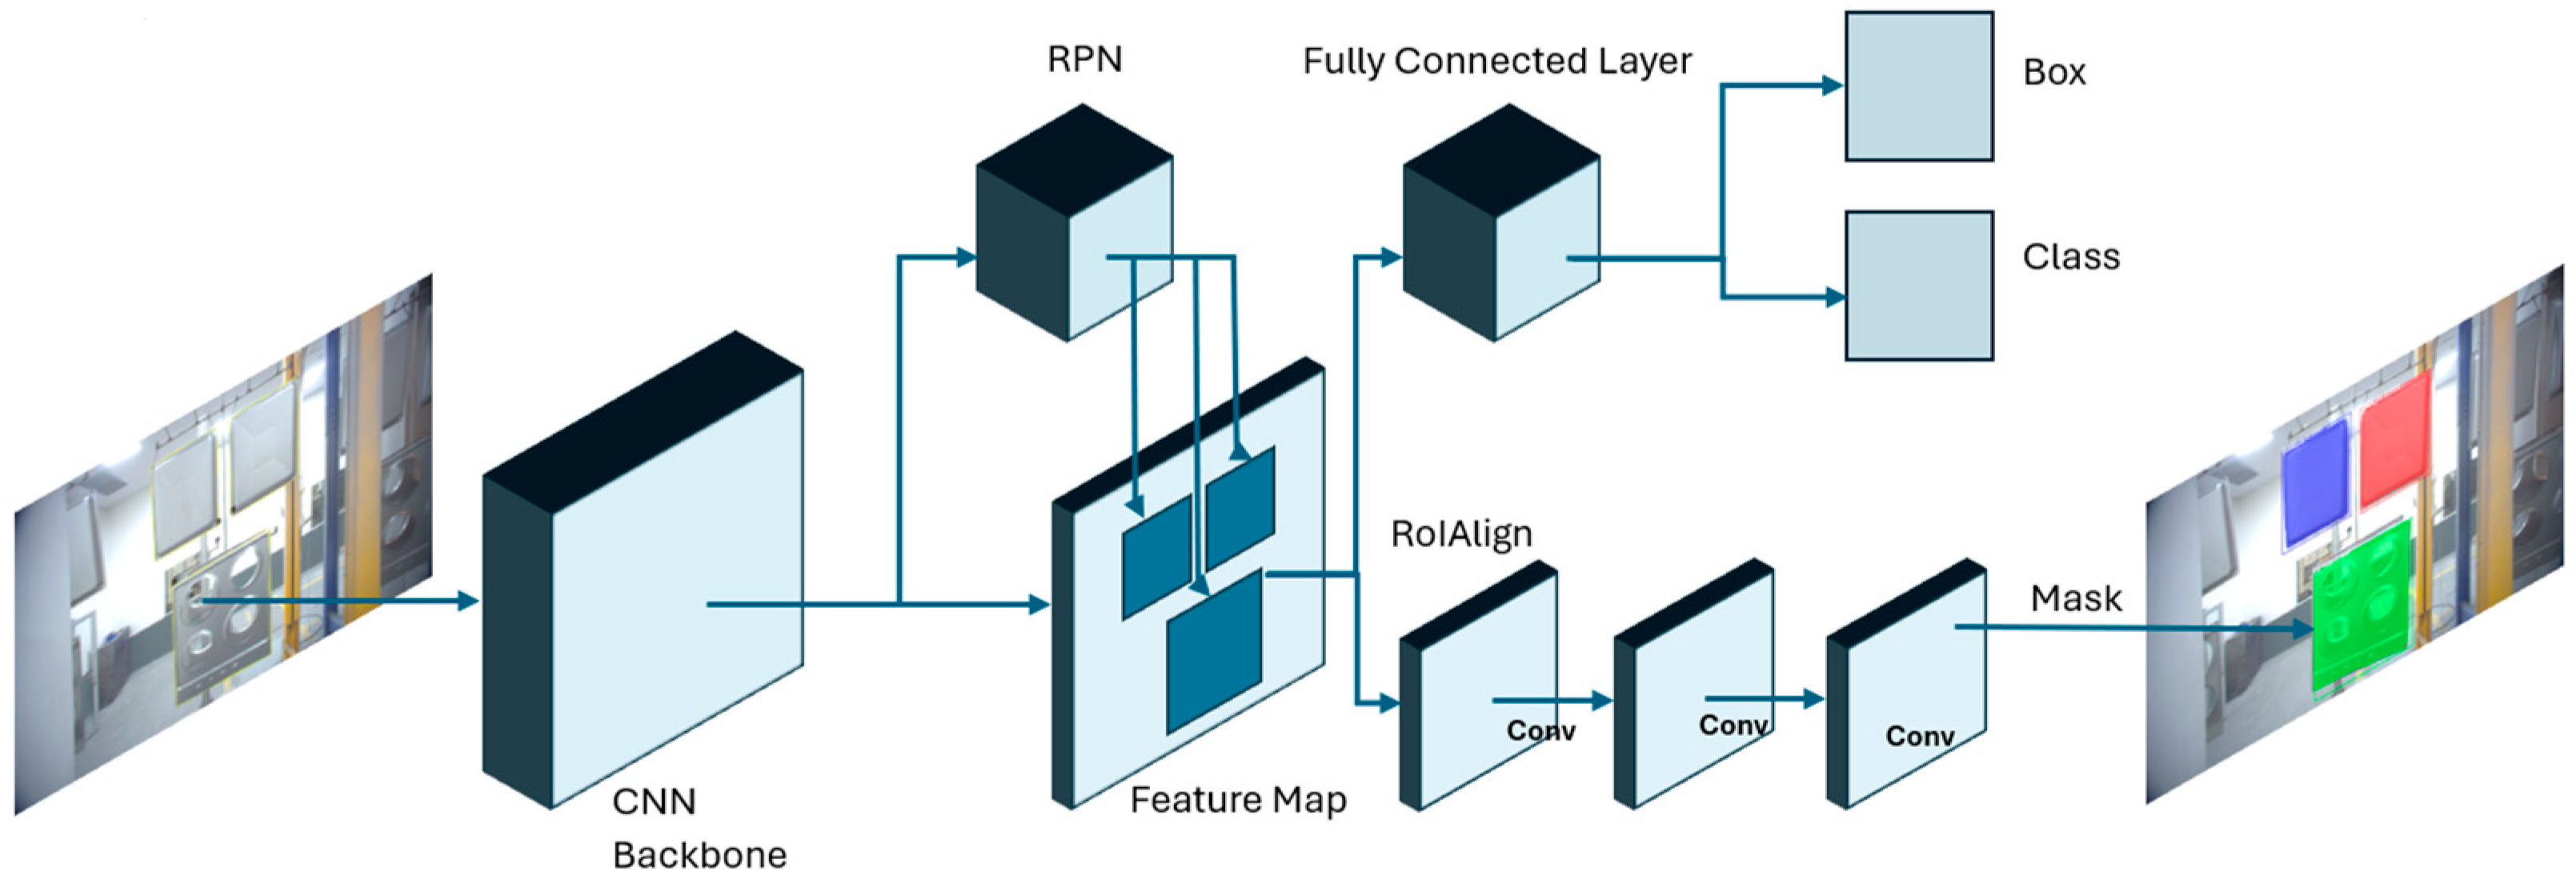
2.4. The Mask R-CNN Model
2.4.1. Feature Pyramid Network
2.4.2. ROI Align
2.5. Other Object Classification Models
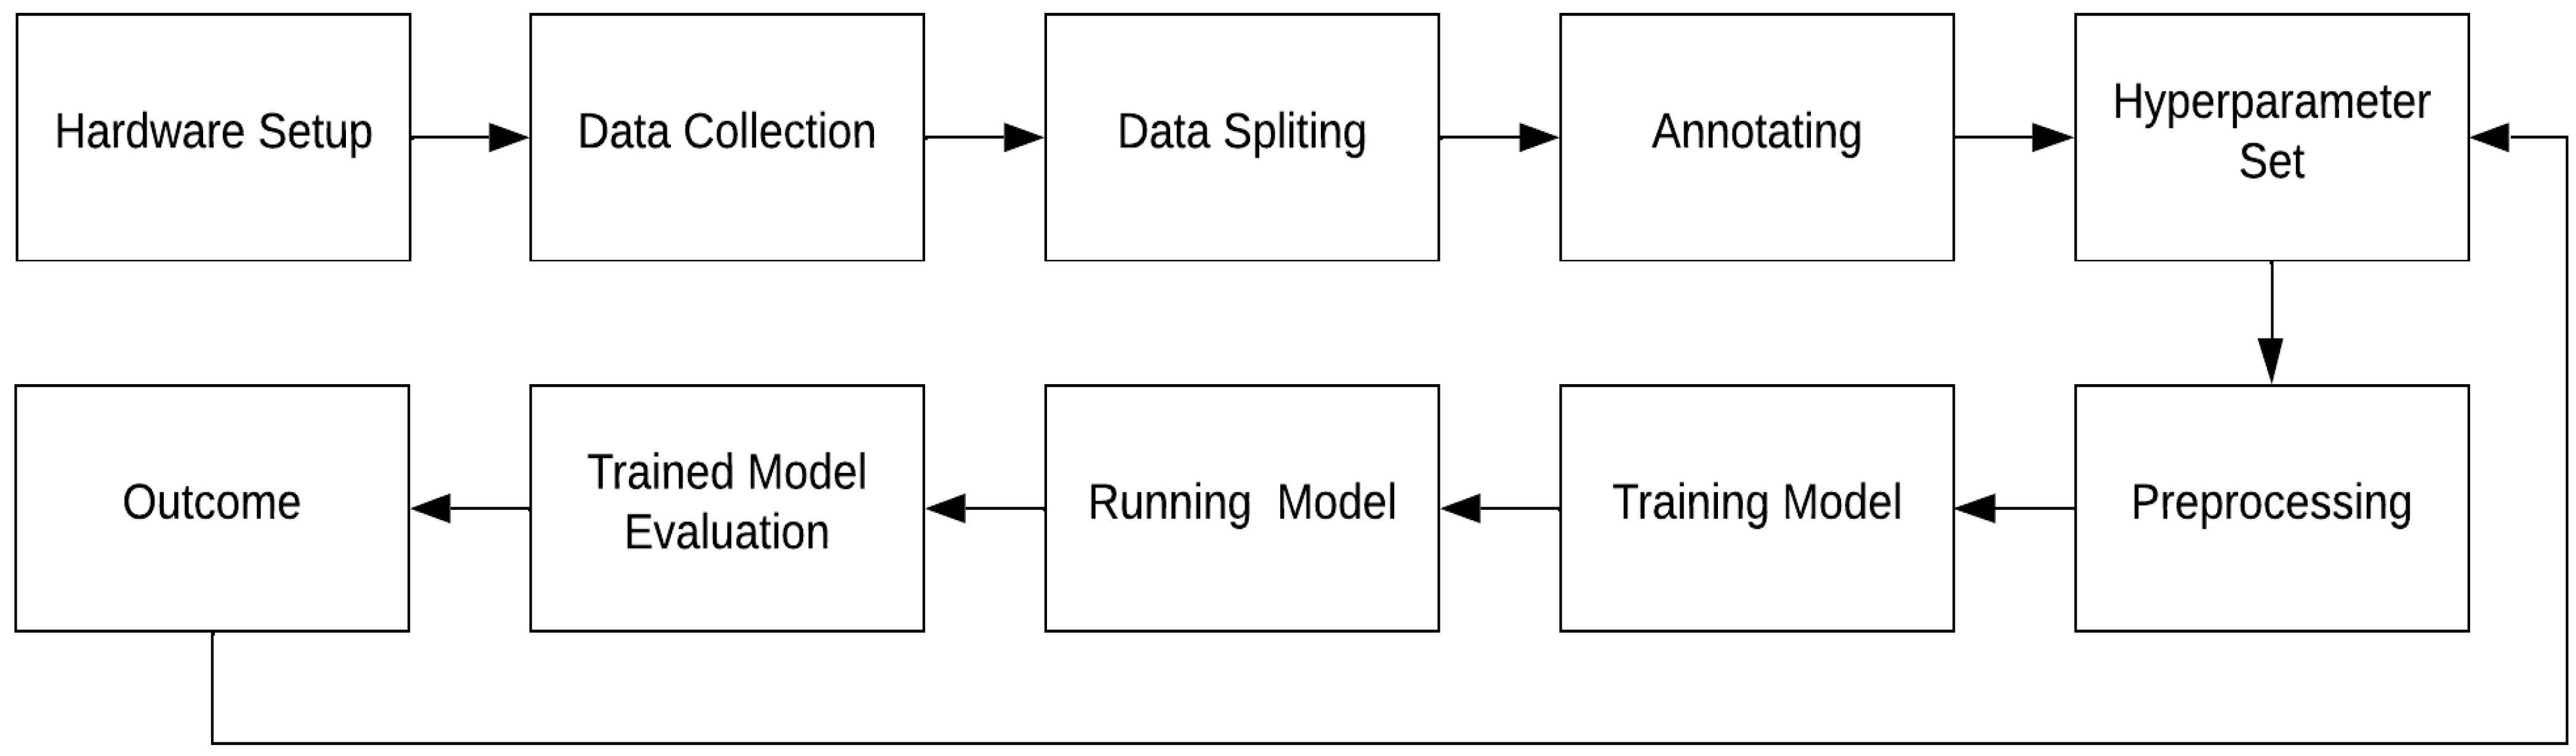
3. Methodology
3.1. Proposed Framework
3.2. Image Dataset Manipulation
3.3. Image Preprocessing
3.4. Mask R-CNN Model Selection
3.5. Default Hyperparameter Settings
4. Experimental Results and Analysis
4.1. Experimental Hardware Configuration
4.2. Ambient Light Conditions
4.3. Evaluation Criteria
4.4. Average Precision of the Model at Different Thresholds
4.5. The Precision–Recall Curve of the Model at Different Thresholds
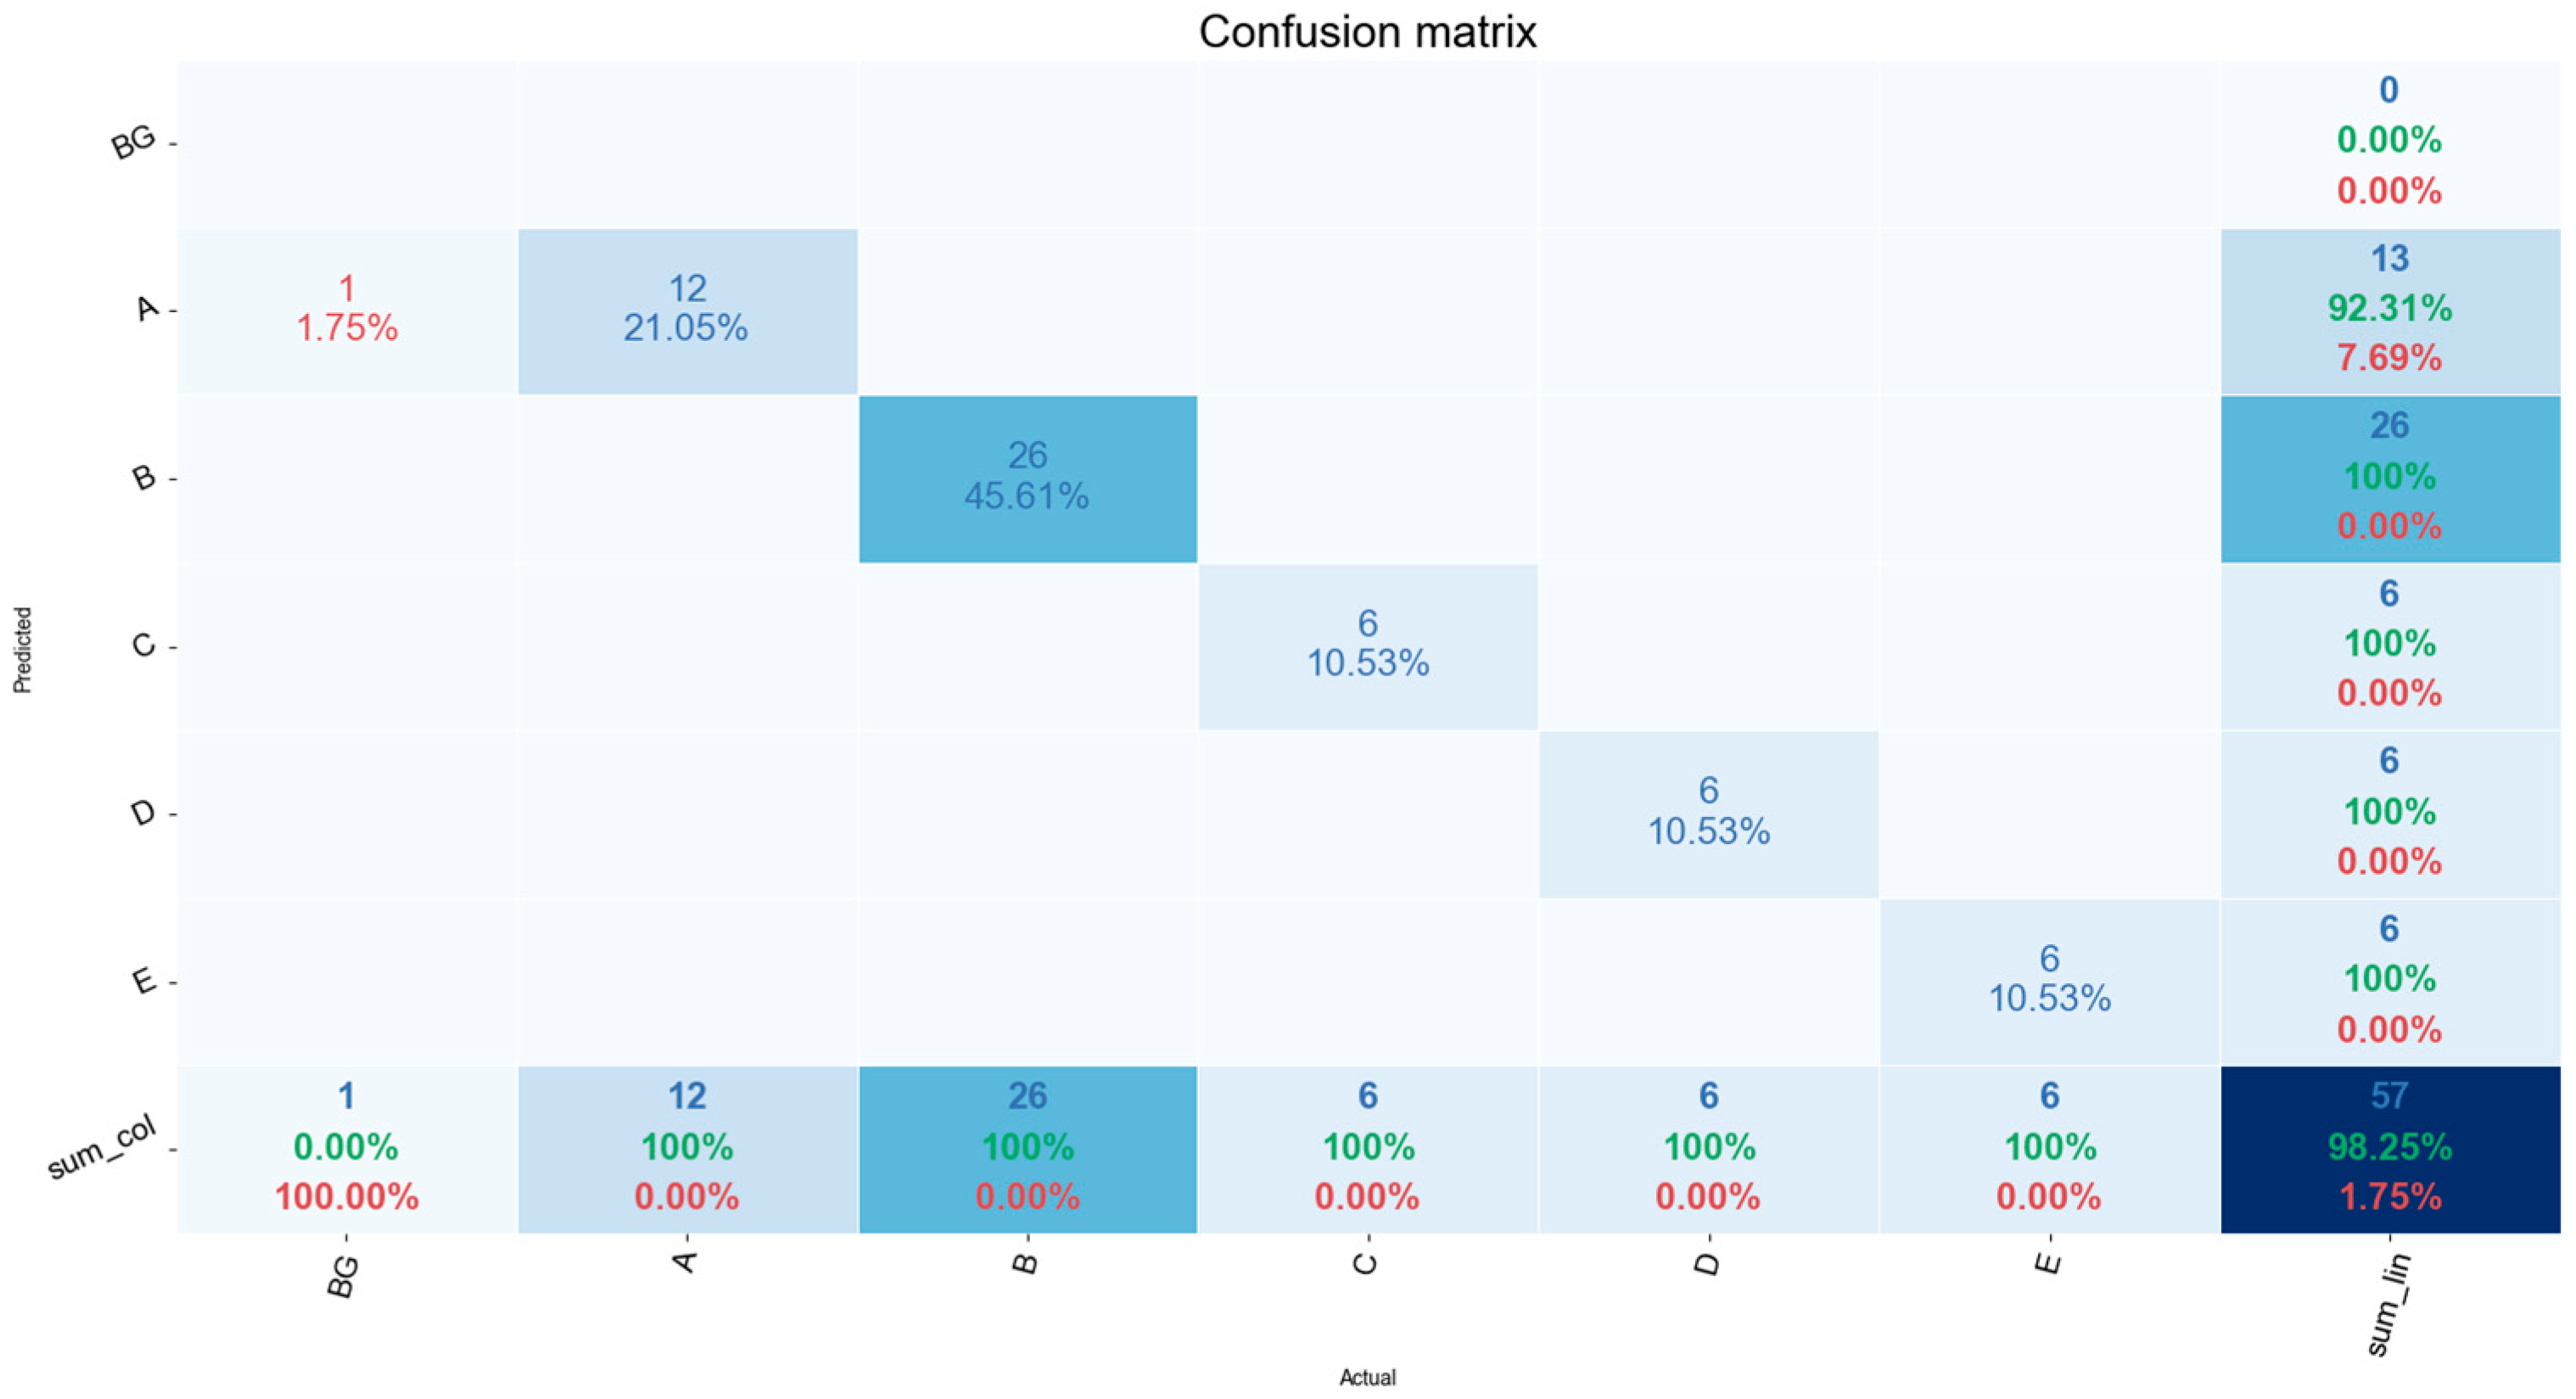
4.6. Confusion Matrix
4.7. Losses over Epochs Graph
4.8. Metric Evaluation Criteria
4.9. Analysis of Results
5. Conclusions
Supplementary Materials
Author Contributions
Funding
Data Availability Statement
Conflicts of Interest
References
- Fremont, V. The Digital Transformation of the Manufacturing Industry: Metamorphic Changes and Value Creation in the Industrial Network. Ph.D. Thesis, University of Gävle, Gävle, Sweden, 2021. [Google Scholar]
- Libes, D.; Shin, S.-J.; Woo, J. Considerations and Recommendations for Data Availability for Data Analytics for Manufacturing. In Proceedings of the 2015 IEEE International Conference on Big Data (Big Data), Santa Clara, CA, USA, 29 October–1 November 2015. [Google Scholar] [CrossRef]
- Weber, B.; Yarandi, H.; Rowe, M.; Weber, J. A Comparison Study: Paper-Based versus Web-Based Data Collection and Man-agement. Appl. Nurs. Res. 2005, 18, 182–185. [Google Scholar] [CrossRef]
- Wang, J.; Zhang, W.; Shi, Y.; Duan, S.; Liu, J. Industrial Big Data Analytics: Challenges, Methodologies, and Applications. arXiv 2018, arXiv:1807.01016. [Google Scholar]
- Wahi, M.M.; Parks, D.V.; Skeate, R.C.; Goldin, S.B. Reducing Errors from the Electronic Transcription of Data Collected on Paper Forms: A Research Data Case Study. J. Am. Med. Inform. Assoc. 2008, 15, 386–389. [Google Scholar] [CrossRef] [PubMed]
- Panko, R. Thinking Is Bad: Implications of Human Error Research for Spreadsheet Research and Practice. arXiv 2008, arXiv:0801.3114. [Google Scholar]
- Atkinson, I. Accuracy of Data Transfer: Double Data Entry and Estimating Levels of Error. J. Clin. Nurs. 2012, 21, 2730–2735. [Google Scholar] [CrossRef]
- Haffner, O.; Kučera, E.; Rosinová, D. Applications of Machine Learning and Computer Vision in Industry 4.0. Appl. Sci. 2024, 14, 2431. [Google Scholar] [CrossRef]
- Escamilla, L.D.V.; Gómez-Espinosa, A.; Cabello, J.A.E.; Cantoral-Ceballos, J.A. Maturity Recognition and Fruit Counting for Sweet Peppers in Greenhouses Using Deep Learning Neural Networks. Agriculture 2024, 14, 331. [Google Scholar] [CrossRef]
- Makris, S.; Alexopoulos, K.; Michalos, G.; Arkouli, Z.; Papacharalampopoulos, A.; Stavropoulos, P.; Fernández Martínez, A.; Muiños-Landin, S.; Gadeyne, K.; Meyers, B.; et al. Artificial Intelligence in Manufacturing White paper Prepared by the Artificial Intelligence in Manufacturing Network -AIM-NET. Available online: https://www.researchgate.net/publication/371805255_ARTIFICIAL_INTELLIGENCE_IN_MANUFACTURING_White_paper_Prepared_by_the_Artificial_Intelligence_in_Manufacturing_Network_-AIM-NET#fullTextFileContent (accessed on 1 April 2024).
- Balasubramanian, S. Integration of Artificial Intelligence in the Manufacturing Sector: A Systematic Review of Applications and Implications. 2023. Available online: https://osf.io/3xpwn/ (accessed on 1 April 2024).
- Buongiorno, D.; Caramia, D.; Di Ruscio, L.; Longo, N.; Panicucci, S.; Di Stefano, G.; Bevilacqua, V.; Brunetti, A. Object Detection for Industrial Applications: Training Strategies for AI-Based Depalletizer. Appl. Sci. 2022, 12, 11581. [Google Scholar] [CrossRef]
- Martínez, E.; del Pobil, A.P. Object Detection and Recognition for Assistive Robots: Experimentation and Implementation. IEEE Robot. Autom. Mag. 2017, 24, 123–138. [Google Scholar] [CrossRef]
- Hu, Y.; Liu, G.; Chen, Z.; Guo, J. Object Detection Algorithm for Wheeled Mobile Robot Based on an Improved YOLOv4. Appl. Sci. 2022, 12, 4769. [Google Scholar] [CrossRef]
- He, K.; Gkioxari, G.; Dollár, P.; Girshick, R. Mask R-CNN. In Proceedings of the 2017 IEEE International Conference on Computer Vision (ICCV), Venice, Italy, 22–29 October 2017; pp. 2961–2969. [Google Scholar] [CrossRef]
- Augustian, M. Neural Network Based Fault Detection on Painted Surface. Master’s Thesis, Umeå University, Umeå, Sweden, 2017. [Google Scholar]
- Molina, J.; Solanes, J.E.; Arnal, L.; Tornero, J. On the detection of defects on specular car body surfaces. Robot. Comput. Manuf. 2017, 48, 263–278. [Google Scholar] [CrossRef]
- Zhou, Q.; Chen, R.; Huang, B.; Liu, C.; Yu, J.; Yu, X. An Automatic Surface Defect Inspection System for Automobiles Using Machine Vision Methods. Sensors 2019, 19, 644. [Google Scholar] [CrossRef] [PubMed]
- Arjun, P.; Mirnalinee, T.T. Machine parts recognition and defect detection in automated assembly systems using computer vision techniques. Rev. Téc. Ing. Univ. Zulia 2016, 39, 71–80. [Google Scholar]
- Pérez, L.; Rodríguez, Í.; Rodríguez, N.; Usamentiaga, R.; García, D.F. Robot guidance using machine vision techniques in industrial environments: A comparative review. Sensors 2016, 16, 335. [Google Scholar] [CrossRef] [PubMed]
- Machefer, M. Mask R-CNN Refitting Strategy for Plant Counting and Sizing in UAV Imagery. Remote Sens. 2020, 12, 3015. [Google Scholar] [CrossRef]
- Huang, H.; Wei, Z.; Yao, L. A Novel Approach to Component Assembly Inspection Based on Mask R-CNN and Support Vector Machines. Information 2019, 10, 282. [Google Scholar] [CrossRef]
- Puliti, S.; Pearse, G.; Surovy, P.; Wallace, L.; Hollaus, M.; Wielgosz, M.; Astrup, R. FOR-Instance: A UAV Laser Scanning Benchmark Dataset for Semantic and Instance Segmentation of Individual Trees. arXiv 2023, arXiv:2309.01279. [Google Scholar]
- Xu, B.; Wang, W.; Falzon, G.; Kwan, P.; Guo, L.; Chen, G.; Tait, A.; Schneider, D. Automated Cattle Counting Using Mask R-CNN in Quadcopter Vision System. Comput. Electron. Agric. 2020, 171, 105300. [Google Scholar] [CrossRef]
- Naets, T.; Huijsmans, M.; Smyth, P.; Sorber, L.; Lannoy, G. A Mask R-CNN Approach to Counting Bacterial Colony Forming Units in Pharmaceutical Development. arXiv 2021, arXiv:2103.05337. [Google Scholar]
- Rong, M.; Wang, Z.; Ban, B.; Guo, X. Pest Identification and Counting of Yellow Plate in Field Based on Improved Mask R-CNN. Discret. Dyn. Nat. Soc. 2022, 2022, 1–9. [Google Scholar] [CrossRef]
- Calabrese, M.; Agnusdei, L.; Fontana, G.; Papadia, G.; Prete, A.D. Application of Mask R-CNN for Defect Detection in Printed Circuit Board Manufacturing. Res. Sq. 2023; preprint. [Google Scholar] [CrossRef]
- Ren, S.; He, K.; Girshick, R.; Sun, J. Faster R-CNN: Towards Real-Time Object Detection with Region Proposal Networks. arXiv 2016, arXiv:1506.01497. [Google Scholar] [CrossRef] [PubMed]
- Mohanapriya, S.; Natesan, P.; Mohana Saranya, S.; Sumithra, P.; Swathi, M.; Yoga Priya, P. Instance Segmentation Using Mask RCNN for Surveillance. In Proceedings of the 2022 6th International Conference on Computing Methodologies and Communication (ICCMC), Erode, India, 29–31 March 2022; pp. 235–241. [Google Scholar] [CrossRef]
- Hafiz, A.M.; Bhat, G.M. A Survey on Instance Segmentation: State of the Art. Int. J. Multimed. Inf. Retr. 2020, 9, 171–189. [Google Scholar] [CrossRef]
- Liu, J.; Yang, B.; Li, M.; Xu, D. Assessing Forest-Change-Induced Carbon Storage Dynamics by Integrating GF-1 Image and Localized Allometric Growth Equations in Jiangning District, Nanjing, Eastern China (2017–2020). Forests 2024, 15, 506. [Google Scholar] [CrossRef]
- Chen, Q.; Kang, Z.; Cao, Z.; Xie, X.; Guan, B.; Pan, Y.; Chang, J. Combining Cylindrical Voxel and Mask R-CNN for Automatic Detection of Water Leakages in Shield Tunnel Point Clouds. Remote Sens. 2024, 16, 896. [Google Scholar] [CrossRef]
- Lin, T.-Y.; Dollár, P.; Girshick, R.; He, K.; Hariharan, B.; Belongie, S. Feature Pyramid Networks for Object Detection. arXiv 2017, arXiv:1612.03144. [Google Scholar] [CrossRef]
- He, K.; Zhang, X.; Ren, S.; Sun, J. Deep Residual Learning for Image Recognition. arXiv 2015, arXiv:1512.03385. [Google Scholar] [CrossRef]
- Li, Y.; Song, B.; Kang, X.; Du, X.; Guizani, M. Vehicle-Type Detection Based on Compressed Sensing and Deep Learning in Vehicular Networks. Sensors 2018, 18, 4500. [Google Scholar] [CrossRef] [PubMed]
- Ronneberger, O.; Fischer, P.; Brox, T. U-Net: Convolutional Networks for Biomedical Image Segmentation. arXiv 2015, arXiv:1505.04597. [Google Scholar] [CrossRef]
- Redmon, J.; Farhadi, A. YOLOv3: An Incremental Improvement. arXiv 2018. [Google Scholar] [CrossRef]
- Bolya, D.; Zhou, C.; Xiao, F.; Lee, Y.J. YOLACT: Real-Time Instance Segmentation. arXiv 2019, arXiv:1904.02689. [Google Scholar] [CrossRef]
- Dutta, A.; Zisserman, A. The VIA Annotation Software for Images, Audio and Video. In Proceedings of the 27th ACM International Conference on Multimedia, Nice, France, 21–25 October 2019; Association for Computing Machinery: New York, NY, USA, 2019; pp. 2276–2279. [Google Scholar] [CrossRef]
- Zorcolo, A.; Escobar-Palafox, G.; Gault, R.; Scott, R.; Ridgway, K. Study of Lighting Solutions in Machine Vision Applications for Automated Assembly Operations. IOP Conf. Ser. Mater. Sci. Eng. 2011, 26, 012019. [Google Scholar] [CrossRef]
- Sivasubramanian, A.; Prakash, J.A.; Kumar, K.D.; Prashanth, V.R.; Sowmya, V.; Variyar, V.S. Object Detection Under Low-Lighting Conditions Using Deep Learning Architectures: A Comparative Study. In International Conference on Advances in Data Science and Computing Technologies; Springer Nature: Singapore, 2023; pp. 269–276. [Google Scholar] [CrossRef]
- Chen, W.; Shah, T. Exploring Low-Light Object Detection Techniques. arXiv 2021, arXiv:2107.14382. [Google Scholar] [CrossRef]
- Loh, Y.P.; Chan, C.S. Getting to Know Low-Light Images with The Exclusively Dark Dataset. arXiv 2018, arXiv:1805.11227. [Google Scholar] [CrossRef]
- Patel, O.; Maravi, Y.P.S.; Sharma, S. A Comparative Study of Histogram Equalization Based Image Enhancement Techniques for Brightness Preservation and Contrast Enhancement. Signal Image Process. Int. J. 2013, 4, 11–25. [Google Scholar] [CrossRef]
- Chen, C.; Chen, Q.; Xu, J.; Koltun, V. Learning to See in the Dark. arXiv 2018, arXiv:1805.01934. [Google Scholar] [CrossRef]
- COCO—Common Objects in Context. Available online: https://cocodataset.org/#detection-eval (accessed on 1 June 2024).


| Objects | Physical Dimensions | Train (80%) | Validate (10%) | Test (10%) | |||
|---|---|---|---|---|---|---|---|
| Class | (mm) | Images | ROI | Images | ROI | Images | ROI |
| A | 300 × 210 | 88 | 188 | 11 | 22 | 13 | 26 |
| B | 400 × 300 | 64 | 77 | 8 | 13 | 8 | 12 |
| C | 600 × 600 | 26 | 51 | 3 | 6 | 3 | 6 |
| D | 600 × 350 | 50 | 50 | 6 | 6 | 6 | 6 |
| E | 550 × 300 | 18 | 51 | 2 | 6 | 3 | 6 |
| Augmentation Applied | Units |
|---|---|
| Grayscale | 0.75 |
| Saturation | 10 |
| Brightness | 5 |
| Sharpness | 0.5 |
| Hyperparameters | Experiment Value |
|---|---|
| Epochs | 10 |
| Steps per Epoch | 100 |
| Weight Decay | 0.0001 |
| Learning Momentum | 0.9 |
| Learning Rate | AP50 (%) | AP75 (%) | AP90 (%) |
|---|---|---|---|
| 0.00002 | 95.05 | 91.45 | 91.28 |
| 0.0002 | 96.01 | 96.43 | 95.98 |
| 0.002 | 95.55 | 96.55 | 98.27 1 |
| Metric | Classes | Learning Rate 0.00002 | Learning Rate 0.0002 | Learning Rate 0.002 | ||||||
|---|---|---|---|---|---|---|---|---|---|---|
| AP50 (%) | AP75 (%) | AP90 (%) | AP50 (%) | AP75 (%) | AP90 (%) | AP50 (%) | AP75 (%) | AP90 (%) | ||
| Accuracy | 93.33 | 85.48 | 83.08 | 91.80 | 88.89 | 90.32 | 93.33 | 94.91 | 98.25 | |
| Error of Commission | BG | 0 | 0 | 0 | 0 | 0 | 0 | 0 | 0 | 0 |
| A | 7.69 | 7.69 | 7.69 | 7.69 | 7.69 | 14.29 | 7.69 | 7.69 | 7.69 | |
| B | 0 | 21.21 | 18.75 | 13.33 | 18.75 | 13.33 | 10.34 | 7.14 | 0 | |
| C | 0 | 0 | 0 | 0 | 0 | 0 | 0 | 0 | 0 | |
| D | 33.33 | 0 | 33.33 | 0 | 0 | 0 | 0 | 0 | 0 | |
| E | 0 | 0 | 0 | 0 | 0 | 0 | 0 | 0 | 0 | |
Disclaimer/Publisher’s Note: The statements, opinions and data contained in all publications are solely those of the individual author(s) and contributor(s) and not of MDPI and/or the editor(s). MDPI and/or the editor(s) disclaim responsibility for any injury to people or property resulting from any ideas, methods, instructions or products referred to in the content. |
© 2024 by the authors. Licensee MDPI, Basel, Switzerland. This article is an open access article distributed under the terms and conditions of the Creative Commons Attribution (CC BY) license (https://creativecommons.org/licenses/by/4.0/).
Share and Cite
Citlak, T.; Pillay, N. Real-Time Object Classification on an Enamel Paint Coating Conveyor Line Using Mask R-CNN. Automation 2024, 5, 213-229. https://doi.org/10.3390/automation5030013
Citlak T, Pillay N. Real-Time Object Classification on an Enamel Paint Coating Conveyor Line Using Mask R-CNN. Automation. 2024; 5(3):213-229. https://doi.org/10.3390/automation5030013
Chicago/Turabian StyleCitlak, Tarik, and Nelendran Pillay. 2024. "Real-Time Object Classification on an Enamel Paint Coating Conveyor Line Using Mask R-CNN" Automation 5, no. 3: 213-229. https://doi.org/10.3390/automation5030013
APA StyleCitlak, T., & Pillay, N. (2024). Real-Time Object Classification on an Enamel Paint Coating Conveyor Line Using Mask R-CNN. Automation, 5(3), 213-229. https://doi.org/10.3390/automation5030013