Article

Complex Scene Occluded Object Detection with Fusion of Mixed Local Channel Attention and Multi-Detection Layer Anchor-Free Optimization

School of Information, Beijing Wuzi University, Beijing 101149, China
*
Author to whom correspondence should be addressed.
Automation 2024, 5(2), 176-189; https://doi.org/10.3390/automation5020011
Submission received: 6 May 2024 / Revised: 4 June 2024 / Accepted: 15 June 2024 / Published: 17 June 2024

Abstract

:
The field of object detection has widespread applicability in many areas. Despite the multitude of object detection methods that are already established, complex scenes with occlusions still prove challenging due to the loss of information and dynamic changes that reduce the distinguishable features between the target and its background, resulting in lower detection accuracy. Addressing the shortcomings in detecting obscured objects in complex scenes with existing models, a novel approach has been proposed on the YOLOv8n architecture. First, the enhancement begins with the addition of a small object detection head atop the YOLOv8n architecture to keenly detect and pinpoint small objects. Then, a blended mixed local channel attention mechanism is integrated within YOLOv8n, which leverages the visible segment features of the target to refine the feature extraction hampered by occlusion impacts. Subsequently, Soft-NMS is introduced to optimize the candidate bounding boxes, solving the issue of missed detection under overlapping similar targets. Lastly, using universal object detection evaluation metrics, a series of ablation experiments on public datasets (CityPersons) were conducted alongside comparison trials with other models, followed by testing on various datasets. The results showed an average precision ([email protected]) reaching 0.676, marking a 6.7% improvement over the official YOLOv8 under identical experimental conditions, a 7.9% increase compared to Gold-YOLO, and a 7.1% rise over RTDETR, also demonstrating commendable performance across other datasets. Although the computational load increased with the addition of detection layers, the frames per second (FPS) still reached 192, which meets the real-time requirements for the vast majority of scenarios. Such findings indicate that the refined method not only significantly enhances performance on occluded datasets but can also be transferred to other models to boost their performance capabilities.

1. Introduction

Object detection in complex environments is an extremely important and challenging task within the realm of computer vision [1]. In such intricate settings, factors such as variations in lighting angles and intensity at different distances and positions, coupled with the diversity in observers’ viewpoints, observational angles, and distances, can induce intricate changes in brightness, shadows, contrast, position, and posture between the background and the target objects [2]. These elements contribute to low precision and poor timeliness in detecting and recognizing occluded targets under complex conditions, hindering the accurate interpretation of real-life scenarios. This limitation, in turn, restricts the development of scene understanding technology for intelligent applications and affects its widespread application in fields such as military navigation guidance, spatial intelligence surveillance, robot vision navigation, autonomous driving, and human–computer interaction [3,4,5,6].
Recent years have seen commendable performances by the YOLO (You Only Look Once) series in achieving object detection, with numerous studies focusing on the detection of occluded targets. The YOLOv8 model stands out as an anchor-free approach capable of directly forecasting the central points of targeted objects, making it suitable for the detection of obscured objects [7,8,9]. Chu et al. [10] addressed the issue of overlap between different targets under occlusion. They integrated a loss function based on Earth Mover’s distance, ensemble non-maximum suppression, and a refinement module into a network framework that combines feature pyramid networks with regions of interest alignment. This approach overcomes the limitation of single proposal boxes predicting a single target and introduces the CrowdDet network model, capable of predicting multiple targets from a single proposal box. Building on this, Shao et al. [11] used a residual network (ResNet) as a base and enhanced the detection rate for targets with incomplete feature information by integrating multi-scale feature pyramids for feature fusion. To further improve the detection of occluded objects, Yang et al. [12] proposed a combined Rep-GIoU loss by blending repulsion loss with GIoU loss. Luo et al. [13], instead of modifying the loss function directly from IoU, incorporated non-maximum suppression during the training process of their network model, considering both false positive and false negative non-maximum suppression losses. Huang et al. [14] used the visible part of the target as a criterion for prediction boxes, enhancing the algorithm’s performance under occlusion through non-maximum suppression operations on these predictions.
This paper conducts a comparative analysis of domestic and international research findings concerning the demand for object detection in complex scenes and addresses the issues present in current methods for detecting obscured objects in complex scenarios. It employs an improved version of the YOLOv8n model using mixed local channel attention and anchor-free optimization layers. We have made improvements by incorporating a small target detection layer, integrating the MLCA attention mechanism, and employing the Soft-NMS bounding box optimization algorithm. The addition of the small target detection layer incurs an extra computational load, which will be described in the experiments. The effectiveness of the improvements is analyzed using a selected dataset, followed by ablation experiments, comparative trials, and multi-model testing on the refined model.

2. Related Work

2.1. YOLOv8

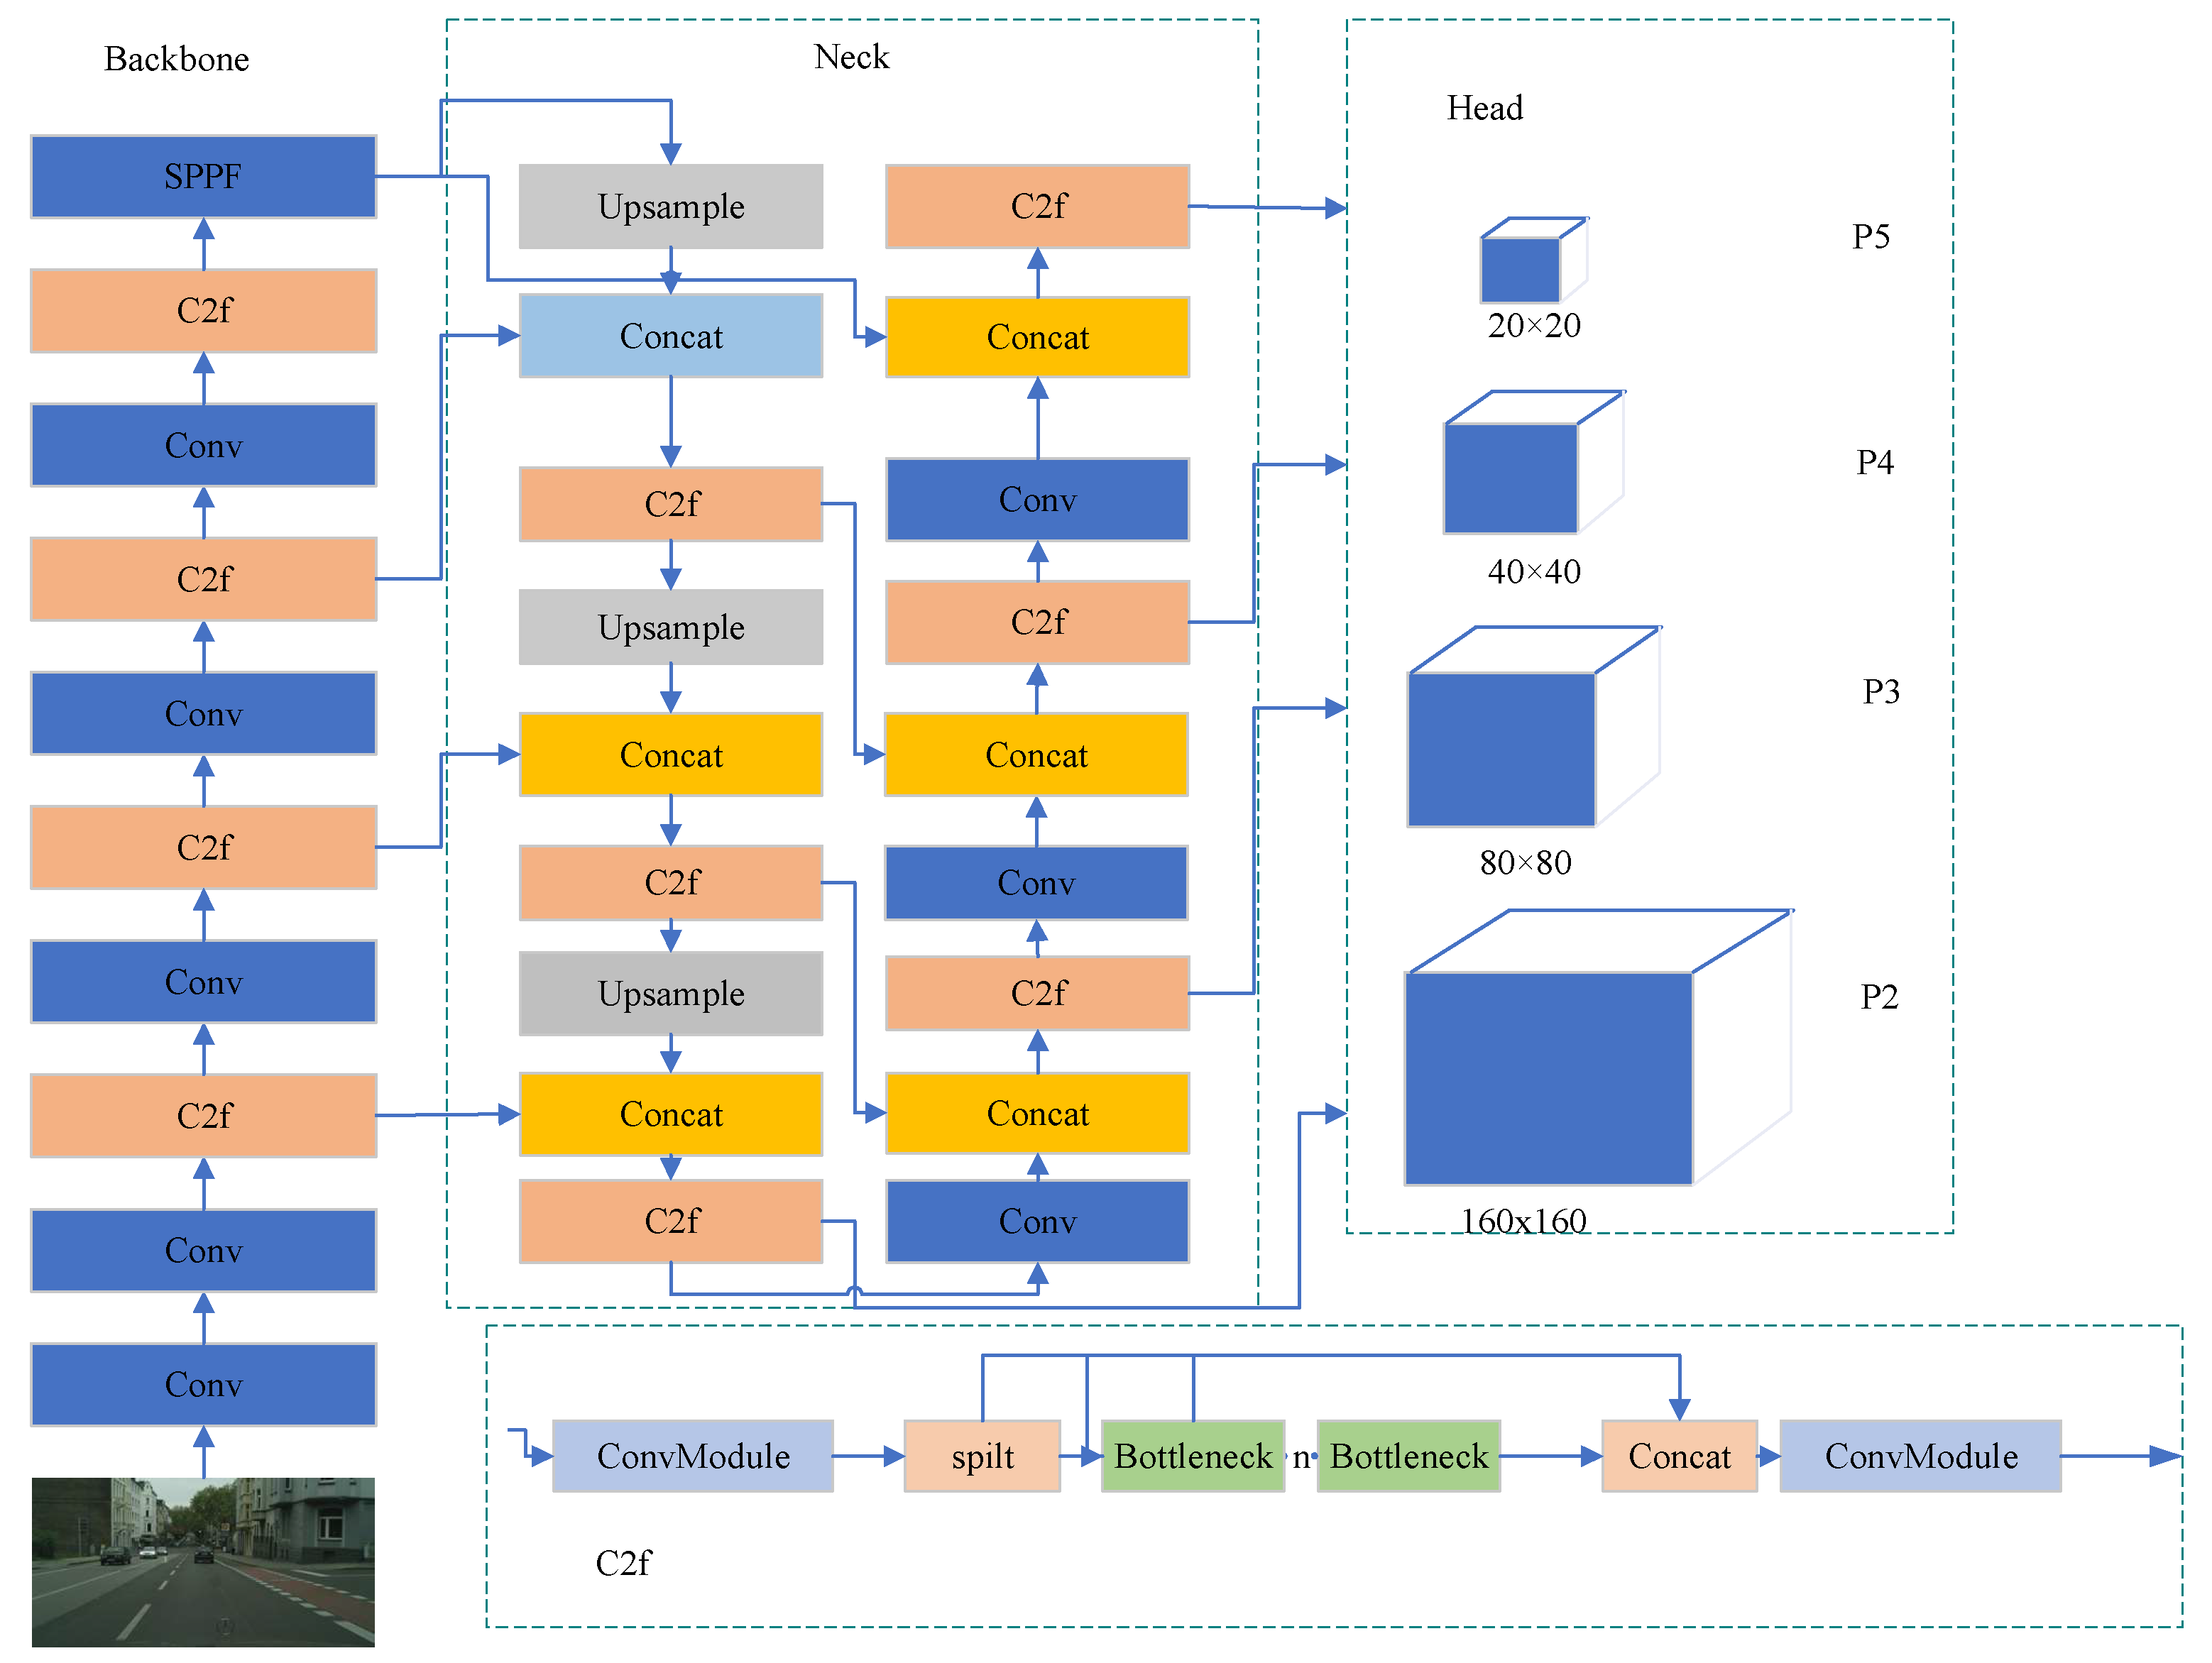
Released in January 2023 by Ultralytics (Los Angeles, CA, USA), YOLOv8 employs a backbone network similar to YOLOv5 (with the key difference being that YOLOv8 replaces YOLOv5’s CSPLayer with the C2f module; Figure 1 illustrates the detailed architecture of YOLOv8). It adopts an anchor-free approach utilizing the CIoU (complete IoU) [15] and DFL (distance focal loss) [16] loss functions to calculate bounding box losses [17]. YOLOv8 comes in five different sizes: YOLOv8n, YOLOv8s, YOLOv8m, YOLOv8l, and YOLOv8x.

2.2. Mixed Local Channel Attention

Attention mechanisms originally emerged in the field of natural language processing, and computer vision researchers subsequently developed attention models that could be seamlessly integrated into large networks [18,19,20,21]. Today, attention is among the most widely used components in computer vision, empowering neural networks to emphasize salient elements while suppressing irrelevant ones. Commonly used channel attention mechanisms include SE (squeeze and excitation) [22], ECA (efficient channel attention) [23], and coordinate attention [24]. However, SE and ECA disregard the spatial information of individual channels, considering only the global relationships between channels. Incorporating spatial information via the local SE stacking approach, on the other hand, leads to excessive parameters. Channel dimension reduction can mitigate the parameter count and computational cost of the module to some extent, but this comes at the expense of accuracy. To strike a balance between the performance and complexity of channel attention mechanisms and enhance the performance of object detection networks, researchers have proposed a lightweight mixed local channel attention mechanism (MLCA) that combines channel information with spatial information and employs one-dimensional convolution to reduce computational cost and parameter count [25].
The principle of MLCA is illustrated in Figure 2 below. The asterisk (*) represents multiplication. The input feature vector undergoes two pooling operations. As shown in Figure 2, the input is transformed into a 1* C * ks * ks vector by first extracting local spatial information via local pooling, where ks denotes the number of blocks in either the W or the H dimension. Two branches are used to convert the input into a one-dimensional vector, with the first branch capturing global information and the second branch capturing local spatial information. After passing through a Conv1d (one-dimensional convolution) layer, the original resolution of the two vectors is restored via anti-pooling, followed by information fusion to achieve the goal of mixed attention. In Figure 2, Conv1d represents a one-dimensional convolution, and the kernel size k is proportional to the channel dimension C, indicating that when capturing local cross-channel interaction information, only the relationship between each channel and its k adjacent channels is considered. The choice of k is determined by Equation (1) [23], shown below:
k = Φ ( C ) = | log 2 ( C ) γ + b γ | odd
where C represents the number of channels, k denotes the size of the convolutional kernel, and γ and b are both hyperparameters with default values of 2. The odd subscript indicates that k should be odd-valued; if k is even, 1 is added to it.
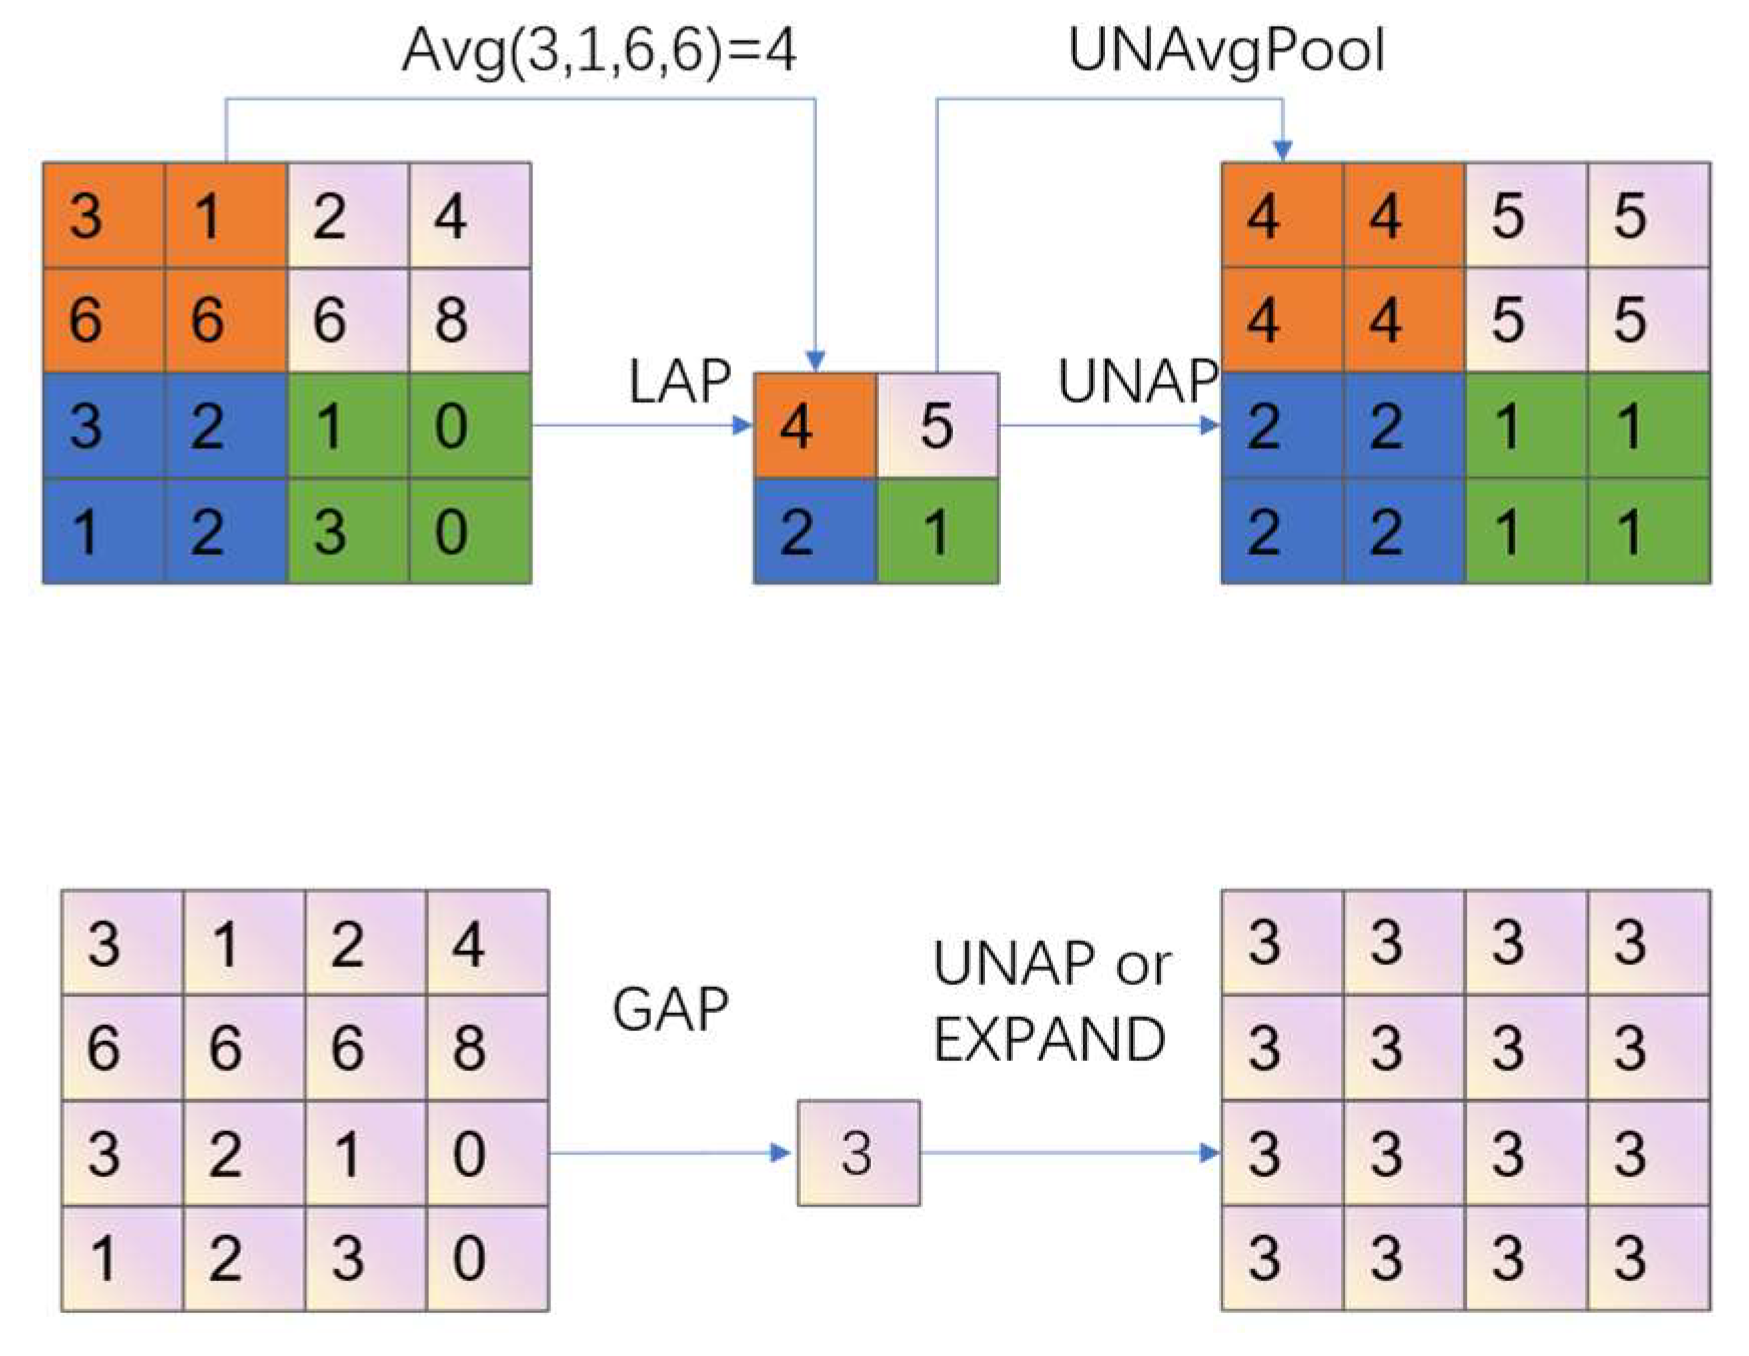
Figure 3 depicts the GAP, LAP, and UNAP relationships in the MLCA structure. The GAP (Global Average Pooling) output size 1 is feature map 1 * 1; LAP (Local Average Pooling ) divides the whole feature map into k * k patches and then performs k * k average pooling on each patch. UNAP (anti-average pooling) mainly focuses on the properties of the graph and extends to the desired size. UNAP can be implemented by an adaptive pool whose output size is equal to the size of the source feature map. When extending LAP, when the size is not 1 * 1, the operation cannot be extended directly, and the feature map must be returned to its original size using the UNAP procedure. As shown in Figure 4, UNAP restores the resolution of the original feature map through the parameters of the anti-pooling operation and then fills the pooling result in the corresponding position.

2.3. Gaussian Penalty Function Soft Non-Maximum Suppression

The traditional non-maximum suppression (NMS) algorithm is a post-processing method in object detection. The idea is, if there are multiple prediction boxes corresponding to the same object, only the prediction box with the highest score is selected, and the rest of the prediction boxes are discarded [26]. Suppose that the current box with the highest score is M, and for the box b i with a score of s i in another category, the traditional NMS algorithm can be calculated as follows:
s i = { s i , iou ( M , b i ) < N t 0 , iou ( M , b i ) N t
where N t is the set IOU threshold. The calculation method of the Soft-NMS algorithm can be expressed as follows:
s i = { s i , i o u ( M , b i ) < N t s i ( 1 i o u ( M , b i ) ) , i o u ( M , b i ) N t
Comparing Equations (2) and (3), it can be seen that in the traditional algorithm, if the IoU of a lower-scoring bounding box with the highest-scoring bounding box is greater than the threshold, the lower-scoring bounding box is directly discarded. In contrast, the Soft-NMS algorithm [27] retains and reduces the score of the lower-scoring bounding box instead of setting it directly to zero. The final bounding box score in the Soft-NMS algorithm depends on both the original score and the IoU result, resulting in a linear decay of the original score. However, when using the above formula to calculate Soft-NMS, the bounding box score experiences a jump when the IoU exceeds the threshold. The Gaussian penalty function Soft-NMS algorithm for the bounding box score (as shown in Equation (4)) effectively addresses this jump problem by ensuring that when processing new bounding boxes, the changes to their scores are relatively small, thereby giving them another chance to be recognized as correct detections in subsequent calculations.
s i = s i e i o u ( M , b i ) 2 σ , b i D

2.4. Dataset/Experimental Environment and Evaluation Metrics

Humans are one of the most abundant and multifaceted targets in nature, giving rise to complex scenarios. To better adapt to the detection of occluded objects in various complex environments, the CityPersons dataset (with 2975 training images, 500 validation images, and 1575 testing images), which can be trained locally, is employed as the dataset for ablation experiments, comparative experiments, and performance evaluation.
Experimental hardware environment: CPU: AMD Ryzen 7 5800X 8-Core Processor, 32 GB RAM, GPU: Nvidia GeForce RTX 3060 12 GB RAM (The AMD Ryzen 7 5800X processor’s silicon die is fabricated by TSMC (Taiwan Semiconductor Manufacturing Company), which is headquartered in Hsinchu, Taiwan. As for the Nvidia GeForce RTX 3060, Nvidia is headquartered in Santa Clara, CA, USA).
Experimental software environment: operating system: Ubuntu 22.04, programming language: Python 3.8, deep learning framework: Pytorch 1.13.1, CUDA version: 11.7.
Experimental baseline model and parameters: model: YOLOv8n; model parameters: pretrained weights trained on the COCO dataset (yolov8n.pt).
Evaluation metrics: precision, recall, mean average precision (AP), and mean average precision for multiple categories (mAP).

3. Model Building

Based on the relevant work, this article proposes a series of enhancements to the YOLOv8n model to bolster its capability in detecting occluded objects in natural scenes. The improvements encompass the integration of attention mechanisms, the addition of detection layers, and the optimization of anchor boxes. To enhance the model’s ability to localize occluded objects, the article introduces a novel MLCA mechanism that leverages image features. Recognizing the challenge of detecting smaller occluded objects, the article suggests augmenting the YOLOv8n’s head network with an additional detection layer specifically tailored for small objects. This layer is intended to capture and preserve the finer details that are often critical for detecting smaller objects, which may be more prone to occlusion. To address the challenge of overlapping objects, the article introduces Soft-NMS into the anchor-free framework. This algorithm refines the detection process by attenuating the detection scores of bounding boxes that overlap significantly with higher-scoring boxes, rather than outright discarding them as in traditional NMS. This approach helps to maintain the detection of occluded objects that might otherwise be suppressed.
The resulting detection algorithm, with its enhanced network structure, is depicted in Figure 5. This comprehensive set of improvements is aimed at significantly advancing the state of the art in occluded object detection, providing a robust and efficient solution for real-world applications where occlusions are commonplace.

3.1. Adding a Small Target Detection Head and Sampling Layer

In complex scenarios, due to occlusion, large objects can transform into small objects, which often occupy fewer pixels in an image and are more prone to being overlooked or misjudged. To improve the detection rate of occluded objects, an additional detection layer is added to the detection head of YOLOv8n, which enhances the detection rate of small objects, thereby enabling the improved model to detect occluded objects more effectively.
In the backbone network of the YOLOv8n version, the head is the output end, and in the head, there are only P3, P4, and P5 layers (the P2 layer is not used in any of the five versions of YOLOv8). From P3⟶P4⟶P5, the output receptive field continues to increase, with the detected targets ranging from small⟶medium⟶large. To detect small, occluded objects, a specific P2 layer needs to be added at the input end of P3. The P2 layer model has fewer convolutional operations and a larger feature map size, which is beneficial for small object recognition. To make the detected target features more prominent, one upsampling operation, three C2f modules, two Conv modules, and three concat operations are added to YOLOv8n. Additionally, the small object detection layer P2 is added at the forefront, and after splicing the shallower feature map with the deeper feature map, the detection is performed. The structure after adding the module is shown in Figure 6.

3.2. Fusing Mixed Local Channel Attention

As can be seen from Figure 2 and Figure 3, the structural relationship between LAP, GAP, and UNAP in MLCA is as follows:
LAP⟶(C,Ks,Ks)⟶GAP⟶(1,1,C)⟶Conv1d⟶(1,1,C)⟶UNAP. When expanding LAP, since the size is not 1 * 1, the operation cannot be expanded directly. The UNAP process must be used to return the feature map to its original size. Therefore, it is necessary to use UNAP in the following process:
LAP⟶(C,Ks,Ks)⟶GAP⟶(1,1,C)⟶Conv1d⟶(1,1,C)⟶UNAP to restore the resolution of the original feature map through the parameters of the pooling operation and then fill in the pooled results in the corresponding locations. In other words, “reshape” needs to be added in the LAP⟶GAP⟶UNAP process. The structure of the extended MLCA model is shown in Figure 7 below.
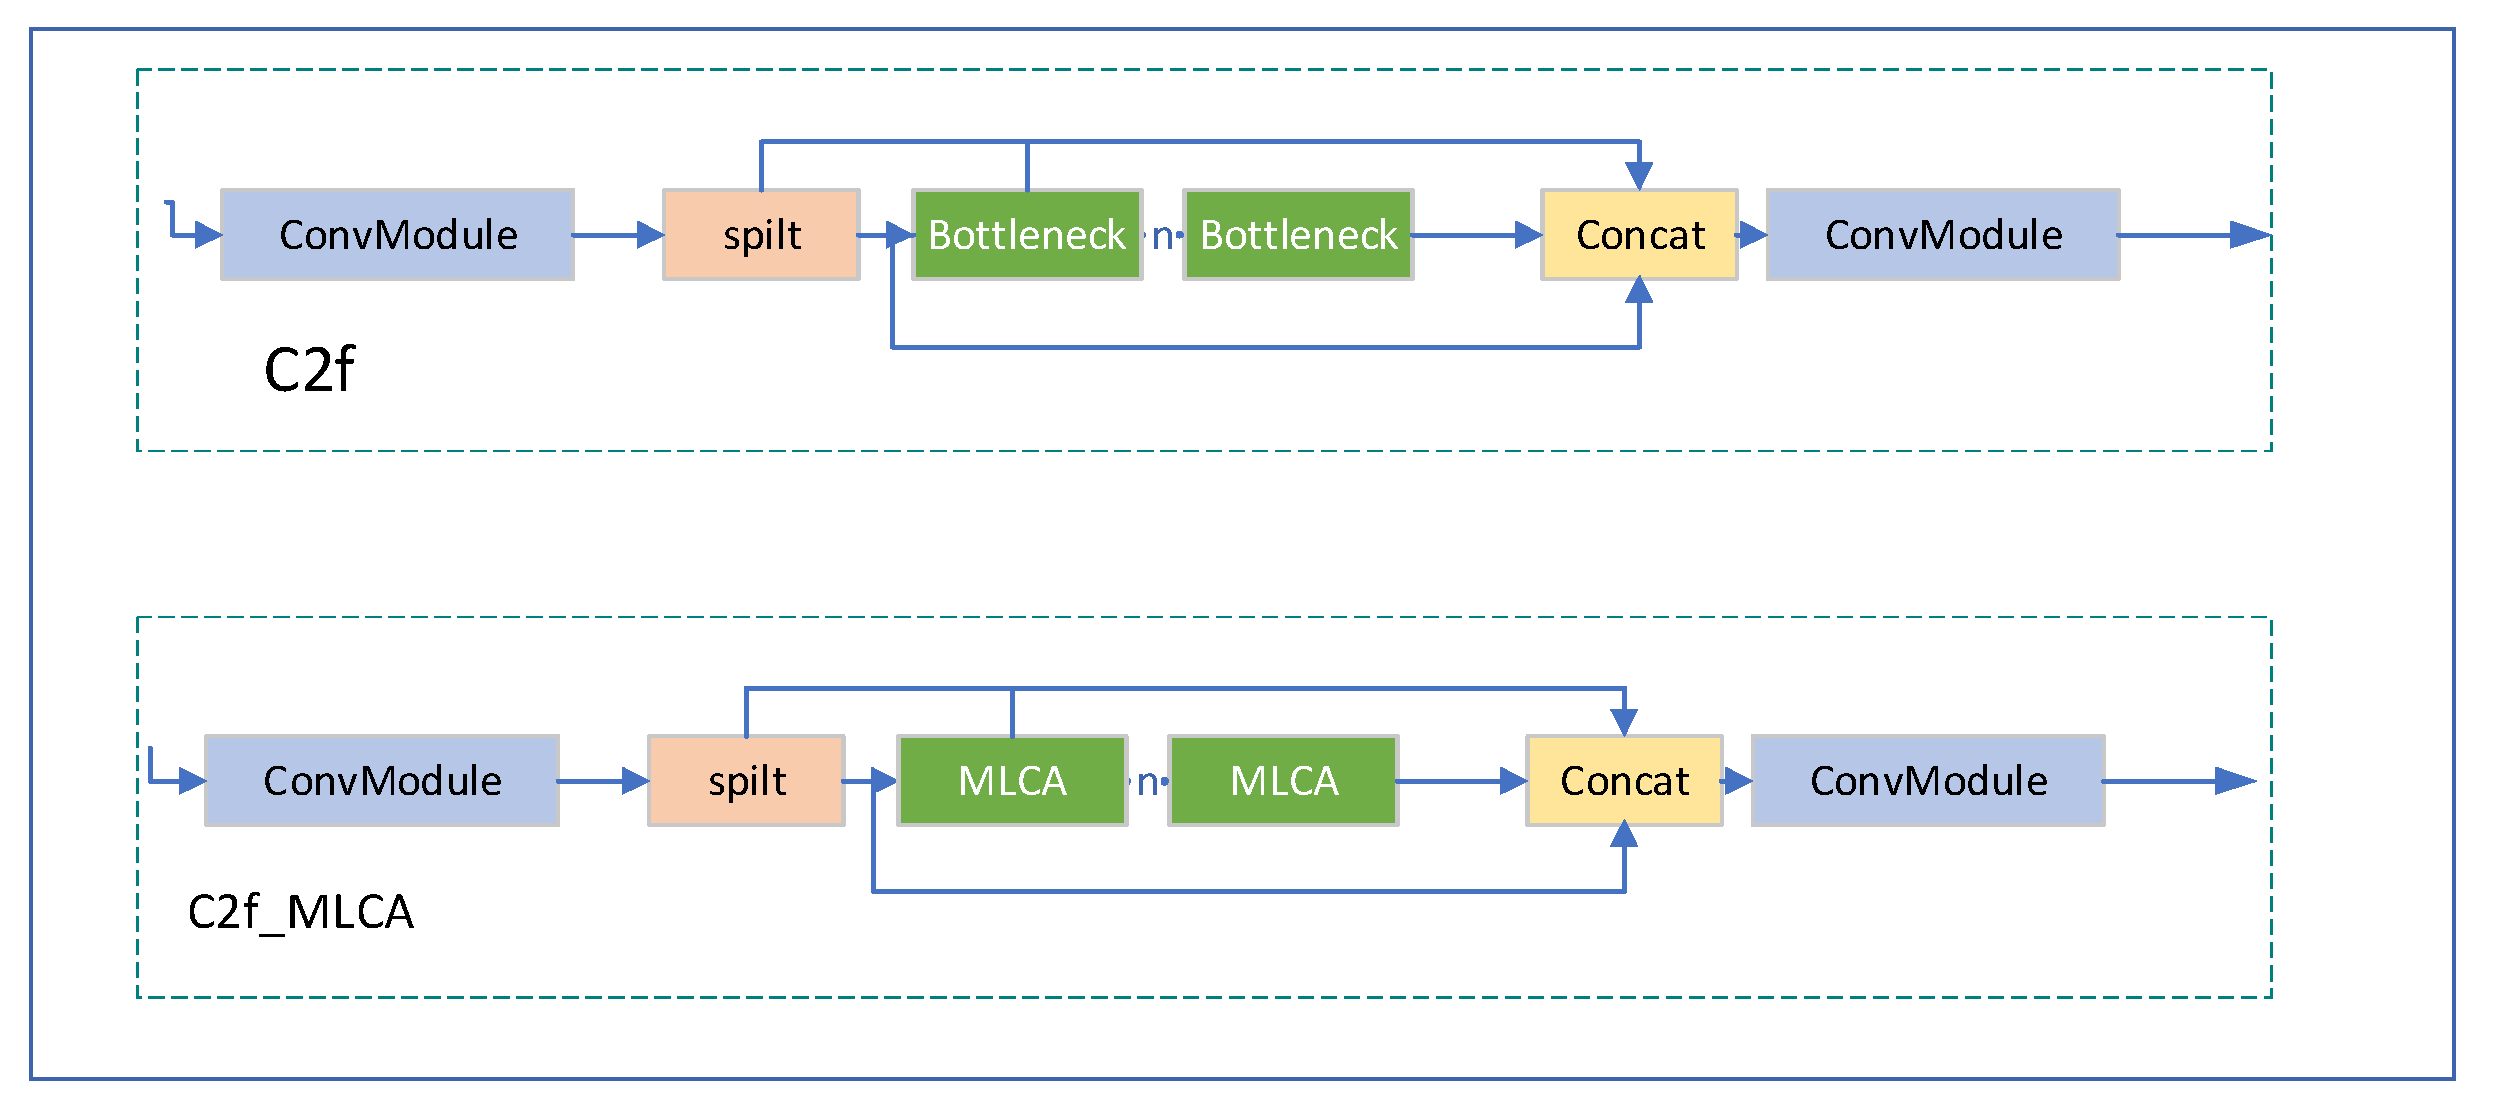
As shown in Figure 1, integrating the extended MLCA into YOLOv8n relies on the network structure of YOLOv8n. The simplest way to integrate it is to add it directly to the backbone. Alternatively, the extended MLCA can be combined with the C2f module in YOLOv8n to form a C2f-MLCA module (as shown in Figure 8, where the structure of the MLCA is shown in Figure 7). In this way, the integration of the mixed local channel attention MLCA can replace the C2f module in the backbone part of YOLOv8n with the C2f_MLCA module, or the C2f module in the neck part with the C2f_MLCA module, or both the C2f modules in the backbone and neck parts with the C2f_MLCA module.
Therefore, by replacing the C2f module in the neck part of YOLOv8n with C2f_MLCA; adding an upsampling operation, three C2f modules, two Conv modules, and three concat operations to YOLOv8n; and adding the small target detection layer P2 in front of P3, the improved model structure is as shown in Figure 5 below.

3.3. Gaussian Penalty Function for Optimizing Soft-NMS Occluded Object Candidate Boxes

YOLOv8 is anchor-free, and during the detection process, the target candidate box only needs to be provided after the center of the target has been determined. For occluded targets, there will be many cases of overlapping objects of the same category. Therefore, the Gaussian penalty function Soft-NMS algorithm (as shown in Equation (4)) is used to optimize the candidate boxes of the occluded targets.

4. Experimental Results and Analysis

4.1. Ablation Experiments

Using the standard evaluation metrics of precision, recall, and mean average precision (mAP) on the experimental environment and dataset in Section 2.4, ablation experiments on the model improvements and comparative experiments on the models are conducted.
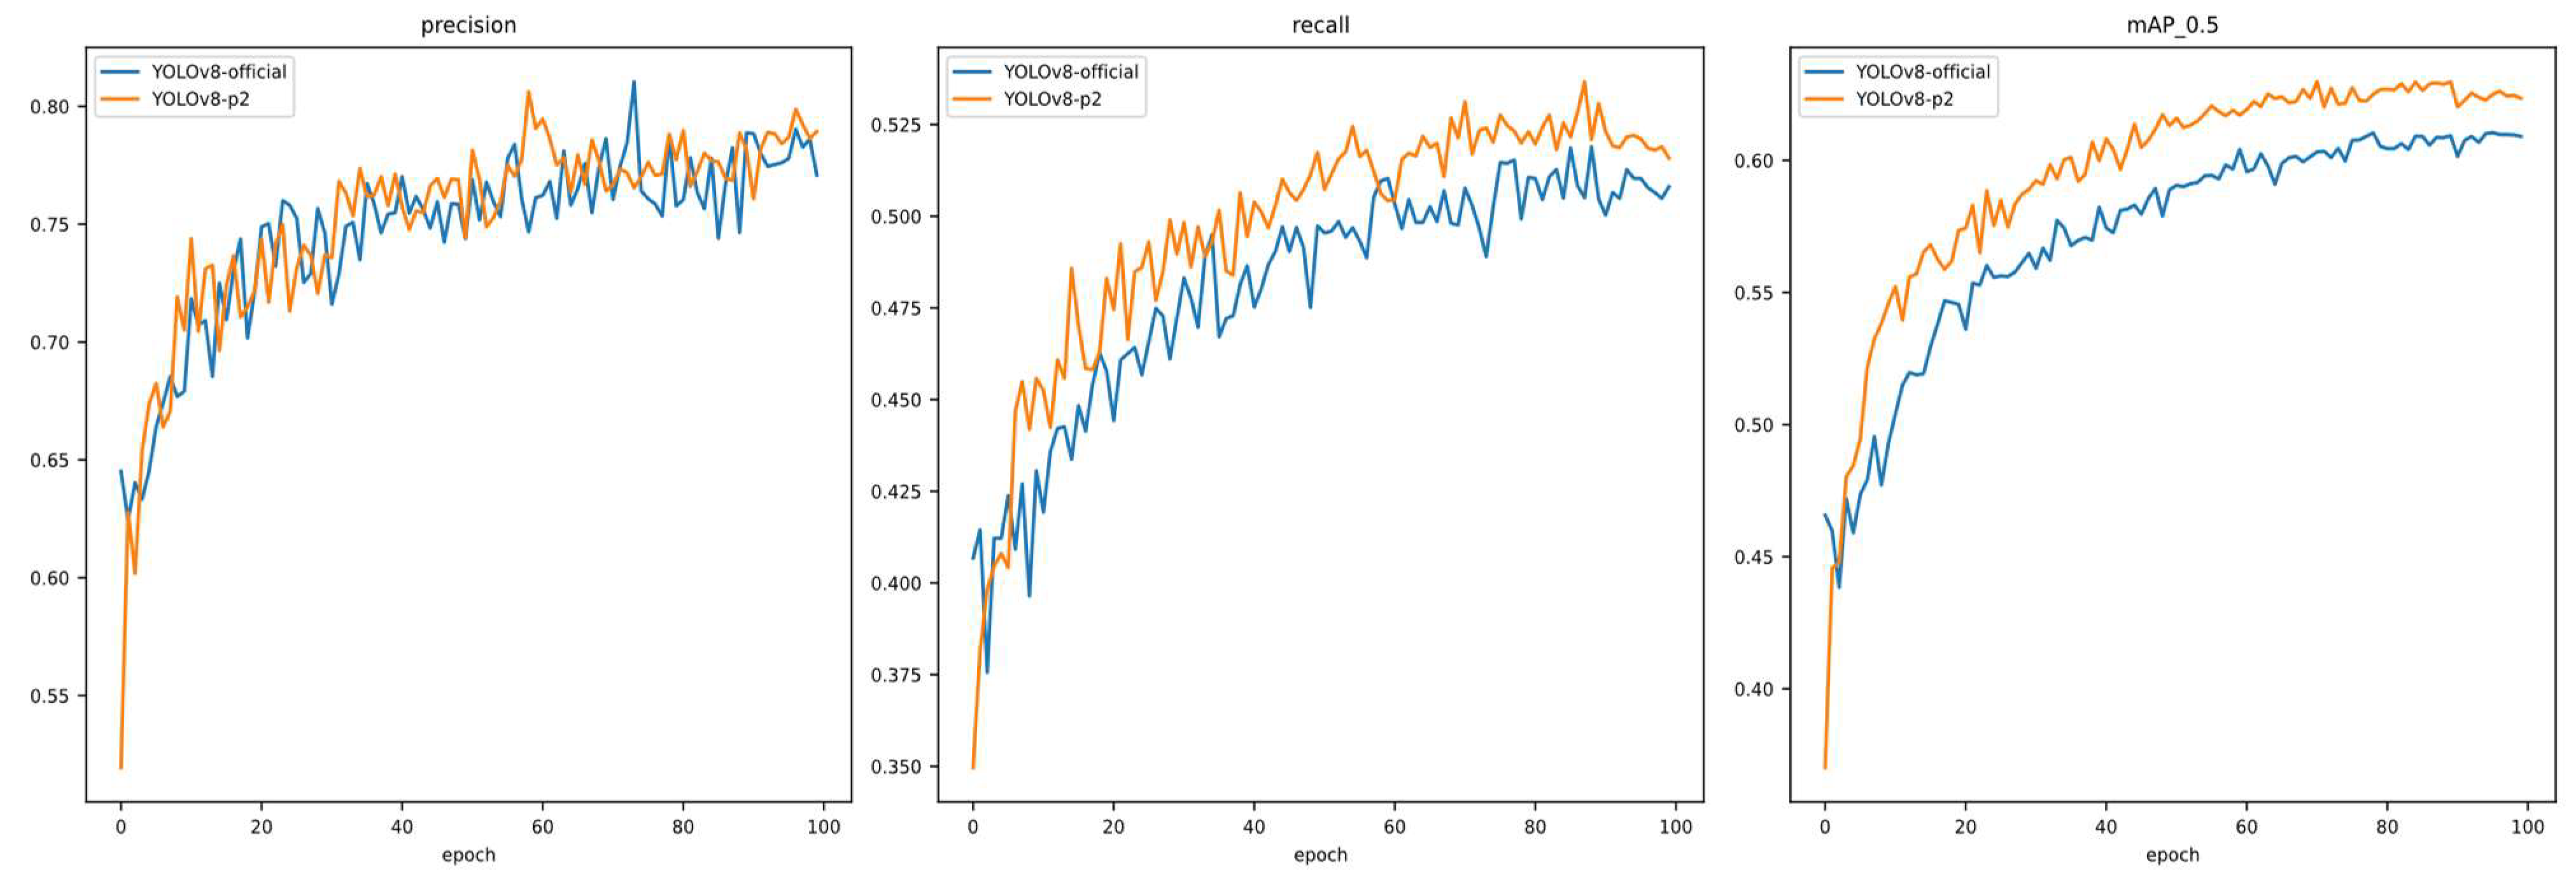
The comparison graphs for mAP, precision, and recall after adding the P2 layer and C2f are shown in Figure 9. As can be seen from the figure, after adding the P2 layer, all three performance indicators (mAP, precision, and recall) are significantly higher than those of the official YOLOv8n model. The experimental results demonstrate the superior performance of the model after the addition of the detection head.
Under the same environment, model parameters, and experimental data, the integration methods are analyzed separately. Figure 10 shows the comparison of mAP, precision, and recall for YOLOv8n combined with MLCA. Among them, YOLOv8-add-mlca represents directly adding MLCA to YOLOv8n, YOLOv8-mlca-neck represents integrating C2f_MLCA to the neck, YOLOv8-mlca-backbone represents integrating C2f_MLCA to the backbone, and YOLOv8-mlca-all represents integrating C2f_MLCA to both the backbone and the neck. Figure 11 shows the [email protected] results for integrating the MLCA module at different positions. As can be seen from Figure 10, integrating the C2f_MLCA module to the neck of YOLOv8n yields the best results, indicating that MLCA can enhance the ability to fuse features in the neck structure.
Figure 12 shows the results before and after using the Gaussian penalty function Soft-NMS algorithm (the yellow line YOLOv8-soft represents YOLOv8 using Soft-NMS, and the blue line represents the official YOLOv8). It can be seen that after using the Soft-NMS algorithm, there is a relatively large change in the precision, and the mAP result is significantly higher than the official YOLOv8 algorithm without using the Soft-NMS algorithm. The performance evaluation indicator in Figure 12 intuitively shows that using the Soft-NMS algorithm can effectively improve the detection rate of occluded and overlapping targets.
Under the given experimental environment, the comparative results of the ablation experiments are shown in Figure 13. Figure 13 shows the comparative results of the evaluation metrics mAP, precision, and recall for the single improvements of adding a small target detection head and sampling layer, integrating the mixed local channel attention MLCA into the neck network, and optimizing the occluded target candidate boxes with the Gaussian penalty function Soft-NMS, as well as for the overall improvement after integration. As can be seen from the figure, the performance indicators of the model with the overall improvement after integration are significantly higher than those of the models with single improvements. To further verify the model’s performance, experiments on accuracy and speed are conducted on the validation set of the dataset, and the experimental results are shown in Table 1. As can be seen from Table 1, the mAP value of the model after the overall improvement is much higher than that of the models with single improvements. It can also be seen from the detection speed (FPS) indicator in Table 1 that the model after the overall improvement can meet the requirements of common complex application scenarios. To visually demonstrate the change in computational load after adding detection layers, we use GFLOPs as the evaluation metric. GFLOPs stands for “giga floating-point operations per second”, indicating a billion floating-point operations per second. In the fields of deep learning and computer vision, GFLOPs is commonly used to measure the computational complexity of neural network models during prediction (inference). In Table 1, before adding detection layers, the GFLOPs is 8.2, and after adding detection layers, it increases to 12.4. The results show that the computational load does indeed increase, leading to a decrease in FPS from 243 to 192. However, this still satisfies the real-time requirements for the vast majority of scenarios, such as the requirement for autonomous driving on highways, which expects an FPS of 120.
Overfitting refers to a scenario where a machine learning or deep learning model exhibits exceptional performance in the training dataset but underperforms in the validation and test datasets. During the training process, it is essential to monitor the model’s error in both the training and validation sets. If the training error continues to decrease while the validation error begins to increase, it may indicate that overfitting is occurring. Figure 14 presents a comparative diagram of the training and validation error loss functions. The results indicate that all loss functions are on a decreasing trend and are converging gradually, which can suggest that the model is not overfitting.
To further verify the application performance of the improved model, the model after the overall improvement is compared with other existing mature models. The experimental comparison results in Table 2 show that in terms of memory, the YOLO series models are much smaller than the RCNN and DETR series; in terms of detection speed (FPS), as shown in the FPS column of Table 2, the YOLO series is faster than the RCNN and DETR series, and among all the YOLO series models, the detection speed of the model after the overall improvement can reach 128; in terms of accuracy ([email protected]), as analyzed in the [email protected] column of Table 2, Faster RCNN has the closest mAP value to the model after the overall improvement, but it is still 1% lower than the [email protected] of the model after the overall improvement. This shows that the model after the overall improvement can not only guarantee real-time performance but also improve accuracy while achieving a balance between accuracy and detection speed.

4.2. Model Testing

Finally, to test the adaptability of the model after the overall improvement, the model is tested on different datasets. The CityPersons dataset, the Mar-20 remote sensing aircraft dataset, and the CORS-ADD dataset are selected, respectively. The CityPersons dataset is the dataset used for the model experiments and analysis in this article; the Mar-20 dataset is a remote sensing image military aircraft target recognition dataset. The data collection in this dataset are affected by factors such as illumination, occlusion, and even atmospheric scattering. The same model has large intra-class differences. Therefore, the Mar-20 dataset can be used as a special type of complex scene occlusion target dataset; the CORS-ADD dataset is an aircraft target detection dataset in a complex remote sensing scene. After the overall improvement, the model is tested on occlusion target detection on the CityPersons dataset, the Mar-20 remote sensing aircraft dataset, and the CORS-ADD dataset. Labeling the occluded detection targets in the image is the most intuitive testing method. In Figure 15, Figure 16, and Figure 17 from left to right are the original test image, the YOLOv8-official test result image, and the improved model test result image, respectively. As can be seen, in the CityPersons dataset, the improved model detects more pedestrians and does not miss any; in the Mar-20 dataset, the improved model detects the occluded aircraft in the upper left corner; and in the CORS-ADD dataset, the improved model detects an inconspicuous aircraft. The test results show that the improved model can detect targets that YOLOv8-official fails to detect, and it can be applied to occlusion target detection in different scenes. It has more direct and practical application value for occlusion target detection in complex scenes.

5. Conclusions

To address the issue of low accuracy in occlusion target detection in complex scenes, a complex scene occlusion target detection method based on anchor-free optimization with mixed local channel attention and multiple detection layers is proposed based on YOLOv8. The improved model is compared and analyzed with different models through ablation and comparative experiments on the same dataset. The results of the ablation experiments and comparisons with existing models show that the improved model achieves an average precision ([email protected]) of 0.676, which is 6.7% higher than the official YOLOv8, 7.9% higher than gold-yolo, and 7.1% higher than RTDETR. In the CityPersons dataset, the Mar-20 remote sensing aircraft dataset, and the CORS-ADD dataset, the improved model detects targets that the original models fail to detect. The tests on different datasets further demonstrate that the complex scene occlusion target detection method based on anchor-free optimization with mixed local channel attention and multiple detection layers achieves significant improvements in different datasets, indicating its universality for occlusion target detection. It can be used as a reference for migration to other models to improve their performance, such as spatial intelligence monitoring, visual navigation of spatial robots, autonomous driving, and human–computer interaction.
Based on our research, when the image resolution is too low, the extracted target features after passing through a neural network might be reduced to a single pixel point, making it difficult for the model to distinguish between target and background features. Therefore, the subsequent research directions can be divided into four main areas. The first is to study pixel-level image feature analysis to improve detection accuracy. The second is to integrate new attention mechanisms, involving more spatial information features in the detection process. The third is to optimize the model’s regional loss function, focusing on the detection of occluded targets. The fourth is to optimize the detection anchor boxes, making the detection output more precise.

Author Contributions

Resources, Writing—review & editing, Q.S.; Writing—original draft, J.M. All authors have read and agreed to the published version of the manuscript.

Funding

This research received no external funding.

Data Availability Statement

All datasets are public.

Conflicts of Interest

The authors declare no conflict of interest.

References

  1. Pei, Z.; Zhang, Y.; Yang, T.; Zhang, X.; Yang, Y.-H. A novel multi-object detection method in complex scene using synthetic aperture imaging. Pattern Recognit. 2012, 45, 1637–1658. [Google Scholar] [CrossRef]
  2. Ruan, J.; Cui, H.; Huang, Y.; Li, T.; Wu, C.; Zhang, K. A review of occluded objects detection in real complex scenarios for autonomous driving. Green Energy Intell. Transp. 2023, 2, 100092. [Google Scholar] [CrossRef]
  3. Bonin-Font, F.; Ortiz, A.; Oliver, G. Visual navigation for mobile robots: A survey. J. Intell. Robot. Syst. 2008, 53, 263–296. [Google Scholar] [CrossRef]
  4. Yurtsever, E.; Lambert, J.; Carballo, A.; Takeda, K. A survey of autonomous driving: Common practices and emerging technologies. IEEE Access 2020, 8, 58443–58469. [Google Scholar] [CrossRef]
  5. Preece, J.; Rogers, Y.; Sharp, H.; Benyon, D.; Holland, S.; Carey, T. Human-Computer Interaction; Addison-Wesley Longman Ltd.: Albany, NY, USA, 1994. [Google Scholar]
  6. Finogeev, A.; Finogeev, A.; Fionova, L.; Lyapin, A.; Lychagin, K.A. Intelligent monitoring system for smart road environment. J. Ind. Inf. Integr. 2019, 15, 15–20. [Google Scholar] [CrossRef]
  7. Jiang, P.; Ergu, D.; Liu, F.; Cai, Y.; Ma, B. A Review of Yolo algorithm developments. Procedia Comput. Sci. 2022, 199, 1066–1073. [Google Scholar] [CrossRef]
  8. Terven, J.; Cordova-Esparza, D. A Comprehensive Review of YOLO Architectures in Computer Vision: From YOLOv1 to YOLOv8 and YOLO-NAS. Mach. Learn. Knowl. Extr. 2023, 5, 1680–1716. [Google Scholar] [CrossRef]
  9. Zou, Z.; Chen, K.; Shi, Z.; Guo, Y.; Ye, J. Object detection in 20 years: A survey. Proc. IEEE 2023, 111, 257–276. [Google Scholar] [CrossRef]
  10. Chu, X.; Zheng, A.; Zhang, X.; Sun, J. Detection in crowded scenes: One proposal, multiple predictions. In Proceedings of the IEEE/CVF Conference on Computer Vision and Pattern Recognition, Seattle, WA, USA, 19 June 2020; pp. 12214–12223. [Google Scholar]
  11. Shao, X.; Wang, Q.; Yang, W.; Chen, Y.; Xie, Y.; Shen, Y.; Wang, Z. Multi-scale feature pyramid network: A heavily occluded pedestrian detection network based on ResNet. Sensors 2021, 21, 1820. [Google Scholar] [CrossRef] [PubMed]
  12. Yang, S.; Wang, J.; Hu, L.; Liu, B.; Zhao, H. Research on Occluded Object Detection by Improved RetinaNet. J. Comput. Eng. Appl. 2022, 58, p209. [Google Scholar]
  13. Luo, Z.; Fang, Z.; Zheng, S.; Wang, Y.; Fu, Y. NMS-loss: Learning with non-maximum suppression for crowded pedestrian detection. In Proceedings of the 2021 International Conference on Multimedia Retrieval, New York, NY, USA, 21–24 August 2021; pp. 481–485. [Google Scholar] [CrossRef]
  14. Huang, X.; Ge, Z.; Jie, Z.; Yoshie, O. Nms by representative region: Towards crowded pedestrian detection by proposal pairing. In Proceedings of the IEEE/CVF Conference on Computer Vision and Pattern Recognition, Seattle, WA, USA, 19 June 2020; pp. 10750–10759. [Google Scholar]
  15. Zheng, Z.; Wang, P.; Liu, W.; Li, J.; Ye, R.; Ren, D. Distance-IoU loss: Faster and better learning for bounding box regression. In Proceedings of the AAAI Conference on Artificial Intelligence, New York, NY, USA, 7–12 February 2020; pp. 12993–13000. [Google Scholar]
  16. Li, X.; Wang, W.; Wu, L.; Chen, S.; Hu, X.; Li, J.; Tang, J.; Yang, J. Generalized focal loss: Learning qualified and distributed bounding boxes for dense object detection. Adv. Neural Inf. Process. Syst. 2020, 33, 21002–21012. [Google Scholar]
  17. Zhu, C.; He, Y.; Savvides, M. Feature selective anchor-free module for single-shot object detection. In Proceedings of the IEEE/CVF Conference on Computer Vision and Pattern Recognition, Long Beach, CA, USA, 20 June 2019; pp. 840–849. [Google Scholar]
  18. Niu, Z.; Zhong, G.; Yu, H. A review on the attention mechanism of deep learning. Neurocomputing 2021, 452, 48–62. [Google Scholar] [CrossRef]
  19. Vaswani, A.; Shazeer, N.; Parmar, N.; Uszkoreit, J.; Jones, L.; Gomez, A.N.; Kaiser, L.; Polosukhin, I. Attention is all you need. Adv. Neural Inf. Process. Syst. 2017, 30. [Google Scholar] [CrossRef]
  20. Guo, M.-H.; Xu, T.X.; Liu, J.J.; Liu, Z.N.; Jiang, P.T.; Mu, T.J.; Zhang, S.-H.; Martin, R.R.; Cheng, M.M.; Hu, S.M. Attention mechanisms in computer vision: A survey. Comput. Vis. Media 2022, 8, 331–368. [Google Scholar] [CrossRef]
  21. Posner, M.I.; Boies, S.J. Components of attention. Psychol. Rev. 1971, 78, 391. [Google Scholar] [CrossRef]
  22. Hu, J.; Shen, L.; Sun, G. Squeeze-and-excitation networks. In Proceedings of the IEEE Conference on Computer Vision and Pattern Recognition, Salt Lake City, UT, USA, 18–23 June 2018; pp. 7132–7141. [Google Scholar]
  23. Wang, Q.; Wu, B.; Zhu, P.; Li, P.; Zuo, W.; Hu, Q. ECA-Net: Efficient channel attention for deep convolutional neural networks. In Proceedings of the IEEE/CVF Conference on Computer Vision and Pattern Recognition, Seattle, WA, USA, 19 June 2020; pp. 11534–11542. [Google Scholar]
  24. Hou, Q.; Zhou, D.; Feng, J. Coordinate attention for efficient mobile network design. In Proceedings of the IEEE/CVF Conference on Computer Vision and Pattern Recognition, Nashville, TN, USA, 25 June 2021; pp. 13713–13722. [Google Scholar]
  25. Wan, D.; Lu, R.; Shen, S.; Xu, T.; Lang, X.; Ren, Z. Mixed local channel attention for object detection. Eng. Appl. Artif. Intell. 2023, 123, 106442. [Google Scholar] [CrossRef]
  26. Blaschko, M.B.; Kannala, J.; Rahtu, E. Non maximal suppression in cascaded ranking models. In Image Analysis, Proceedings of the 18th Scandinavian Conference, SCIA 2013, Espoo, Finland, 17–20 June 2013; Proceedings 18; Springer: Berlin/Heidelberg, Germany, 2013; pp. 408–419. [Google Scholar]
  27. Bodla, N.; Singh, B.; Chellappa, R.; Davis, L.S. Soft-NMS—Improving object detection with one line of code. In Proceedings of the IEEE International Conference on Computer Vision, Venice, Italy, 22–29 October 2017; pp. 5561–5569. [Google Scholar]
  28. Wang, C.; He, W.; Nie, Y.; Guo, J.; Liu, C.; Wang, Y.; Han, K. Gold-YOLO: Efficient object detector via gather-and-distribute mechanism. Adv. Neural Inf. Process. Syst. 2024, 36. [Google Scholar] [CrossRef]
  29. Girshick, R. Fast r-cnn. In Proceedings of the IEEE International Conference on Computer Vision, Cambridge, MA, USA, 20–23 June 1995; pp. 1440–1448. [Google Scholar]
  30. Zhao, Y.; Lv, W.; Xu, S.; Wei, J.; Wang, G.; Dang, Q.; Liu, Y.; Chen, J. Detrs beat yolos on real-time object detection. arXiv 2023, arXiv:2304.08069. [Google Scholar]
Figure 1. YOLOv8 model structure diagram.
Automation 05 00011 g001
Figure 2. MLCA schematic diagram.
Automation 05 00011 g002
Figure 3. Schematic diagram of GAP, LAP, and UNAP.
Automation 05 00011 g003
Figure 4. Inverse average pooling.
Automation 05 00011 g004
Figure 5. Improved model structure.
Automation 05 00011 g005
Figure 6. YOLOv8 adds p2 detection layer and C2f.
Automation 05 00011 g006
Figure 7. Expanded MLCA model structure.
Automation 05 00011 g007
Figure 8. C2f module and C2f_MLCA module.
Automation 05 00011 g008
Figure 9. Comparison between map, precision, and recall after adding the P2 layer.
Automation 05 00011 g009
Figure 10. Comparison of YOLOv8n-MLCA in map, precision, and recall.
Automation 05 00011 g010
Figure 11. Plot of PR results of replacing the MCLA module at different locations.
Automation 05 00011 g011
Figure 12. Comparison of using the Soft-NMS algorithm in map, precision, and recall.
Automation 05 00011 g012
Figure 13. Comparison of ablation experiment map, precision, and recall.
Automation 05 00011 g013
Figure 14. Comparison diagram of loss functions after adding detection layers.
Automation 05 00011 g014
Figure 15. Test comparison of the CityPersons dataset.
Automation 05 00011 g015
Figure 16. Test comparison plot of the Mar-20 dataset.
Automation 05 00011 g016
Figure 17. Test comparison of the CORS-ADD dataset.
Automation 05 00011 g017
Table 1. Detection speed FPS and map for ablation experiments.
ModelFPS[email protected]GFLOPs
YOLOv8-official2430.6098.2
YOLOv8-p21920.62912.4
YOLOv8-Soft1330.6588.2
YOLOv8-mlca-neck2320.6188.2
Ours1280.67612.4
Table 2. Performance parameters of comparison experiments with other models.
ModelFPSMemory (MB)[email protected]
GOLD-YOLO [28]332120.597
Faster RCNN [29]473160.666
YOLOv8-official24360.609
RTDETR [30]37.73050.605
Ours12860.676
Disclaimer/Publisher’s Note: The statements, opinions and data contained in all publications are solely those of the individual author(s) and contributor(s) and not of MDPI and/or the editor(s). MDPI and/or the editor(s) disclaim responsibility for any injury to people or property resulting from any ideas, methods, instructions or products referred to in the content.