1. Introduction
In recent decades, the railway sector has seen an increase in automation and digitisation. These advances in automation are most noticeable in the introduction of grades of automation (GoA) level 2 systems. This means that, although the trains accelerate and brake independently, there is a train driver on board who monitors the journey and can intervene in safety-relevant incidents or incidents that cannot be solved by the automation. An example of this is the S-Bahn in Hamburg, which is currently testing the use and acceptance of an automated regional train in a pilot project [
1]. This project works with the European Train Control System (ETCS), which enables the use of all four grades of automation through various configurations. The use of ETCS allows for safe and efficient automatic train operation (ATO) by providing data on the train’s location and driving parameters (‘ATO over ETCS’).
With increasing automation, the tasks of the train driver change from full control of the train to a more supervisory position [
2]. For a more detailed overview of the role changes associated with different GoAs, see
Table 1. This change poses challenges for a train driver’s performance [
3]. More monotonous supervisory tasks can lead to deteriorated vigilance [
4] and can have a negative impact on the driver’s situational awareness [
5]. The train driver is responsible for fast obstacle detection and the initiation of countermeasures in the case of an emergency at GoA 2. Therefore, decreasing situational awareness and cognitive underload pose a potential safety threat and there is a need to understand how the values of relevant monitoring parameters, such as reaction time and gaze distribution, change with increasing automation.
Higher automation levels in similar use cases like car and truck driving pose similar challenges to drivers’ vigilance levels [
7,
8]. Current research aims to solve the problem in this context with driver state monitoring [
9] that enables timely mitigation of safety-critical driver states. One solution to mitigate the negative effects of possibly reduced train driver attention in automated train driving is to transfer this idea of driver state mitigation to train drivers [
10]. One frequently used measurement in car and train driving monitoring is eye tracking, which can provide information on visual attention [
11]. Since methods to capture eye movements are often costly and intrusive in real-world applications, previous research has aimed to find out whether head tracking is a viable alternative (for an overview, see Véras et al. [
12]). Hence, this study aimed to assess the feasibility of head tracking based on low-resolution camera data as an alternative method to eye tracking in the train driver cabin. For this purpose, video data were recorded during a simulator ride with train drivers and analysed with commercially available head-tracking software [
13]. The aim of this project was to find out whether results from eye-tracking studies on the gaze behaviour of train drivers can be replicated using head tracking.
The rest of the paper is organized as follows. In
Section 1.1,
Section 1.2 and
Section 1.3 we provide a thematic and methodological background to the study and we present our hypotheses. In
Section 2, we describe the materials and methods used, including the scenario and study design, the participants, the procedure and the data preprocessing and analysis.
Section 3 contains the results of our statistical and descriptive analyses. Finally, in
Section 4 we discuss our findings, report limitations and give a conclusion.
1.1. Previous Research
In traffic research, many studies have used eye tracking to derive assumptions about the distribution of car drivers’ [
8,
14] or pilots’ [
11,
15] attention. There are, however, only few existing studies using eye tracking to assess attention in train drivers. In a simulator study by Suzuki et al. [
16], train drivers had to detect a subsidence on the side of the tracks when driving at high vs. low speed. When driving at a low speed, the drivers who detected the subsidence showed a wider horizontal gaze angle compared to the drivers who did not detect the subsidence. At high speed, the drivers who detected the subsidence were revealed to have longer gazes in visual searches compared to the drivers who did not detect the subsidence. These results may be due to the narrowing of the useful field of view, induced by an increased optical flow at higher speeds resulting in a “tunnel vision” [
17,
18]. Besides speed, experience has been found to be influential on train drivers eye movements. In a field study, inexperienced train drivers showed more fixations on the speedometer compared to experienced train drivers and less consistent gaze patterns [
19]. Similar results could be observed in a simulator study by Du et al. [
20], where more driving experience was associated with a higher frequency of short fixations and more consistent visual patterns. In addition, the train protection system (TPS) has been found to influence train drivers’ eye movements. Driving with ETCS (European Train Control System) compared to driving with PZB (a German pointwise train control system) led to an attention shift from the outside to the inside of the cab [
21]. This effect is due to the shift in driving-relevant information being presented on the outside of the cab (e.g., through signals, speed boards, etc.) to the inside (through the Driver Machine Interface (DMI) or other displays). Luke et al. [
22] found that different aspects of a signal had an influence on gaze distribution, with signal gantries and yellow signals being fixated on for longer than signal posts and green signals. Overall, studies on the head and eye movements of train drivers are sparse, but might represent a viable option for in-cabin train driver monitoring by informing about the driver’s current area of visual attention.
1.2. Background
1.2.1. Train Protection Systems
A substantial part of the changes induced by automation is the change to newer train protection systems (TPS). TPS are part of the safety levels in rail traffic. They ensure that trains are monitored during their journey and that safety-critical errors are prevented. These include, for example, passing stop signals or exceeding the maximum permitted speed. In many European countries, pointwise systems are currently the most used TPS. This is also the case in Germany, where this system is called PZB 90 (in short, PZB stands for pointwise train control). The functionality of this system consists of placing magnets directly next to the rails, which send signals regarding the maximum permitted speed or the presence of hazardous points to trains travelling above, which process these signals with an on-board device. In various safety-relevant cases, this leads to a warning in the driver’s cab display, to which the train driver must react appropriately (e.g., by decelerating to a certain speed in a certain time). If no appropriate action is taken or if an appropriate action is taken too late, the train emergency brakes. PZB as a whole is characterized by the fact that the train driver must perceive track-side cues and react to them accordingly. Track-side cues are always positioned to the right of the tracks in Germany when driving on the regular track. Such cues can be, for example, regular signals, speed boards or special signals. It therefore mainly allows for GoA Level 1 operations.
The European Train Control System (ETCS), on the contrary, is a more modern TPS that has been gradually installed on European lines since the beginning of the 2000s. The introduction of ETCS was intended, in particular, to establish standardisation in trans-European rail traffic and to facilitate border traffic. This system integrates digital communication and positioning technologies, constantly exchanging critical data between trains and track-side infrastructure and providing real-time information on speed, track conditions, and signals to the train driver. While offering automatic train protection, in certain levels, i.e., configurations, the system still relies on the train driver to drive the train and monitor performance. The adoption of ETCS implies a significant shift for train drivers, transitioning from relying solely on external track-side signals to a more comprehensive reliance on in-cab digital displays and communication interfaces. It therefore marks a change in attention allocation from the external environment to a more concentrated focus within the cab. For a more detailed explanation of PZB and the ETCS see the book by Maschek [
23]. In contrast to PZB, ETCS enables all four grades of automation through various configurations.
The different characteristics of the two TPS result in different preconditions for the driver’s visual behaviour. While with PZB the driver mainly has to look for indications in the environment, with ETCS the indications relevant for driving are mainly displayed in the central cab display.
1.2.2. Head-Tracking Method
Head tracking works by using sensors, mostly cameras, to continuously monitor the position and movement of a user’s head in real time. These sensors capture the 3D orientation of the head and translate it into digital data, allowing for the interpretation of the user’s head movements. Recent years have seen an increase in the use of head-tracking-based applications. It is predominantly used in human–computer interaction, e.g., for video games [
24], augmented reality [
25] or to provide an alternative way of interaction for people with physical disabilities [
26]. It has also been used in the traffic research sector for detecting distraction in car drivers [
27,
28]. Head tracking might prove useful since it holds some advantages over eye tracking. Since the entire head is tracked, wearing glasses causes little to no impairment to tracking quality and robustness to gloomy light conditions is increased [
29]. A study by Blignaut and Wium [
30] also found eye-tracking performance to deteriorate if a person is of Asian ethnicity. Head tracking is not affected by this racial bias and might be a step towards more inclusive research methods. However, results of head-tracking analyses enable the derivation of coarse gaze direction only [
29]. This is because a person can extract information from the foveal area without a head movement and only if the area of interest lies outside of this area, a head movement is necessary. Overall, head tracking might be a promising method to efficiently and comparatively inexpensively estimate the current area of visual attention.
1.3. Hypotheses
The presented study aims to provide a first glimpse into the head movements of train drivers and, based on previous findings from eye-tracking studies, whether head tracking might be a feasible, cheaper and easier-to-implement alternative or addition to eye tracking. Based on the literature presented, this study aims to confirm the following hypotheses:
H1. Train drivers look more to the outside of the cab when driving with PZB compared to ETCS. This is indicated by a higher head pitch (vertical axis rotation) for ETCS compared to PZB.
H2. Train drivers look more to the right when driving with PZB compared to ETCS. This is indicated by higher yaw values (side-to-side rotation) for PZB compared to ETCS.
H3. Train drivers show more horizontal head movements when driving with slower speeds compared to high speeds.
H4. The head movements of inexperienced and experienced train drivers differ in distribution.
2. Materials and Methods
2.1. Scenario and Study Design
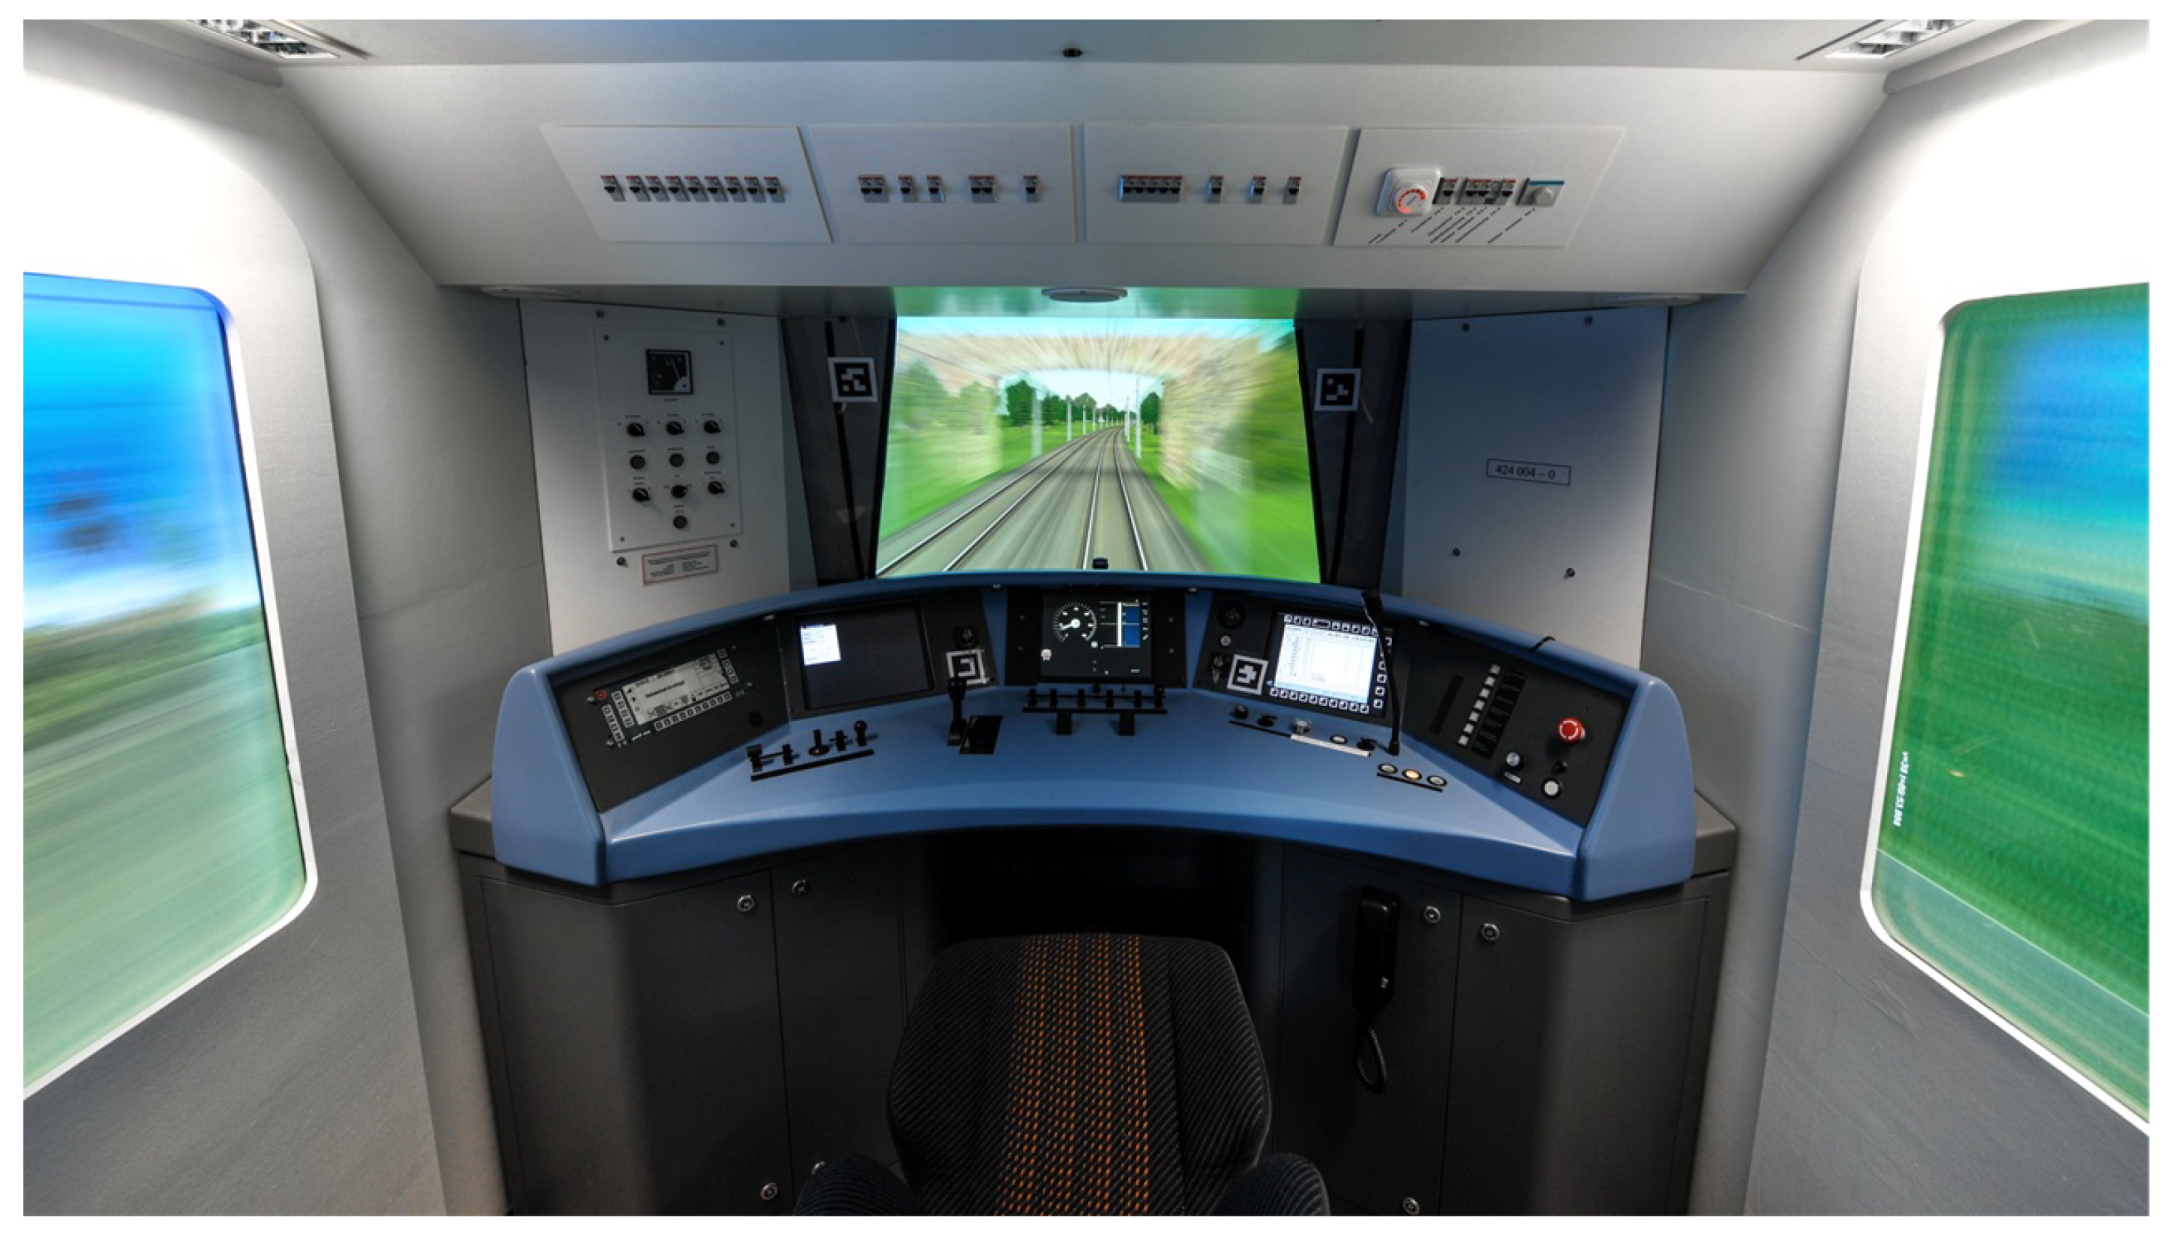
Train drivers drove in a high-fidelity train driving simulator using a real cabin and driver’s desk to match the train drivers’ actual workplace as closely as possible. The driver’s seat closely resembled a real train cabin driver’s seat and was fixed in height throughout the entire drive.The simulation was created using the Virtual Test Drive software [
31]. A video projector displayed the simulated front view, while side window views were shown on screens. The simulation included crucial aspects of an actual rail line, such as overhead lines, switches, stations and environmental elements like trees and houses. A picture of the simulator used with the simulation software displayed can be found in
Figure 1. In a within-subject design, participants used both ETCS and PZB in a counterbalanced order. The PZB system’s maximum speed was either 40 or 100 km/h, while the ETCS system’s maximum speed was either 100 or 160 km/h. These speeds were selected to reflect realistic differences between the two systems.
This study aimed to measure differences between manual and automated driving; therefore, key differences associated with both GoA levels were implemented in the TPS. In the PZB condition, elements conveying driving-relevant information (such as signals, etc.) were placed in the environment outside the cab, while in the ETCS condition, information was displayed inside the cabin on the central driver machine interface (DMI). Participants had to set the train in motion and brake manually in both TPS conditions.
2.2. Participants
Professional train drivers were recruited for this study. We recruited active train drivers over the institute’s participant pool and targeted advertising on train driver-specific social media platforms. A total of 25 professional train drivers took part in the simulator study, with an average of 9.92 years of professional experience (ranging from 1 to 39 years). The participants were, on average, 33.68 years old (ranging from 22 to 57 years) and were all male. None of the participants had previously taken part in any studies conducted by our institute. When asked to rate their familiarity with the PZB train protection system on a scale from one (not familiar at all) to ten (very familiar), participants averaged a rating of 9.76. On the same scale, their familiarity with the ETCS train protection system was notably lower, averaging at 2.04.
2.3. Procedure
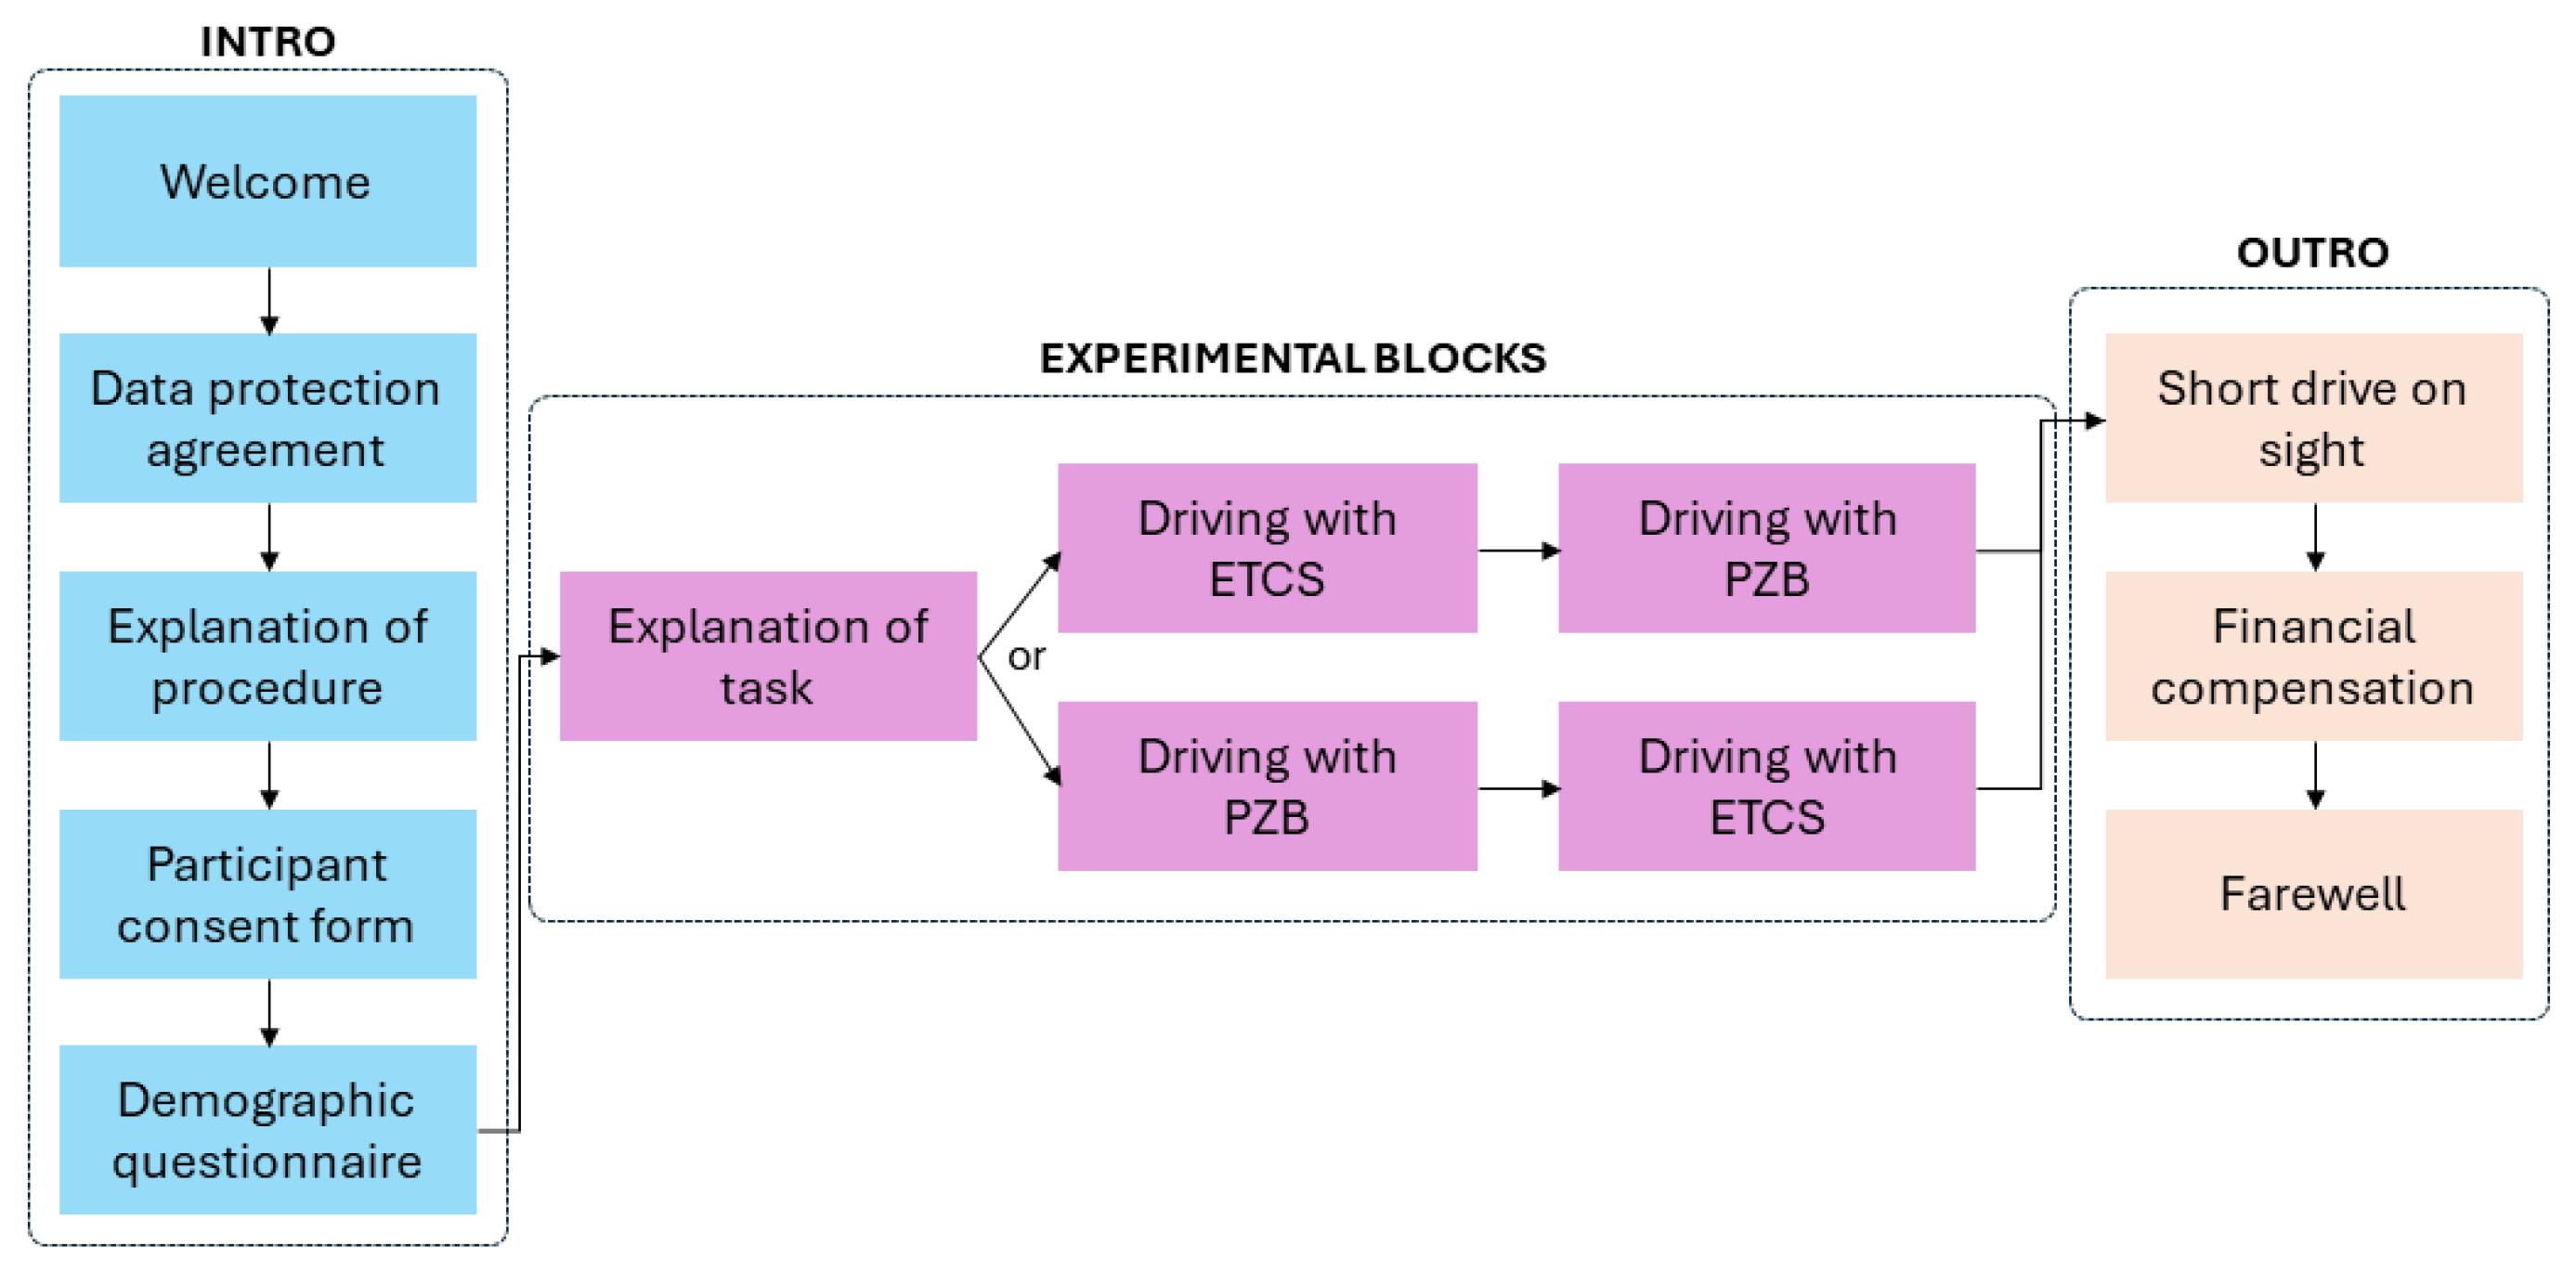
Upon arrival, participants were initially prompted to review the data protection statements and participant information. Subsequently, the data collection process was outlined and explained to all participants. After this, they signed the consent form. They received an introduction to the driving task and were briefly acquainted with the ETCS, as most participants lacked prior experience with the system. A possibility for participants to ask questions was provided.
Prior to commencing the experimental blocks, participants filled out a demographic questionnaire. Afterwards they started the drive, with either PZB or ETCS as first TPS. After a short pause, they continued with the second ride, driving with the respective other system. Finally, after another short break, participants drove a short route section on sight. After completing the experimental blocks, participants were thanked and filled in a form for their financial compensation. An overview of the study procedure can be found in
Figure 2. The study procedure was approved by our institute’s ethics committee (number 1/22) and data protection committee.
2.4. Measures and Preprocessing
We gathered information on age, work experience and experience with both TPS for each participant. Throughout all the drives, we tracked the participants’ head movements using camera model ELV-49571 with 500 × 582 pixels resolution, video encoder Axis Q7404 and the Face Track package of Visage [
13], specifically measuring head pitch and yaw. The dataset was preprocessed to contain only the periods when participants were actively driving the train; times when they were completing questionnaires were excluded. Additionally, we removed data from rides where issues prevented face-tracking data computation. This was due to the camera not recording (n
ETCS = 5; n
PZB = 5), participants wanting to wear their face mask in the simulator cabin due to COVID-19 precautions (n
ETCS = 1; n
PZB = 1), the head-tracking software not working (n
ETCS = 1), time-stamps of the simulator data not matching head-tracking data (n
PZB = 1) and a participant error while driving (n
PZB = 1). Consequently, the final analysis comprised 18 ETCS and 17 PZB datasets from the 25 participants, with a mean number of 177,158 head-movement data points per participant. Since for five train drivers both ETCS and PZB data were not usable, this resulted in a datasets of 20 train drivers being analyzed. We used head pitch and head yaw as dependent variables and TPS (ETCS vs. PZB), years of train driving experience and driving speed as independent measures. Driving speed was extracted from the simulator’s log data and was available for each frame.
2.5. Data Analysis
Data was analysed using R (Version 4.3.0; [
32]). We tested hypotheses 1 and 2 using the Wilcoxon rank sum test and hypotheses 3 and 4 using the Levene test for equality of variances [
33], since we aimed to find differences in horizontal (i.e., head yaw) and vertical (i.e., head pitch) distribution of head movements. To correct for multiple testing, alpha levels were corrected using Bonferroni correction. Since we performed seven statistical analyses, the adjusted alpha level was
. When testing for statistical differences, we used per-drive means of standardized head pitch and standardized head yaw, both z-transformed and averaged for each subject in order to avoid generating meaningless significant results based on the large data sample.
The comparison of head movement behaviours between the two TPS was exclusively performed at 100 km/h ± 5 km/h to avoid confounding due to the TPS’ inherent speed differences. The proportion of data points associated with a speed of 100 km/h ± 5 km/h in the total data points was 21.2 %. For the analysis of hypothesis 3 we split the data further into four groups: ETCS high speed (155–165 km/h), ETCS low speed (95–105 km/h), PZB high speed (95–105 km/h) and PZB low speed (35–45 km/h). Driving-on-sight data were not included in this paper’s analyses.
3. Results
The following results will be presented twofold. First, we will describe two-dimensional density plots and descriptive differences. Secondly, the results of the statistical analyses will be presented. For all analyses reporting on head pitch, negative values indicate a downwards head rotation and positive values an upwards head rotation. When reporting on head yaw, negative values indicate head rotation to the left and positive values to the right.
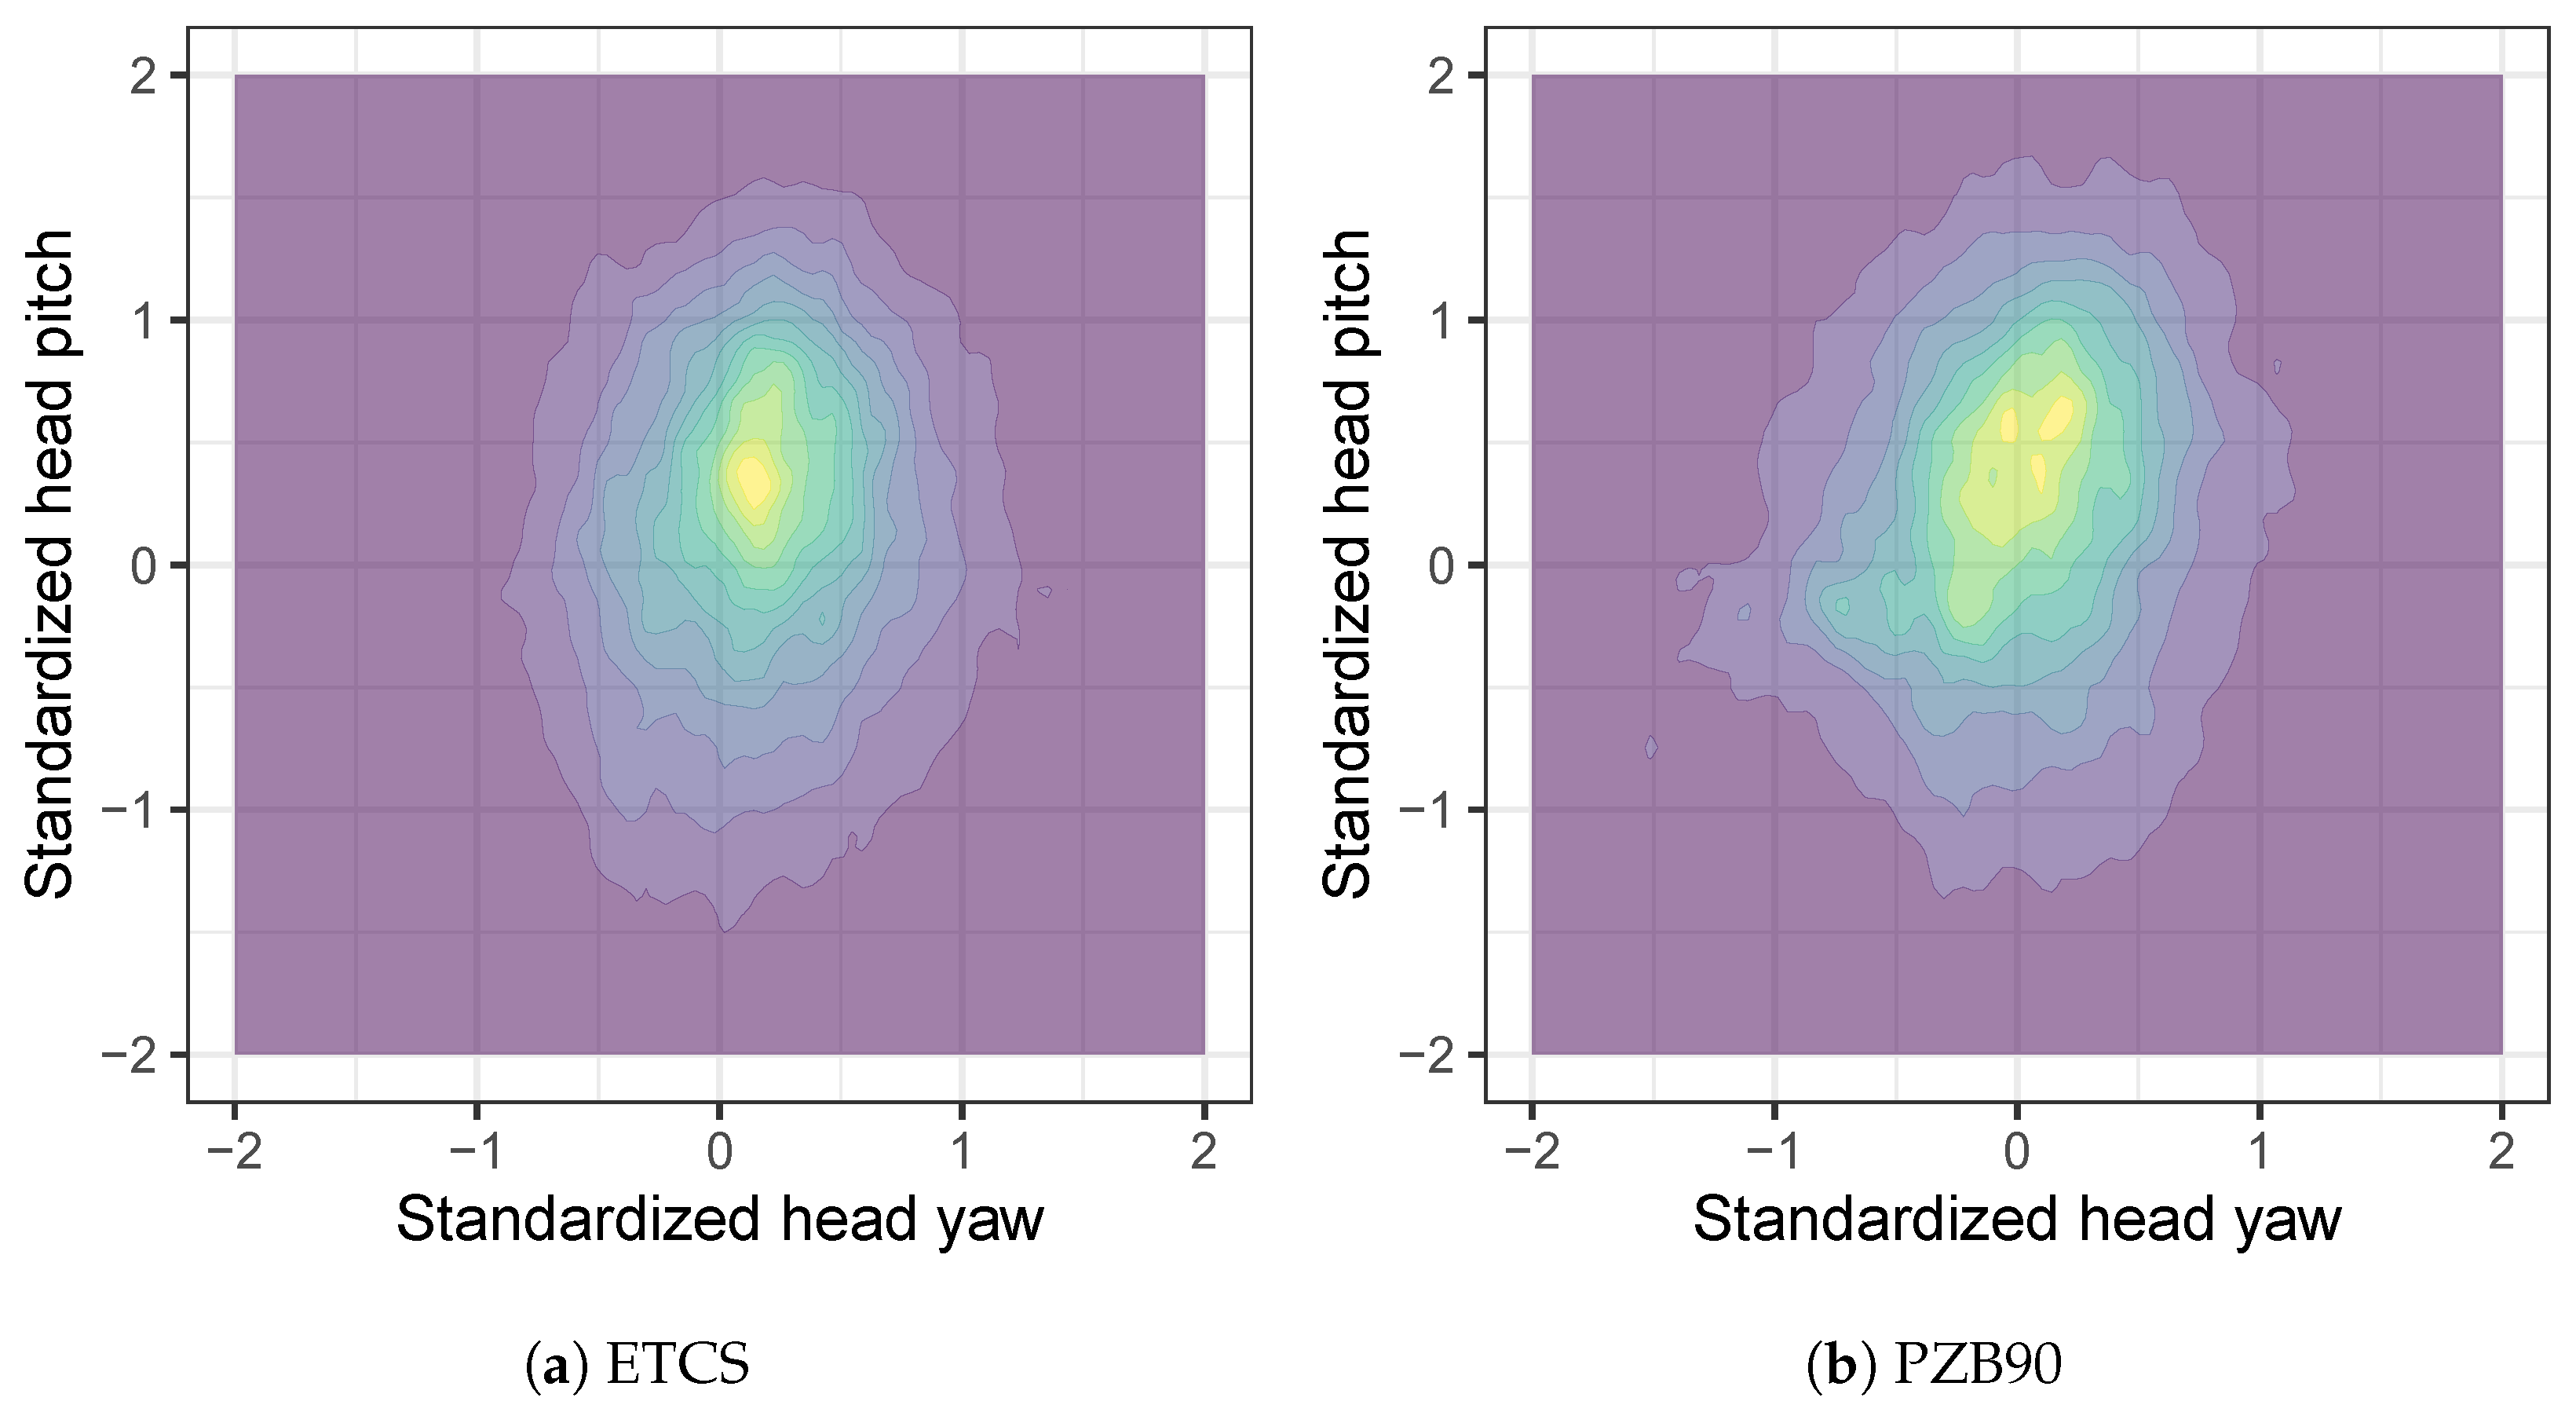
For an initial overview, we created overall head movement distribution density plots for each TPS, as can be found in
Figure 3. While both plots show a similar central tendency in standardized head yaw and pitch, the ETCS data distribution is more uniformly spread around the center. In contrast, the PZB system has a slightly broader spread, especially along the standardized head pitch axis, with the areas of highest density lying higher on the head pitch axis for the PZB condition. This may suggest differences in the head movements associated with each TPS, with a more centralized and uniform head movement tendency for ETCS.
H1. Train drivers look more to the outside of the cab when driving with PZB compared to ETCS. This is indicated by a higher head pitch for PZB compared to ETCS.
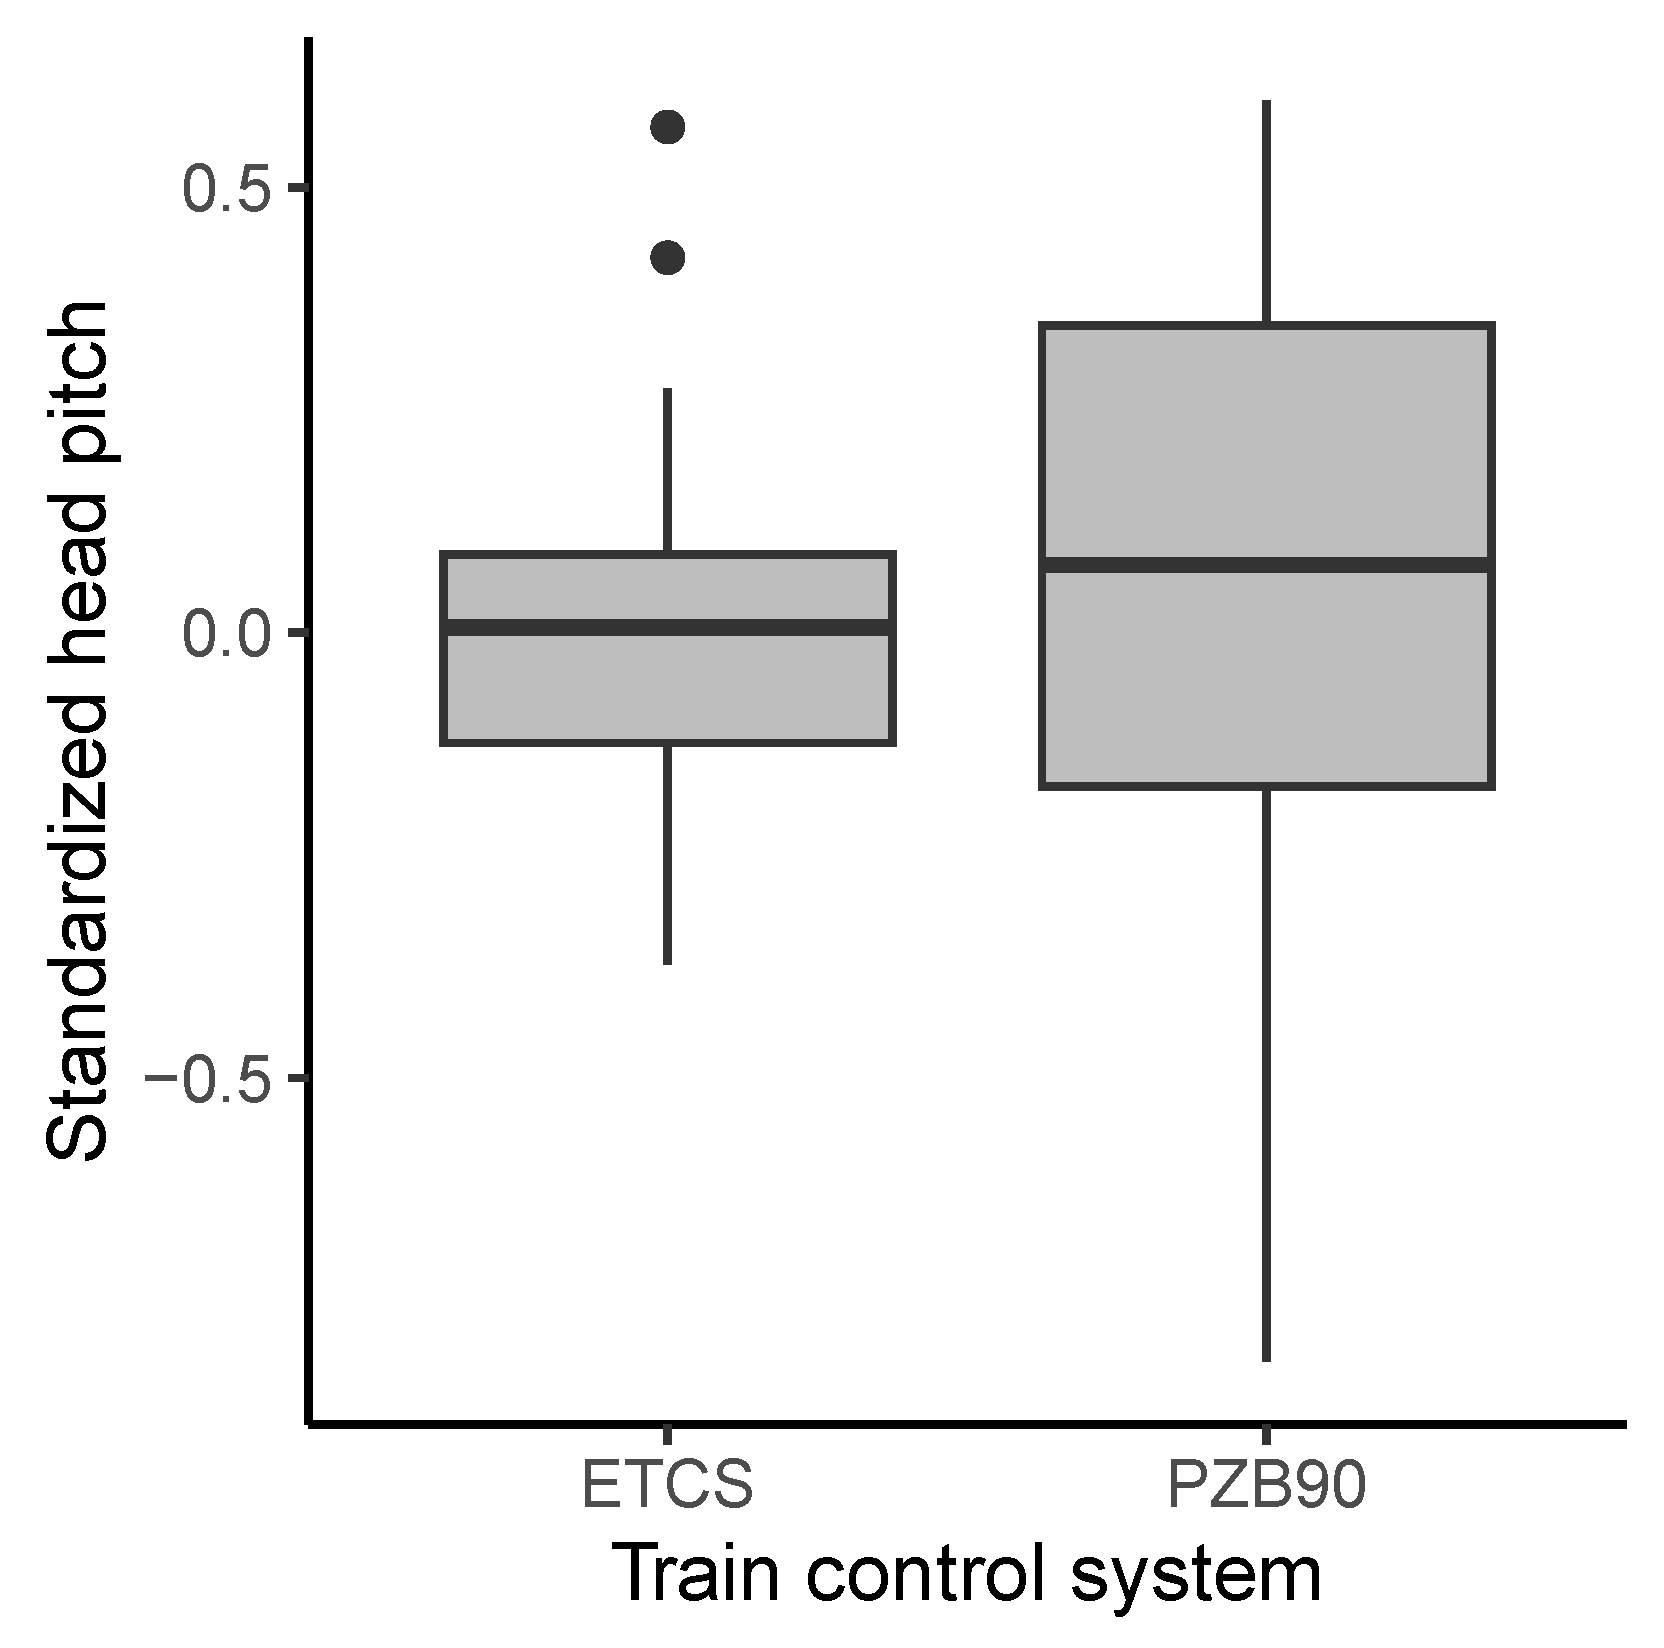
We conducted a Wilcoxon rank sum test because variance homogeneity was not given. We compared the effect of TPS on standardized head pitch (while driving at 100 km/h ± 5). The test for an effect of the TPS on head pitch showed no significant results,
W = 173,
p = .262. When driving with the ETCS, participants had a mean head pitch of 0.02 (
SD = 0.23), which was slightly lower than for participants driving with PZB who had a mean head pitch of 0.04 (
SD = 0.42). The means and distributions of head pitch for both TPS can be found in
Figure 4.
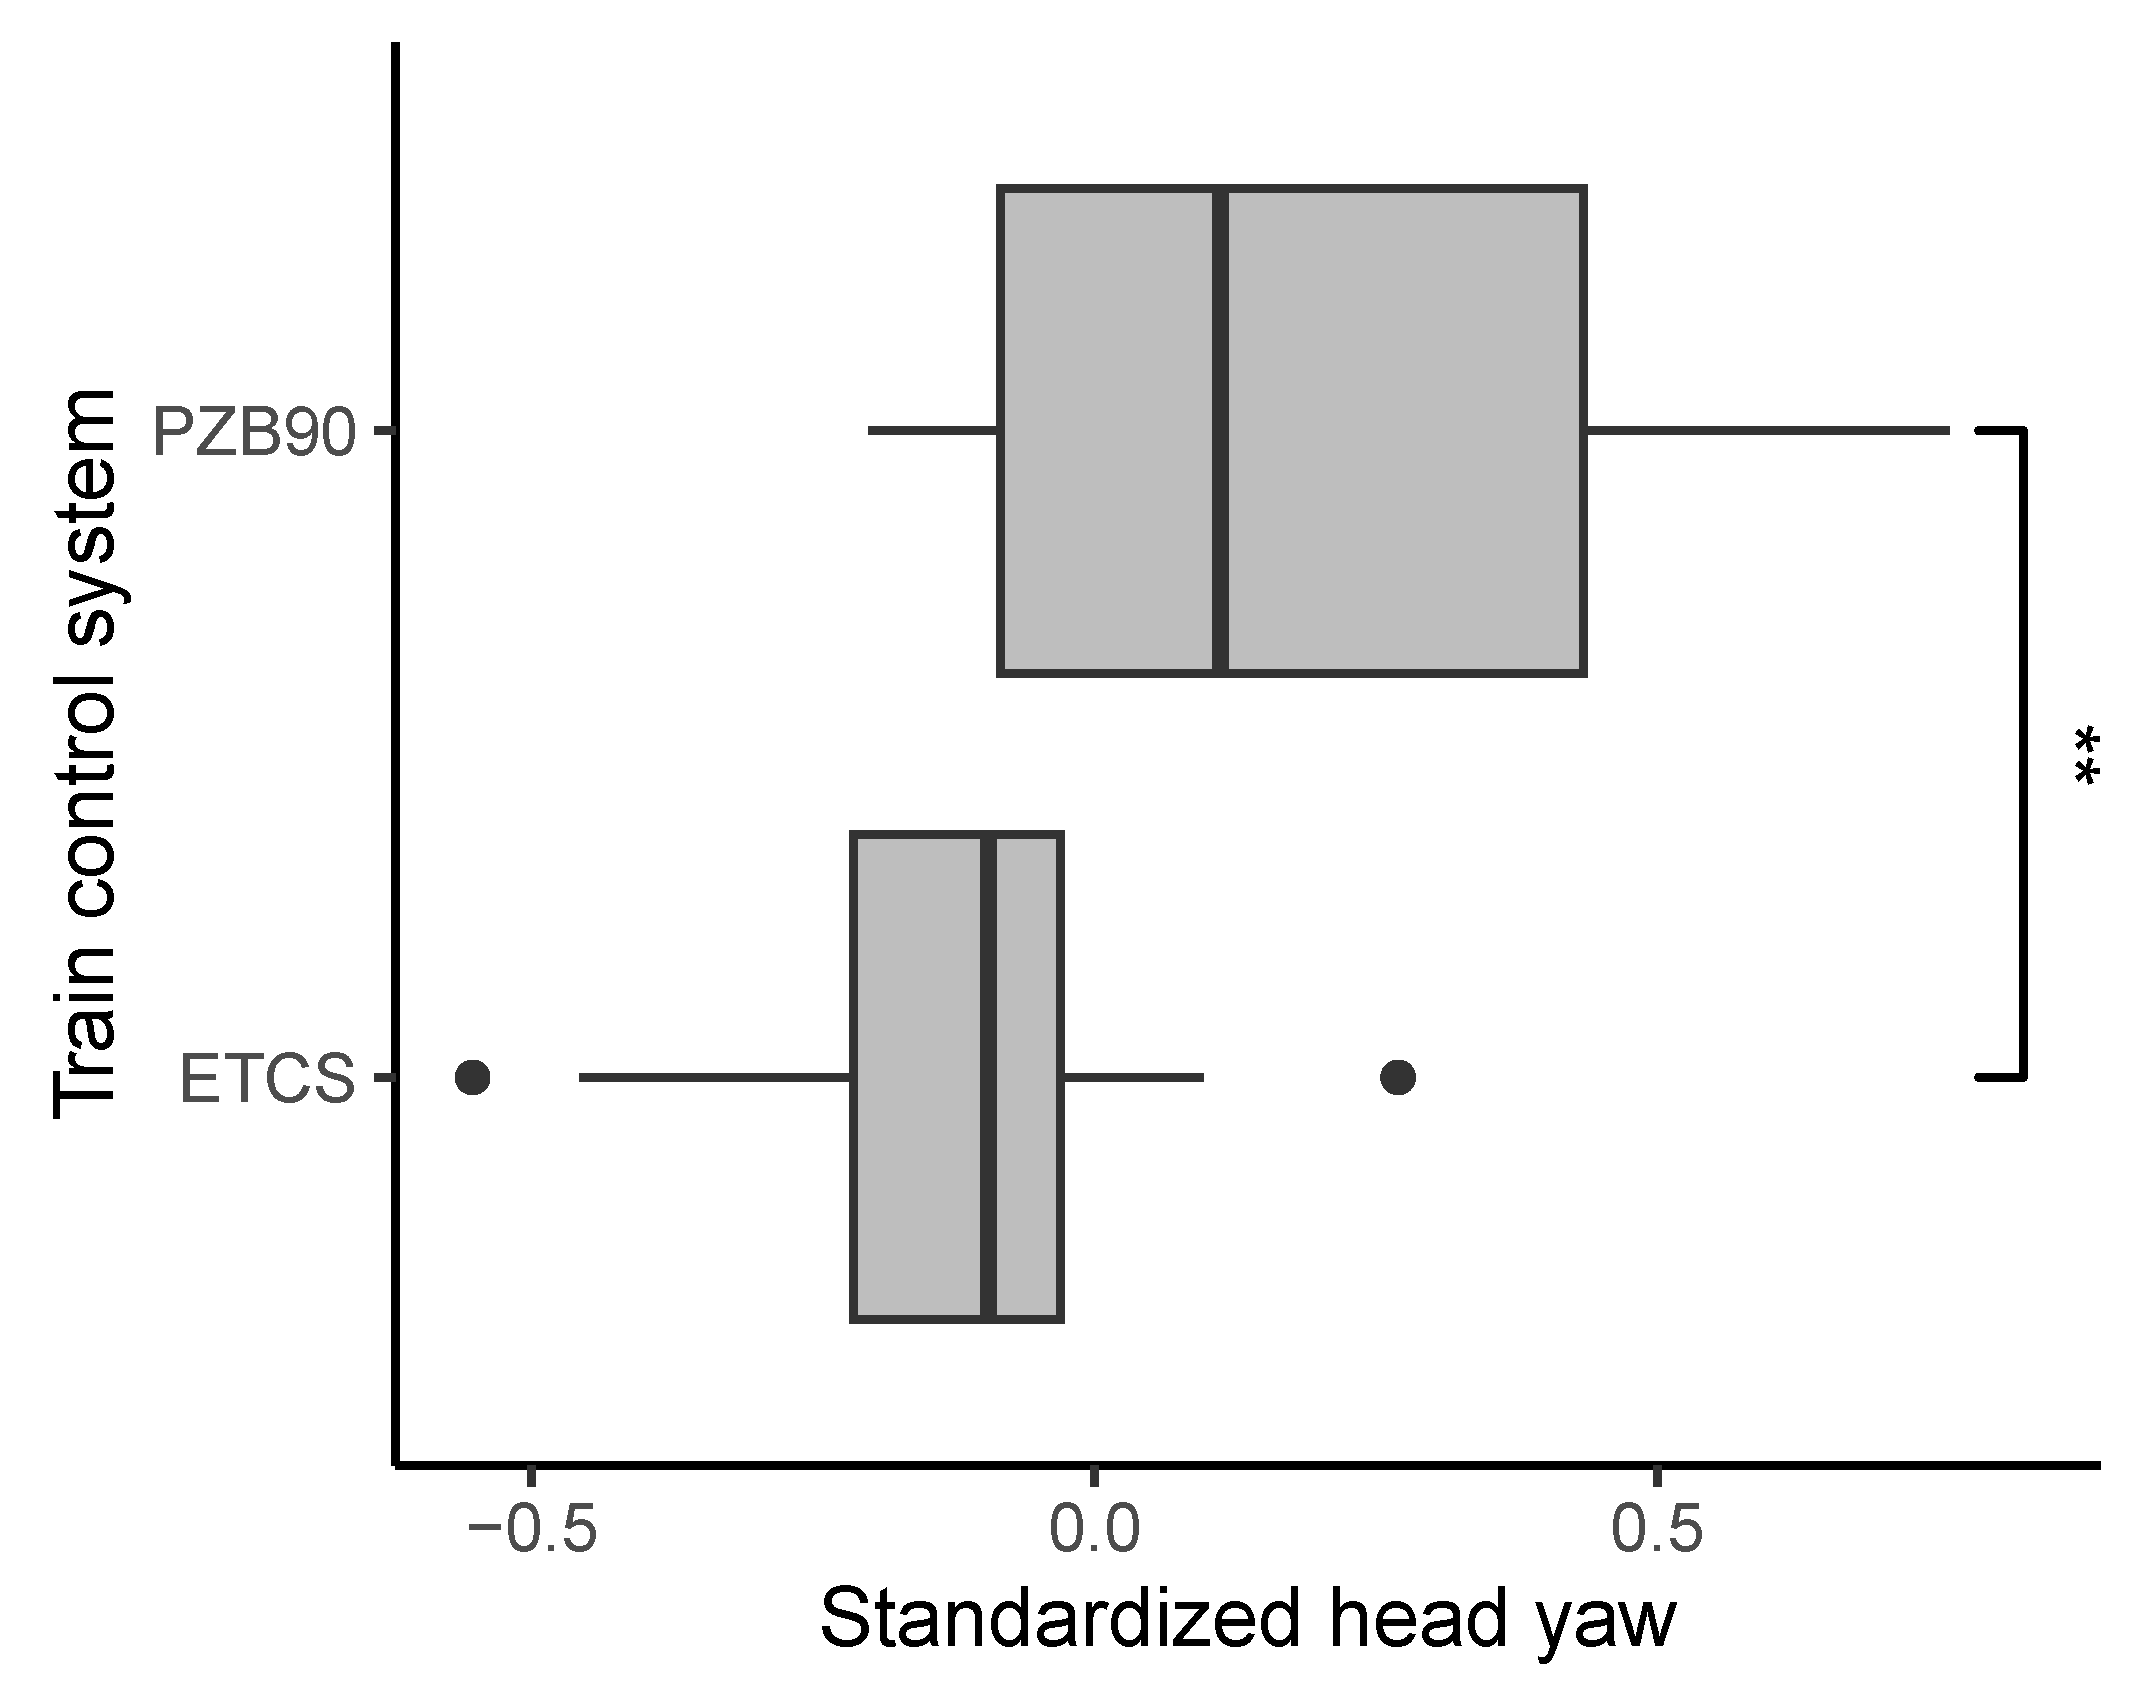
H2. Train drivers look more to the right when driving with PZB compared to ETCS. This is indicated by higher yaw values for PZB compared to ETCS.
To analyze this, we conducted a Wilcoxon rank sum test because variance homogeneity was again not given. We compared the effect of TPS on standardized head yaw (while driving at 100 km/h ± 5). The test for an effect of the TPS on head yaw showed significant results,
W = 60,
p < 0.001. When driving with ETCS, the participants had a mean head yaw of −0.12 (
SD = 0.19), which was lower than for participants driving with PZB who had a mean head yaw of 0.18 (
SD = 0.32). The effect size was
r = 0.53, indicating a moderate effect according to Cohen [
34]. The means and distributions of head yaw for both TPS can be found in
Figure 5.
H3. Train drivers show more horizontal head movements when driving with slower speeds compared to high speeds.
For this analysis we split the data sample into four groups (see
Section 2.5). To account for possible differences in the head movements between both TPS, we first compared each high and low speed condition of the respective system. Analyses were performed using the Levene test for equality of variances. We found no significant differences in head yaw variance for the PZB condition,
F(1,32) = 6.69,
p = 0.014, with a slightly higher variance for the high (100 km/h;
= 0.09) compared to the low (40 km/h;
= 0.02) speed. We did not find any significant differences in head yaw variance for the ETCS condition either
F(1,34) = 0.20,
p = 0.66, where differences in variance where even more marginal (high (160 km/h):
= 0.03; low (100 km/h):
= 0.04). In a second exploratory analysis we compared the PZB’s low-speed to the ETCS’ high-speed condition. This was carried out to achieve the biggest speed difference (40 vs. 160 km/h) possible. However, we did not find any significant differences in head yaw variance,
F(1,68) = 0.19,
p = 0.67, with slightly higher variance for ETCS’ high (
= 0.03) compared to PZB’s low (
= 0.02) speed.
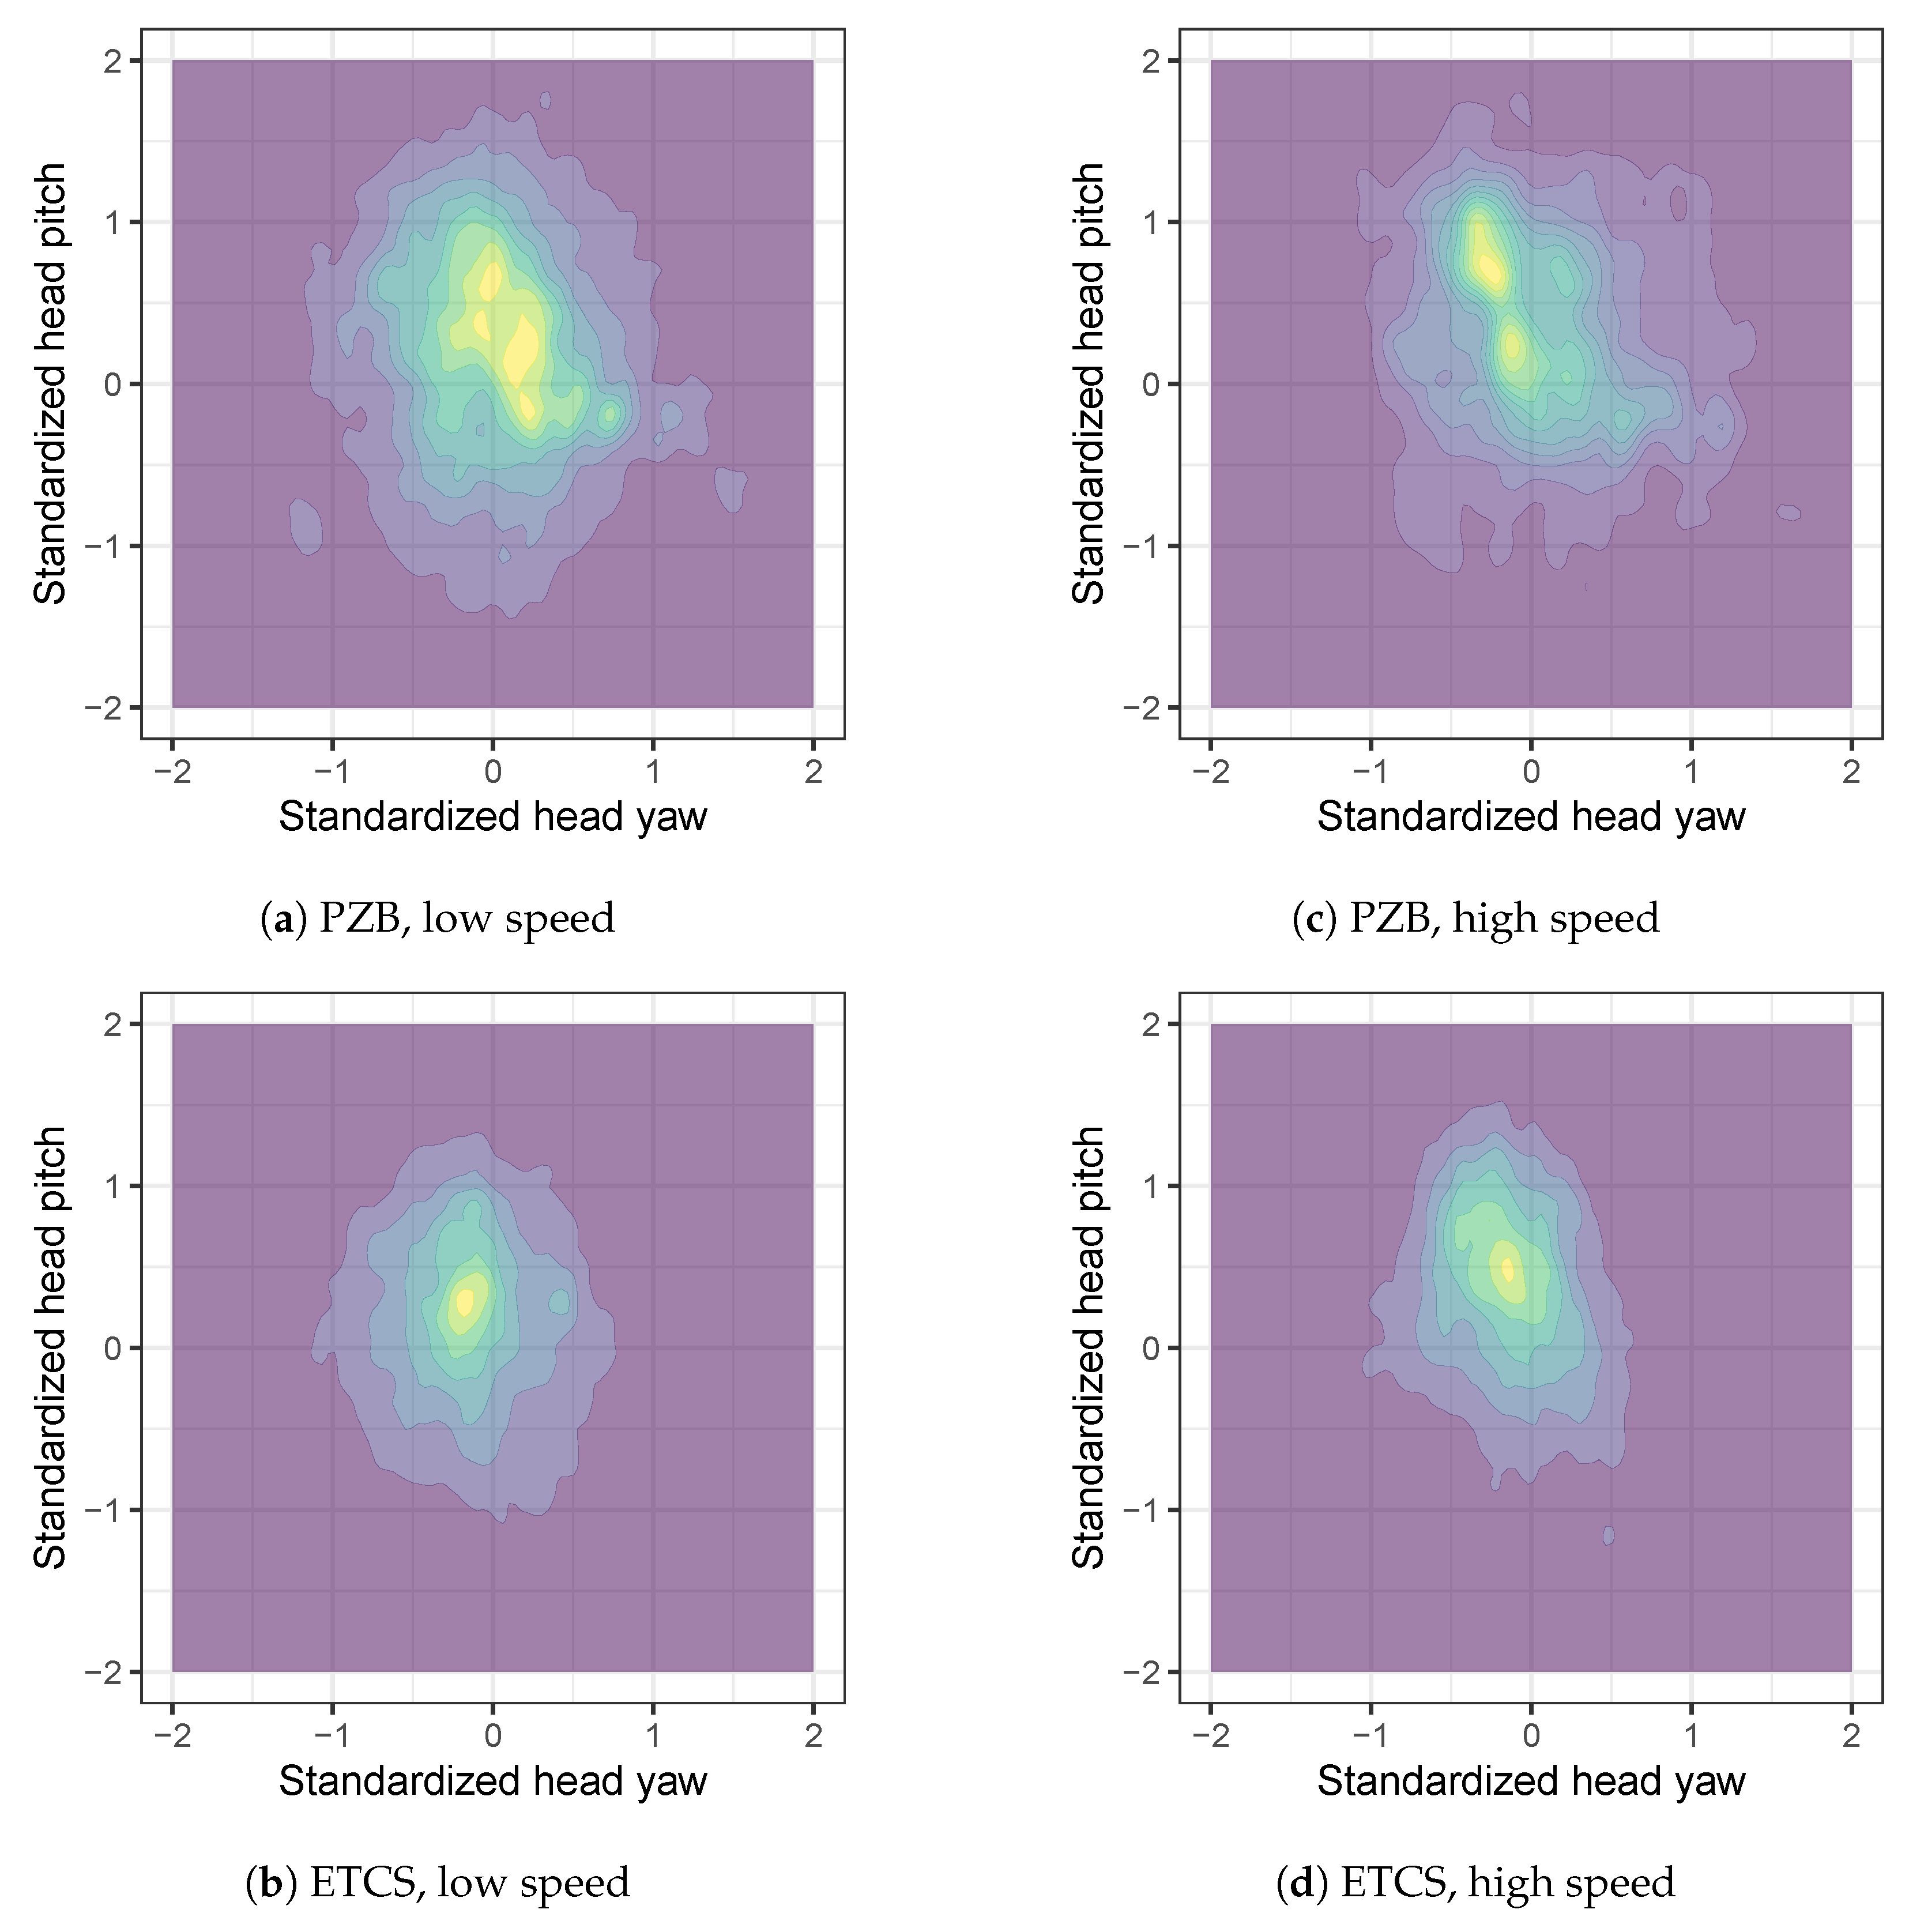
To account for possible descriptive differences between driving at low and high speeds, we created density plots for each TPS split between driving at high and low speed (see
Figure 6). In contrast to the statistical results, there is a tendency for the areas of highest density to have a more stretched distribution along the head pitch axis when driving at a higher speed. This trend is especially visible in the PZB condition. The PZB density plots furthermore reveal a noticeable shift from a broader center of head movement intensity at low speed towards a split between two slightly separated high intensity areas at high speed. This effect is, however, not present for ETCS driving.
H4. Head movements of inexperienced and experienced train drivers differ in distribution.
To test this hypothesis, we split our sample by median of driving experience, which resulted in two groups: low experience (<4.5 years) and high experience (>4.5 years). The Levene test for equality of variances showed no significant difference in the distribution of head yaw,
F(1, 18) = 0.03,
p = 0.86, with nearly equal variance for high (
= 0.12) and low (
= 0.12) experience. We did not find any significant difference in the distribution of head pitch,
F(1, 18) = 0.13,
p = .73, with marginally lower variance for high (
= 0.17) compared to low (
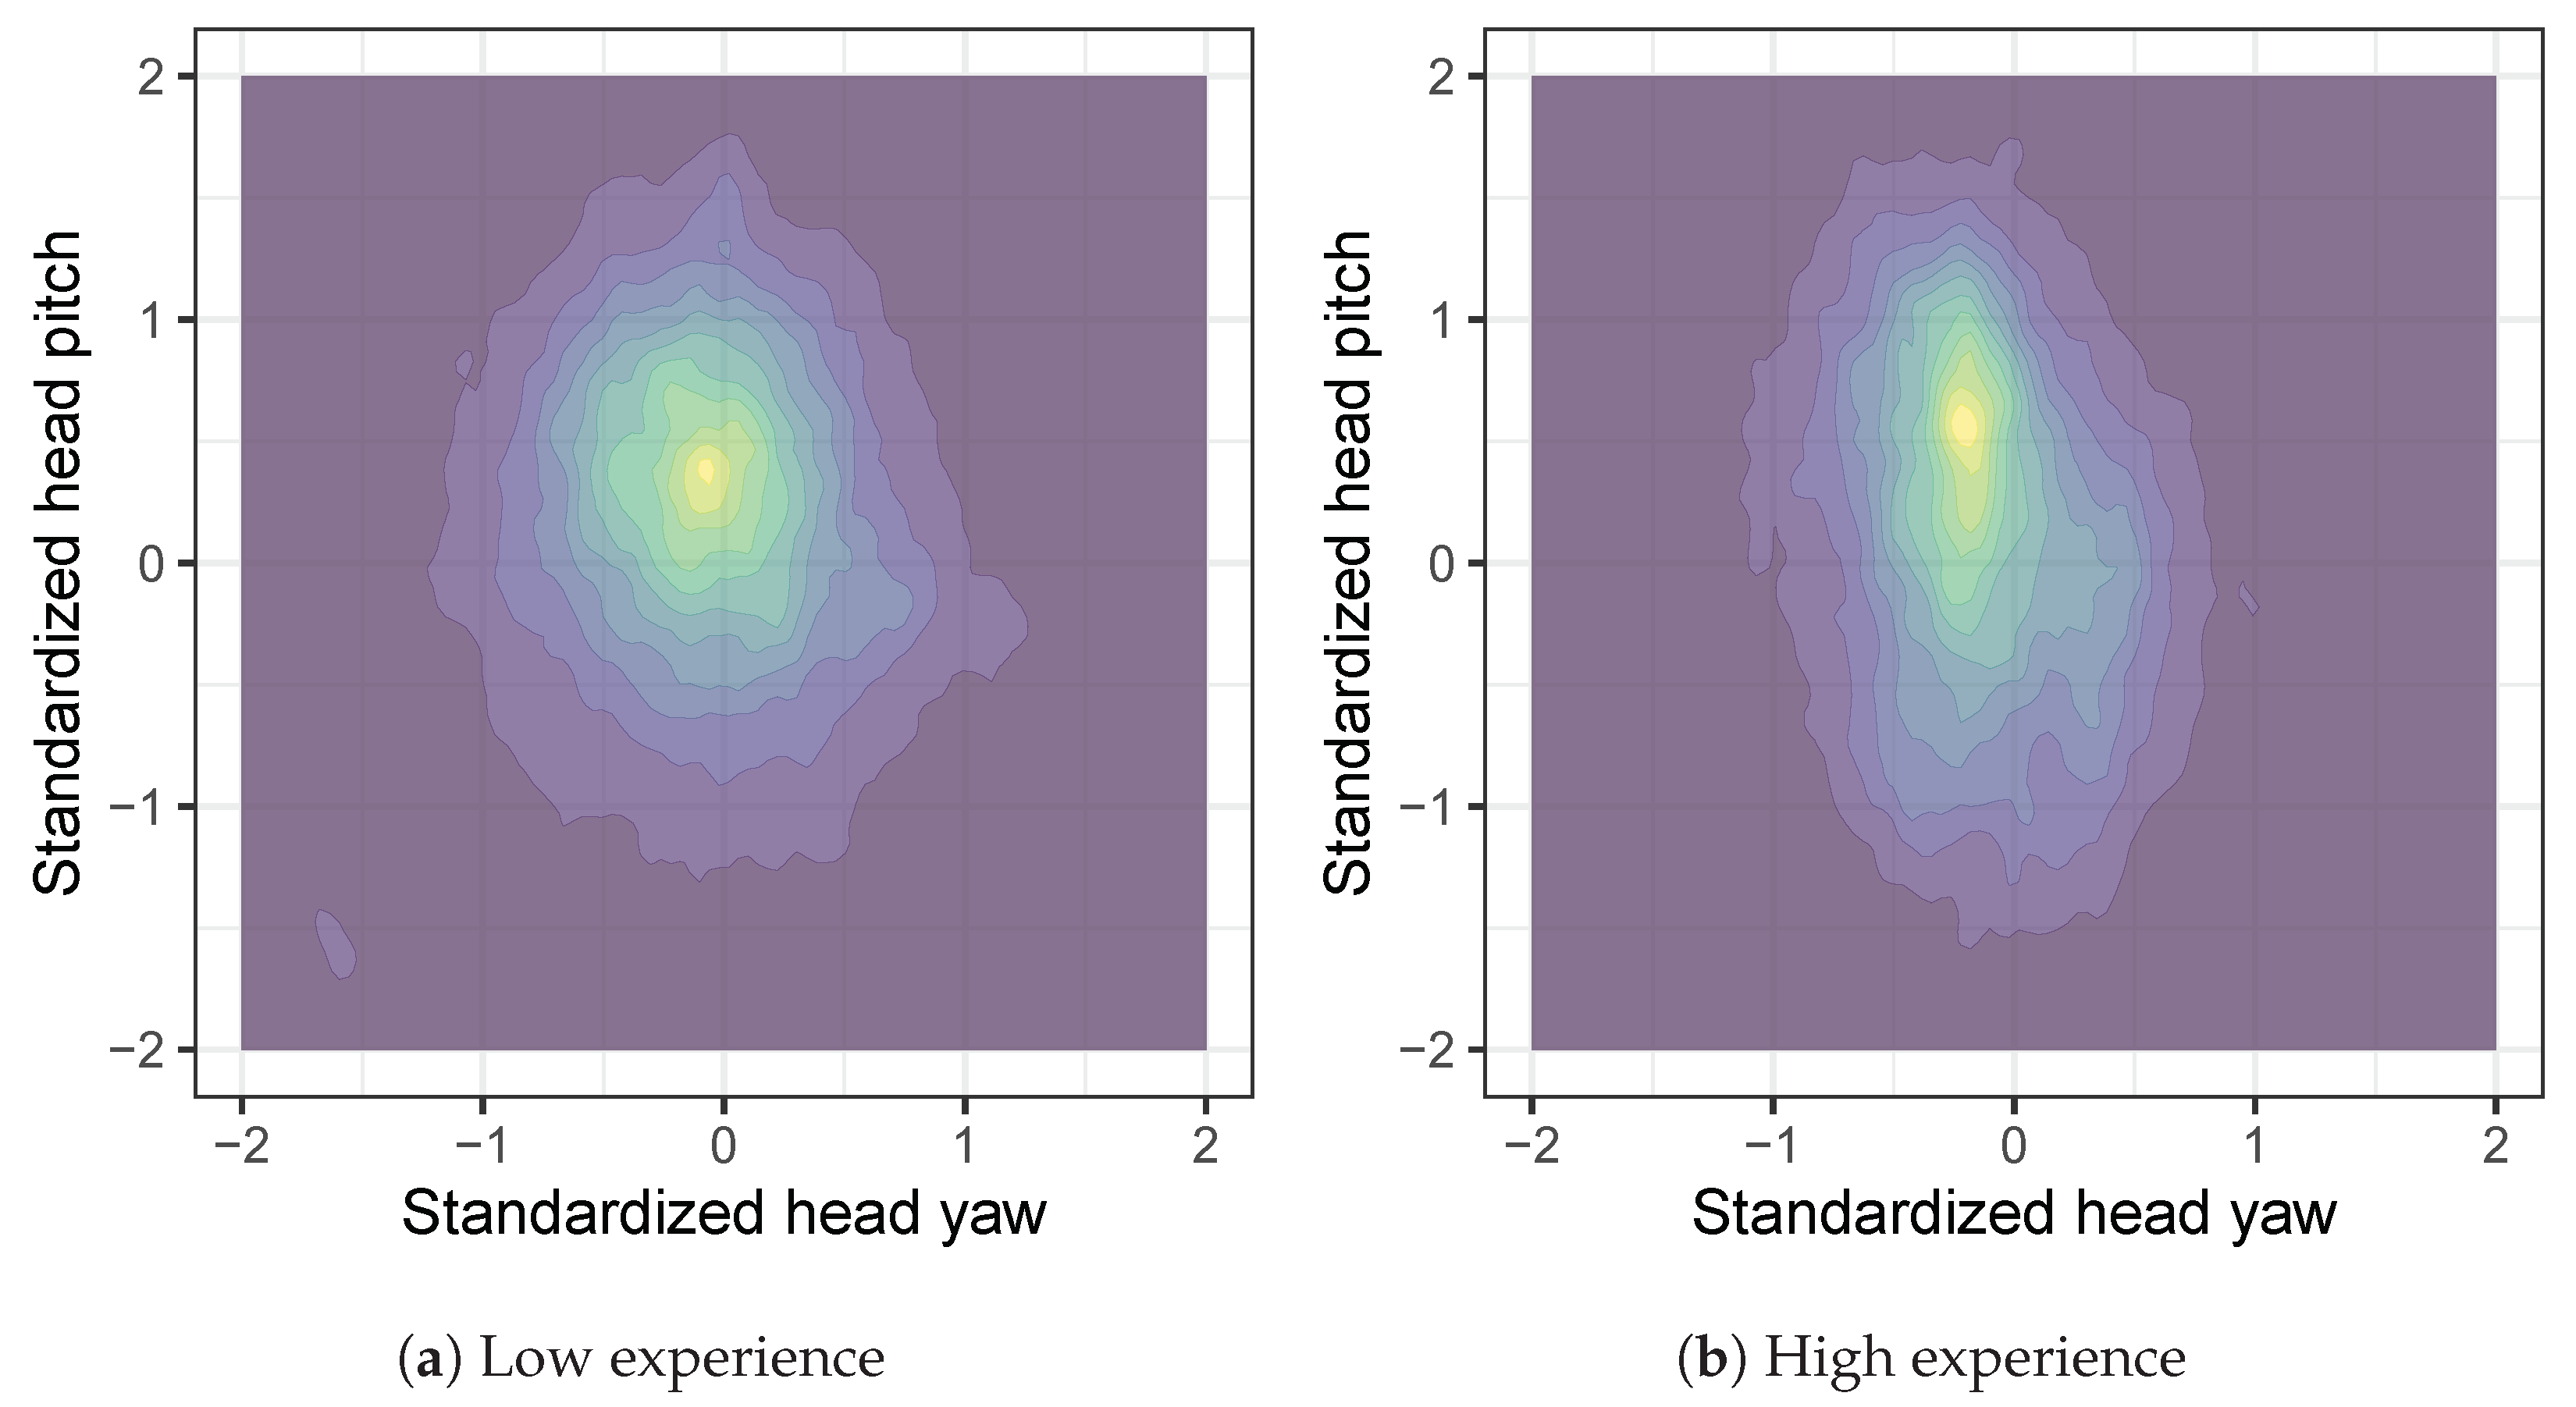
= 0.24) experience. Density plots split between the two experience groups can be found in
Figure 7. They reveal a visible trend towards a higher stretch of head movement distribution along the head pitch axis for experienced drivers. While inexperienced train drivers’ head movements were distributed in an almost circular shape around a central area of highest intensity, experienced train drivers’ distribution showed a more oval shape with the area of highest head movement intensity being slightly higher and towards the left.
4. Discussion
This study set out to assess head tracking as a viable alternative to eye tracking in train driver gaze behavior monitoring systems. Based on previous publications that investigated differences in train drivers’ gaze distribution by eye tracking, we tested whether we could find the same effects by using head tracking. For this, we conducted a simulator study in a high-fidelity train simulator, recording the head movements of 25 professional train drivers by analyzing low resolution video data using Visage face-tracking software.
Based on the previous findings of Naghiyev et al. [
21], we hypothesized that driving with ETCS results in a lower head pitch than driving with PZB, since most of the driving-relevant information is displayed inside of the cab, whereas this information is mostly found outside the cab in PZB. There was, however, no significant difference in mean head pitch between the two TPS. These results stand in contrast to the findings of Naghiyev et al. [
21]. This might be due to the relatively little experience with ETCS in our sample. Van der Weide et al. [
35] found that achieving appropriate familiarity with ETCS required a minimum of 1–2 duties per week of driving with ETCS for 1.5 years. Train drivers’ visual strategies might adapt not as fast, therefore head movements may still have been similar to “conventional” driving. However, it may become necessary for train drivers to adapt their visual strategies in order to meet changing requirements resulting from switching between TPSs and automation within rail transport. Another reason might be that eye movements were sufficient for monitoring, and head movements were therefore not necessary. This has also been found in a naturalistic car driving study, where a large part of glances were found to consist of eye and not head movements [
36].
In a further exploratory investigation, we hypothesized that driving with PZB would lead to more head movements to the right compared to driving with ETCS. This was hypothesized due to the difference in the location of driving-relevant information, with signals, speed boards, etc., standing mainly on the right side of the track for PZB and the same information presented mostly on the DMI in the center of the cab for ETCS. Statistical analysis confirmed this assumption with participants looking significantly more to the right when driving with PZB. This result has safety implications for driving with GoA 2. If train drivers are still responsible for hazard detection on and next to the train tracks, a shift in attention to the center might also increase reaction times and decrease detection rates for safety-critical objects on the side of the tracks. This effect might be even more crucial if the decreasing workload and increasing fatigue [
4] related to increasing automation are factored in. Future systems that still rely on the train driver to be responsible for hazard perception should therefore factor in the decreasing attention to the track-side. It should, however, also be noted that this attentional bias to the right side of the track, which we observed when driving with PZB, also bears the risk of longer reaction times and detection rates of hazards on the left side of the track. Driving with ETCS and a more centralized center of attention could, therefore, lead to a more equal hazard detection on both sides of the track. Further research is needed to better explore these interrelations.
Based on the findings of Suzuki et al. [
16], we furthermore hypothesized that driving at lower speeds would lead to a more horizontal and less vertical head movement distribution compared to driving at higher speeds. We could not find a significant difference for high vs. low speed driving, either with PZB or ETCS as the TPS. A possible explanation might be that our simulator could not match the real-life feeling of speed. Therefore, the relatively small difference between high and low speed in each of the automation conditions (each 60 km/h) might not have been sufficient to produce significant effects. Interestingly, density plots showed a tendency towards the assumed more vertical and less horizontal head movement distribution when driving at high speeds compared to low speeds, especially when driving with PZB. In combination with the attention shift to the center when driving with higher automation, this gazing-far-away effect might further narrow the visual area in which safety-critical events on both sides of the tracks and close to the train drivers’ perspective can be recognized sufficiently fast. However, this could in turn lead to improved reaction times to objects further in the distance and straight ahead of the train drivers’ perspective. Further research may be needed to investigate this effect in more detail.
Following Horiguchi et al. [
19], we lastly hypothesized different head movement distributions for experienced and inexperienced drivers. We could not find any significant differences in head pitch and head yaw distributions between the two experience groups. However, density plots showed a broader, more horizontal and less vertical distribution for less experienced train drivers. This could be due to the fact that experienced drivers exhibit more consistent driving patterns with their colleagues than inexperienced drivers. Additionally, they tend to check the speedometer and central display less frequently [
19]. It should be noted that we split our groups based on the median of driving experience in order to have groups of the same size. Future research could determine the separation value on a theoretical basis and thus gain deeper insights into the influence of experience. Furthermore, in addition to pure professional experience, experience with the new train protection system could also play a decisive role. We were unable to test for differences in head movements caused by differences in the experience with the ETCS, as few of the participants were experienced with it.
4.1. Limitations
The overall familiarity with the ETCS was low in our sample. Therefore, the effect of unfamiliarity might have been more influential than initially assumed. Nevertheless, our results are of practical relevance, as train drivers will often have transition phases from the status quo to a new system in future developments in the field of automation. Another limitation of our study was that, typically, train drivers have route knowledge of the routes they are travelling on. This means that they often rely on landmarks or external cues for braking points (mainly for PZB). Although our route in the simulator did not offer any unexpected or unmanageable situations, the distribution of attention could be different when driving on routes with route knowledge. Finally, the age heterogeneity in our sample was quite high, possibly resulting in age related visual decrements. We assume, however, that this influence is negligible due to mandatory visual tests train drivers have to take at regular intervals.
4.2. Conclusions
To our knowledge, our study was the first to use head-tracking with low-resolution video data to capture train drivers’ head movements. We were able to replicate eye-tracking studies’ results that found that train drivers shift their focus significantly to the center when driving with ETCS as opposed to driving with PZB [
21]. However, our study did not show the hypothesised effect of shifting focus to the inside of the cab (indicated by a lower head pitch). We also found only descriptive differences in head movements at low and high speeds and between experienced and inexperienced drivers. There was a trend towards a more vertical and less horizontal distribution at higher speeds and for experienced drivers. This narrowing of the area of attention allocation could reduce detection rates and reaction times to safety-relevant objects on both sides of the track. Although we were able to derive interesting results from the density plots, our use of the head-tracking method may have produced results that were too coarse to allow most statistical analyses to show significant differences. Furthermore, a recent study of eye and head tracking in car drivers found that a large part of glances consist of eye and not head movements [
36]. It is, therefore, possible, that head tracking will not be able to replace eye-tracking applications in driver monitoring in the future. Further studies could use both eye and head-tracking to allow a deeper and more effective comparison between the two methods. Nevertheless, our study provides a valuable first assessment of the head-tracking method as an alternative to eye tracking for use in train driver monitoring systems.
