Article

Neural Network-Based Classifier for Collision Classification and Identification for a 3-DOF Industrial Robot

by
Khaled H. Mahmoud
1,*,
G. T. Abdel-Jaber
2 and
Abdel-Nasser Sharkawy
2,3
1
Mechatronics Department, Faculty of Industry and Energy Technology, New Cairo Technological University NCTU, Cairo 11835, Egypt
2
Mechanical Engineering Department, Faculty of Engineering, South Valley University, Qena 83523, Egypt
3
Mechanical Engineering Department, College of Engineering, Fahad Bin Sultan University, Tabuk 47721, Saudi Arabia
*
Author to whom correspondence should be addressed.
Automation 2024, 5(1), 13-34; https://doi.org/10.3390/automation5010002
Submission received: 17 January 2024 / Revised: 8 March 2024 / Accepted: 11 March 2024 / Published: 14 March 2024
(This article belongs to the Collection Smart Robotics for Automation)

Abstract

:
In this paper, the aim is to classify torque signals that are received from a 3-DOF manipulator using a pattern recognition neural network (PR-NN). The output signals of the proposed PR-NN classifier model are classified into four indicators. The first predicts that no collisions occur. The other three indicators predict collisions on the three links of the manipulator. The input data to train the PR-NN model are the values of torque exerted by the joints. The output of the model predicts and identifies the link on which the collision occurs. In our previous work, the position data for a 3-DOF robot were used to estimate the external collision torques exerted by the joints when applying collisions on each link, based on a recurrent neural network (RNN). The estimated external torques were used to design the current PR-NN model. In this work, the PR-NN model, while training, could successfully classify 56,592 samples out of 56,619 samples. Thus, the model achieved overall effectiveness (accuracy) in classifying collisions on the robot of 99.95%, which is almost 100%. The sensitivity of the model in detecting collisions on the links “Link 1, Link 2, and Link 3” was 97.9%, 99.7%, and 99.9%, respectively. The overall effectiveness of the trained model is presented and compared with other previous entries from the literature.

1. Introduction

Usually, safety is the first effective key factor in any working industrial area. As the need for flexibility in manufacturing continues to increase, robots have been deployed in many fields of manufacturing. More flexibility makes the automation processes more complex. Usually, the optimal level of automation turns out to be less than 100% and, consequently, the role of the human worker remains particularly important [1]. The interaction between humans and the working robots can cause one of the following losses: injuries to workers, machine faults, and time with halted operations. The losses may be complicated when all losses mentioned occur simultaneously. As such, there is a need to consider standards for safety and other issues related to their use in working areas, and they must be fit for purpose [2,3]. Safety issues become very considerable when human–robot interaction (HRI) takes place [4]. Interaction between humans and robots increases the probability of collisions occurring between humans and robots. In 2011, ISO published a standard entitled “Robots and robotic devices—safety requirements for industrial robots” [5,6] as guidance for human interaction with industrial robots. Thus, there is an urgent need to develop reliable methods to estimate and detect collisions between humans and robots.
Usually, cost is a key parameter in engineering design. Any physical property can be traditionally measured using a certain sensor. As torque exerted by a robotic joint is one of these properties, it can be detected by a torque sensor attached to the robotic joint. The interaction between robots and surrounding objects can be detected by vision sensors. Any robot is usually equipped with position sensors, but not all of them are equipped with torque sensors. Also, most robot working environments are not equipped with vision sensors. Equipping a robot or the working environment with additional sensors tends to raise the cost of manufacturing and maintenance. Therefore, there is motivation to investigate the feasibility of torque sensors for measuring torque on joints and detecting undesired torque. The process of detecting the undesired torque and classifying certain values as due to external collisions needs an analysis procedure for the torque signals that come from the torque sensors. According to the literature, this analysis can take place using control approaches, machine-learning methods, or deep-learning methods. The next section, Section 1.1, presents some works that tried to estimate and classify interactions between humans and robots using different types of sensors and to analyze the output signals of sensors based on different methods.
The aim of the present work in this paper is to investigate the feasibility of collecting and analyzing position data from robotic joints to estimate and classify the torque values exerted by the robotic joints.

1.1. Related Work

Some researchers have developed safety methods to estimate and detect collisions through active control based on sensors’ measurements. Avanzini et al. [7] reported that they developed a control strategy based on signals received from distributed distance sensors mounted on a robotic arm. This work aimed to improve the safety of workers when interacting with robots by assessing the dangers raised by robots. Their experiments were conducted on an ABB IRB140 industrial robot. Bdiwi [8] developed a robotic system involving several types of sensors to keep humans safe while interacting with robots. The sensors used were vision, sensitive skin, and force sensors. Luca and Flacco [9] developed an integrated control framework for safe physical human–robot interaction (pHRI) based on a hierarchy of consistent behaviors. They conducted experiments on a KUKA LWR-IV and a Kinect sensor. Geravand et al. [10] presented an end-user approach to detect collisions and reactions on an industrial robotic arm having its own closed-control architecture. The inputs to the control system were joint positions and electric currents of motors. To classify human–robot collision situations, Cioffi et al. [11] studied different algorithms for machine-learning classification. The aim was to obtain a high classification accuracy based on a time series of joint-load torque signals. Based on a 3D point cloud, Wang et al. [12] proposed an algorithm to predict collisions on a dual-arm robot. Sharkawy et al. [13] proposed a method based on a multilayer feedforward neural network (MLFFNN) to detect collisions between humans and a 3-DOF robot. The results showed that the method they developed was effective to detect human–robot collisions.
On the other hand, other researchers have used data-based approaches to estimate and detect collisions. Sharkawy et al. [14] reported that they achieved an effective classification for force sensor signals received from a robot using a pattern recognition neural network (PR-NN). The PR-NN method resulted in high-accuracy results. Chen et al. [15] also reported high-accuracy results. In another application, they developed a model using PR-NN for the purpose of disassembly task recognition in the field of e-wastes (electronic wastes). They used this model for the purpose of human–robot collaboration (HRC) in disassembly tasks. Popov et al. [16] suggested using NN to detect and classify collisions on a 7-DOF industrial manipulator KUKA-IIWA LBR 14 R820. They trained their model using torque data detected by torque sensors on the robotic joints. The detection achieved about a 94% accuracy. Zhang et al. [17] developed an online collision detection and identification (CDI) scheme for human-collaborative robots. They used signals from external torque sensors as input signals to classify the collisions. Their scheme achieved an accuracy of 99.6%. Narukawa et al. [18] proposed a real-time collision detection method. They built their method on the one-class support vector machine (SVM) method for the safe movement of humanoid robots. They only used the data of motion to train and create a model to detect collisions. Using neuro-fuzzy inferences, Shin et al. [19] improved the ability of a fish robot to recognize obstacles and avoid collisions. Their method only used IR sensor measurements as inputs to the neuro-fuzzy inference model. Abu Al-Haija and Al-Saraireh [20] applied five methods of machine learning to detect collisions. These methods were the k-nearest neighbor (KNN) model, the fine decision trees (FDT) model, the logistic regression kernel (LRK), the subspace discriminator (SDC), and the ensemble of bagging trees (EBT) model. The parameters that they used to train their models were the torque, position, and velocity of robotic joints. They reported that the EBT model achieved the best accuracy compared with the other four models. The EBT achieved an accuracy of 97.1%.

1.2. The Main Contribution

The challenge is to estimate and classify torques exerted by robot joints, just by analyzing position and velocity data of robot joints. The seeking is not only to detect whether a collision occurs or not, but also to detect the link of the robot on which collision occurred. The main contribution of the current paper can be outlined as the following:
The first part of the challenge, which is to estimate the external torques exerted on robot joints, was accomplished in our previous work [21]. In our previous work, the external torques were estimated based only on joint position signals. Therefore, the proposed method can be applied with any conventional industrial robot.
This paper proposes a solution for the last part of the challenge. The proposal is to classify the torque signals to detect collisions using PR-NN. The external torques exerted on the robot joints are used as inputs to train a PR-NN model.
Conjugate gradient backpropagation algorithm is considered for the training of the proposed PR-NN. The conjugate gradient backpropagation algorithm has the advantage of a higher accuracy and being more effective when it is compared to the backpropagation algorithm. The backpropagation algorithm becomes unsuitable when dealing with large problems because its convergence rate is exceptionally low [22].
A comparison of the effectiveness of the proposed classifier with other previous literature is also presented.
The rest of this paper is divided as follows: Section 2 shows the proposed method in brief and how it is implemented. Section 3 presents the executed experiments and the obtained results from the developed classifier. In Section 4, a comparison is carried out between the developed classifier and other previous literature. Finally, Section 5 summarizes the crucial points of the paper and puts forth some future work.

2. Material and Methods

As referred to in our previous work [21], a 7-DOF KUKA robot was configured to act as a 3-DOF robot. The KUKA robot used in this work is a collaborative robot, i.e., all joints are equipped with torque sensors. As presented in next section, Joints A1, A4, and A6 of this robot represent Joints J1, J2, and J3, respectively. Link 2 and Link 3 are affected by gravity while Link 1 is not. The working motion θ ( t ) for the three joints is governed by the following equation:
θ t = 1 4 1 4 cos 2 π f t
f: frequency of sinusoidal motion.
A model of a recurrent neural network RNN was implemented to estimate collisions on the robot. The training data inputs were the position data of joints, where the training data outputs were the torque signals, collected from torque sensors on the joints, by the KUKA robot controller KRC. Table 1 contains the main parameters of the training of the RNN model. Figure 1A shows the structure of the trained RNN.
The model was designed and implemented to estimate external collisions at the robot links using joint position data as inputs. The algorithm used to train the RNN model was the Levenberg–Marquardt (LM) algorithm.
In this work, the values of external torque estimated by the RNN model are used as inputs to the PR-NN. The outputs of PR-NN determine/predict whether there is a collision or not.
The approach proposed in this paper is accomplished by the following steps:
(1)
The design of the proposed PR-NN considers the external torque estimated in [21] to recognize the torques of collision. Figure 1 shows the design scheme of the PR-NN classifier model;
(2)
The structure of PR-NN consists of a input layer, hidden layer, and output layer. The number of inputs and neurons of the hidden layer are determined;
(3)
Searching for the best number of neurons of the hidden layer which leads to a lower cross-entropy value and consequently a higher performance. Many trials are conducted to obtain this best number of neurons.
(4)
There is a need for testing and validation of the trained PR-NN to ensure its performance so that it can precisely classify collisions. Other data, rather than those used to train the PR-NN, are used to test and validate the PR-NN. When testing and validation show a high performance (lower cross-entropy), this reveals that the PR-NN is ready to make the classifications;
(5)
A comparison is made between the classification approach proposed in this paper and other approaches proposed in some other publications.

3. Results

In this section, the experimental work conducted to design, train, test, and validate the PR-NN is shown in the first subsection. The second subsection shows the results of the processes conducted in the first subsection.

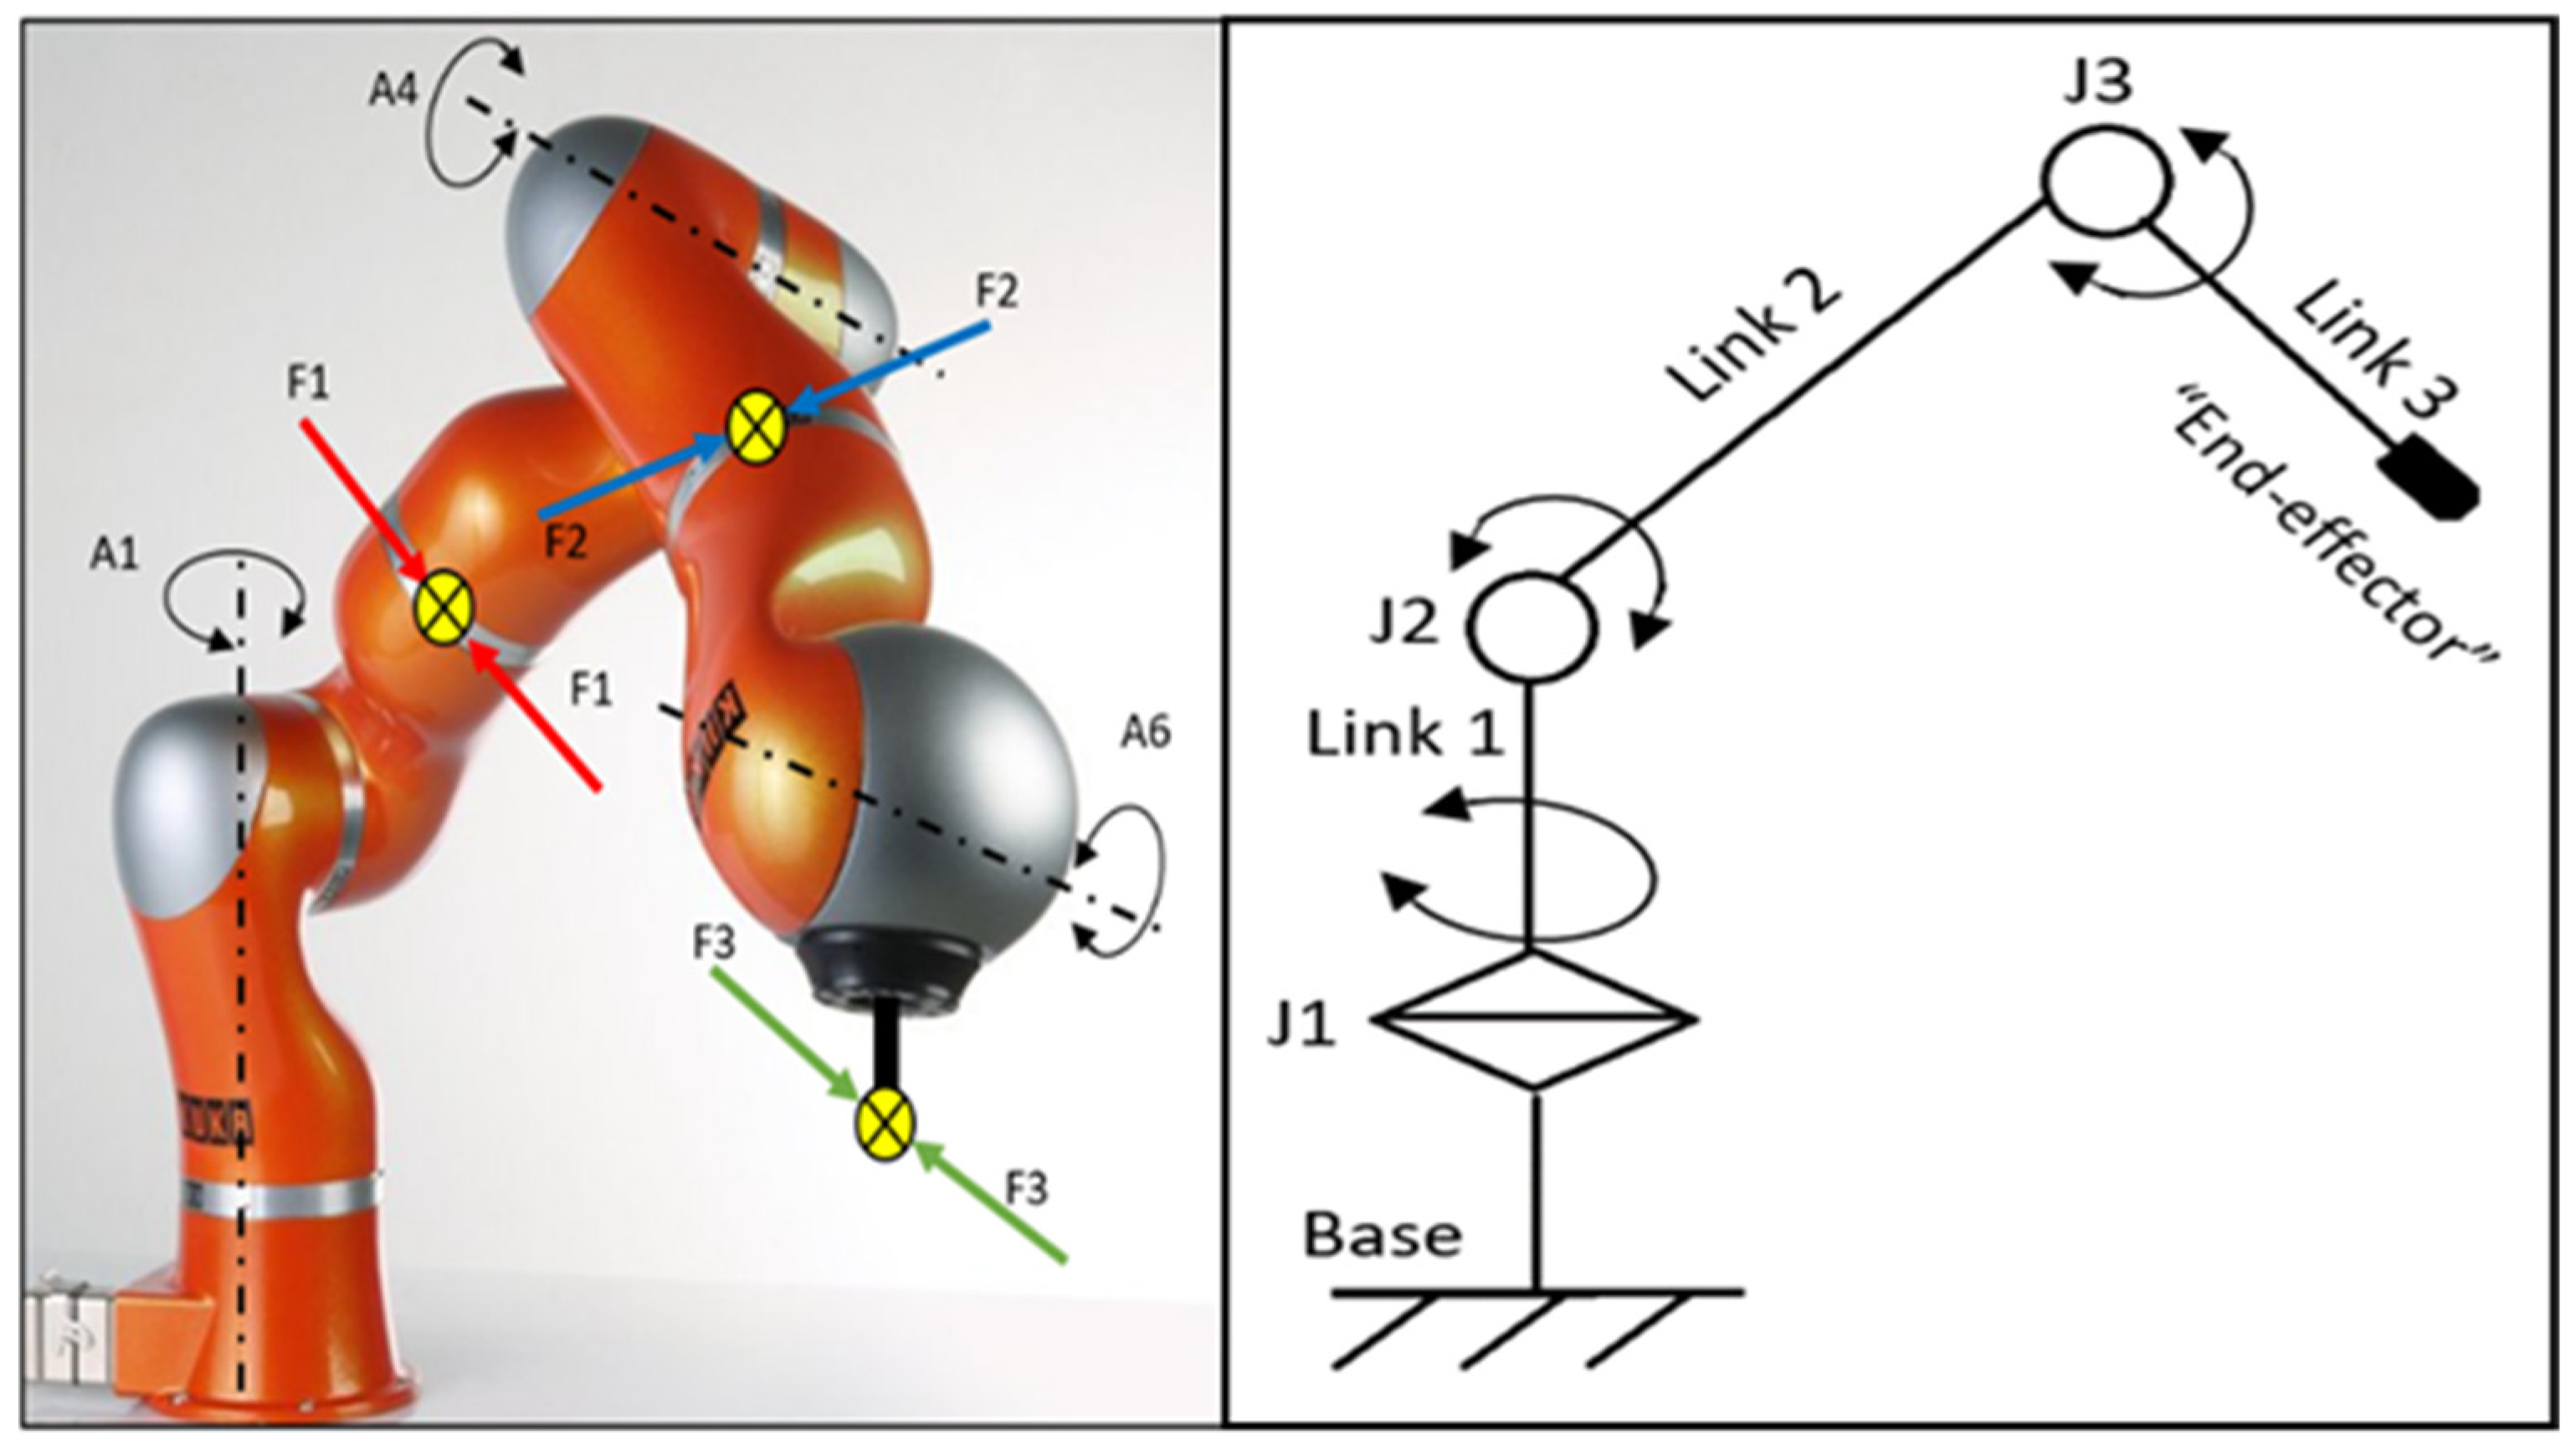
3.1. Experimental Work

As illustrated in [21], a 7-DOF KUKA was configured to act as a 3-DOF robot. A motion was applied on its three active joints to act in the form of sinusoidal motion. The robot used in this experimental work is interactive, so each joint has a torque sensor. After applying motion on the joints, some collisions were applied on the links from different directions (Figure 2). The data collected and recorded from each joint of the robot are the current position θ i ( k ) , the previous position θ i ( k 1 ) , and the angular velocity θ ˙ i ( k ) , and the exerted torque τ ( k ) . While conducting the experiment, the number of samples recorded for each of these data was 70,775 samples. These data were used in our previous work [21] for training an RNN model to estimate torques and determine the torque threshold for each joint. The torque threshold identifies the torque due to collision. When the torque reaches the value of the threshold, it means that a collision has occurred. In this work, the data of the torque were collected from our previous work and classified to train a PR-NN model to classify the collisions. The criteria on which the classification of collision classes occurred are as follows:
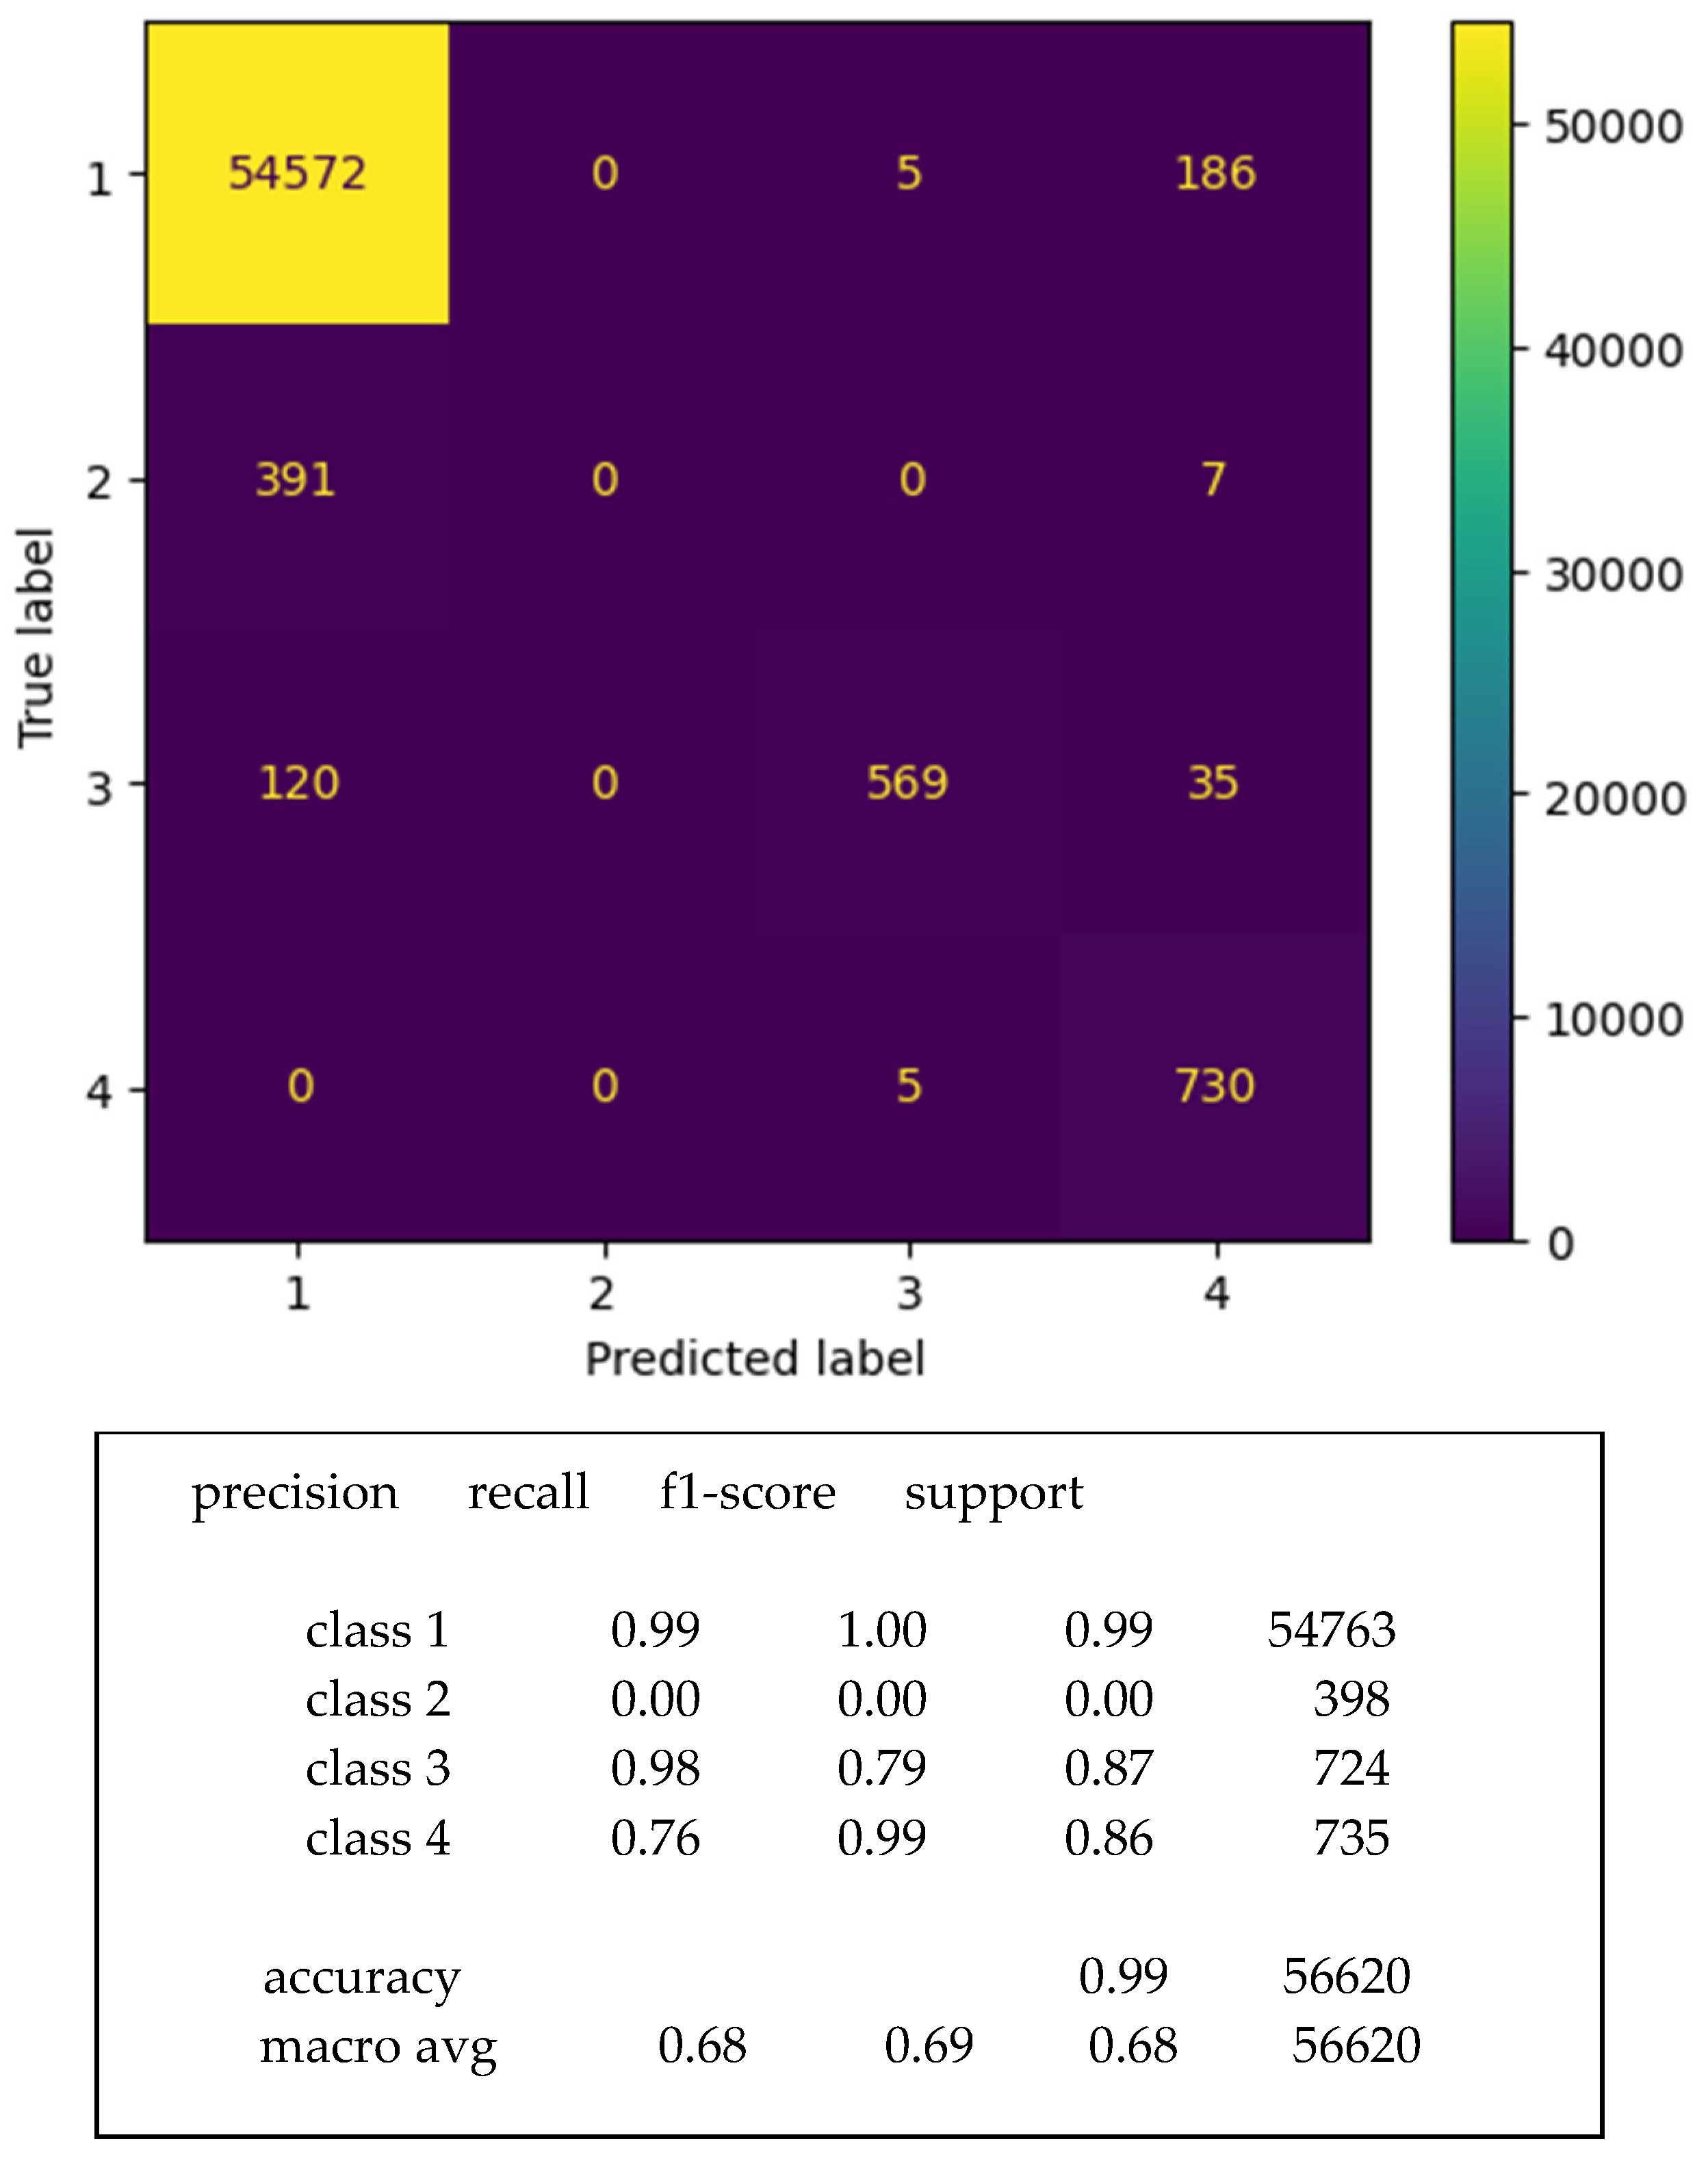
  • Class (1): No collisions: this means no collision torques exerted by any joint;
  • Class (2): Collision on Link 1: this means there is collision torque exerted on Joint 1 only;
  • Class (3): Collision on Link 2: this means there are collision torques exerted on Joints 1 and 2;
  • Class (4): Collision on Link 3: this means there are collision torques exerted on Joints 1, 2, and 3.
These samples were distributed into three sets to train, test, and validate the PR-NN model. The distribution is presented in Table 2. The grid search method was applied using MATLAB to fine-tune the parameters. To obtain an effective PR-NN model, the samples were distributed in three sets in which there were no duplicated data among sets.
Based on our previous work [21], the PR-NN proposed in this present work is to be designed to classify collisions according to torque signals received from torque sensors on the robot’s joints. The simplicity of the structure of neural networks (NNs) makes them widely used in the field of robotics control and collision detection and avoidance, e.g., this research [21,23,24,25,26]. Moreover, NNs have the advantage of the ability of generalization and adaptation [27,28,29]. PR-NNs can produce good classification results in different fields like collision detection in robots [14] and the diagnosis of crack faults [30].
Figure 1B shows the structure of a PR-NN, where the structure is illustrated as the following:
Input layer: This involves three inputs. The three inputs are the three torque values exerted by the three joints of the 3-DOF robot (external torque of Joints 1, 2, and 3). These three inputs were obtained from our previous work [21].
The hidden layer: This is a non-linear layer. It is governed by a non-linear function which is the hyperbolic tangent function “tanh”. The best number of hidden neurons in this layer is obtained by a trial and error method. Many trials were carried out. The trials revealed that the best number of hidden neurons is 120 neurons. It is notable that cross-entropy is an indicator of performance. Through probability and error theory, cross-entropy decreases as the likelihood of occurrence of something increases. When cross-entropy decreases, this means that a higher performance of the PR-NN model is achieved. Cross-entropy is a form of loss function that is widely used. It matches the logistic loss applied to the outputs of the NN when using the SoftMax function [31].
The output layer: This is a non-linear layer which has a SoftMax function as the activation function. The SoftMax function is commonly used in artificial NNs when making a multiclass classification. It usually works in the last layer of an NN. The SoftMax function can be defined by the following formula [32]:
s m ( z ) i = e z i j = 1 k e z j   ,   for   i = 1 , . . , k   and   z = z 1 , , z i R k
For each element “zi” of the input vector “z”, the exponential function is to be applied. In the equation, dividing by the sum of all the exponentials provides normalization for the resulting values. Normalization can guarantee that each element of the output vector sm(z) will not exceed the value of “1”.
After designing the PR-NN model, the next step is to train, test, and validate the model. The MATLAB program was used to execute the processes of this step. The conjugate gradient backpropagation algorithm was used to train the model. This algorithm is a supervised learning algorithm. It has a super-linear convergence rate when dealing with most problems [33]. When comparing this algorithm with a backpropagation algorithm, it can be found that the conjugate gradient backpropagation algorithm is more effective and faster than the backpropagation algorithm [34]. Although the same concepts of the backpropagation algorithm are used for the strategy of general optimization in the conjugate gradient backpropagation algorithm, the last one can effectively define the optimum direction of the search and step size through information arising from the second-order approximation expressed by the following equation:
E w + y E w + E ( w ) T y + 0.5 y T E w y
The global error function is expressed in Equation (1), where it is presented for each point E(w + y) using the Taylor expression. In this equation, w represents the weight vector. E(w) varies depending on the weights and biases connected with the NN. E(w) can also be the standard least square function or it can be any other appropriate error function.
The training occurs using the data mentioned in Table 2. Many experiments were conducted to train the PR-NN model, using many different hidden neurons as shown in Table 3. The table shows the cross-entropy resulting from using different hidden neurons. The lowest cross-entropy (closer value to zero) achieves the highest performance. By the completion of training process, the testing and validation processes occur. The numbers of samples used to test and validate are shown in Table 2. The results are presented in the next section.

3.2. Experimental Results

In this section, the results of the training, testing, and validation of the PR-NN model are presented.
After conducting many trials to train the PR-NN model, the best performance was accomplished through the following parameters:
(1)
The number of hidden neurons, at which the lowest cross-entropy is achieved, is 120;
(2)
The number of iteration/epochs at which the training process ended and the lowest cross-entropy was achieved is 232 epochs;
(3)
The lowest cross-entropy achieved is 0.00026922;
(4)
The time of training is about 19 s. It does not matter what time spent is to complete the training process. The process was accomplished offline. Thus, the prominent issue is to produce a PR-NN model achieving a higher performance.
Figure 3 shows the behavior of the PR-NN model during the training process. It also shows the behavior of the testing and validation processes. The figure reveals that the lowest value of cross-entropy was obtained at 0.00026922 (remarkably close to zero), where the best performance was achieved. Appendix A shows the resulting cross-entropy of other training trials using different numbers of neurons, showing that all of them achieved higher cross-entropy values. Figure 4 presents an error histogram for the PR-NN while in training, testing, and validation. It shows that the values of the error between the predicted values and true targets in all samples are remarkably close to zero. These results reveal that the PR-NN model was trained effectively.
The receiver operating characteristics (ROC) graph has the property of organizing the classifier model and visualizing its performance [35]. The ROC is usually used to measure the relative difference between the true positive rate and the false positive rate [36]. It is memorable that the true positive rate is that rate at which classifier model obtains [positive] for those observations that are truly positive, whereas the false positive rate is that rate at which classifier model obtains [positive] for those observations that are truly negative [14]. Thus, the optimum classification occurs in the case at which the true positive rate is “1” while the false positive rate is “0”. Figure 5 shows the ROC for the proposed PR-NN model, and Figure 6 shows a magnified view for the vertical axis. The figure reveals that the optimum case is achieved in the training process in Figure 5a. The true positive rate is “1” while the false positive rate is around “0”.
As mentioned, the proposed PR-NN model was tested and validated by using data different than those used to train the model. The resulting ROC curve of validation is presented in Figure 5b. It can be clearly seen that the true positive rate is “1” while the false positive rate is around “0”. This shows that the PR-NN model was doing well during the validation process. The resulted ROC curve of testing is presented in Figure 5c. As in training and validation, the true positive rate is “1” while the false positive rate is around “0”. Figure 5d shows the resulting ROC curve for the entire dataset collected (training, testing, and validation data). The resulting ROC curve shows that the true positive rate is “1” while the false positive rate is “0”. This clearly indicates that the true positive rate is “1” while the false positive rate is around “0”.
A confusion matrix can be defined as a collection of predicted information and actual known classification data which is executed in a particular system. Data estimated and obtained for this system are evaluated for the analysis of the performance of the system. While predictive analysis is in progress, a confusion matrix, in the form of a square matrix, is created. The matrix contains positive and negative rates (both true and false).
Individually, the corresponding rates of all these cases are computed [37]. Using positive and negative rates, the accuracy/effectiveness, specificity, sensitivity, precision, negative predictive value, and null error rate are evaluated.
The specific layout of the confusion matrix table allows statistical classification and visualization of the performance of the applied algorithm [38]. The layout of the confusion matrix table is shown in Table 4. Each row in the table represents an instance of predicted values, whereas the column represents the actual values, or vice versa. The confusion matrix contains four major cells/areas. These cells/areas are:
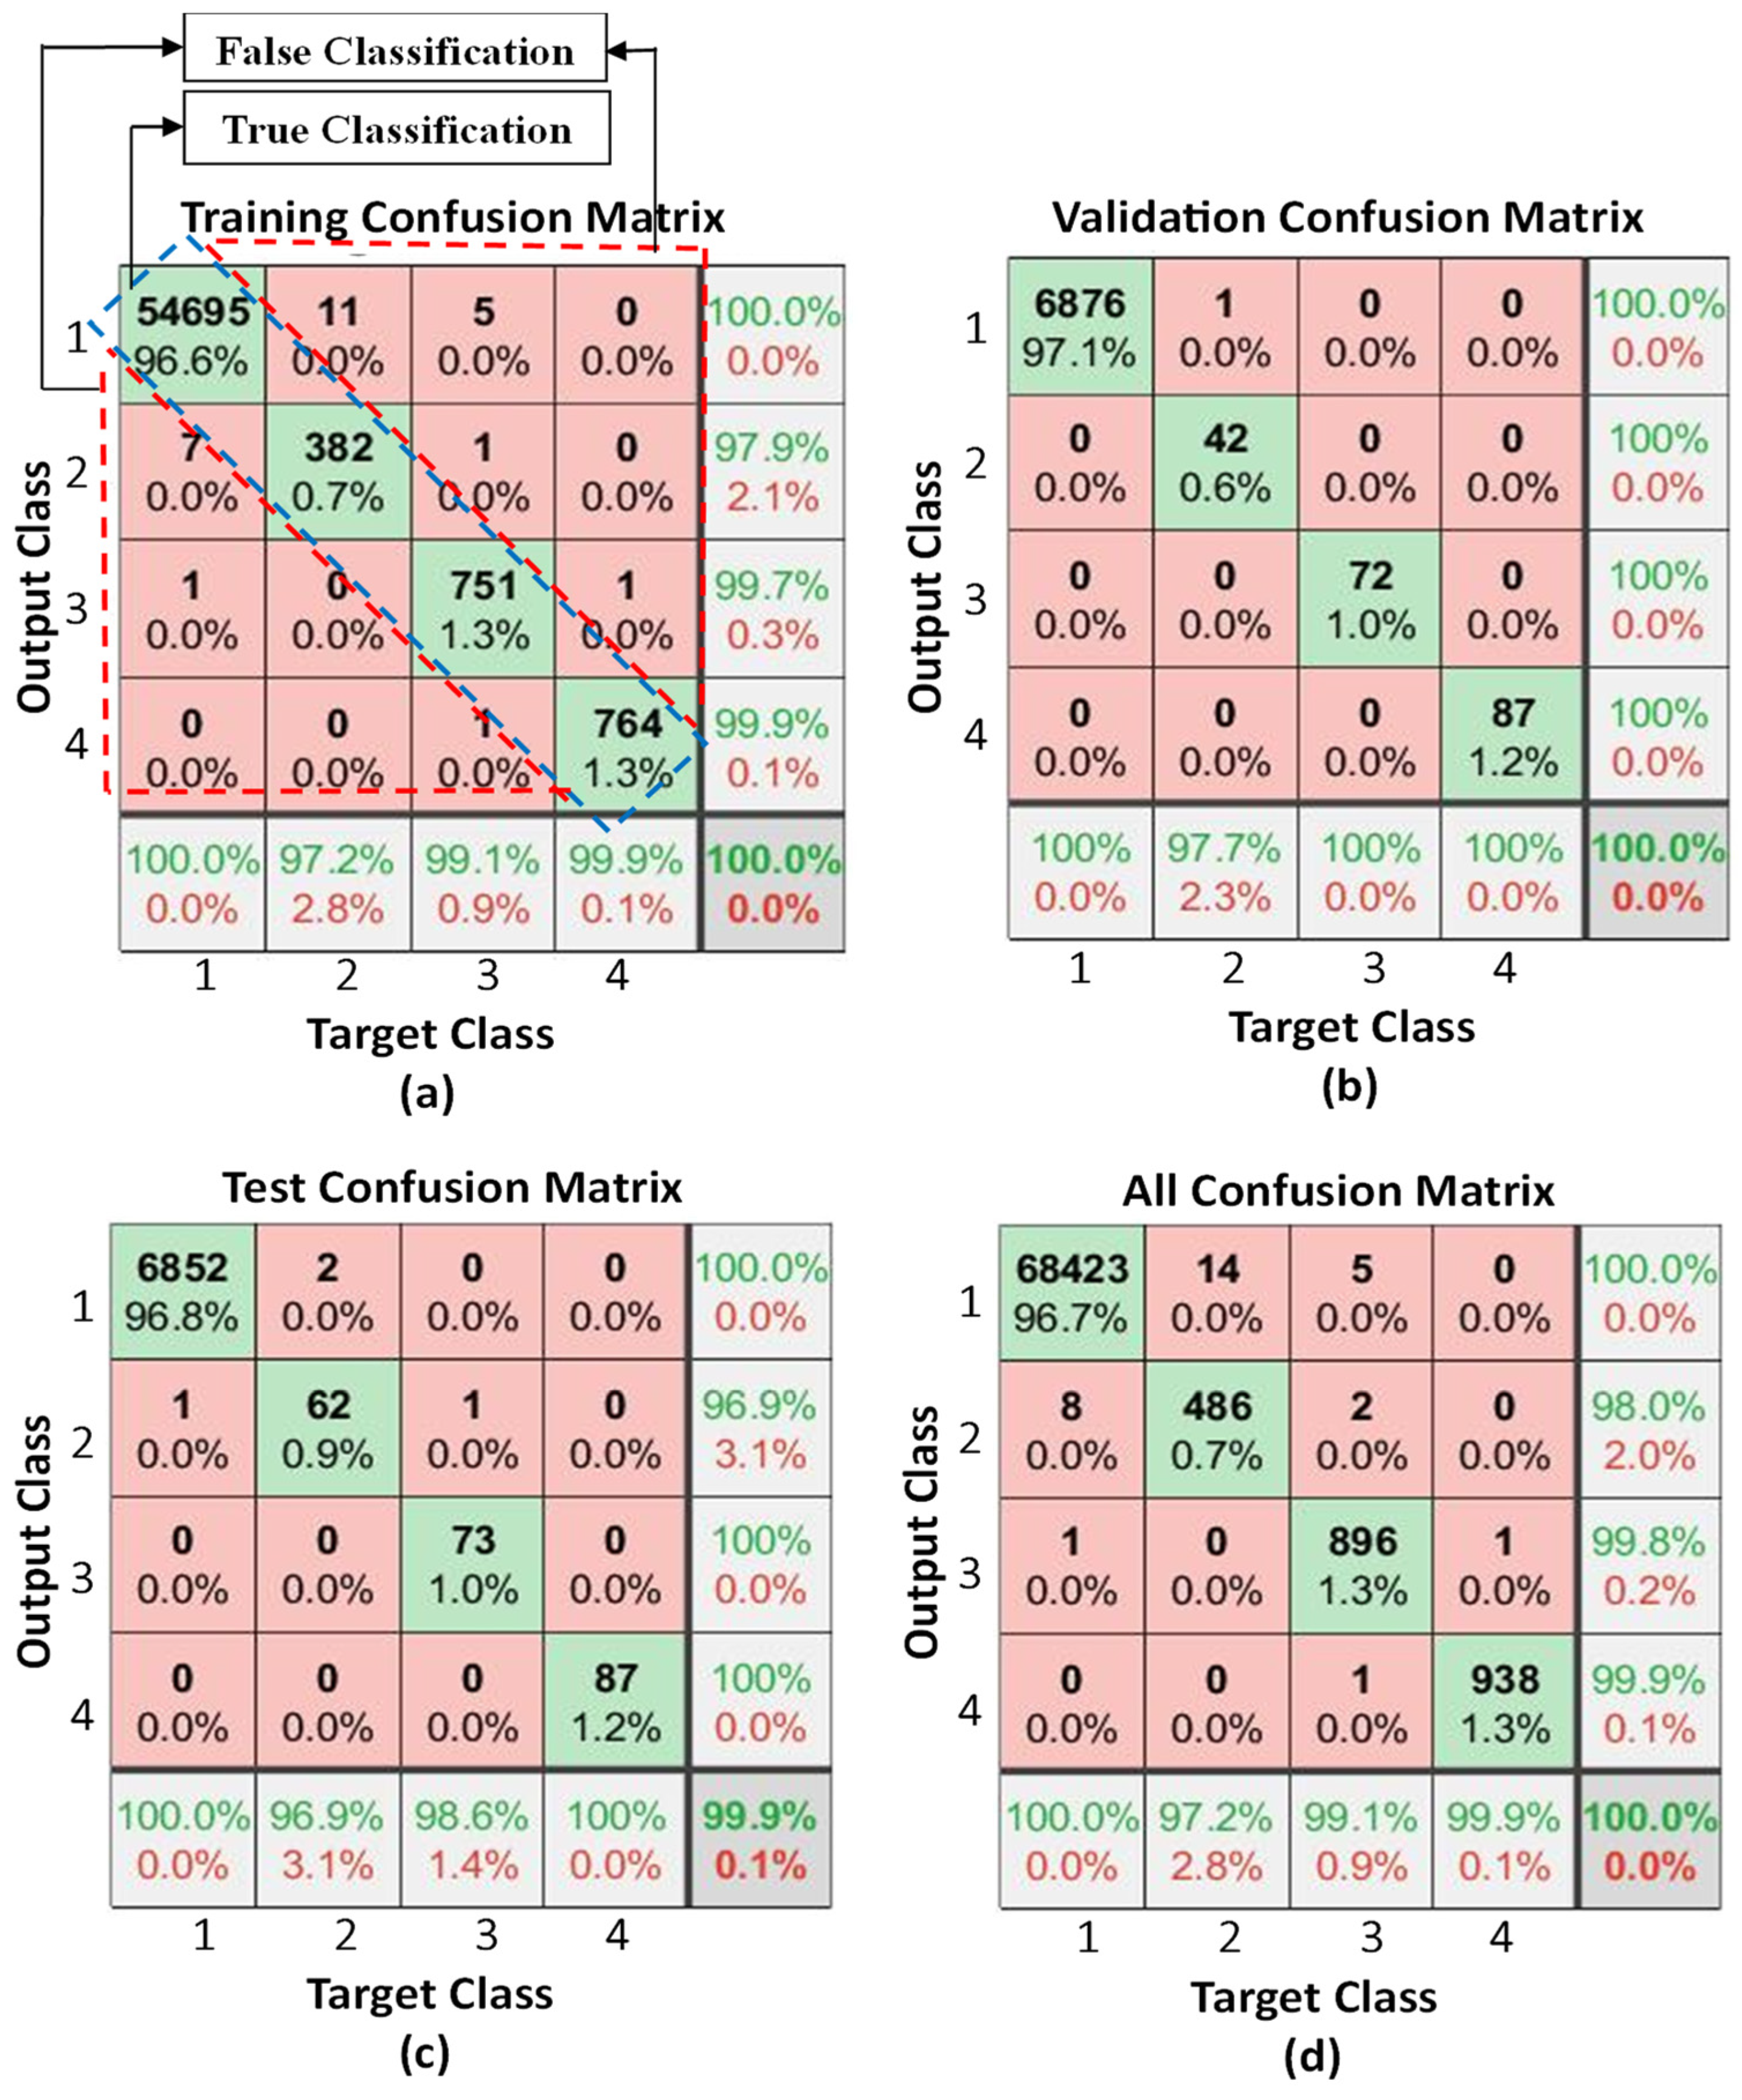
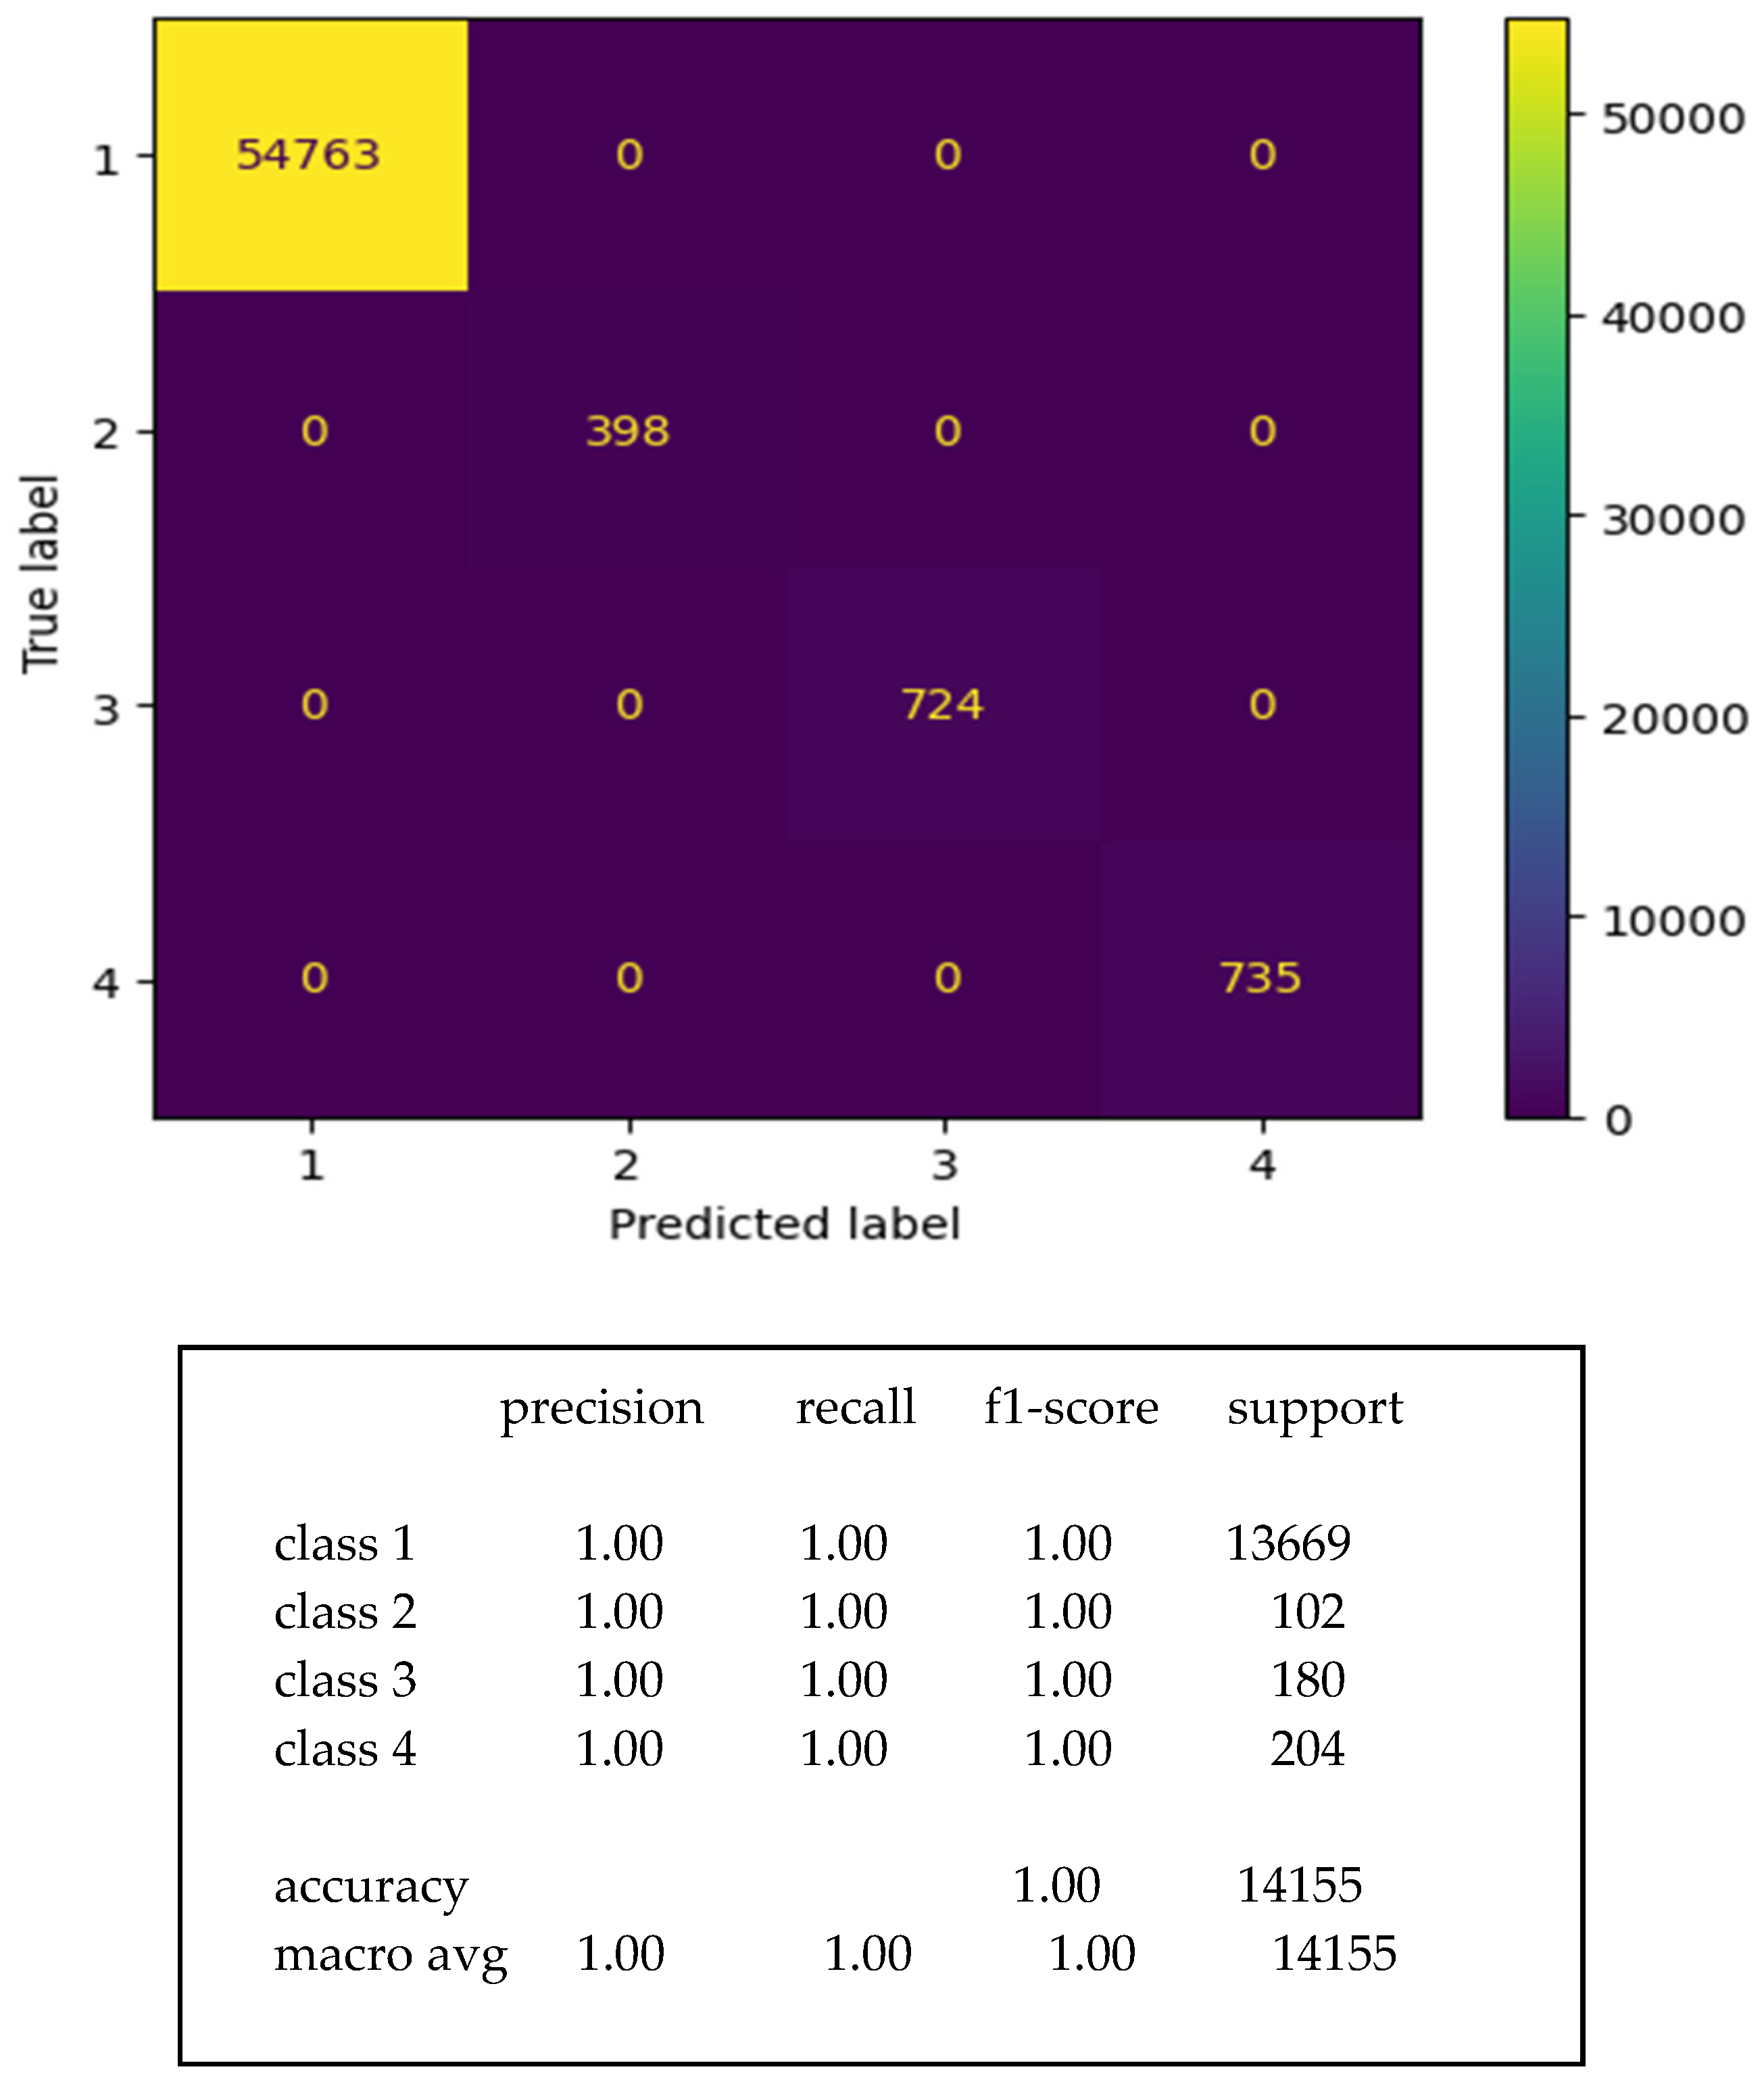
  • True positive (TP) cell: both the actual value and the predicted value are positive;
  • True negative (TN) cell: the actual and predicted values are both negative;
  • False positive (FP) cell: the actual value is negative, but the model predicted value is positive;
  • False negative (FN) cell: the actual value is positive, but the model predicted value is negative.
In Figure 7, the confusion matrix reveals the effectiveness of the proposed PR-NN during the process of training, testing and validation. It is very notable that the MATLAB program rounds the values up, so it calculates and shows some values of effectiveness as 100% when they were not exactly 100% but around 100%. The confusion matrices present four cases:
  • Case (1): No collisions detected on any link;
  • Case (2): Collisions detected on Link 1;
  • Case (3): Collisions detected on Link 2;
  • Case (4): Collisions detected on Link 3.
Figure 7a presents the effectiveness of the proposed PR-NN during the training process. The PR-NN model correctly classified non-collision in 54,695 samples of a total of 54,711 samples. From this, the sensitivity of the model to classify non-collision is 99.97%, which is around 100%. The PR-NN model correctly classified 382 collision samples on Link 1 of a total of 390 samples. From this, the sensitivity of the model to classify collisions on Link 1 is 97.9%. The PR-NN model correctly classified 751 collision samples on Link 2 of a total of 753 samples. From this, the sensitivity of the model to classify collisions on Link 2 is 99.7%. The PR-NN model correctly classified 764 collision samples on Link 3 of a total of 765 samples. From which, the sensitivity of the model to classify collisions on Link 3 is 99.9%. The effectiveness overall of the PR-NN model while training processes is about 100%.
Figure 7b presents the effectiveness of the proposed trained PR-NN during the validation process. As mentioned in Table 2, other data rather than those used to train the model, were used to validate the proposed PR-NN mode. The PR-NN model correctly classified non-collision 6876 samples of a total of 6877 samples. From this, the sensitivity of the model to classify non-collisions is 99.98% which is around 100%. The PR-NN model correctly classified 42 collision samples on Link 1 of a total of 42 samples. From this, the sensitivity of the model to classify collisions on Link 2 is 100%. The PR-NN model correctly classified 72 collision samples on Link 2 of a total of 72 samples. From which, the sensitivity of the model to classify collisions on Link 2 is 100%. The PR-NN model correctly classified 87 collision samples on Link 3 of a total of 87 samples. From this, the sensitivity of the model to classify collisions on Link 3 is 100%. The effectiveness overall while validation is about 100%.
Figure 7c presents the effectiveness of the proposed trained PR-NN during the testing process. Referring to Table 2, amount of data rather than those used to train and validate the model, were used to test the proposed PR-NN mode. The PR-NN model correctly classified non-collision 6852 samples of a total of 6854 samples. From which, the sensitivity of the model to classify non-collisions is 99.97% which is around 100%. The PR-NN model correctly classified 62 collision samples on Link 1 of a total 64 of samples. From this, the sensitivity of the model to classify collisions on Link 1 is 96.9%. The PR-NN model correctly classified 73 collision samples on Link 2 of a total of 73 samples. From this, the sensitivity of the model to classify collisions on Link 2 is 100%. The PR-NN model correctly classified 87 collision samples on Link 3 of a total of 87 samples. From this, the sensitivity of the model to classify collisions on Link 3 is 100%. The effectiveness overall while testing is about 99.9%.
Finally, as shown in Figure 7d, all data collected to train, validate, and test the proposed PR-NN model were used to test the PR-NN model. The PR-NN model correctly classified 68,423 samples of a total of 68,442 samples of non-collision cases. From this, the sensitivity of the model to classify non-collisions is 99.97% which is around 100%. The PR-NN model correctly classified 486 collision samples on Link 1 of a total 4of 96 samples. From this, the sensitivity of the model to classify collisions on Link 1 is 98%. The PR-NN model correctly classified 896 collision samples on Link 2 of a total of 898 samples. From this, the sensitivity of the model to classify collisions on Link 2 is 99.8%. The PR-NN model correctly classified 938 collision samples on Link 3 of a total of 939 samples. From this, the sensitivity of the model to classify collisions on Link 3 is 99.9%. The effectiveness overall while this final stage is 99.95% which is about 100%.
The results of training, testing, and validation indicate and promise that the trained PR-NN model will show a high performance when testing it using different data. This is effectively achieved when different data collected of the robot moving, containing collisions, were classified using the proposed trained PR-NN model. Figure 8 shows how the signals generated by the PR-NN model are based on the torque signals that the model receives. The collected data were fed to the proposed PR-NN model, and the output was observed. The data fed were torque signals received from the robot on which the model had been trained. This robot is a KUKA robot on which an RNN model was trained, in our previous work [21], to predict and estimate the threshold of collision torque on each joint. The signals are transmitted from torque sensors on the three joints. The effectiveness of the proposed PR-NN model will become obvious when observing the behavior of the torque signals and detecting the response of the PR-NN model when the torque signal exceeds the torque threshold. Excess torque via the threshold means that a collision occurs at this torque value. The optimal behavior by the PR-NN model is to generate a signal having a value of “1” when the torque signal excess the torque threshold, i.e., when detecting a collision. Figure 7 shows clearly that in most collision cases, the PR-NN model indicates the collision and produces an output signal, colored by red on the graph, having the value of “1”.

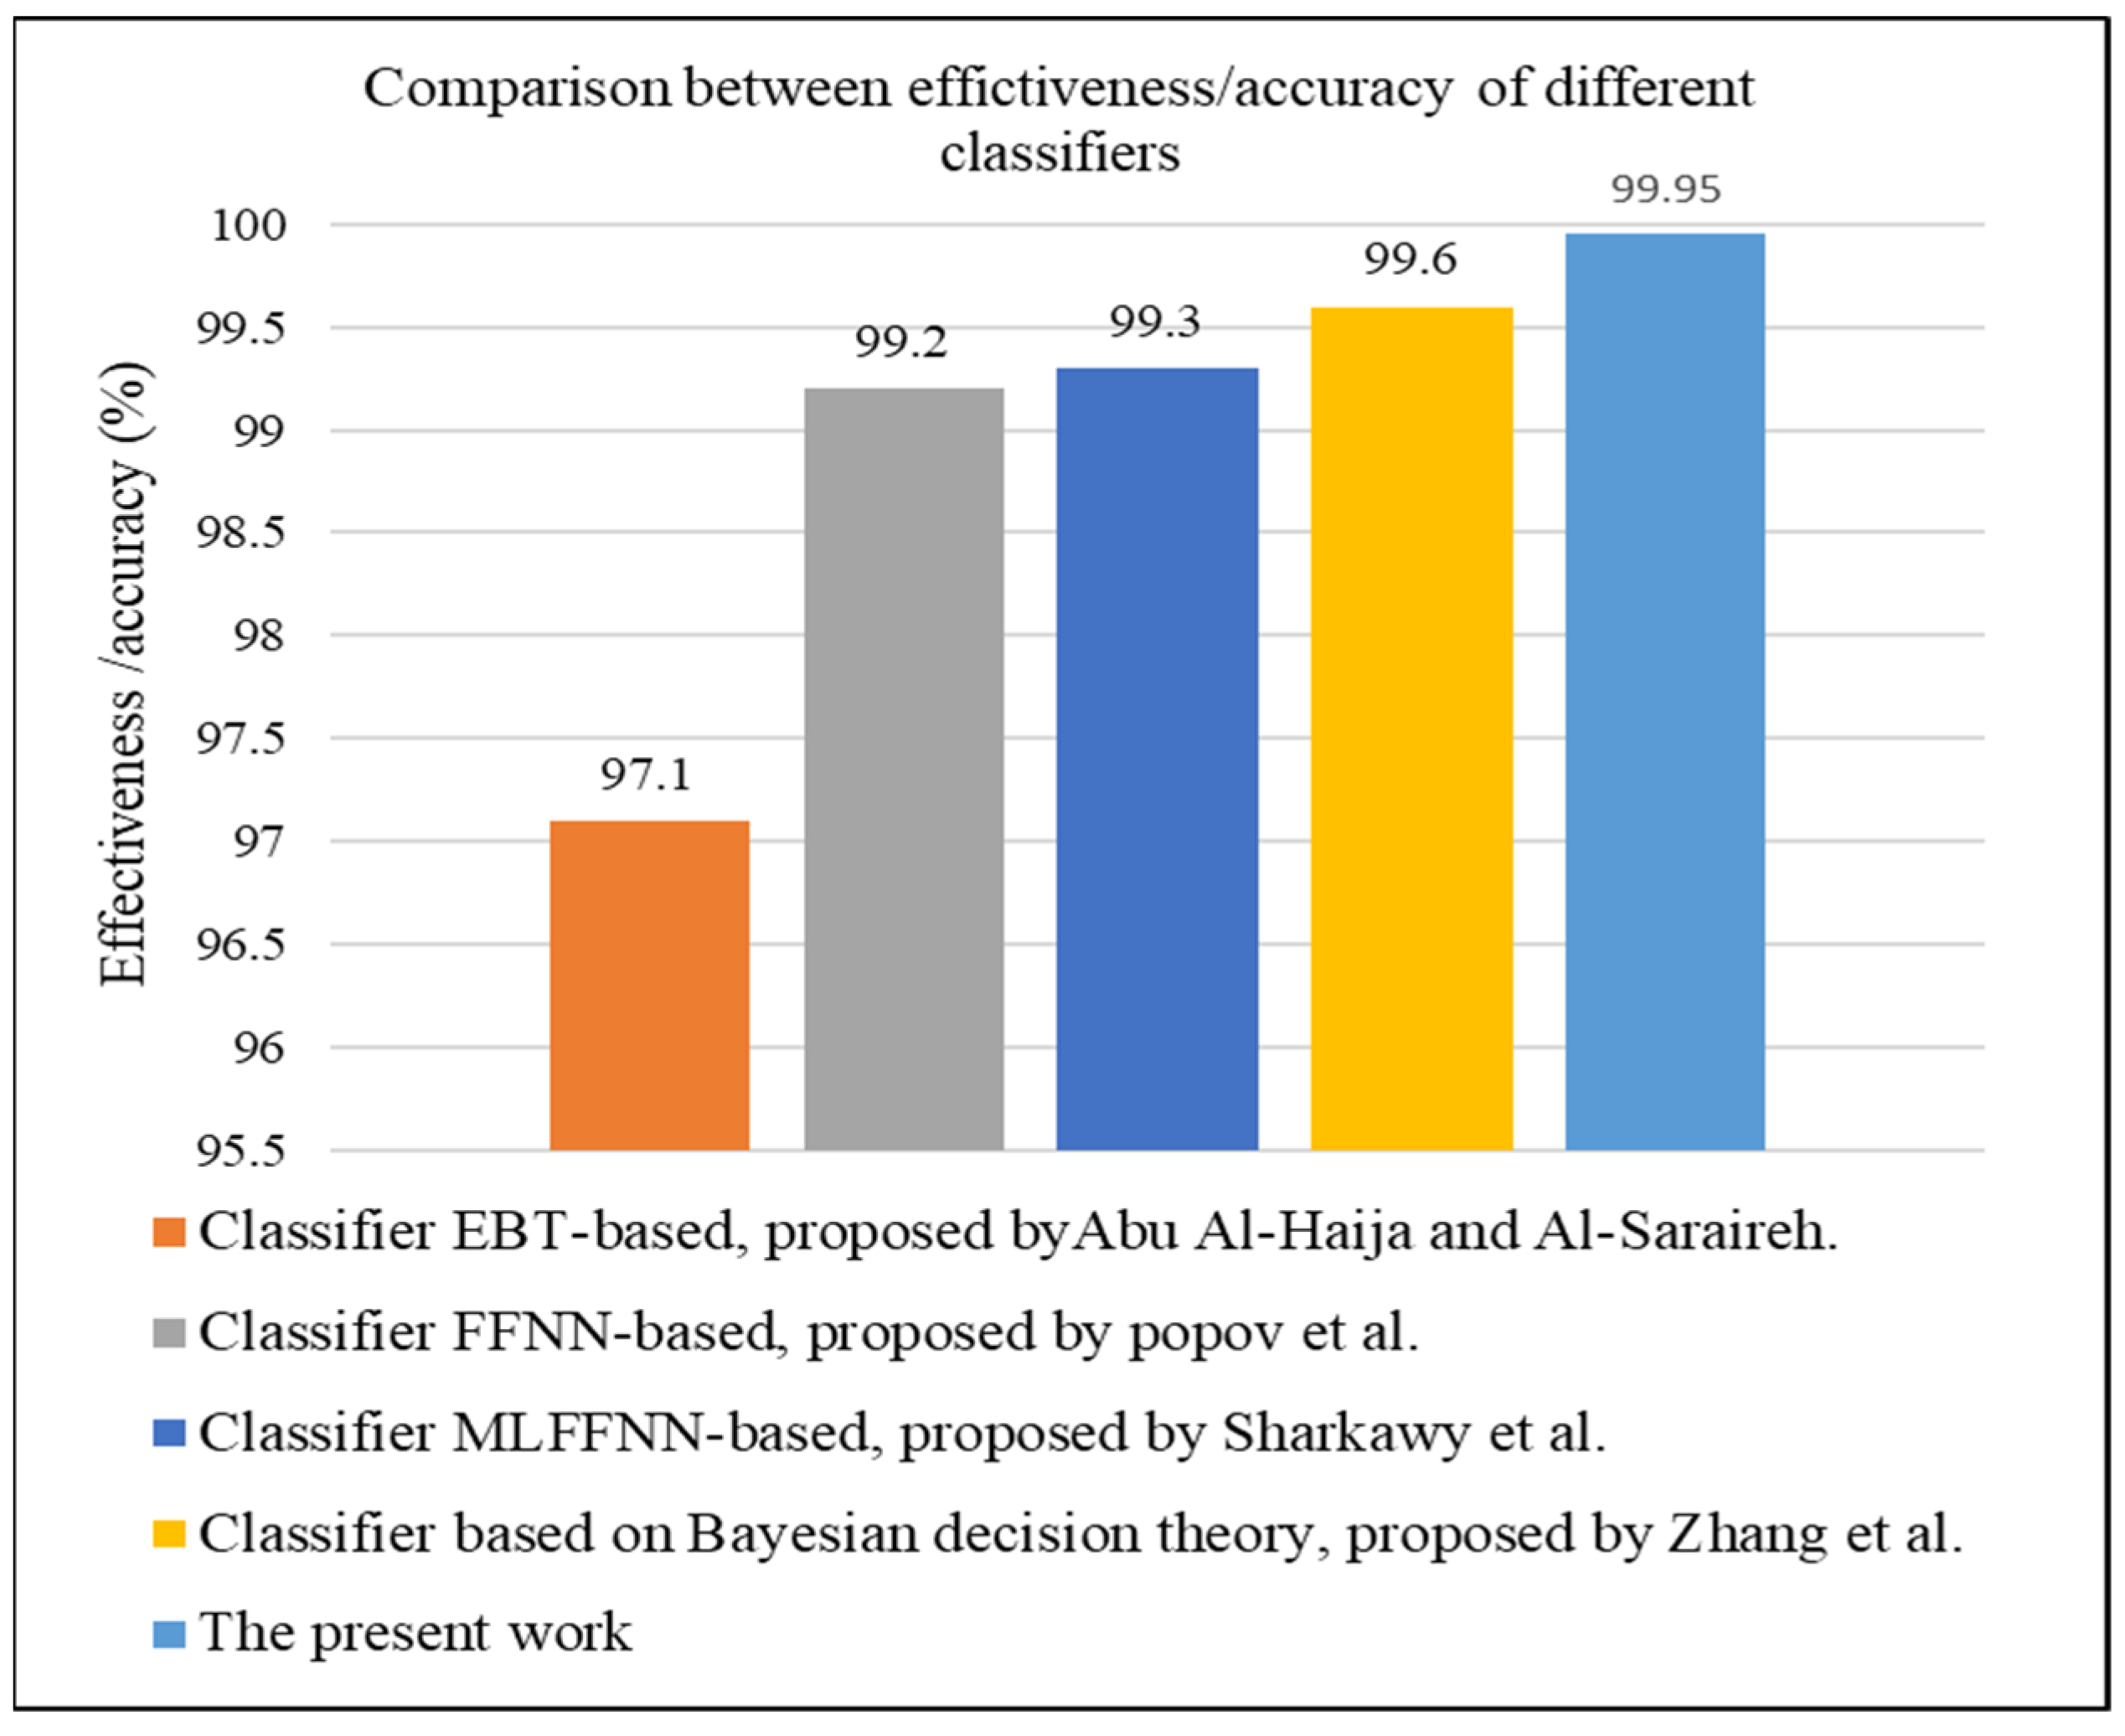
4. Discussion and Comparisons

In this section, the results of our proposed method are compared with the results of other previous researchers. In addition, their methods are developed and used on our data for justifying and effective comparison.

4.1. General Comparison with Literature

In this section, a comparison between the results of the present work and the result of other previous literature is made. Both the present work and the previous research included the required inputs for designing and training the classifier, appropriate applications, and the effectiveness of the classifier. Thus, the results of the present work are discussed through comparison. The classifiers that are to be compared with the present work are:
(1)
The classifier proposed by Sharkawy et al. [14] based on MLFFNN;
(2)
The classifier proposed by Popov et al. [16] based on NN;
(3)
The classifier proposed by Zhang et al. [17] based on Bayesian decision theory;
(4)
The classifier proposed by Abu Al-Haija and Al-Saraireh [20] based on EBT.
Table 5 presents a comparison between the present PR-NN classifier model, which is proposed in this work, and other classifiers proposed by other researchers. The aspects to be compared are the method used to train the classifier model; the inputs used train the model; and the scope of application of the trained classifier model.
When looking at the proposed classifier for this work and that proposed by Sharkawy et al. [14], it can be found that both classifier models are widely applicable. Both have common aspects worth mentioning. This aspect is that the torque signals used to train their classifier models are originally estimated by another NN models. These NN models, which are proposed in previous works, predict the collision torques based solely on the position parameters of joints. Accordingly, both models are widely applicable in any robot type. Other classifiers proposed by Popov et al. [16] and Zhang et al. [17] urgently require torque sensors to accomplish the classification process. Thus, they are restricted to being applicable for collaborative robots.
Comparing the effectiveness (accuracy) of the approach proposed in this work to other mentioned approaches in Table 5, it can be found that the effectiveness of the proposed PR-NN model is 99.95% (which is around 100%) as shown in the confusion matrix (Figure 7a). This is the highest value among those models. A comparison between the effectiveness of the four approaches is presented in Figure 9, showing a comparison between the effectiveness (%) of the present PR-NN classifier proposed in this work and other previous classifiers. Although the results of effectiveness seem close to each other, the proposed method in this paper has the advantage of being applicable in most arm robot types. The PR-NN model proposed in this paper solely uses data of the position and angular velocity of robot joints. These data can be recorded from any working arm robot. Thus, the approach used in this paper can be generalized.

4.2. Experimental Validation for Comparison

In this section, our dataset is used to reproduce the trained models of the methods mentioned in the previous comparison (Section 4.1). The training is conducted using the Python program. The PR-NN is a feedforward NN-based approach for classifications. Thus, FFNN was indeed conducted to produce our PR-NN trained model.
Using the training dataset of our PR-NN model, we tried to produce two trained models based on the EBT method and Bayesian decision theory. Figure 10 shows the training confusion matrix for the EBT trained model. Figure 11 shows the training confusion matrix for the trained model based on Bayesian decision theory.
The data used to train the models are the same as our training data which are collected from a 3-DOF industrial robot. For the EBT model, the training confusion matrix shows that the accuracy of the model is 100%. The input data for the training model are signals of the estimated external torques on the three robot joints. In comparison, the accuracy of the model proposed by Abu Al-Haija and Al-Saraireh [20] is 97.1%. Their model was produced using collected data from a 7-DOF robot. The input data for the training model are the torque, position, and velocity of joints. This reveals that the complicity of data leads to a decreasing model accuracy. The accuracy decreases from 100% to 97.1% while the dataset enlarges, from the data of a 3-DOF robot to the data of a 7-DOF robot. Moreover, the number of input parameters needed to train the model is bigger in the case of 7-DOF.
Our proposed method (PR-NN), which is based on FFNN, shows a close accuracy and more than 99%. Even if the number of input parameters used to train the model increases and the training dataset enlarges, the accuracy value is preserved as higher than 99% [16]. Moreover, one of the limitations associated with ensemble methods is the high computational cost [39]. Another limitation is that making a joint optimization for ensemble loss, although theoretically appealing, can lead to degenerate behavior and pseudo-diversity. This consequently fails to generalize beyond the training data [40].
Classification based on Bayesian decision theory does not have the capacity to recognize intricate correlations between variables [20]. Thus, while the accuracy is about 99%, the average F1-score is about 68%. F1-score is an alternative machine-learning evaluation metric that assesses the predictive skill of a model by elaborating on its class-wise performance. It measures the predictive performance of the trained model. In our work, the F1-score is about 99.2%. Thus, when using Bayesian decision-based classifier, it is important to check the values of the F1-score.
Figure 12 shows a comparison between the accuracy of the mentioned models. As mentioned above, although the EBT-based model achieved a higher accuracy when training with the dataset of a 3-DOF robot, it reveals a lower accuracy with larger datasets. It is observed clearly by looking at the accuracy obtained when the model is trained using the dataset of a 7-DOF robot. The training using FFNN, which our proposed approach is based on, preserves a higher accuracy when trained by small and big datasets.
The accuracies of both models, that trained by the dataset of a 3-DOF robot and the other one which is trained by the dataset of a 7-DOF robot, are close to each other. The accuracy of naïve Bayes is not directly correlated with the degree of the feature dependencies which are measured as the class-conditional mutual information between the features [41]. This can interpret why the F1-score is low (68%) while the accuracy is high (99%). In our trained model, the accuracy is 99.95% and the F1-score is about 99.2%. Thus, the predictive performance of the trained model is high.

5. Conclusions and Future Work

In this work, a PR-NN classifier model was developed to classify collisions of humans with robots. First, the PR-NN classifier model was designed using external torques exerted on the robot. The values of these external toques were estimated in [21]. The target of the proposed PR-NN classifier was to obtain an output classifying whether there were collisions on the robot or not. Moreover, the output determines the link on which the collision has occurred. Secondly, an algorithm of scaled conjugate gradient backpropagation was used to train the PR-NN model. As a result, the smallest value of cross-entropy achieved was 0.00026922 with an effectiveness of 99.95%, which is around 100%.
From the results revealed in this paper, it can be concluded that the PR-NN model can be trained to recognize and classify collision torques using data of the joint position and angular velocity of joints. Comparisons with other previous models were conducted to present the effectiveness of the proposed method.
In future work, we propose applying different methods to develop a classifier model to classify training data inputs. This classification helps to optimize data preparation and distribution and consequently obtain a higher quality classifier which is more reliable. The proposed method will be applied on a higher DOF robot, such as a 7-DOF robot, to investigate its effectiveness and the ability to generalize. Other methods based on neural networks can be used individually or in an integrated system, like the neuro-fuzzy method, to classify collisions on robotic arms.

Author Contributions

K.H.M., G.T.A.-J. and A.-N.S. were responsible for conceptualization, required resources, visualization, data handling, analyzing, investigation, preparation and writing the draft of the manuscript, and editing (review). K.H.M. was the corresponding author, and G.T.A.-J. and A.-N.S. were the supervisors. All authors have read and agreed to the published version of the manuscript.

Funding

This research received no external funding.

Data Availability Statement

The datasets (generated/analyzed) for this study are available from the corresponding author on reasonable request.

Conflicts of Interest

The authors declare that the research was conducted in the absence of any commercial or financial relationships that could be construed as a potential conflict of interest. The authors declare no conflict of interest.

List of Appreciations

PR-NNpattern recognition neural network
RNNrecurrent neural network
pHRIphysical human–robot interaction
HRIhuman–robot interaction
CDIcollision detection and identification
SVMsupport vector machine
IR sensorinfrared sensor
HRChuman–robot collaboration
ROCreceiver operating characteristics
NNneural network
MLFFNNmulti-layer feedforward neural network
FFNNfeedforward neural network
EBTensemble of bagging trees
KNNk-nearest neighbor
FDTfine decision trees
LRKlogistic regression kernels

Appendix A. Performance of the Tried PR-NN Models

Many trials were conducted to achieve the lowest cross-entropy of the trained model. The following shows training trials which achieved greater values of cross-entropy compared with the one used. As mentioned before in the text of the paper, the lower the cross-entropy, the higher the performance, see Figure A1.
Figure A1. The cross-entropy resulted from training process for the PR-NN model using (a) 40 hidden neurons, (b) 80 hidden neurons, (c) 160 hidden neurons, (d) 200 hidden neurons.
Automation 05 00002 g0a1

References

  1. Krüger, J.; Lien, T.; Verl, A. Cooperation of human and machines in assembly lines. CIRP Ann. 2009, 58, 628–646. [Google Scholar] [CrossRef]
  2. Boddington, P. EPSRC Principles of Robotics: Commentary on safety, robots as products, and responsibility. Connect. Sci. 2017, 29, 170–176. [Google Scholar] [CrossRef]
  3. De Santis, A.; Siciliano, B.; De Luca, A.; Bicchi, A. An atlas of physical human–robot interaction. Mech. Mach. Theory 2008, 43, 253–270. [Google Scholar] [CrossRef]
  4. Vasic, M.; Billard, A. Safety issues in human-robot interactions. In Proceedings of the 2013 IEEE International Conference on Robotics and Automation, Karlsruhe, Germany, 6–10 May 2013; pp. 197–204. [Google Scholar]
  5. ISO 10218-1:2011; Robots and Robotic Devices—Safety Requirements for Industrial Robots—Part 1: Robots. ISO: Geneva, Switzerland, 2011.
  6. ISO 10218-2:2011; Robots and Robotic Devices—Safety Requirements for Industrial Robots—Part 2: Robot Systems and Integration. ISO: Geneva, Switzerland, 2011.
  7. Avanzini, G.B.; Ceriani, N.M.; Zanchettin, A.M.; Rocco, P.; Bascetta, L. Safety Control of Industrial Robots Based on a Distributed Distance Sensor. IEEE Trans. Control Syst. Technol. 2014, 22, 2127–2140. [Google Scholar] [CrossRef]
  8. Bdiwi, M. Integrated Sensors System for Human Safety during Cooperating with Industrial Robots for Handing-over and Assembling Tasks. Procedia CIRP 2014, 23, 65–70. [Google Scholar] [CrossRef]
  9. Luca, A.D.; Flacco, F. Integrated control for pHRI: Collision avoidance, detection, reaction and collaboration. In Proceedings of the 2012 4th IEEE RAS & EMBS International Conference on Biomedical Robotics and Biomechatronics (BioRob), Rome, Italy, 24–27 June 2012; pp. 288–295. [Google Scholar]
  10. Geravand, M.; Flacco, F.; De Luca, A. Human-robot physical interaction and collaboration using an industrial robot with a closed control architecture. In Proceedings of the 2013 IEEE International Conference on Robotics and Automation, Karlsruhe, Germany, 6–10 May 2013; pp. 4000–4007. [Google Scholar]
  11. Cioffi, G.; Klose, S.; Wahrburg, A. Data-Efficient Online Classification of Human-Robot Contact Situations. In Proceedings of the 2020 European Control Conference (ECC), St. Petersburg, Russia, 12–15 May 2020; pp. 608–614. [Google Scholar]
  12. Wang, X.; Yang, C.; Ju, Z.; Ma, H.; Fu, M. Robot manipulator self-identification for surrounding obstacle detection. Multimed. Tools Appl. 2017, 76, 6495–6520. [Google Scholar] [CrossRef]
  13. Sharkawy, A.-N.; Koustoumpardis, P.N.; Aspragathos, N. Human–robot collisions detection for safe human–robot interaction using one multi-input–output neural network. Soft Comput. 2020, 24, 6687–6719. [Google Scholar] [CrossRef]
  14. Sharkawy, A.-N.; Ma’arif, A.; Furizal; Sekhar, R.; Shah, P. A Comprehensive Pattern Recognition Neural Network for Collision Classification Using Force Sensor Signals. Robotics 2023, 12, 124. [Google Scholar] [CrossRef]
  15. Chen, Y.; Liao, H.-Y.; Behdad, S.; Hu, B. Human activity recognition in an end-of-life consumer electronics disassembly task. Appl. Ergon. 2023, 113, 104090. [Google Scholar] [CrossRef]
  16. Popov, D.; Klimchik, A.; Mavridis, N. Collision detection, localization & classification for industrial robots with joint torque sensors. In Proceedings of the 2017 26th IEEE International Symposium on Robot and Human Interactive Communication (RO-MAN), Lisbon, Portugal, 28 August–1 September 2017; pp. 838–843. [Google Scholar]
  17. Zhang, Z.; Qian, K.; Schuller, B.W.; Wollherr, D. An Online Robot Collision Detection and Identification Scheme by Supervised Learning and Bayesian Decision Theory. IEEE Trans. Autom. Sci. Eng. 2021, 18, 1144–1156. [Google Scholar] [CrossRef]
  18. Narukawa, K.; Yoshiike, T.; Tanaka, K.; Kuroda, M. Real-time collision detection based on one class SVM for safe movement of humanoid robot. In Proceedings of the 2017 IEEE-RAS 17th International Conference on Humanoid Robotics (Humanoids), Birmingham, UK, 15–17 November 2017; pp. 791–796. [Google Scholar]
  19. Shin, D.; Na, S.Y.; Kim, J.Y.; Baek, S.-J. Fuzzy neural networks for obstacle pattern recognition and collision avoidance of fish robots. Soft Comput. 2008, 12, 715–720. [Google Scholar] [CrossRef]
  20. Abu Al-Haija, Q.; Al-Saraireh, J. Asymmetric Identification Model for Human-Robot Contacts via Supervised Learning. Symmetry 2022, 14, 591. [Google Scholar]
  21. Mahmoud, K.H.; Sharkawy, A.N.; Abdel-Jaber, G.T. Development of safety method for a 3-DOF industrial robot based on recurrent neural network. J. Eng. Appl. Sci. 2023, 70, 44. [Google Scholar]
  22. Nawi, N.M.; Ransing, R.S.; Ransing, M.R. An improved conjugate gradient based learning algorithm for back propagation neural networks. Int. J. Comput. Inf. Eng. 2008, 2, 2062–2071. [Google Scholar]
  23. Nubert, J.; Koehler, J.; Berenz, V.; Allgower, F.; Trimpe, S. Safe and Fast Tracking on a Robot Manipulator: Robust MPC and Neural Network Control. IEEE Robot. Autom. Lett. 2020, 5, 3050–3057. [Google Scholar] [CrossRef]
  24. Soriano, L.A.; Zamora, E.; Vazquez-Nicolas, J.M.; Hernández, G.; Madrigal, J.A.B.; Balderas, D. PD control compensation based on a cascade neural network applied to a robot manipulator. Front. Neurorobot. 2020, 14, 577749. [Google Scholar] [CrossRef]
  25. Liu, Q.; Li, D.; Ge, S.S.; Ji, R.; Ouyang, Z.; Tee, K.P. Adaptive bias RBF neural network control for a robotic manipulator. Neurocomputing 2021, 447, 213–223. [Google Scholar] [CrossRef]
  26. Liu, Q.; Li, D.; Ge, S.S.; Ji, R.; Ouyang, Z.; Tee, K.P. A robust collision prediction and detection method based on neural network for autonomous delivery robots. ETRI J. 2023, 45, 329–337. [Google Scholar]
  27. Hernández-Alvarado, R.; García-Valdovinos, L.G.; Salgado-Jiménez, T.; Gómez-Espinosa, A.; Fonseca-Navarro, F. Neural Network-Based Self-Tuning PID Control for Underwater Vehicles. Sensors 2016, 16, 1429. [Google Scholar] [CrossRef]
  28. Elbelady, S.; Fawaz, H.; Aziz, A.A. Online self tuning PID control using neural network for tracking control of a pneumatic cylinder using pulse width modulation piloted digital valves. Int. J. Mech. Mechatron. Eng. IJMME-IJENS 2016, 16, 123–136. [Google Scholar]
  29. Baroni, M. Linguistic generalization and compositionality in modern artificial neural networks. Philos. Trans. R. Soc. B 2020, 375, 20190307. [Google Scholar] [CrossRef]
  30. Jin, Y.; Hou, L.; Lu, Z.; Chen, Y. Crack Fault Diagnosis and Location Method for a Dual-Disk Hollow Shaft Rotor System Based on the Radial Basis Function Network and Pattern Recognition Neural Network. Chin. J. Mech. Eng. 2023, 36, 35. [Google Scholar] [CrossRef]
  31. Jin, Y.; Hou, L.; Lu, Z.; Chen, Y. Cross-entropy loss functions: Theoretical analysis and applications. arXiv 2023, arXiv:2304.07288. [Google Scholar]
  32. Banerjee, K.; Gupta, R.R.; Vyas, K.; Mishra, B. Exploring alternatives to softmax function. arXiv 2020, arXiv:2011.11538. [Google Scholar]
  33. Aich, A.; Dutta, A.; Chakraborty, A. A scaled conjugate gradient backpropagation algorithm for keyword extraction. In Proceedings of the Information Systems Design and Intelligent Applications: Proceedings of Fourth International Conference INDIA 2017, Da Nang, Vietnam, 15–17 June 2017; Springer: Berlin/Heidelberg, Germany, 2018; pp. 674–684. [Google Scholar]
  34. Johansson, E.; Dowla, F.; Goodman, D. Backpropagation learning for multilayer feed-forward neural networks using the conjugate gradient method. Int. J. Neural Syst. 1991, 2, 291–301. [Google Scholar] [CrossRef]
  35. Fawcett, T. An introduction to ROC analysis. Pattern Recognit. Lett. 2006, 27, 861–874. [Google Scholar] [CrossRef]
  36. Rachakonda, A.R.; Bhatnagar, A. ARatio: Extending area under the ROC curve for probabilistic labels. Pattern Recognit. Lett. 2021, 150, 265–271. [Google Scholar] [CrossRef]
  37. Bhattacharjee, J.; Santra, S.; Deyasi, A. Chapter 10-Novel detection of cancerous cells through an image segmentation approach using principal component analysis. In Recent Trends in Computational Intelligence Enabled Research; Bhattacharyya, S., Dutta, P., Samanta, D., Mukherjee, A., Pan, I., Eds.; Academic Press: Cambridge, MA, USA, 2021; pp. 171–195. [Google Scholar]
  38. Das, C.; Sahoo, A.K.; Pradhan, C. Chapter 12-Multicriteria recommender system using different approaches. In Cognitive Big Data Intelligence with a Metaheuristic Approach; Mishra, S., Tripathy, H.K., Mallick, P.K., Sangaiah, A.K., Chae, G.-S., Eds.; Academic Press: Cambridge, MA, USA, 2022; pp. 259–277. [Google Scholar]
  39. Li, Z.; Ren, K.; Yang, Y.; Jiang, X.; Yang, Y.; Li, D. Towards Inference Efficient Deep Ensemble Learning. arXiv 2023, arXiv:2301.12378. [Google Scholar] [CrossRef]
  40. Jeffares, A.; Liu, T.; Crabbé, J.; van der Schaar, M. Joint training of deep ensembles fails due to learner collusion. Adv. Neural Inf. Process. Syst. 2024, 36, 1. [Google Scholar]
  41. Rish, I. An empirical study of the naive Bayes classifier. In Proceedings of the IJCAI 2001 Workshop on Empirical Methods in Artificial Intelligence, Seattle, WA, USA, 4–10 August 2001; pp. 41–46. [Google Scholar]
Figure 1. The proposed method to create a PR-NN classifier model: (A) The structure of the trained RNN used to estimate the external torques on joints; (B) The proposed PR-NN model which classifies collision according to its inputs of estimated external torques.
Automation 05 00002 g001
Figure 2. Configuration of the KUKA robot as a 3-DOF robot and direction of applying collisions.
Automation 05 00002 g002
Figure 3. The resulted cross-entropy from training process for the PR-NN model.
Automation 05 00002 g003
Figure 4. Error histogram for the PR-NN while training, testing, and validation.
Automation 05 00002 g004
Figure 5. The resulted ROC (receiver operating characteristics) curves from: (a) training, (b) validation, (c) testing, and (d) all collected data when used to train the PR-NN model. The colored lines mentioned in the legend coincide together.
Automation 05 00002 g005
Figure 6. Magnified view for vertical axis in Figure 5 (ROC results): (a) training stage, (b) validation state, (c) testing stage, and (d) all collected data.
Automation 05 00002 g006
Figure 7. Confusion matrices showing the effectiveness of the PR-NN model during (a) the training process, (b) the validation process, (c) the testing process, and (d) when all collected data are used to train the PR-NN model. Four classes are presented in the confusion matrices: Class (1): No collisions, Class (2): Collision on Link 1, Class (3): Collision on Link 2, Class (4): collision on Link 3.
Automation 05 00002 g007
Figure 8. Response of the PR-NN classifier model to the torque signals exerted on the joints.
Automation 05 00002 g008
Figure 9. Comparison between the effectiveness (%) of the present PR-NN classifier proposed in this work and other previous classifiers [14,16,17,20].
Automation 05 00002 g009
Figure 10. Confusion matrix of the model trained by EBT.
Automation 05 00002 g010
Figure 11. Confusion matrix of the trained model based on Bayesian decision theory.
Automation 05 00002 g011
Figure 12. Accuracy of models trained by the researchers’ own datasets vs. those trained by our dataset.
Automation 05 00002 g012
Table 1. The main parameters of developing and training the RNN model.
ParametersValues
Number of layersThree layers: input, hidden, and output layers.
Number of inputsNine inputs: the position of joint, previous position of joint, and angular velocity of joint, for Joints 1, 2, and 3.
Activation function of hidden layerTanh (hyperbolic tangent)—hidden layer is nonlinear
Number of hidden neurons80
Number of outputsThree outputs; force sensor signal, external torque of Joint 1 and of Joint 2
Activation function of output layerNon-linear
Training algorithmLevenberg–Marquardt (LM)
Total collected samples70,776 samples
Number of training samples80% of total samples
Number of validation samples10% of total samples
Number of testing samples10% of total samples
Processer used for trainingIntel(R) Core (TM) i7-7500U CPU @ 2.70GHz 2.90 GHz
Software used for trainingMATLAB
Number of epochs1000
Criterion considered for the trainingConsidering the lowest mean square error MSE. Consequently, the smallest MSE means that the model is the highest accuracy to estimate the external torque.
The smallest (MSE)0.03173
Regression obtained from training0.96797
Table 2. Number of samples used for the training, testing, and validation of the proposed PR-NN model.
ProcessNumber of Samples
(Samples without Collision+ Samples with Collision)
Sample without CollisionSamples with Collision
Training56,61954,7111908
Testing70696854215
Validation70786877201
Table 3. The resulted cross-entropy after conducting many trials with different number of hidden layers.
Number of Hidden Neurons4080120160200
Cross-entropy0.000590.000710.000260.000600.00058
Table 4. Layout of the confusion matrix.
Predicted Classes
PositiveNegative
Actual ClassesPositiveTrue Positive (TP)False Negative (FN)Sensitivity
T P T P + F N
NegativeFalse Positive (FP)True Negative
(TN)
Specificity
T N T N + F P
Precision
T P T P + F P
Negative predictive value
T N T N + F N
Accuracy/Effectiveness
T P + T N T P + T N + F P + F N
Table 5. A comparison between the proposed PR-NN-based classification method and other classification methods proposed by other researchers.
Author’s NameRobot’s DOFMethod Based onInputs Used to Train the Classifier ModelApplication
Sharkawy et al. [14]KUKA
2-DOF
MLFFNNThree inputs: signal of
estimated external force sensor and signals of the estimated external torques on both robot joints.
There is no need for torque signals to classify collisions, so it can be used for any serial robot.
Popov et al. [16]7-DOFFFNNFive inputs: joint positions, commanded joints positions, joints torque, external joints torque, and end-effector Cartesian positions.As torque sensors are urgently needed to make the classification, this method is restricted to being used for collaborative robots which are equipped with joint torque sensors.
Zhang et al. [17]7-DOFBayesian decision theorySeven inputs: torque signals transmitted from torque sensors on the seven joints.As torque sensors are urgently needed to make the classification, this method is restricted to being used for collaborative robots which are equipped with joint torque sensors.
Abu Al-Haija and Al-Saraireh [20]7-DOFEBTFour inputs: torque, position, and velocity of joints.As torque sensors are urgently needed to make the classification, this method is restricted to being used for collaborative robots which are equipped with joint torque sensors.
The present work3-DOFPR-NNThree inputs: signals of the estimated external torques on the three robot joints.There is no need for torque signals to classify collisions, so it can be used for any serial robot.
Disclaimer/Publisher’s Note: The statements, opinions and data contained in all publications are solely those of the individual author(s) and contributor(s) and not of MDPI and/or the editor(s). MDPI and/or the editor(s) disclaim responsibility for any injury to people or property resulting from any ideas, methods, instructions or products referred to in the content.

