
Risk-Weight Calculation of Candidate Risk Factors for Incidental Osteoporotic Fracture in Patients with Rheumatic Diseases: A Potentially Accurate Approach


Abstract
1. Introduction
2. Materials and Methods
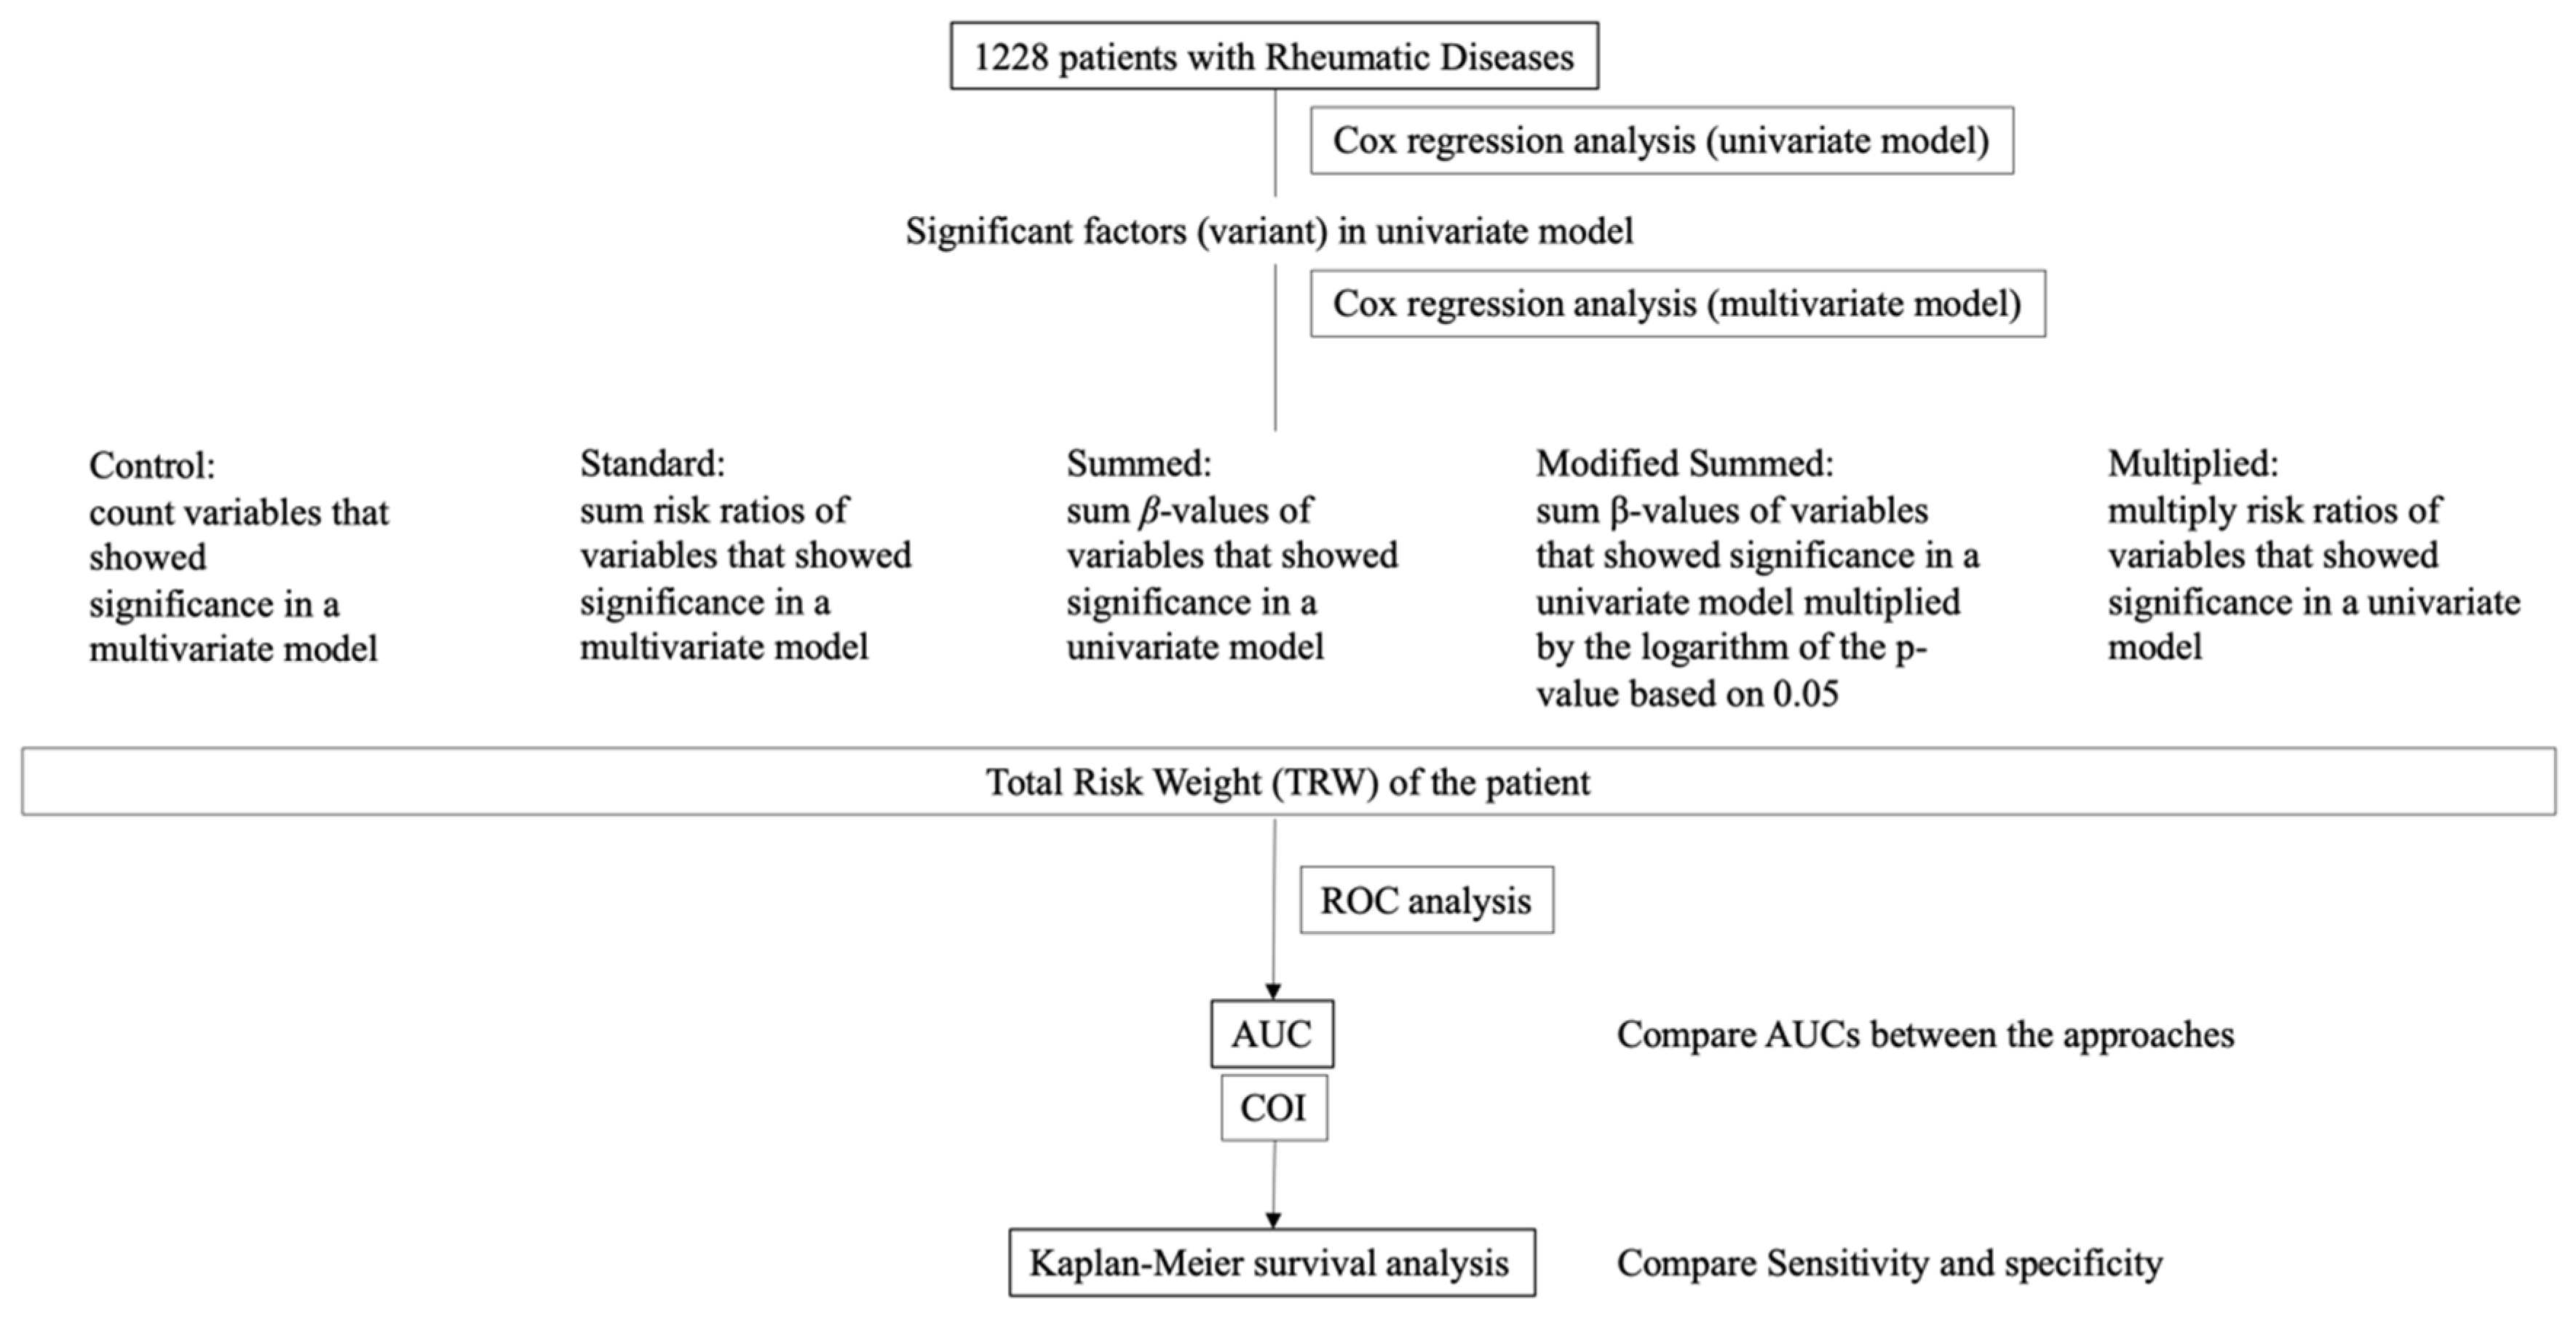
2.1. Patients Recruit and Study Design
2.2. Approaches
2.2.1. Control Approach
2.2.2. Standard Approach with the Summed Risk Ratios
2.2.3. Summed Approach with β-Value
2.2.4. Modified Summed Approach with a Combination of β-Value and p-Value
2.2.5. Multiplied Approach
2.3. Determining COI for Each Approach and Statistical Comparison
2.4. Statistical Procedures
2.5. Ethical Considerations
3. Results
3.1. Patients’ Demographics
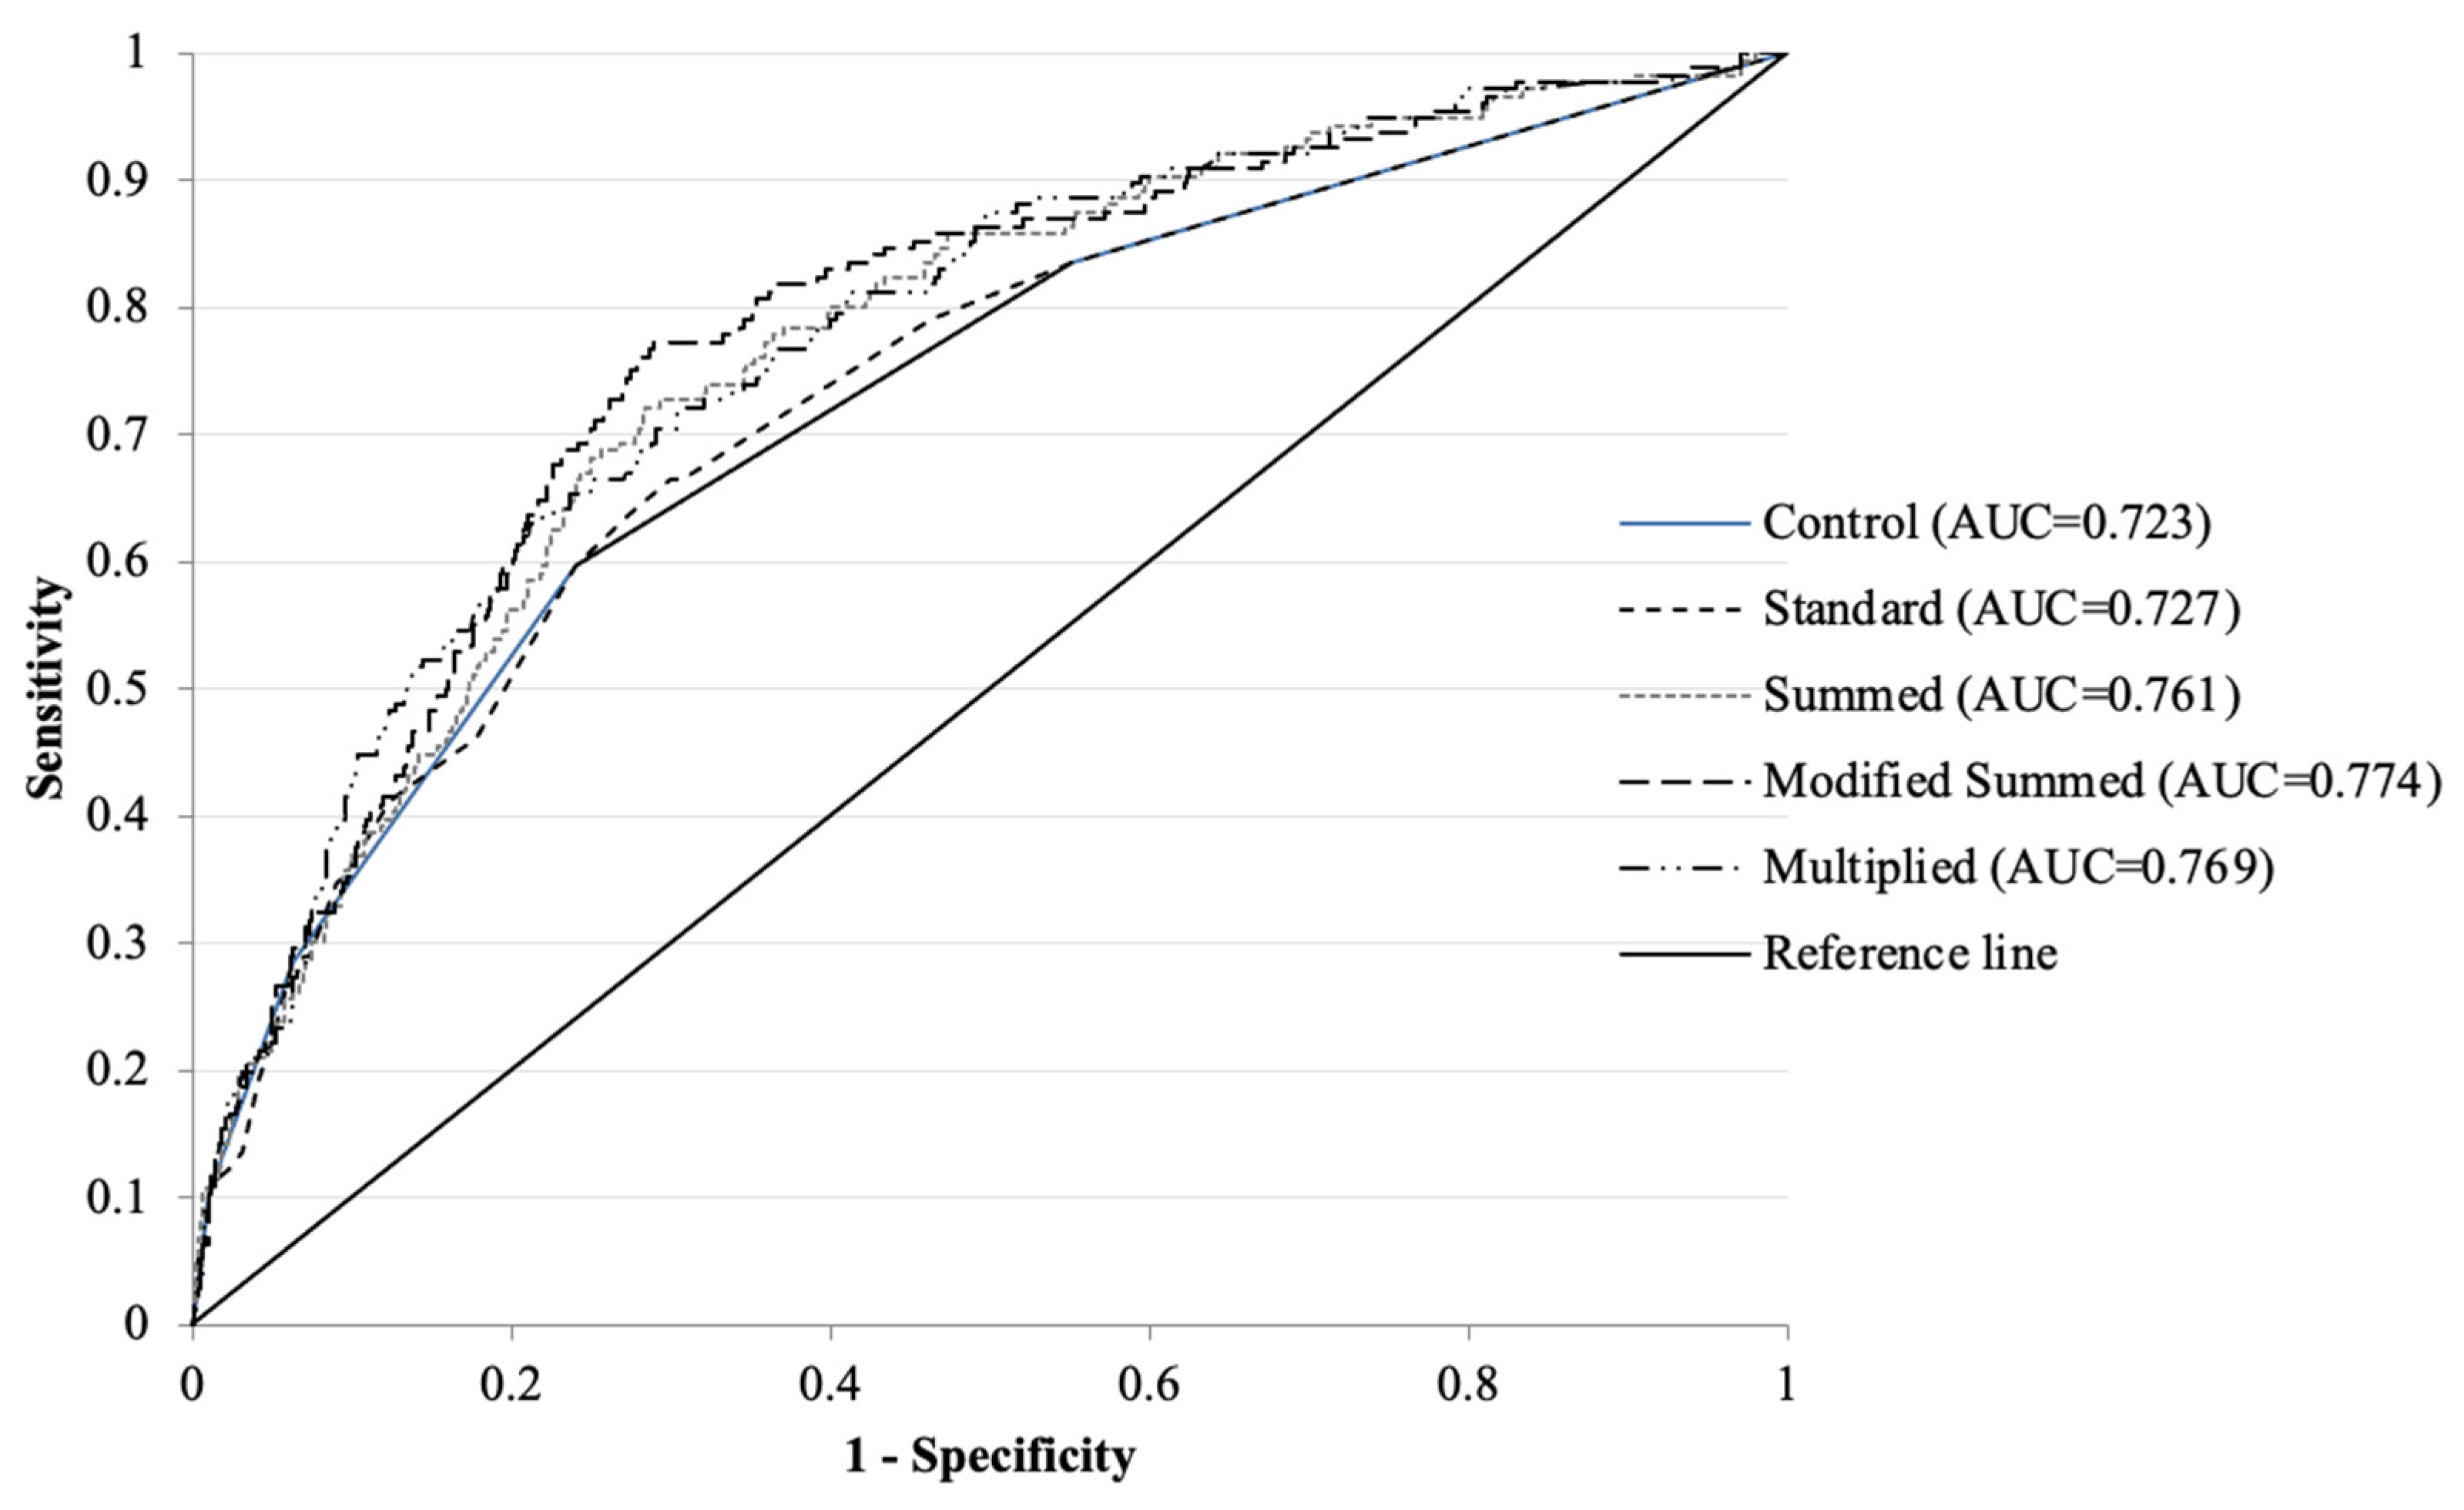
3.2. Comparison Among Approaches
4. Discussion
5. Conclusions
Author Contributions
Funding
Institutional Review Board Statement
Informed Consent Statement
Data Availability Statement
Acknowledgments
Conflicts of Interest
Abbreviations
References
- Kim, S.Y.; Schneeweiss, S.; Liu, J.; Daniel, G.W.; Chang, C.-L.; Garneau, K.; Solomon, D.H. Risk of osteoporotic fracture in a large population-based cohort of patients with rheumatoid arthritis. Arthritis Res. Ther. 2010, 12, R154. [Google Scholar] [CrossRef] [PubMed]
- Raterman, H.G.; Lems, W.F. Pharmacological Management of Osteoporosis in Rheumatoid Arthritis Patients: A Review of the Literature and Practical Guide. Drugs Aging 2019, 36, 1061–1072. [Google Scholar] [CrossRef] [PubMed]
- Baker, R.; Narla, R.; Baker, J.F.; Wysham, K.D. Risk factors for osteoporosis and fractures in rheumatoid arthritis. Best. Pract. Res. Clin. Rheumatol. 2022, 36, 101773. [Google Scholar] [CrossRef]
- Gheita, T.; Fawzy, S.; Rizk, A.; Hussein, H. Impaired bone formation and osteoporosis in postmenopausal elderly onset rheumatoid arthritis patients. Egypt. Rheumatol. 2011, 33, 155–162. [Google Scholar] [CrossRef]
- Wafa, H.; Raja, A.; Dhia, K.; Nada, B.; Imene, Z.; Mohamed, K. Risk factors associated with bone loss and occurrence of fragility fractures in rheumatoid arthritis patients. Egypt. Rheumatol. 2019, 41, 1–5. [Google Scholar] [CrossRef]
- Sayed, S.; Darweesh, H.; Fathy, K.; Mourad, A.M. Clinical significance of bone mineral density in Ankylosing Spondylitis patients: Relation to disease activity and physical function. Egypt. Rheumatol. 2015, 37, 35–39. [Google Scholar] [CrossRef]
- Hafez, E.A.; ElBakry, S.A.; Ibrahim, S.I.; Morad, C.S.; Hamza, S.A.; El-Khalik, A. Assessment of fracture risk in a cohort of Egyptian female Systemic Lupus erythematosus patients. Egypt. Rheumatol. 2018, 40, 85–91. [Google Scholar] [CrossRef]
- Sinigaglia, L.; Varenna, M.; Girasole, G.; Bianchi, G. Epidemiology of osteoporosis in rheumatic diseases. Rheum. Dis. Clin. N. Am. 2006, 32, 631–658. [Google Scholar] [CrossRef]
- Maruotti, N.; Corrado, A.; Cantatore, F.P. Osteoporosis and rheumatic diseases. Rheumatismo 2014, 66, 125–135. [Google Scholar] [CrossRef]
- Ozen, G.; Pedro, S.; Wolfe, F.; Michaud, K. Medications associated with fracture risk in patients with rheumatoid arthritis. Ann. Rheum. Dis. 2019, 78, 1041–1047. [Google Scholar] [CrossRef]
- Adami, G.; Saag, K.G. Osteoporosis Pathophysiology, Epidemiology, and Screening in Rheumatoid Arthritis. Curr. Rheumatol. Rep. 2019, 21, 34. [Google Scholar] [CrossRef] [PubMed]
- Adami, G.; Fassio, A.; Rossini, M.; Caimmi, C.; Giollo, A.; Orsolini, G.; Viapiana, O.; Gatti, D. Osteoporosis in Rheumatic Diseases. Int. J. Mol. Sci. 2019, 20, 5867. [Google Scholar] [CrossRef] [PubMed]
- Adami, G.; Fassio, A.; Rossini, M.; Benini, C.; Pistillo, F.; Viapiana, O.; Bertelle, D.; Gatti, D. Bone loss in inflammatory rheumatic musculoskeletal disease patients treated with low-dose glucocorticoids and prevention by anti-osteoporosis medications. Arthritis Rheumatol. 2023, 75, 1762–1769. [Google Scholar] [CrossRef] [PubMed]
- Buttgereit, F.; Palmowski, A.; Bond, M.; Adami, G.; Dejaco, C. Osteoporosis and fracture risk are multifactorial in patients with inflammatory rheumatic diseases. Nat. Rev. Rheumatol. 2024, 20, 417–431. [Google Scholar] [CrossRef]
- Kanis, J.A.; Oden, A.; Johansson, H.; Borgström, F.; Ström, O.; McCloskey, E. FRAX® and its applications to clinical practice. Bone 2009, 44, 734–743. [Google Scholar] [CrossRef]
- Kanis, J.A.; Johansson, H.; Harvey, N.C.; McCloskey, E.V. A brief history of FRAX. Arch. Osteoporos. 2018, 13, 118. [Google Scholar] [CrossRef]
- Prieto-Alhambra, D.; Judge, A.; Arden, N.K.; Cooper, C.; Lyles, K.W.; Javaid, M.K. Fracture prevention in patients with cognitive impairment presenting with a hip fracture: Secondary analysis of data from the HORIZON Recurrent Fracture Trial. Osteoporos. Int. 2014, 25, 77–83. [Google Scholar] [CrossRef]
- Fernandez, M.A.; Griffini, X.L.; Costa, M.L. Management of hip fracture. Br. Med. Bull. 2015, 115, 165–172. [Google Scholar] [CrossRef]
- Diem, S.J.; Vo, T.N.; Langsetmo, L.; Schousboe, J.T.; Yaffe, K.; Ensrud, K.E.; for the Study of Osteoporotic Fractures (SOF) Research Group. Impact of competing risk of mortality on association of cognitive impairment with risk of hip fracture in older women. J. Bone Miner. Res. 2018, 33, 1595–1602. [Google Scholar] [CrossRef]
- Luo, J.; Su, L.; Ndeke, J.M.; Wang, F.; Hendryx, M. Gait speed, handgrip strength, and cognitive impairment among older women–A multistate analysis. Exp. Gerontol. 2022, 169, 111947. [Google Scholar] [CrossRef]
- Wikipedia. Proportional Hazards Model. Available online: https://en.wikipedia.org/wiki/Proportional_hazards_model (accessed on 20 April 2023).
- Boos, D.D.; Stefanski, L.A. P-Value Precision and Reproducibility. Am. Stat. 2011, 65, 213–221. [Google Scholar] [CrossRef]
- Cross Validated. What is the Name of a Plot of -log 10 of p Values in Multiple Testing? Available online: https://stats.stackexchange.com/questions/89644/what-is-the-name-of-a-plot-of-log-10-of-p-values-in-multiple-testing (accessed on 20 April 2023).
- Langseth, H.; Jensen, F.V. Bayesian networks in reliability. In Encyclopedia of Statistics in Quality and Reliability; Ruggeri, F., Kennett, R.S., Faltin, F.W., Eds.; Wiley: Hoboken, NJ, USA, 2007; Available online: https://vbn.aau.dk/en/publications/bayesian-networks-in-reliability-2 (accessed on 20 April 2023).
- Albert, J. Chapter #6 Markov chain Monte Carlo methods. In Bayesian Computation with R, 2nd ed.; Ishida, M.; Ishida, K., Translators; Springer: Tokyo, Japan, 2009. [Google Scholar]

| Disease Name | Female Gender (%) | Mean Age, Years Old | GCs Administered (%) | Prevalent OF at Baseline (%) | Incident OF During Follow-Up (%) | Follow-Up Length (Months) |
|---|---|---|---|---|---|---|
| RA (N=749) | 76.2 | 80.3 (11.4) | 11.9 | 36.7 | 13.4 | 85.3 (73.8) |
| PsA (N = 179) | 62.6 | 62.6 (12.7) | 8.9 | 33.7 | 15.1 | 97.2 (80.5) |
| AS (N = 60) | 46.7 | 69.9 (15.7) | 6.7 | 25.4 | 11.7 | 95.5 (74.6) |
| SJS (N = 60) | 91.7 | 69.9 (13.9) | 18.3 | 35.7 | 11.7 | 126.0 (80.0) |
| PAO (N = 58) | 56.9 | 75.4 (14.4) | 6.9 | 46.4 | 29.3 | 66.9 (67.9) |
| SLE (N = 28) | 85.7 | 64.3 (12.4) | 89.2 | 32.1 | 17.9 | 149.0 (75.1) |
| GCA (N = 26) | 69.2 | 77.5 (13.0) | 23.1 | 46.2 | 19.2 | 82.5 (74.1) |
| PMR (N = 26) | 73.1 | 81.2 (10.7) | 74.6 | 42.3 | 19.2 | 98.9 (80.7) |
| SSc (N = 15) | 80.0 | 73.9 (8.8) | 33.3 | 26.7 | 20.0 | 140.3 (82.5) |
| Behçet (N = 12) | 16.7 | 72.8 (14.8) | 16.7 | 25.0 | 0.0 | 74.3 (79.6) |
| PM/DM (N = 8) | 25.0 | 76.4 (8.6) | 37.5 | 50.0 | 12.5 | 14.0 (94.2) |
| ASD (N = 5) | 80.0 | 71.6 (8.5) | 20.0 | 40.0 | 20.0 | 64.2 (36.0) |
| FMF (N = 1) | 100.0 | 77.0 (0) | 100.0 | 0.0 | 0.0 | 12.0 (0) |
| PN (N = 1) | 100.0 | 91.0 (0) | 100.0 | 100.0 | 100.0 | 23.0 (0) |
| Total (N = 1228) | 71.9 | 77.7 (12.3) | 16.4 | 36.1 | 14.6 | 90.7 (76.9) |
| Factor | G-OF (n = 179) | G-nonOF (N = 1049) | p-Value |
|---|---|---|---|
| female gender (%) | 83.2 | 69.9 | <0.001 |
| age, years old | 78.5 (10.5) | 73.8 (14.0) | <0.001 |
| pr-VF at baseline (%) | 20.7 | 9.1 | <0.001 |
| pr-nonVF at baseline (%) | 26.8 | 9.9 | <0.001 |
| number of comorbidities | 12.2 (7.7) | 9.5 (6.1) | <0.001 |
| eGFR_CysC (mL/min/1.73 m2) | 56.7 (20.3) | 65.6 (25.6) | <0.001 |
| T-score in the LS | −2.3 (1.5) | −2.1 (1.8) | 0.35 |
| T-score in the FN | −2.2 (1.1) | −2.1 (1.2) | 0.23 |
| LSD (%) | 80.4 | 69.7 | <0.01 |
| DM (%) | 38.5 | 28.1 | <0.01 |
| HT (%) | 54.7 | 43.6 | <0.01 |
| HL (%) | 40.2 | 30.0 | <0.01 |
| CHF (%) | 40.2 | 24.4 | <0.001 |
| COPD (%) | 11.1 | 9.3 | 0.44 |
| insomnia (%) | 28.5 | 17.5 | <0.001 |
| Fallibility (%) | 78.2 | 54.8 | <0.001 |
| OA (%) | 62.0 | 43.6 | <0.001 |
| MADS (%) | 34.1 | 13.3 | <0.001 |
| Contracture (%) | 9.5 | 3.9 | <0.01 |
| Disuse (%) | 19.0 | 6.4 | <0.001 |
| NMD (%) | 6.7 | 2.7 | <0.01 |
| Cognitive impairment (%) | 22.3 | 11.1 | <0.001 |
| OPD administered (%) | 69.3 | 36.3 | <0.001 |
| GCs administered (%) | 15.4 | 15.3 | 0.93 |
| Rehabilitation (%) | 43.0 | 41.1 | <0.001 |
| follow-up length (months) | 52.8 (58.9) | 97.2 (77.8) | <0.001 |
| polypharmacy ratio (%) | 24.9 | 16.1 | <0.001 |
| Univariate Model | Multivariate Model | ROC | |||||||
|---|---|---|---|---|---|---|---|---|---|
| Variables | β-Value | 95%CI | p-Value | Risk Ratio | p-Value | Logarithm of p-Value (logP) | β-Value × logP | COI | AUC (LCL–UCL) |
| female gender (%) | 0.75 | 0.36–1.14 | <0.001 | 2.11 | 0.78 | 0.08 | 0.21 | female | 0.566 (0.536–0.597) |
| age, years old | 0.03 | 0.02–0.05 | <0.001 | 1.03 | 0.22 | 0.50 | 0.00 | >74 | 0.594 (0.553–634) |
| pr-VF at baseline (%) | 0.94 | 0.57–1.30 | <0.001 | 2.55 | 8.40 × 10⁻³ | 1.60 | 5.63 | positive | 0.558 (0.527–0.589) |
| pr-nonVF at baseline (%) | 0.87 | 0.64–1.31 | <0.001 | 2.65 | 3.00 × 10⁻⁵ | 3.50 | 11.02 | positive | 0.585 (0.551–0.618) |
| number of comorbidities | 0.03 | 0.02–0.05 | <0.001 | 1.04 | 0.46 | 0.26 | 0.00 | >11 | 0.603 (0.555–0.651) |
| eGFR_CysC (mL/min/1.73 m2) | −0.02 | −0.02–−0.01 | <0.001 | 0.98 | 0.40 | 0.31 | 0.00 | >48.0 | 0.605 (0.564–0.646) |
| T-score in the LS | −0.12 | −0.22–−0.02 | <0.05 | 0.89 | 0.33 | 0.37 | −0.09 | <−2.6 | 0.525 (0.473–0.578) |
| T-score in the FN | −0.14 | −0.29–0.01 | 0.07 | 0.87 | |||||
| LSD (%) | 0.30 | −0.07–0.67 | 0.11 | 1.35 | |||||
| DM (%) | 0.29 | −0.01–0.59 | 0.06 | 1.33 | |||||
| HT (%) | 0.27 | −0.03–0.56 | 0.07 | 1.31 | |||||
| HL (%) | 0.13 | −0.17–0.43 | 0.391 | 1.14 | |||||
| CHF (%) | 0.67 | 0.37–0.97 | <0.001 | 1.96 | 0.08 | 0.84 | 1.06 | present | 0.579 (0.541–0.617) |
| COPD (%) | 0.00 | −0.46–0.47 | 0.99 | 1.00 | |||||
| insomnia (%) | 0.36 | 0.04–0.69 | <0.05 | 1.43 | 0.28 | 0.43 | 0.03 | present | 0.555 (0.520–0.590) |
| Fallibility (%) | 0.78 | 0.42–1.13 | <0.001 | 2.17 | |||||
| OA (%) | 0.44 | 0.14–0.74 | <0.01 | 1.55 | 0.77 | 0.09 | 0.08 | present | 0.592 (0.554–0.631) |
| MADS (%) | 0.91 | 0.60–1.22 | <0.001 | 2.47 | 0.50 | 0.23 | 0.20 | present | 0.604 (0.568–0.640) |
| Contracture (%) | 0.45 | −0.05–0.96 | 0.08 | 1.57 | |||||
| Disuse (%) | 0.84 | 0.47–1.21 | <0.001 | 2.32 | 0.80 | 0.08 | 0.55 | present | 0.563 (0.533–0.593) |
| NMD (%) | 0.82 | 0.24–0.30 | <0.01 | 2.27 | 0.40 | 0.30 | 0.28 | present | 0.520 (0.501–0.539) |
| Cognitive impairment (%) | 0.97 | 0.61–1.32 | <0.001 | 2.63 | 9.03 × 10⁻³ | 1.57 | 3.97 | present | 0.561 (0.529–0.593) |
| OPD administered (%) | 1.13 | 0.82–1.45 | <0.001 | 3.11 | 0.05 | 1.03 | 5.08 | positive | 0.665 (0.628–0.702) |
| GCs administered (%) | −0.08 | −0.51–0.35 | 0.71 | 0.92 | |||||
| total dose of GCs (mg) † | −0.00 | −0.00–0.00 | 0.50 | 1.00 | |||||
| Rehabilitation (%) | 0.77 | 0.47–1.06 | <0.001 | 2.15 | 0.02 | 1.27 | 1.93 | never | 0.607 (0.569–0.646) |
| polypharmacy ratio (%) | 0.49 | 0.07–0.91 | <0.05 | 1.63 | 0.36 | 0.34 | 0.29 | >19.4% | 0.576 (0.535–0.616) |
| Approaches | Cox Regression of TRW | ROC | Kaplan–Meier Survival Analysis | ||||||
|---|---|---|---|---|---|---|---|---|---|
| TRW | Risk Ratio | 95%CI | COI | p-Value | AUC | Hazard Ratio | Sensitivity | Specificity | |
| Control | 1.00 ± 1.05 | 1.94 | 1.72–2.18 | >1 | <0.001 | 0.723 | 3.89 | 29.4% | 91.6% |
| Standard | 1.77 ± 1.90 | 1.43 | 1.34–1.52 | >1.92 | <0.001 | 0.727 | 3.90 | 27.4% | 92.4% |
| Summed | 3.77 ± 11.32 | 1.31 | 1.25–1.38 | >6.78 | <0.001 | 0.761 | 5.16 | 30.0% | 93.8% |
| Modified Summed | 7.79 ± 5.97 | 1.17 | 1.14–1.20 | >6.98 | <0.001 | 0.774 | 6.48 | 31.2% | 94.9% |
| Multiplied | 2848.2 ± 27,578.13 | 1.00 | 1.00–1.00 | >1.76 | <0.001 | 0.769 | 4.53 | 33.5% | 92.5% |
| Pair | Difference (LCL–UCL: 95% CI) | p-Value |
|---|---|---|
| Control vs. Standard | −0.00363 (−0.01181–0.00454) | 0.39 |
| Control vs. Summed | −0.03787 (−0.05143–−0.02432) | 4.3 × 10⁻⁸ |
| Control vs. Modified Summed | −0.05033 (−0.06431–−0.03635) | 1.7 × 10⁻¹² |
| Control vs. Multiplied | −0.04572 (−0.05933–−0.03211) | 4.6 × 10⁻¹¹ |
| Standard vs. Summed | −0.03424 (−0.04551–−0.02297) | 2.6 × 10⁻⁹ |
| Standard vs. Modified Summed | −0.04669 (−0.05883–−0.03456) | <1.0 × 10⁻¹² |
| Standard vs. Multiplied | −0.04209 (−0.05352–−0.03066) | <1.0 × 10⁻¹² |
| Summed vs. Modified Summed | −0.01245 (−0.01587–−0.00904) | <1.0 × 10⁻¹² |
| Summed vs. Multiplied | −0.00785 (−0.01120–−0.00449) | 4.6 × 10⁻⁶ |
| Modified Summed vs. Multiplied | 0.00461 (−0.00044–0.00966) | 0.07 |
Disclaimer/Publisher’s Note: The statements, opinions and data contained in all publications are solely those of the individual author(s) and contributor(s) and not of MDPI and/or the editor(s). MDPI and/or the editor(s) disclaim responsibility for any injury to people or property resulting from any ideas, methods, instructions or products referred to in the content. |
© 2025 by the authors. Licensee MDPI, Basel, Switzerland. This article is an open access article distributed under the terms and conditions of the Creative Commons Attribution (CC BY) license (https://creativecommons.org/licenses/by/4.0/).
Share and Cite
Yoshii, I.; Sawada, N.; Chijiwa, T. Risk-Weight Calculation of Candidate Risk Factors for Incidental Osteoporotic Fracture in Patients with Rheumatic Diseases: A Potentially Accurate Approach. Osteology 2025, 5, 5. https://doi.org/10.3390/osteology5010005
Yoshii I, Sawada N, Chijiwa T. Risk-Weight Calculation of Candidate Risk Factors for Incidental Osteoporotic Fracture in Patients with Rheumatic Diseases: A Potentially Accurate Approach. Osteology. 2025; 5(1):5. https://doi.org/10.3390/osteology5010005
Chicago/Turabian StyleYoshii, Ichiro, Naoya Sawada, and Tatsumi Chijiwa. 2025. "Risk-Weight Calculation of Candidate Risk Factors for Incidental Osteoporotic Fracture in Patients with Rheumatic Diseases: A Potentially Accurate Approach" Osteology 5, no. 1: 5. https://doi.org/10.3390/osteology5010005
APA StyleYoshii, I., Sawada, N., & Chijiwa, T. (2025). Risk-Weight Calculation of Candidate Risk Factors for Incidental Osteoporotic Fracture in Patients with Rheumatic Diseases: A Potentially Accurate Approach. Osteology, 5(1), 5. https://doi.org/10.3390/osteology5010005