Article

Workers’ Exposure Due to Private 5G Networks

1
Institute of Non-Ionizing Radiation (INIS), 1000 Ljubljana, Slovenia
2
IMEC-WAVES, 9052 Ghent, Belgium
3
Center for Interdisciplinary Research and Innovation, Aristotle University of Thessaloniki, 57001 Thermi, Greece
*
Author to whom correspondence should be addressed.
Telecom 2026, 7(3), 63; https://doi.org/10.3390/telecom7030063
Submission received: 20 February 2026 / Revised: 13 April 2026 / Accepted: 20 May 2026 / Published: 1 June 2026

Abstract

Private 5G mobile networks are emerging as a platform for wireless connectivity in professional applications across smart industrial sectors such as automated warehousing, logistics, autonomous vehicle deployments in campus environments, mining, and material processing, among others. It is expected that most Machine-to-Machine (M2M) and Industrial Internet of Things (IIoT) communication links will increasingly rely on wireless solutions, as the flexibility they offer provides clear advantages over hard-wired network installations. To gain insight into workers’ exposure to radiofrequency electromagnetic fields (RF EMF) emitted by 5G private mobile networks, an analysis was conducted based on measured and calculated RF EMF levels from various 5G private networks in real-world scenarios across different smart industrial sectors and R&D platforms in three countries. Several exposure scenarios were evaluated, including production facilities, logistics operations, office environments, and research sites. The installations included different configurations: private standalone and non-standalone 5G networks operating at 3.5 GHz and 26 GHz, as well as public networks with private slicing. The results clearly demonstrated that exposure levels in all investigated scenarios were well below existing exposure limits. In a typical indoor industrial environment where pico 5G base stations are deployed, the measured exposure was found to be no greater than 0.006% of the Directive 2013/35/EU action value and 0.03% of the ICNIRP guideline limits for the general public.

1. Introduction

The need to assess radiofrequency electromagnetic field (RF EMF) exposure of workers in Industry 4.0 environments arises from the unprecedented integration of wireless, automated, and interconnected technologies that generate complex, multi-frequency electromagnetic environments. Wireless communication is a cornerstone of Industry 4.0, as it enables seamless, pervasive, and scalable connectivity among machines, sensors, and mobile entities such as robots, automated guided vehicles, drones, and humans [1].
The deployment of private 5G networks in smart industrial environments introduces unique RF EMF exposure scenarios for workers. Two main installation configurations are used to achieve reliable coverage inside smart factories: (i) a limited number of beamforming base stations (BSs), which can cover large areas, and (ii) multiple low-power radio heads, which provide robust coverage even in environments with many obstacles and reflections. Beamforming antennas have high maximum gains (15–23 dBi) and the ability to steer beams dynamically, whereas low-power radio heads employ omnidirectional or partially directive radiation patterns with low gains (0–4 dBi). Due to their similar maximum output power, these differences result in markedly higher exposures close to beamforming antennas. The benefit of high-gain beamforming antennas is limited by the presence of obstacles, whereas multiple low-power radio heads benefit from the ability to cover most of the area due to their spatial distribution.
Research on workers’ RF EMF exposure in fully operational private 5G networks in Industry 4.0 is still scarce. A key reason is the relatively slow adoption of private 5G in smart industries due to high costs, technical challenges, and an uncertain return on investment. Moreover, researchers’ access to industrial sites with private 5G networks is highly restricted. Facility owners rarely grant permission for external measurements or publication of results, and access often requires lengthy negotiations and non-disclosure agreements, which are frequently canceled by company management before completion.
Some published studies report that, while 5G beamforming concentrates energy toward intended receivers, the dynamic nature of beam patterns and time-averaged power allocation reduces overall worker exposure compared to static sector antennas. In controlled scenarios, power density often remained below 1% of the International Commission on Non-Ionizing Radiation Protection (ICNIRP) guideline limits [2].

2. Materials and Methods

To determine workers’ exposure to private 5G networks, a large number of measurements were conducted in combination with numerical calculations to precisely determine the compliance zones. Several exposure scenarios were measured and numerically modeled, including production facilities, logistics, offices and research facilities with different types of installations: private standalone (SA) and non-standalone (NSA) 5G networks at 3.5 GHz and 26 GHz, as well as public 5G networks with private slicing (Table 1).
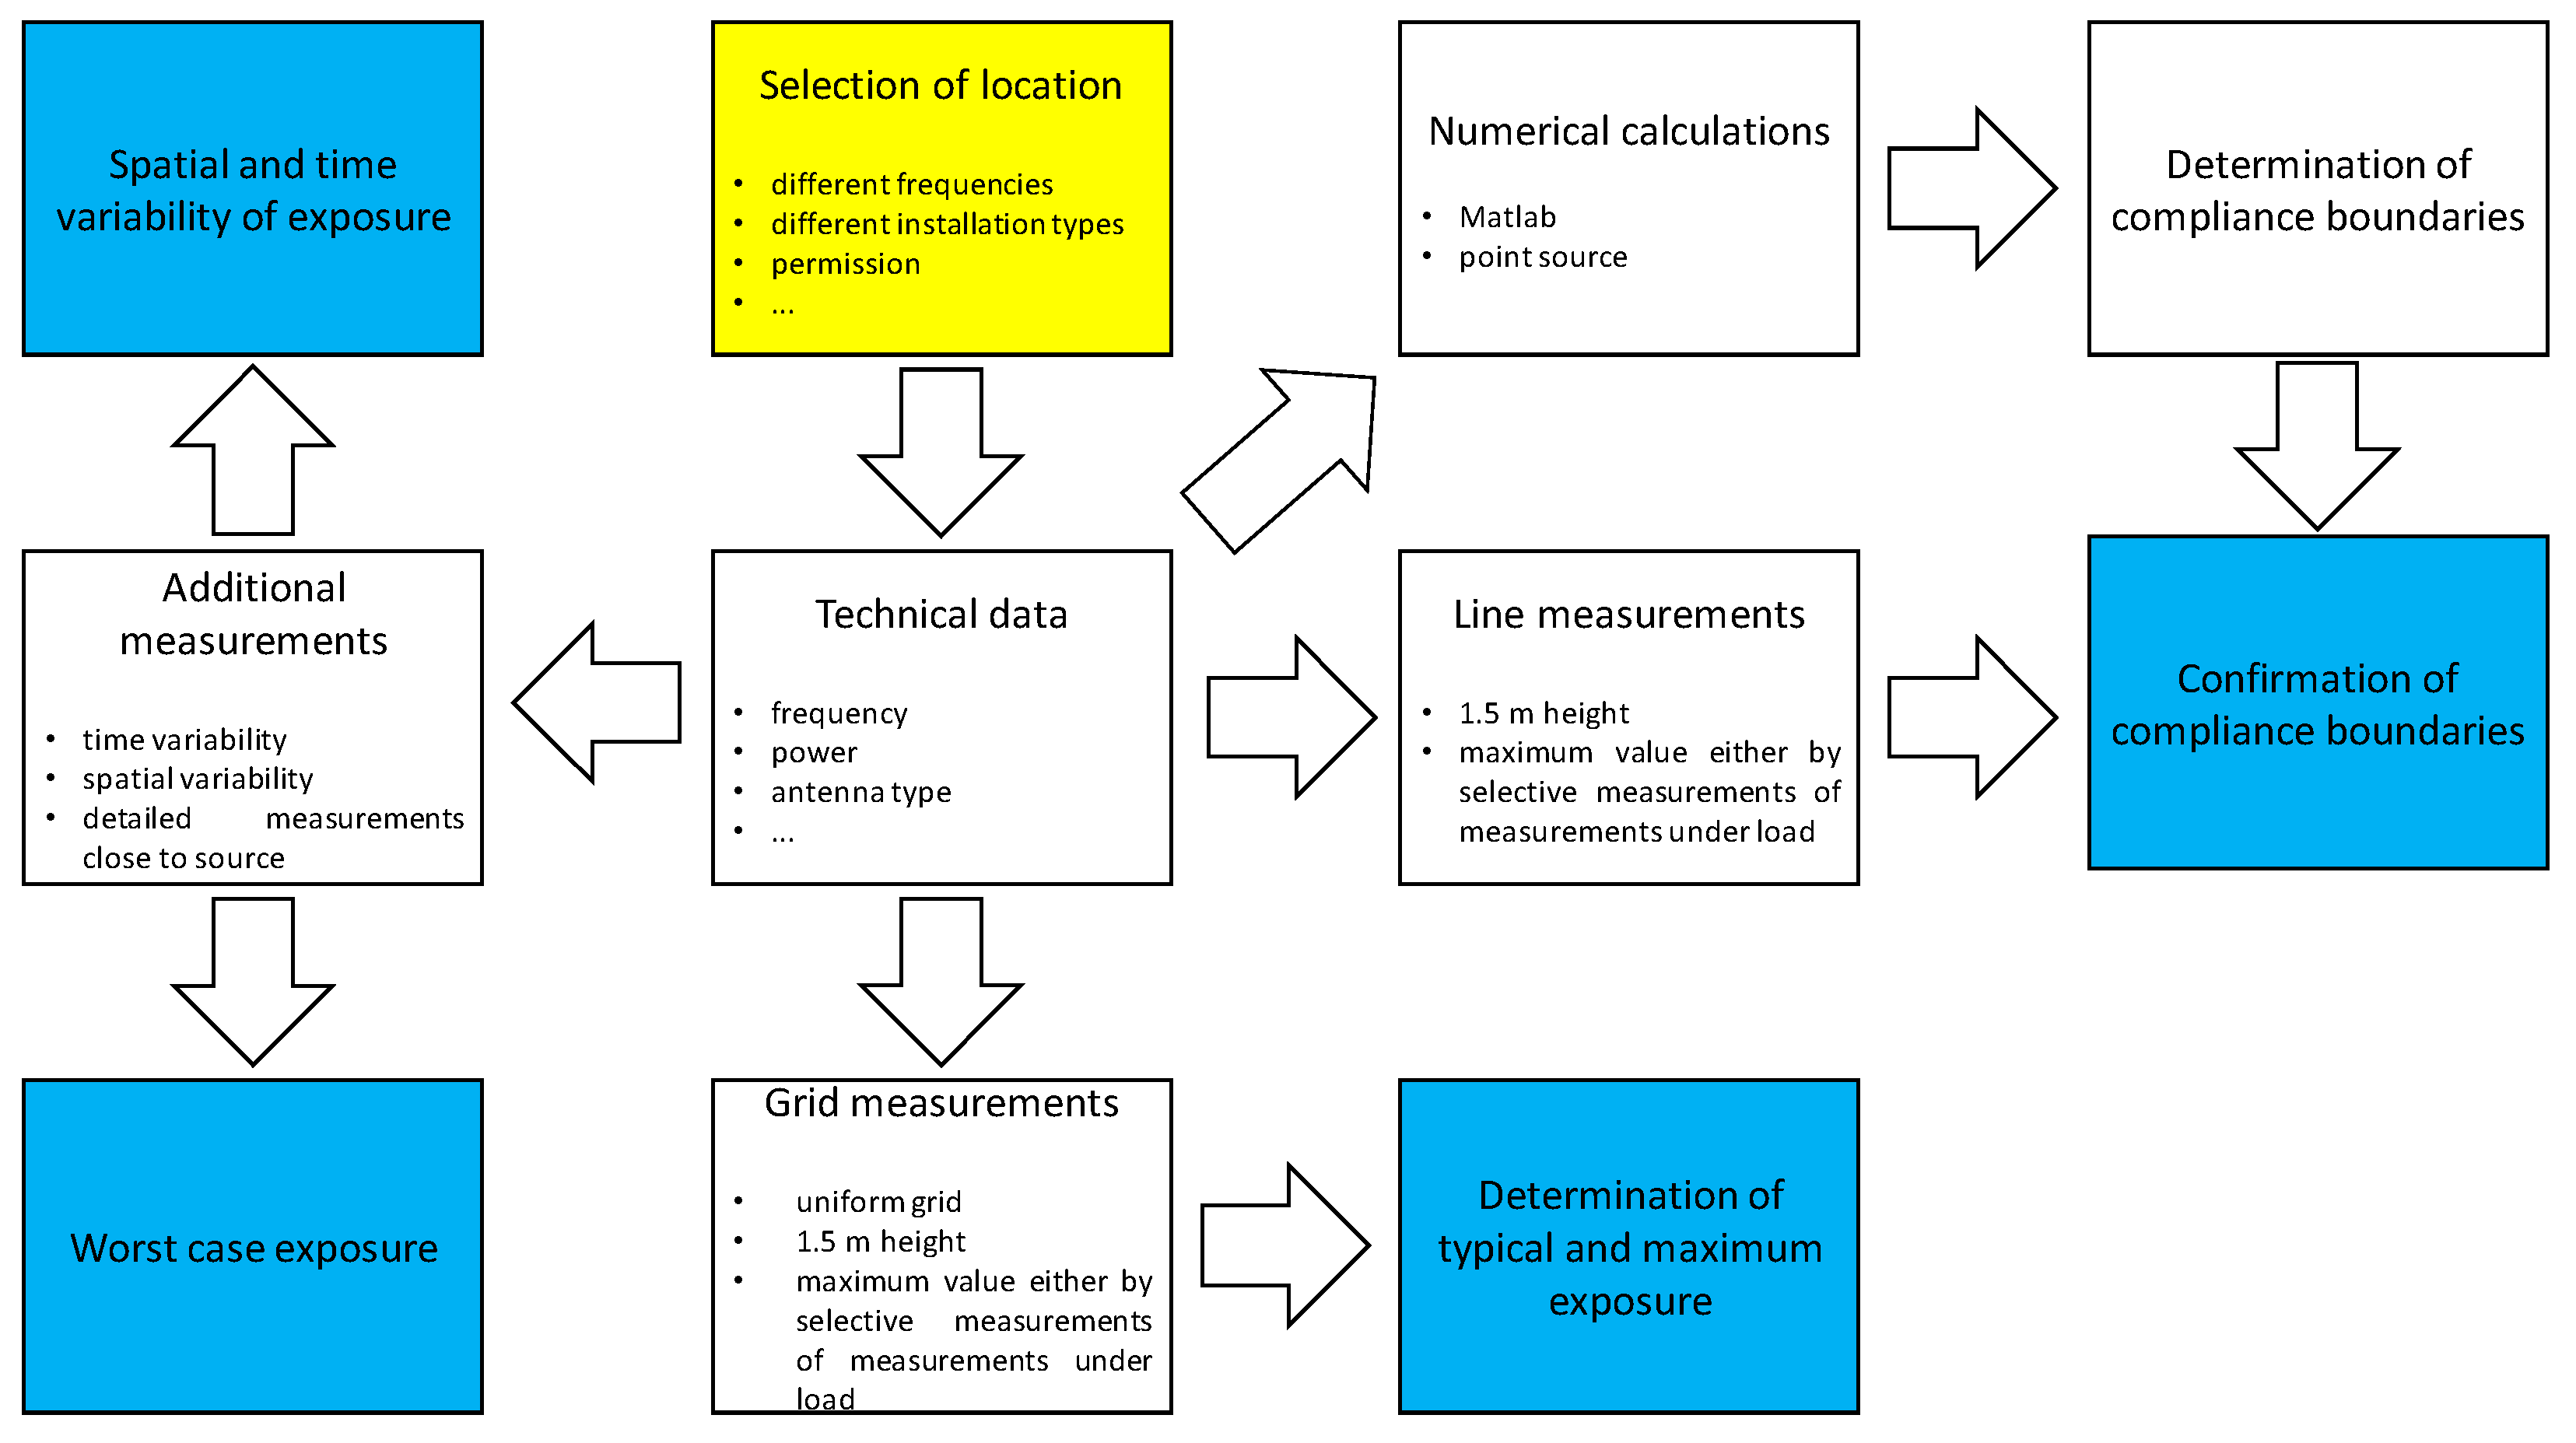
First, all necessary technical data about the RF EMF sources were obtained, such as operating frequency, transmission power, and antenna characteristics. Such information is required for numerical modeling and the proper design of the measurement procedures (Figure 1).
Measurements were performed according to the widely applied IEC 62232:2022 standard [3]. To assess the worst-case exposure, measurements under load and selective measurements were used [3]. Measurements under load are possible when the measured source is predominant, as the traffic is generated mainly by the measured source. For selective measurements, the amplitude of the Secondary Synchronization Signal (SSS) with constant power is measured with a code-selective instrument equipped with a 5G decoder. According to IEC 62232:2022 [3], the extrapolation to the maximum E-field is calculated according to the formula:
E m a x =   n R E , S S S × F T D C × F a n t φ , θ B F   E R E , S S S ,
where Emax is the maximum value of E field for an individual 5G BS cell, nRE,SSS is the ratio between the maximum permitted transmission power and resource element (RE) power, FTDC is the Time Division Duplex (TDD) duty cycle, Fant is the beamforming factor due to different antenna gains of the transmitting SSS and the physical downlink shared channel (PDSCH) (1 if no beamforming), BF is the boosting factor for the reference signal (RS), and ERE,SSS is the measured RE power in SSS. nRE,SSS is determined by the signal bandwidth and subcarrier spacing (SCS) and is given in the standard IEC 62232:2022 [3]. The beamforming factor Fant is calculated from the radiation pattern of the antenna according to the equation:
F a n t = 10 G P D S C H A t P D S C H G S S S A t S S S 10 = 10 G P D S C H G S S S + A t S S S A t P D S C H 10 ,
where GPDSCH (in dBi) is the antenna gain when transmitting the PDSCH signal, AtPDSCH (in dB) is the envelope of relative attenuation of the antenna when transmitting the PDSCH signal in the direction of evaluation in dBi, and GSSS (in dBi) is the antenna gain when transmitting the SSS and AtSSS (in dB) is the envelope of relative attenuation of the antenna when transmitting the SSS in the direction of evaluation. For selective measurements of 5G, several technical parameters are required, compared to only minimal technical data necessary for measurements under load.
All measurements were performed with a spectrum analyzer (Narda SRM-3006) combined with a Narda 3502 three-axis antenna for FR1 and a Narda LNB 1 horn antenna for FR2 (all three Narda STS, Pfullingen, Germany). The expanded measurement uncertainty of the equipment was ±3.5 dB for the FR1 frequency band and ±3.1 dB for the FR2 frequency band.
Part of the measurements were carried out at different distances from the antenna in the direction of the main beam, 45° to the left or right of the main beam, 90° to the left or right of the main beam, and below the antenna, depending on the antenna installation. The results of these measurements were used to confirm the numerically calculated compliance distances. Part of the measurements were conducted on a uniform grid across the entire targeted area to capture the distribution of the exposure. The measurement height was 1.5 m above the ground, serving to estimate typical exposures. For all measurement locations, the vertical and horizontal distances from the antenna were determined.
To assess time variability, time-controlled measurements were performed at one representative location for most scenarios, spanning from a few minutes to more than 1 h. This enabled the calculation of various averaging periods and the estimation of ratios between typical and maximum exposures.
For each antenna considered in the simulations, the compliance boundaries (CD) were determined by evaluating the compliance distance in all directions around the antenna. CD is the minimum distance from the antenna at which the power density no longer exceeds the reference level limit Slim. CD was derived using the spherical far-field formula for power density [3]:
S r , θ , φ = P · G θ , φ 4 π r 2 ,
where S is the radiated power density (W/m2), P is the input power to the antenna (W), G(θ, φ) is the linear gain of the antenna, r is the radial distance from the antenna (m), θ is the polar (elevation) angle, and φ is the azimuthal angle.
Setting S = Slim and solving the above equation for r, we can determine the CD:
C D θ , φ = P · G θ , φ 4 π S l i m .
This equation provides the direction-dependent compliance distance CD(θ, φ), which varies according to the antenna’s radiation pattern, and is applied under the assumption of free-space propagation, i.e., that no significant reflecting surfaces or objects are present in the direction of evaluation. Using this formulation, we computed the 3D iso-surface compliance boundary, which defines the smallest closed surface surrounding the antenna where the power density equals Slim in all directions. Additionally, we derived the box-shaped compliance boundary, defined as the smallest axis-aligned bounding box that entirely encloses the 3D iso-surface. This box provides a simplified geometric representation useful for compliance zoning. CDs were determined for the worst-case exposure situation when the antenna operated at maximum power.
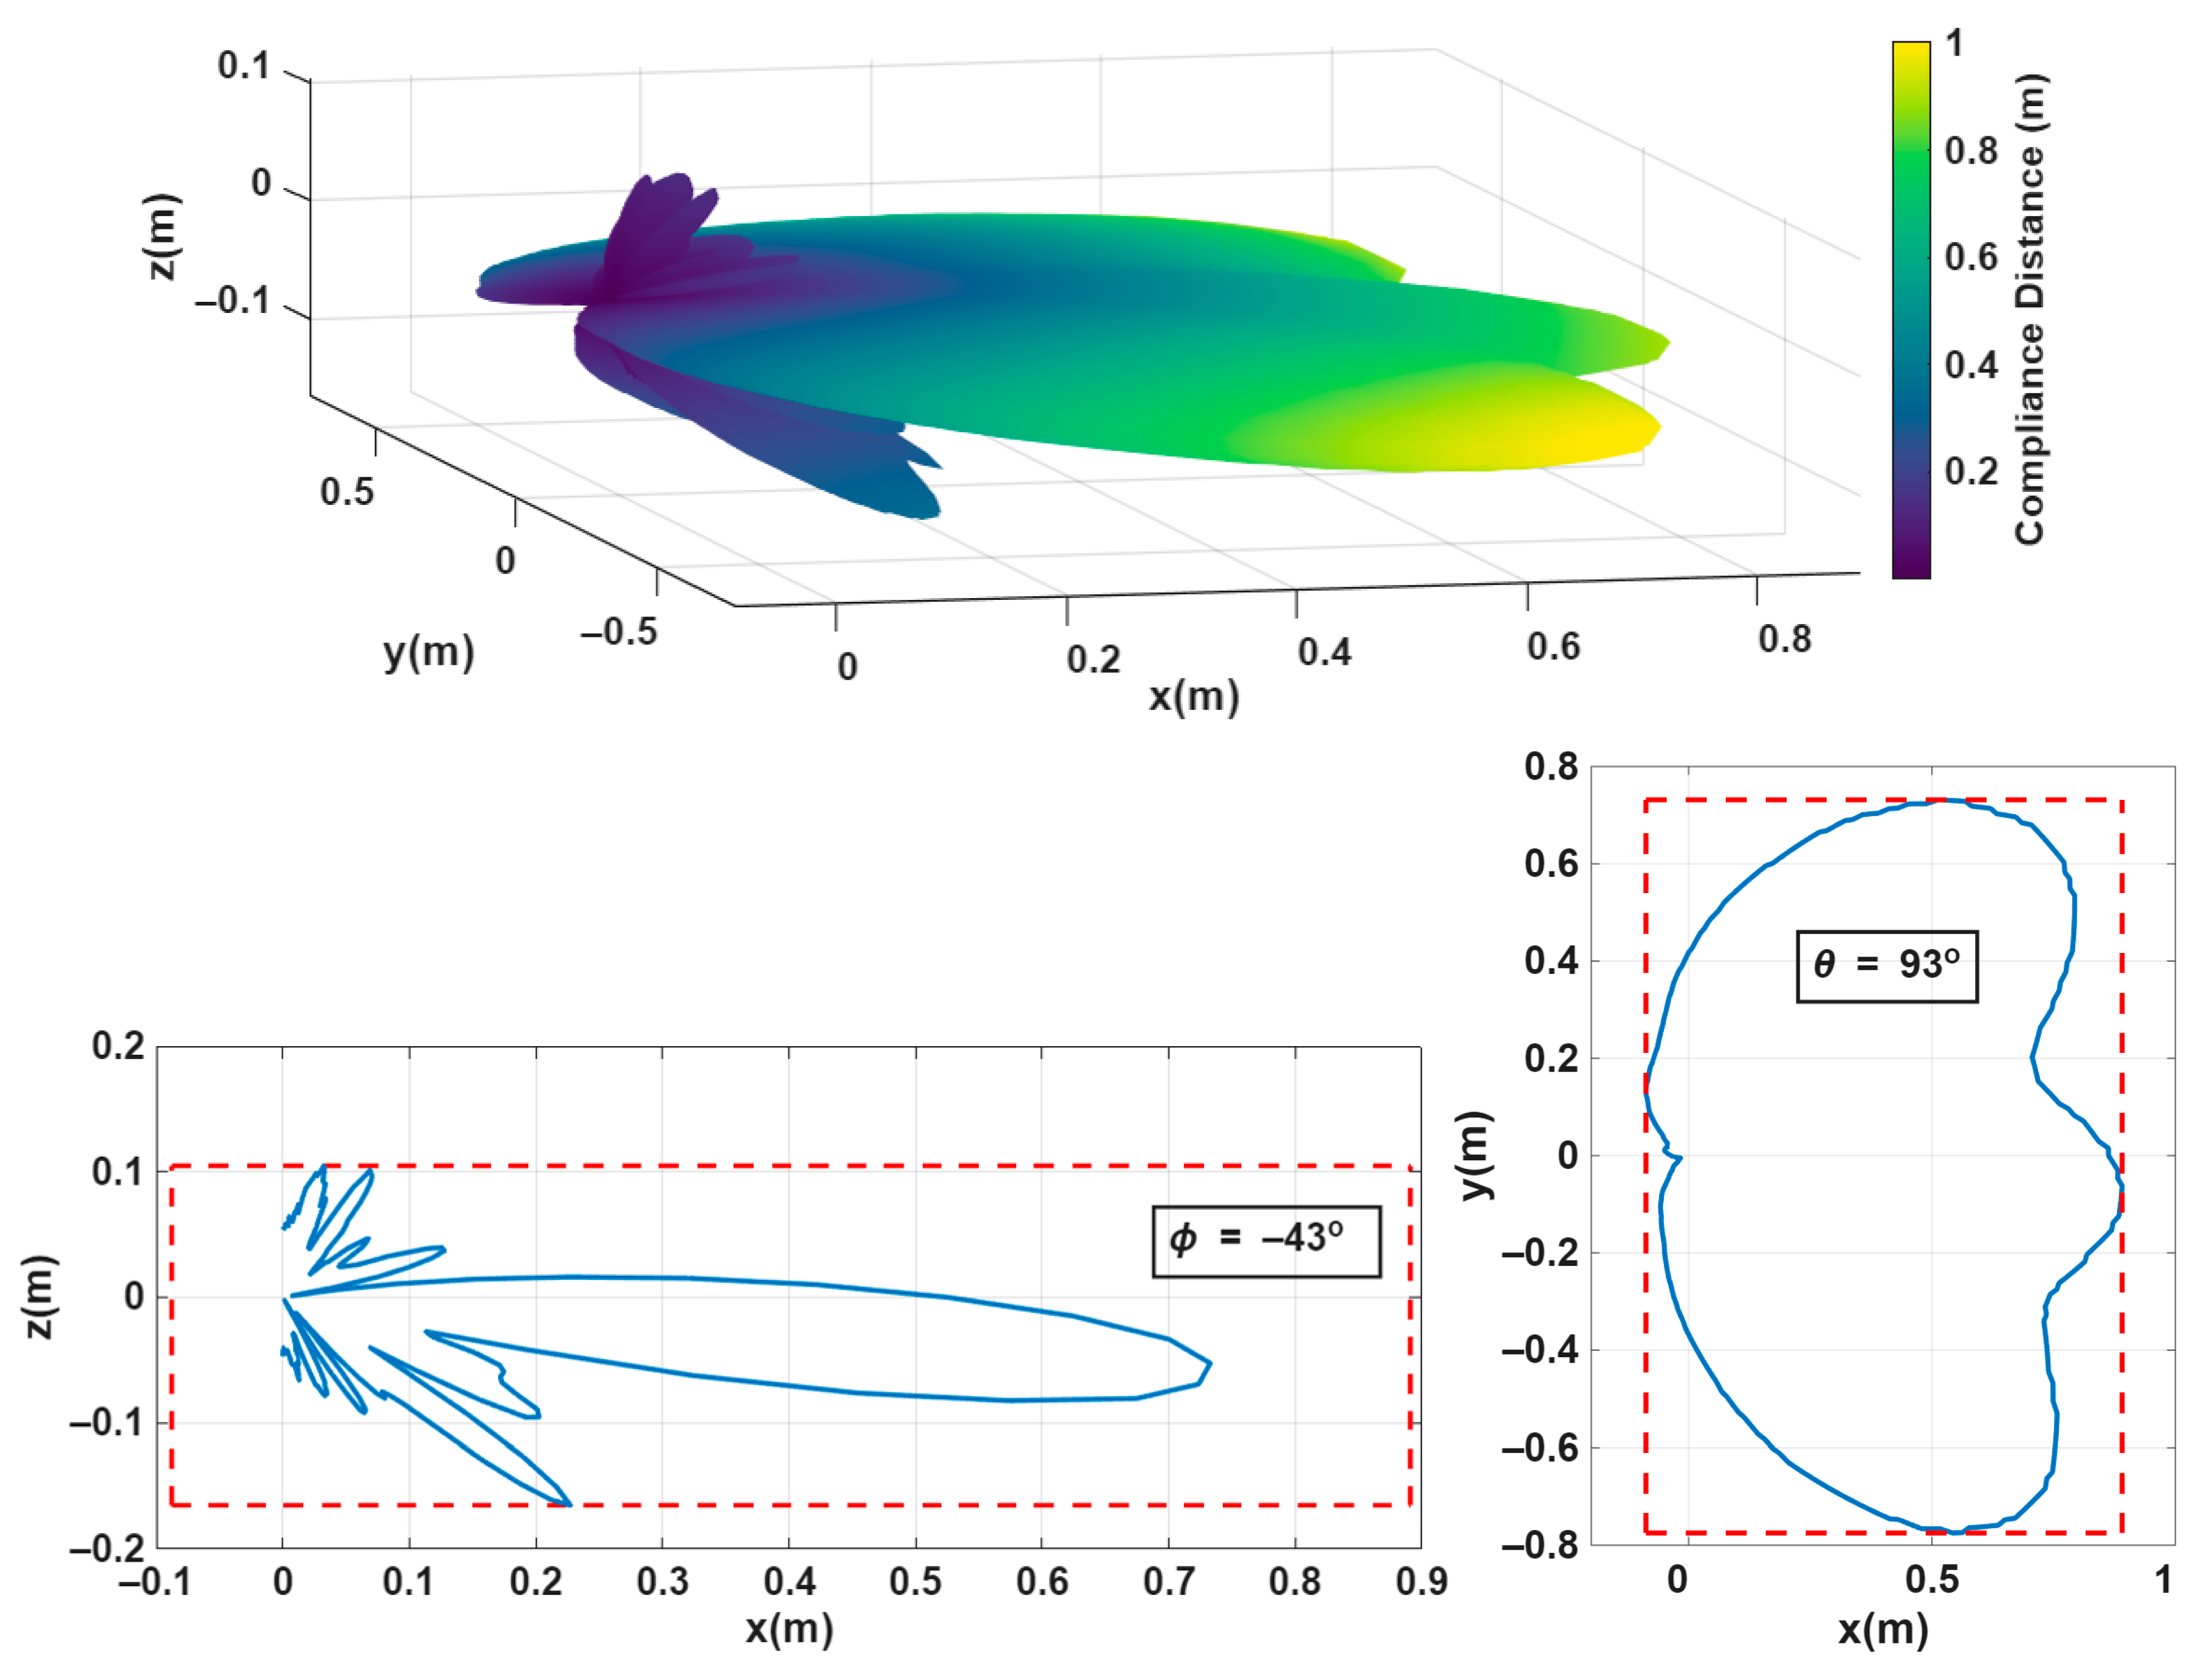
In Figure 2, an example of compliance boundaries for the Alpha Wireless AW3232 Base Station sector antenna is given. It assumes a transmitted power of 4 W. At the top, a 3D iso-surface is given representing the CD. At the bottom, vertical plane (left) and horizontal plane (right) cross-sections are shown. For the vertical plane, the maximum CD was obtained at a polar angle φ of −43° and for the horizontal plane at an elevation angle θ of 93°. The blue line shows the CD, whereas the red line represents the box-shaped CD.
A MATLAB (version R2025a) program package (MathWorks, Natick, MA, USA) was used for the numerical determination of the CD.

3. Results

3.1. Determination of Compliance Distance

Compliance distance was determined for both general public exposure and occupational exposure. For general public and occupational exposure, the applied power density limits Slim are 10 W/m2 and 50 W/m2, respectively, as established by ICNIRP [2] and in accordance with the EU directive 2013/35/EU [4]. Expressed in an electric field, those limits are 61 and 140 V/m.
From the results of the compliance distance calculations in Table 2, it is evident that there is a substantial difference between the indoor antennas used in the various scenarios and the outdoor macro cell antenna deployed at the port.
For indoor antennas, the vertical compliance distances range from 9 to 39 cm for general public exposure and from 4 to 17 cm for occupational exposure. The horizontal compliance distances range from 9 cm to 1.54 m for general public exposure and from 4 to 69 cm for occupational exposure.
For the outdoor antenna, the vertical compliance distances are at least six times higher, reaching 2.43 m and 1.09 m for general public and occupational exposure, respectively. Similarly, the horizontal compliance distances are at least nine times higher, reaching 13.27 m and 5.94 m for general public and occupational exposure, respectively.
For several scenarios, linear measurements were conducted at different distances from the antenna. For scenario 1: Logistic sector: port, private 5G FR1 micro cell, the results of line measurements in Table 3 exceeded the exposure limits for the general public at a distance of 0.2 m from the antenna, whereas at 0.5 m, they were just below the limits. This agrees well with the numerically determined CD of 0.89 m, which is slightly higher than the measured value due to the simplification of the numerical model representing the antenna as a point source.
For scenario 3: Smart IOT solutions: warehouse, private 5G FR1 pico cell and scenario 4: Smart IOT solutions: production site, private 5G FR1 pico cell, the closest distance, at which the measurements were conducted, was 0.3 m. There, the measured value was 8.9 V/m, well below the exposure limits. Numerically determined CD was only 0.09 m.
For scenario 5: Office, test facility of wireless networks, private 5G FR1 micro cell, the measured values at the height of the antenna (3 m) in Table 4 exceeded the exposure limits for the general public at a distance of 0.5 m from the antenna, whereas at 1 m, they were just below the limit values. This agrees well with the numerically determined CD of 1.27 m, which is slightly higher than the measured value due to simplification of the numerical model representing the antenna as a point source. For occupational exposure, limit values are exceeded at a distance of 0.2 m from the antenna, whereas at 0.5 m, they are below the limits, agreeing well with the numerically determined CD of 0.57 m.
For scenario 6: Office, production site, private 5G FR1 pico cell, CD was not determined numerically, as the radiation pattern of the source was not available. Results of line measurements are given in Table 5. Measured values at a distance of 0.2 m, which is the closest distance at which the measurements were carried out, are well below the limit values for the general public, meaning CD is significantly smaller than 0.2 m.
For scenario 7: Research facility, private 5G FR2 micro cell, line measurements were carried out in the direction of the main beam, 45° to the main beam, and 90° to the main beam. Those three lines were all inclined by −10°, as this was the value of the antenna downtilt. Line measurements were conducted under speed test conditions to capture maximum values. Results of line measurements are given in Table 6. As the closest distance at which the measurements were conducted was 1 m, the exposure limits for the general public were not exceeded. The numerically determined CD was 1.4 m. The reason for the difference is the simplification of the numerical model, which represents the antenna as a point source. As this FR2 antenna has very high directivity, this simplification is more pronounced even at slightly larger distances, and consequently, the numerically determined CD is larger than the measured one.

3.2. Typical Exposure Due to Private Networks

3.2.1. Scenario 1: Logistic Sector: Port, Private 5G FR1 Micro Cell

At the port, two 5G deployment scenarios were assessed. For the first scenario, a private standalone (SA) 5G network operating at 3.5 GHz was installed. Measurements were carried out primarily at a test site outside the port, where accessibility and control were easier to ensure with additional measurements performed within the port itself. The setup consisted of a 4 W base station operating at the frequency of 3.41 GHz. The bandwidth was 20 MHz, with a duty cycle of 0.6. A directional antenna, the Alpha Wireless AW3232, was mounted on a pole at a height of 1.9 m (center of antenna); therefore, there was direct access to the antenna, which is very unlikely for real private 5G installations.
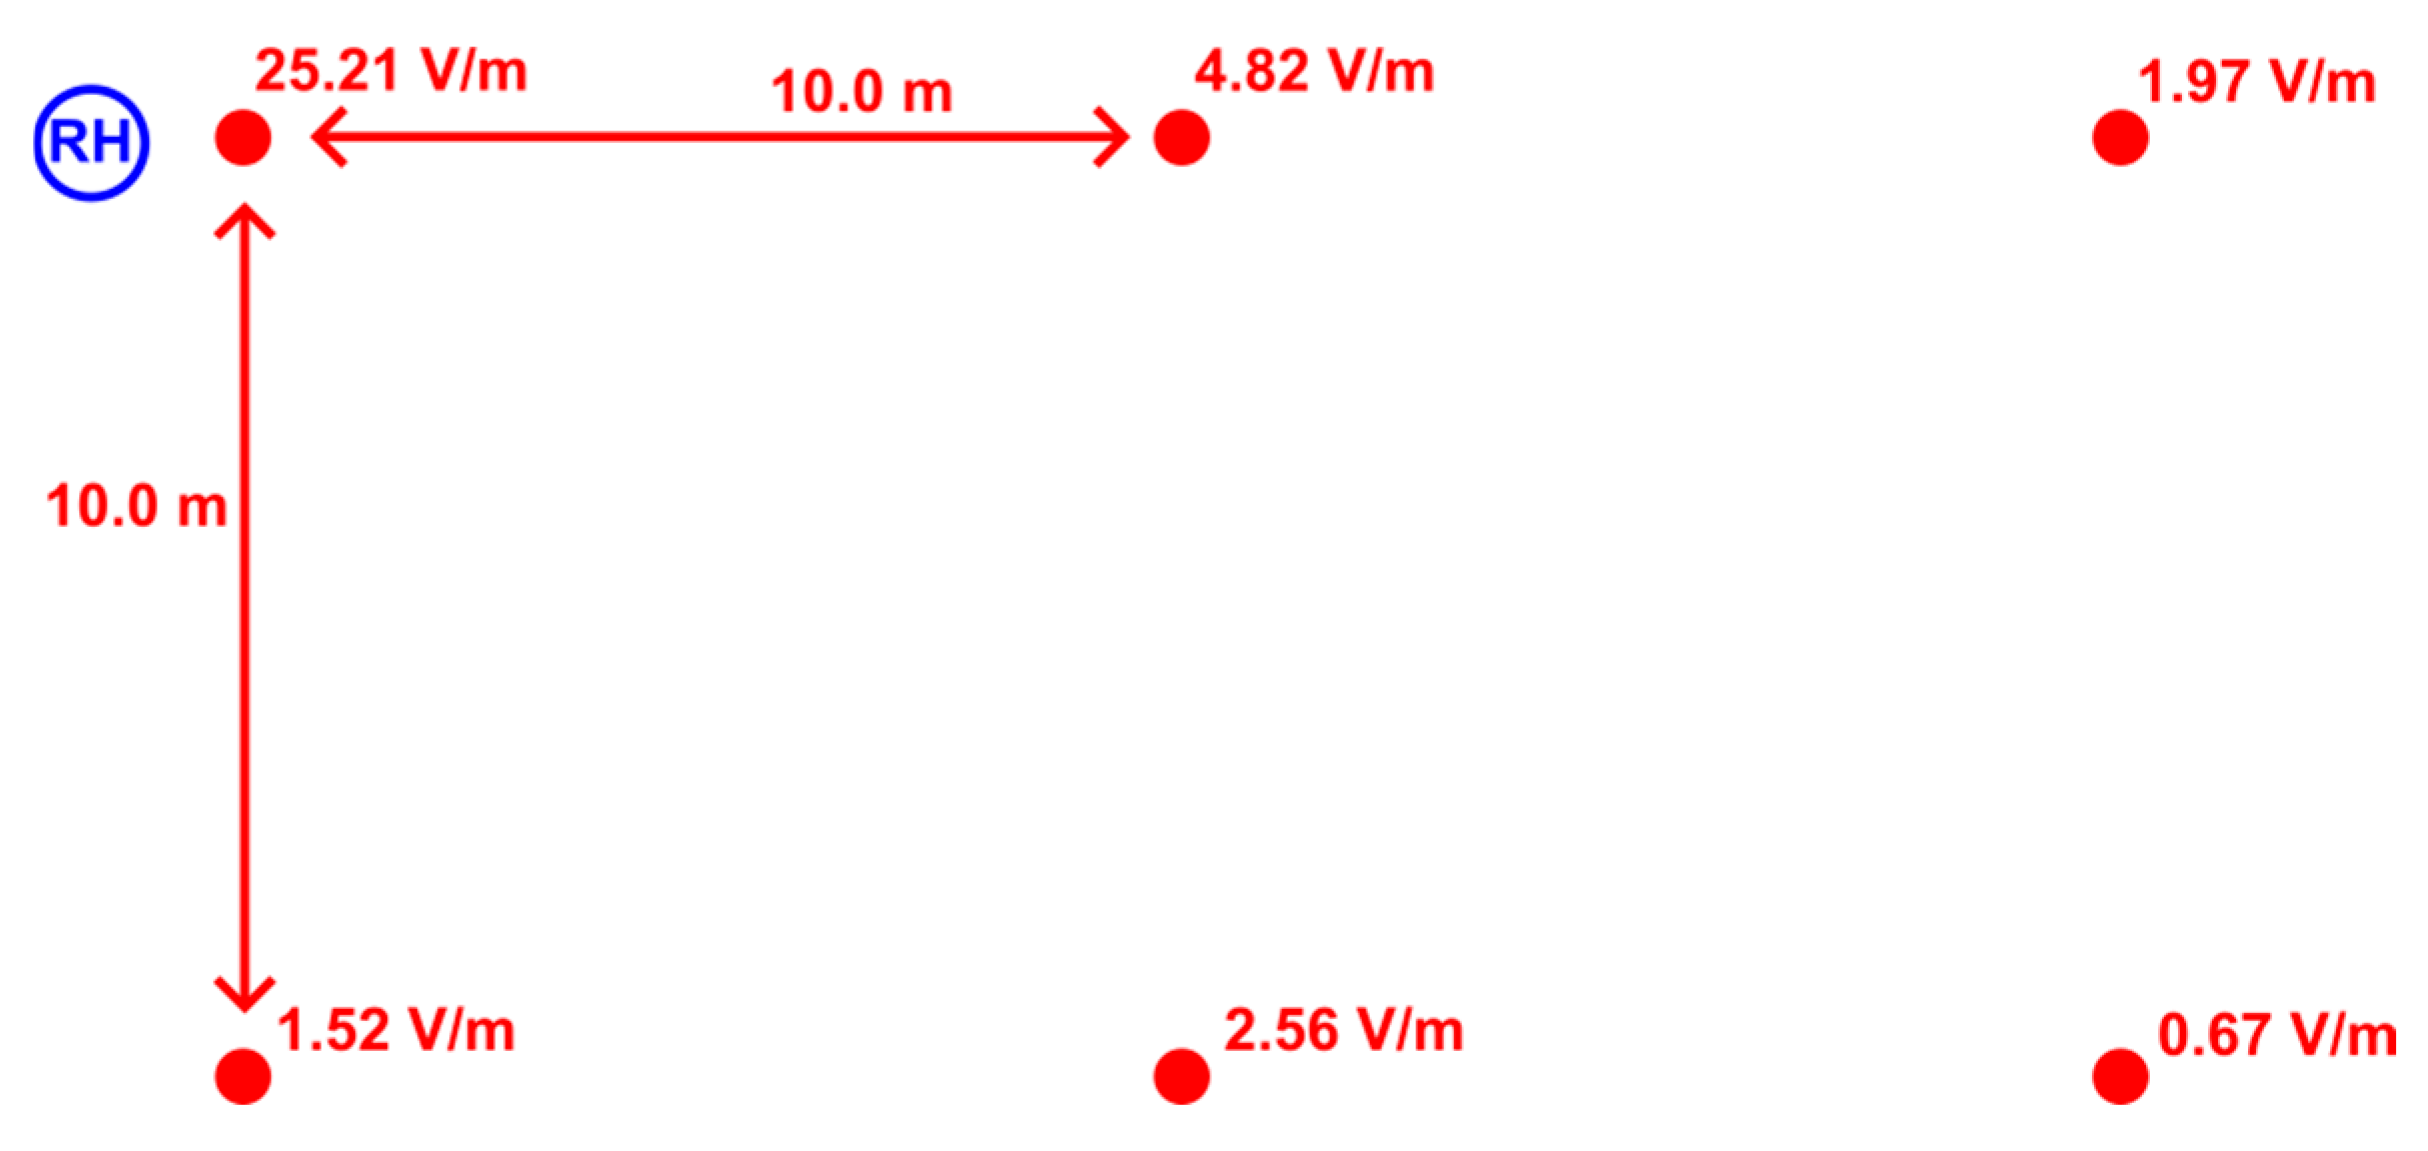
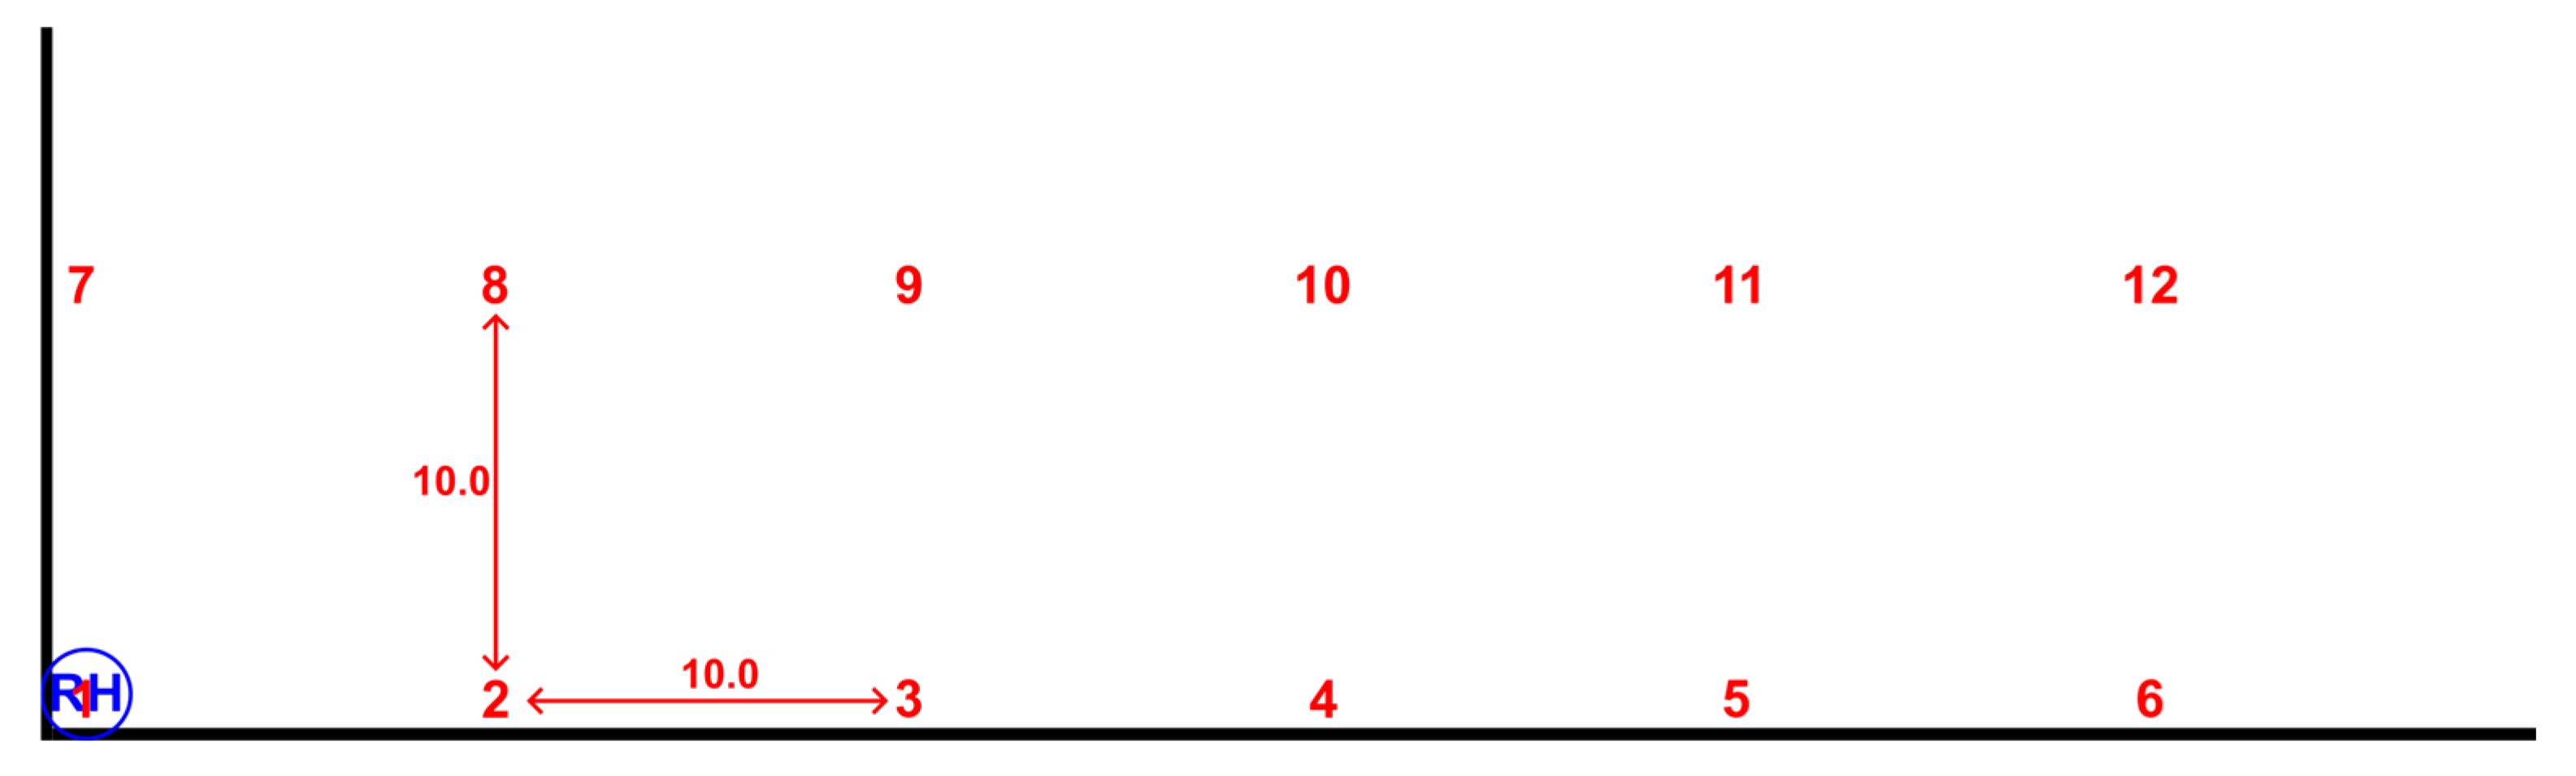
Measurements were carried out under load conditions, the speed test was running during measurements, and the actual power of the base station was monitored by the network provider. The measurement height was 1.5 m. Due to space constrains, measurements were done up to a distance of 20 m and 10 m to the right of the antenna (Figure 3). Table 7 shows different statistical values of measurement results.

3.2.2. Scenario 2: Logistic Sector: Port, Public Slice 5G FR1 Macro Cell

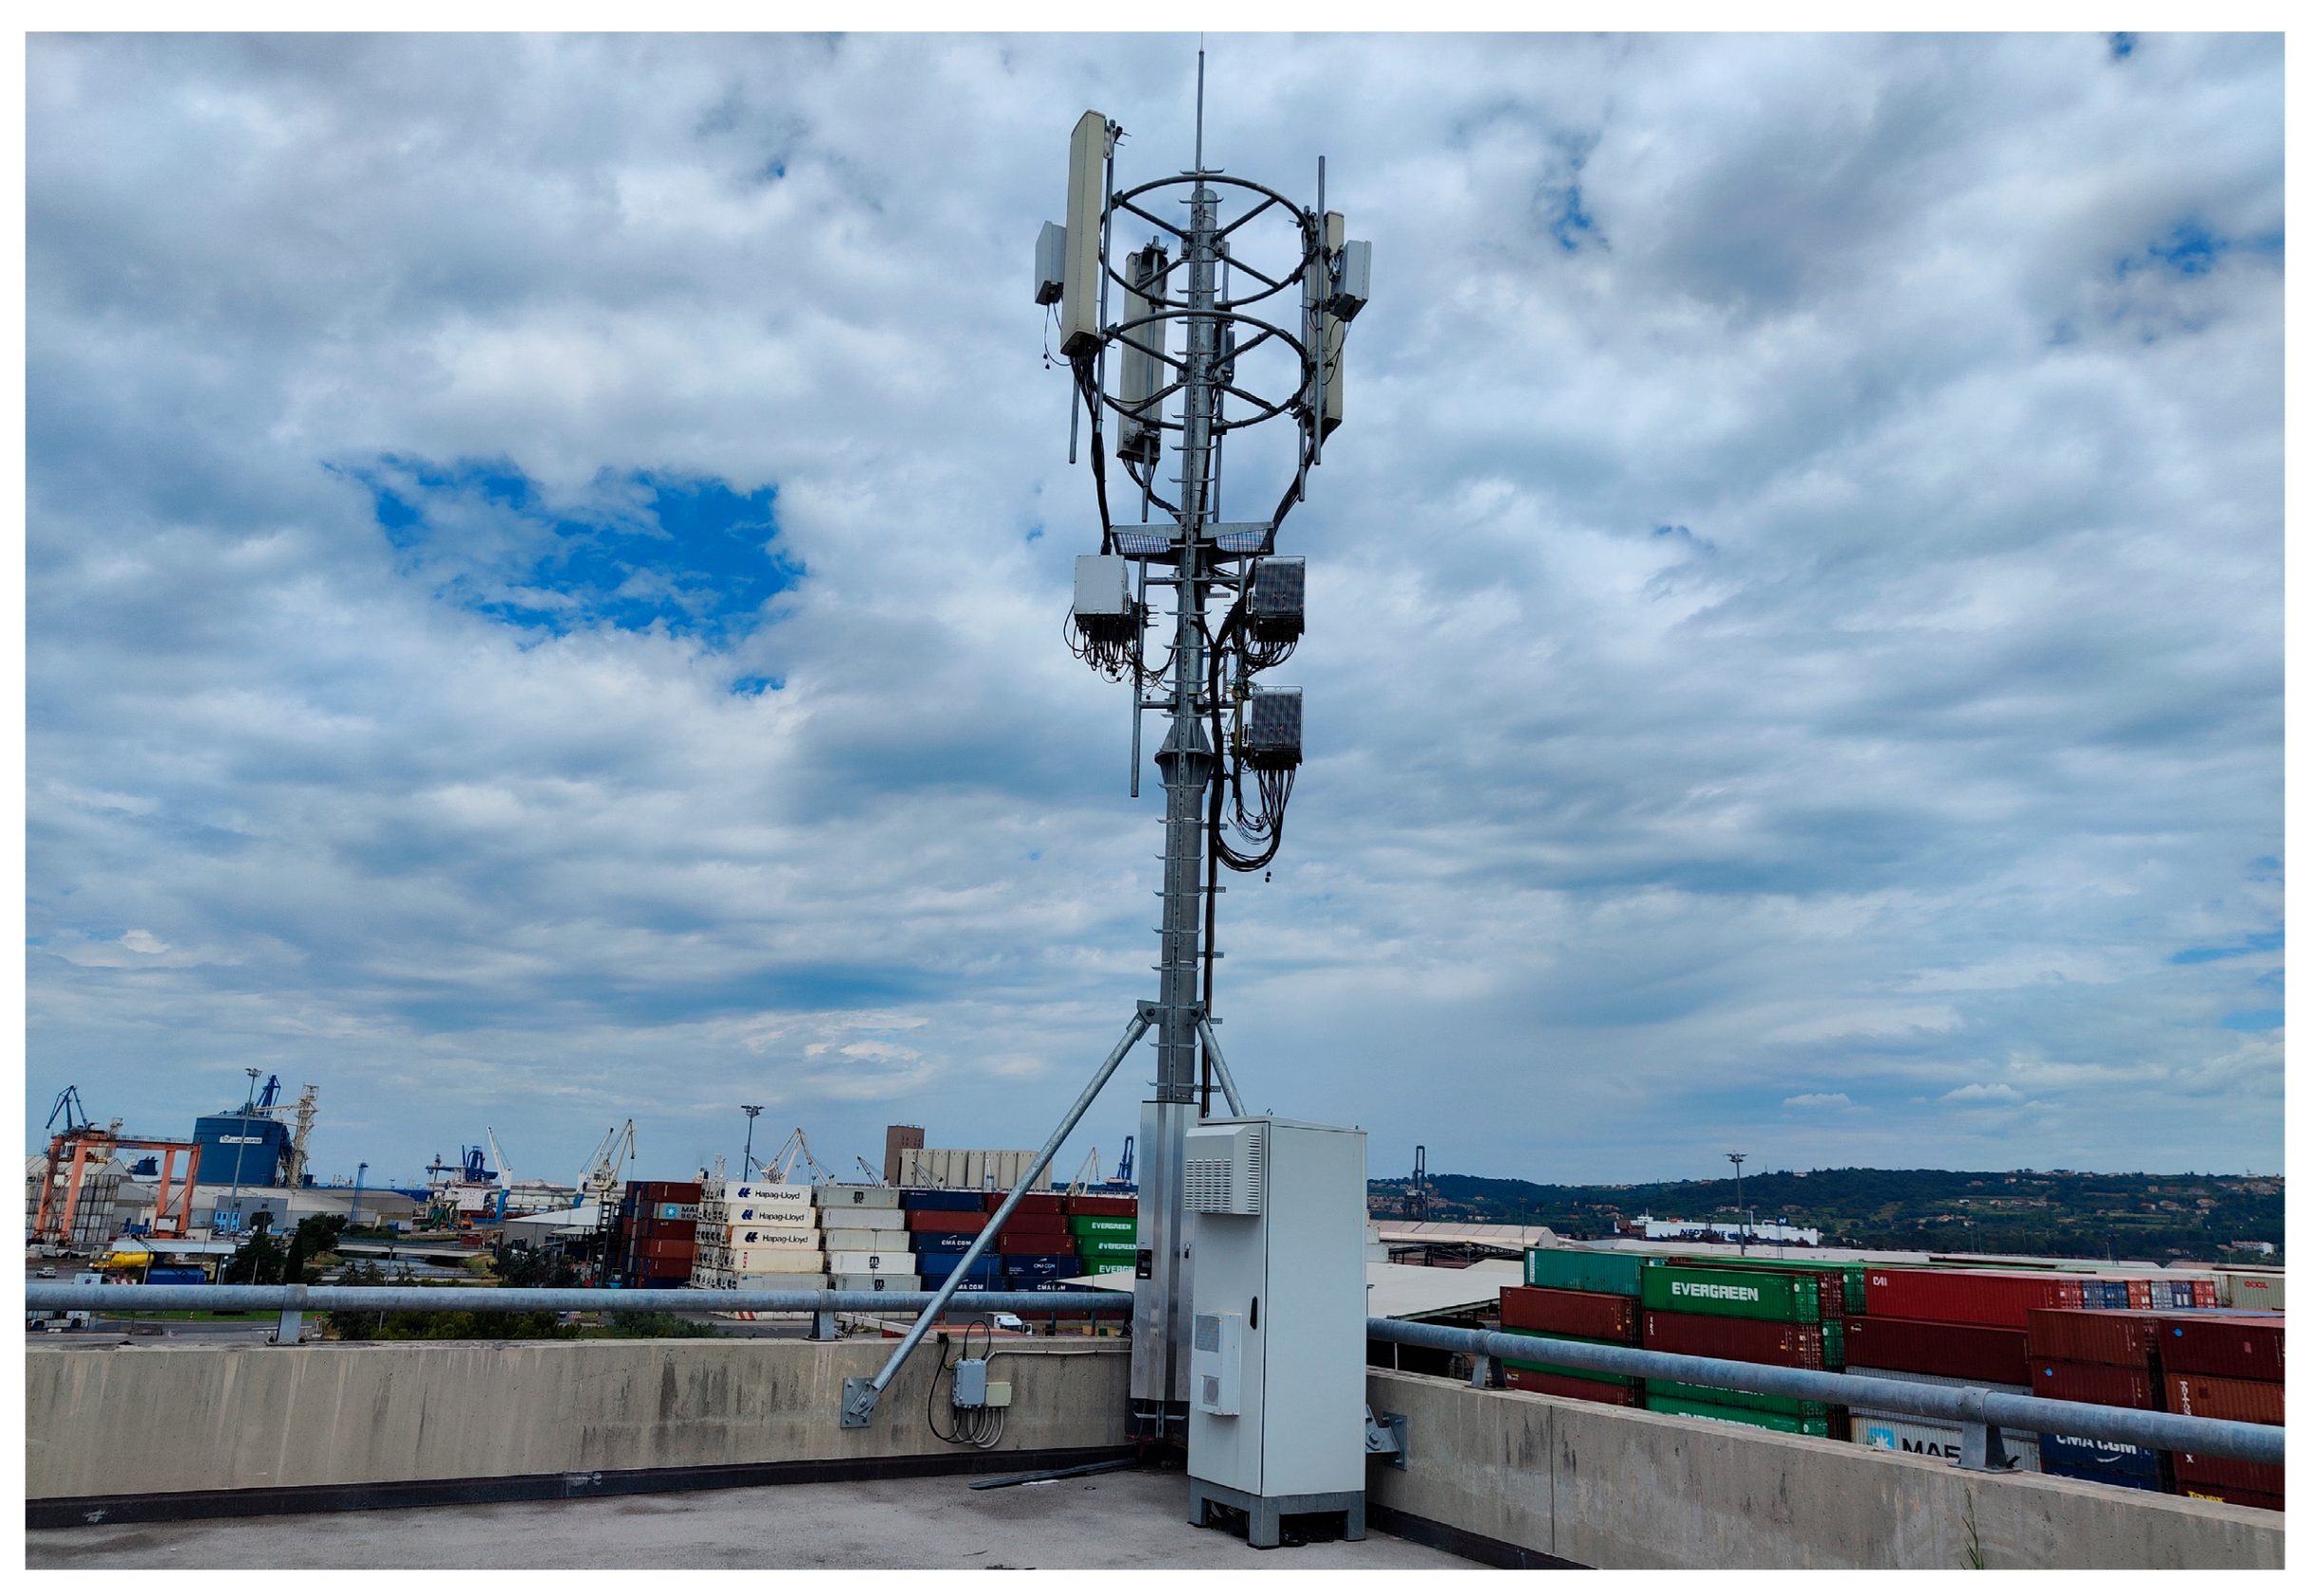
At the port, the second scenario was based on a private slice within a public 3.5 GHz 5G network. This private slice relied exclusively on base stations located inside the port, and all core infrastructure was hosted within the port area. Consequently, all information was kept inside the port premises. The setup consisted of a 100 W base station operating at the frequency of 3.47 GHz. The bandwidth was 100 MHz, with a duty cycle of 0.8. The beamforming antenna, the Ericsson AIR 3227, was mounted on a pole at a height of 9.2 m (Figure 4). Measurements were carried out under load conditions at a height of 1.5 m. Raster measurements were done on a 10 m × 10 m grid up to a distance of 50 m (Figure 5). Table 8 shows raster measurement results.

3.2.3. Scenario 3: Smart IOT Solutions: Warehouse, Private 5G FR1 Pico Cell

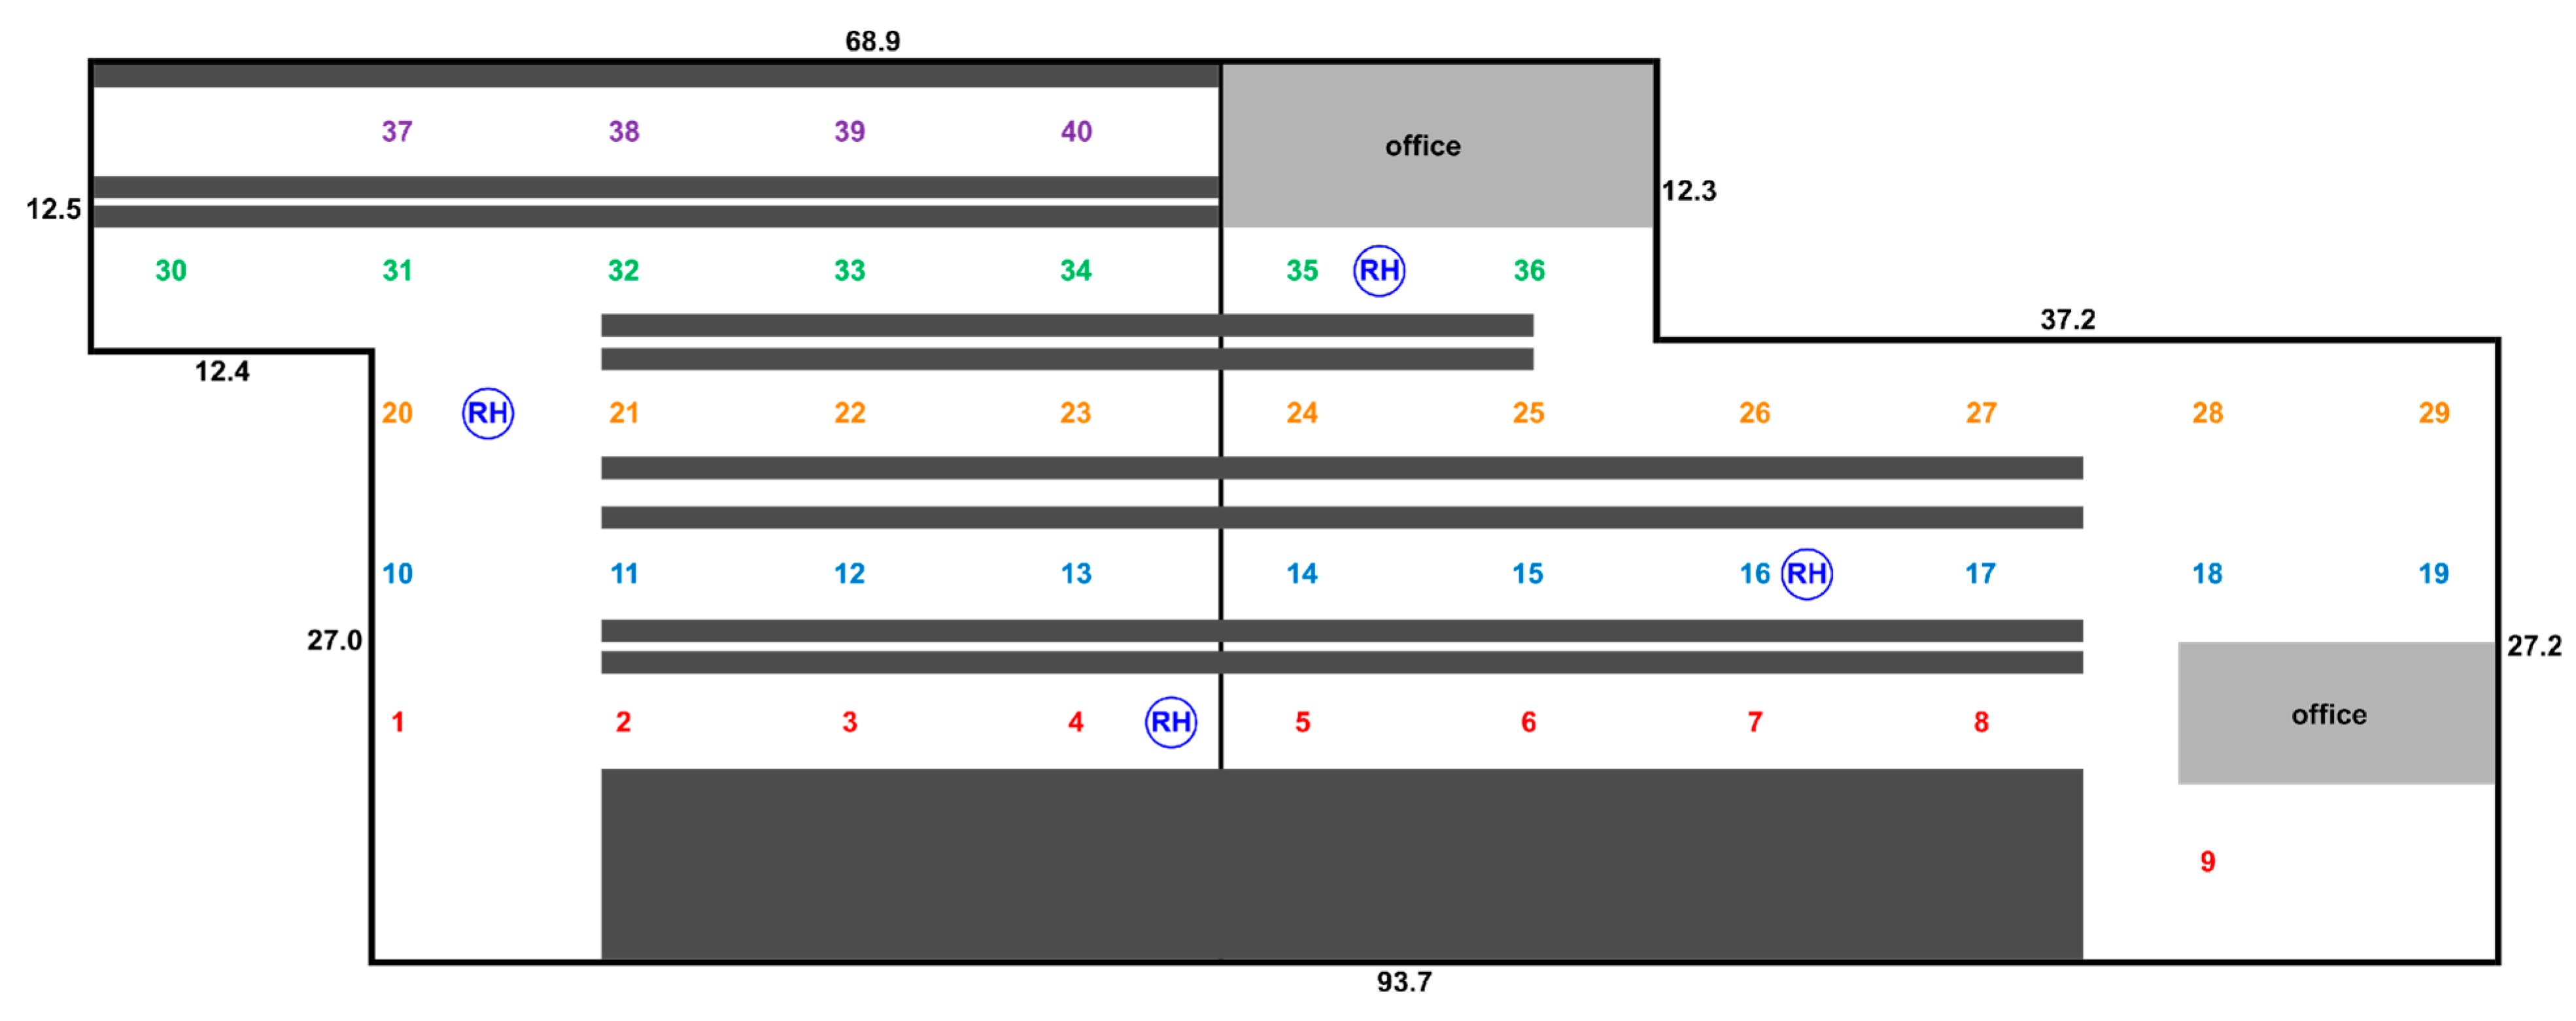
In the warehouse, a private 5G network was installed. The building covers approximately 3400 m2 and is primarily constructed of concrete, with a metal roof at a height of 5.5 m. Inside, six rows of pallet racks cover roughly 40% of the warehouse area (Figure 6). Attenuation of the pallet racks was determined to be 3 dB on average [5].
The private SA 5G network operated in the frequency range 3.7–3.8 GHz. The private network under test comprises four Nokia AirScale indoor radio heads AWHQB (Nokia, Espoo, Finland) distributed across the warehouse, mounted on roof beams at a height of approximately 5 m with a maximum output power of 1 W. The radiation pattern of the pRRHs is nearly isotropic. The duty cycle was 0.6.
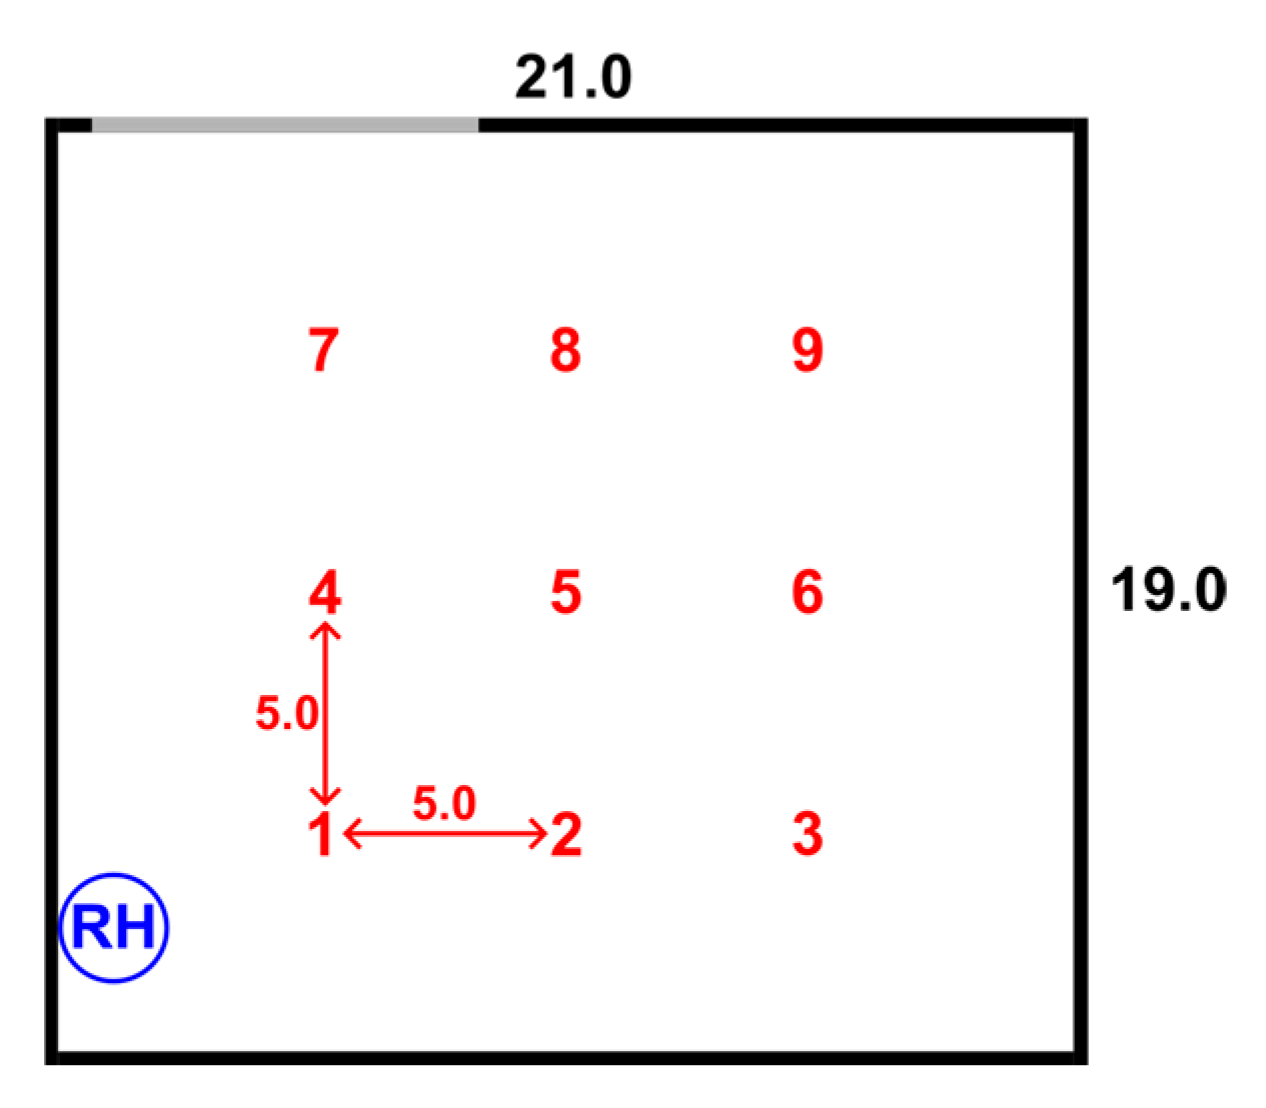
Code selective measurements were performed. Due to limitations imposed by pallet racks, raster measurements were slightly modified. Instead of a 10 × 10 m grid, measurements along the corridors were taken with a spacing of 10 m (Figure 6).
The results of measurements, listed in Table 9, clearly show that the electric field values were low at all measured locations. The 95th percentile value was 1.01 V/m.

3.2.4. Scenario 4: Smart IOT Solutions: Production Site, Private 5G FR1 Pico Cell

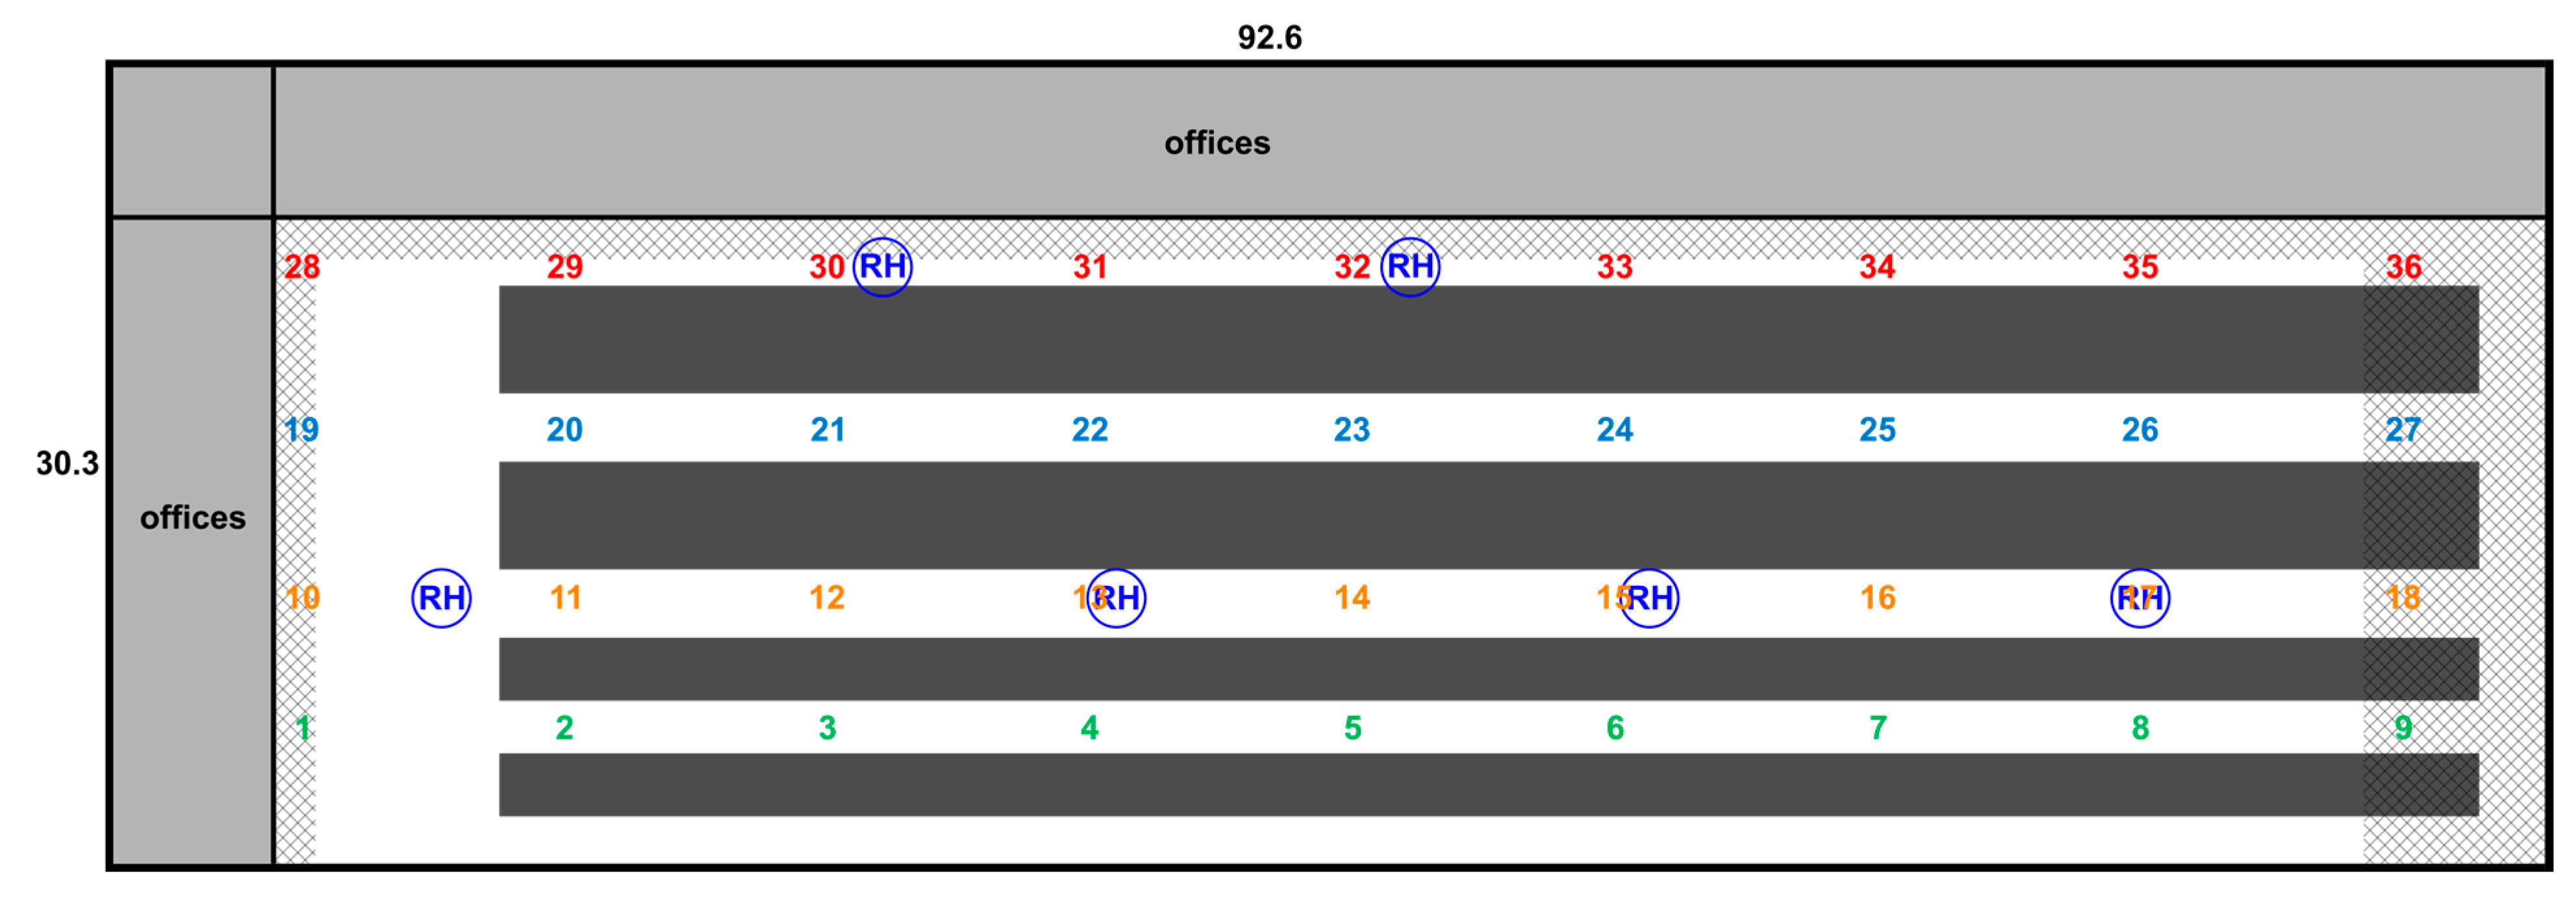
At a production site for electronic device assembly and testing, a private 5G network was installed. The production hall covers approximately 2800 m2 and is primarily constructed of concrete, with a metal roof at a height of 6.9 m. Two sides of the hall contain two-level offices, with a balcony on the first floor at a height of 3.4 m. Most of the building is occupied by the main production hall, which includes several dedicated workstations for assembly and testing, organized into four rows separated by corridors. All equipment is relatively low, below 2.5 m. The effective coverage of the hall with equipment is less than 20% (Figure 7).
The private SA 5G network operated in the frequency range 3.7–3.8 GHz. The industrial private network under test comprises four Nokia AirScale indoor radio heads AWHQB distributed across the production hall with a maximum output power of 1 W. Four of the radio heads were mounted on roof beams at a height of approximately 5.9 m, while two were installed on the balcony at a height of around 3.1 m. The radiation pattern of the pRRHs is nearly isotropic. The duty cycle was 0.6.
Code-selective measurements were performed. Due to limitations imposed by pallet racks, raster measurements were slightly modified. Instead of a 10 × 10 m grid, measurements along the corridors were taken with a spacing of 10 m (Figure 7).
The exposure in the production hall (Table 10) was slightly higher compared to the warehouse (Table 9). For the 36 measurements distributed throughout the entire production hall, the maximum value was 2.11 V/m, and the 95th percentile was 1.22 V/m. In the warehouse, there were several high pallet racks, mostly filled with different items, whereas in the production hall, the equipment was relatively sparse. Therefore, the attenuation of the EMF emitted by pRRHs was lower in the production hall than in the warehouse, leading to higher exposures in the production hall.
As expected, the maximum value in the production hall was measured at a measurement location 32, close to one of the lowest pRRHs. pRRHs in private installations will not be mounted significantly lower than the analyzed case; therefore, this situation represents the worst-case situation expected to be found in private network installations.
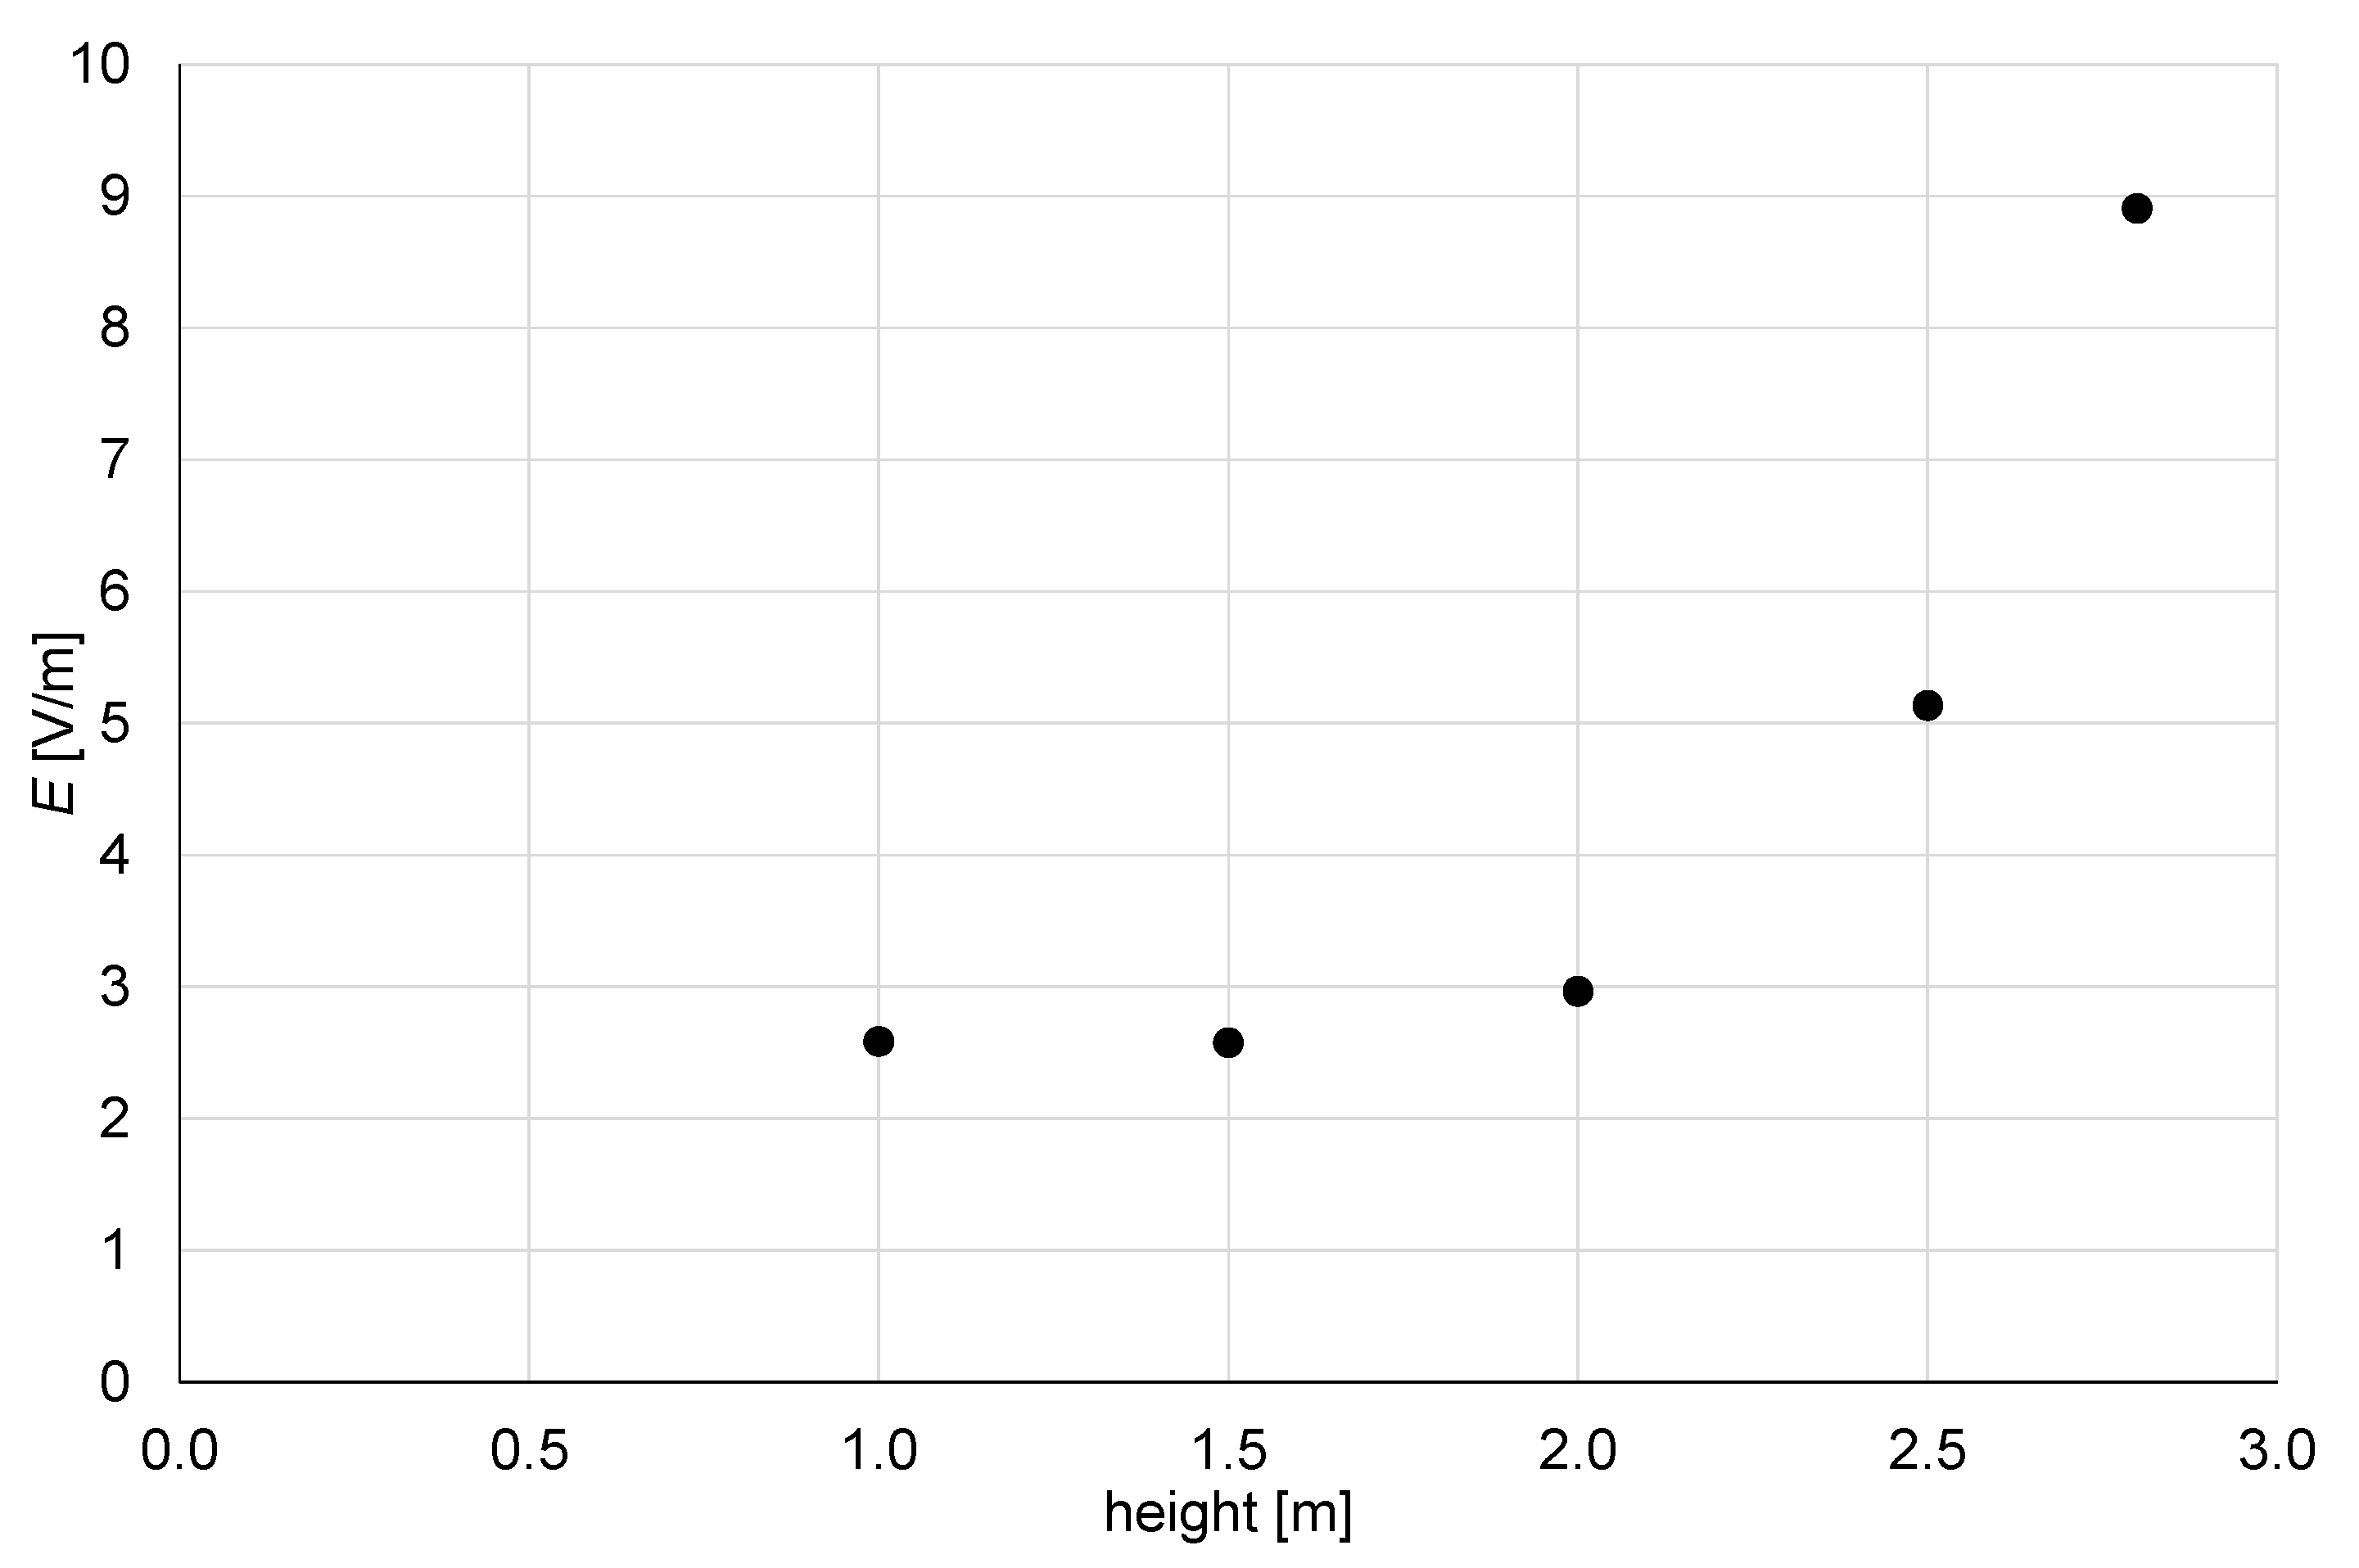
To further analyze the worst-case scenario, additional measurements were performed in the vicinity of one of the pRRHs mounted at a height of 3.1 m. Measurements were performed at multiple heights along a vertical line below the antenna. The results in Figure 8 show that at higher locations closer to the pRRH, the values increase to up to 8.9 V/m at the height of 2.8 m, which is 0.3 m below the pRRH.

3.2.5. Scenario 5: Office, Test Facility of Wireless Networks, Private 5G FR1 Micro Cell

A private 5G network was installed in an office hall covering approximately 400 m2, primarily constructed of concrete, with a metal roof at a height of 7 m. The upper side of the hall in Figure 9 featured metal doors approximately 6 m wide, extending the full height of the wall (gray part of the wall in Figure 9). The right side bordered additional offices with metallic wall panels and several small windows. The hall contained no tall objects. The private standalone (SA) 5G network operated at a frequency of 3.47 GHz with a 100 MHz bandwidth. The duty cycle was 0.8. An Ericsson 6524 (Ericsson, Stockholm, Sweden) antenna, with dimensions of 0.2 m × 0.2 m, was mounted on the wall at a height of 3 m. The power delivered to the antenna was 20 W. Measurements were repeated twice: first, under speed test conditions and second, as code-selective measurements. Due to the small size of the facility, raster measurements at a height of 1.5 m were conducted on a 5 m × 5 m grid instead of a 10 m × 10 m grid. Table 11 shows the measurement results.

3.2.6. Scenario 8: Smart Industry 4.0: Pallet Warehouse, Private 5G FR1 Pico Cell

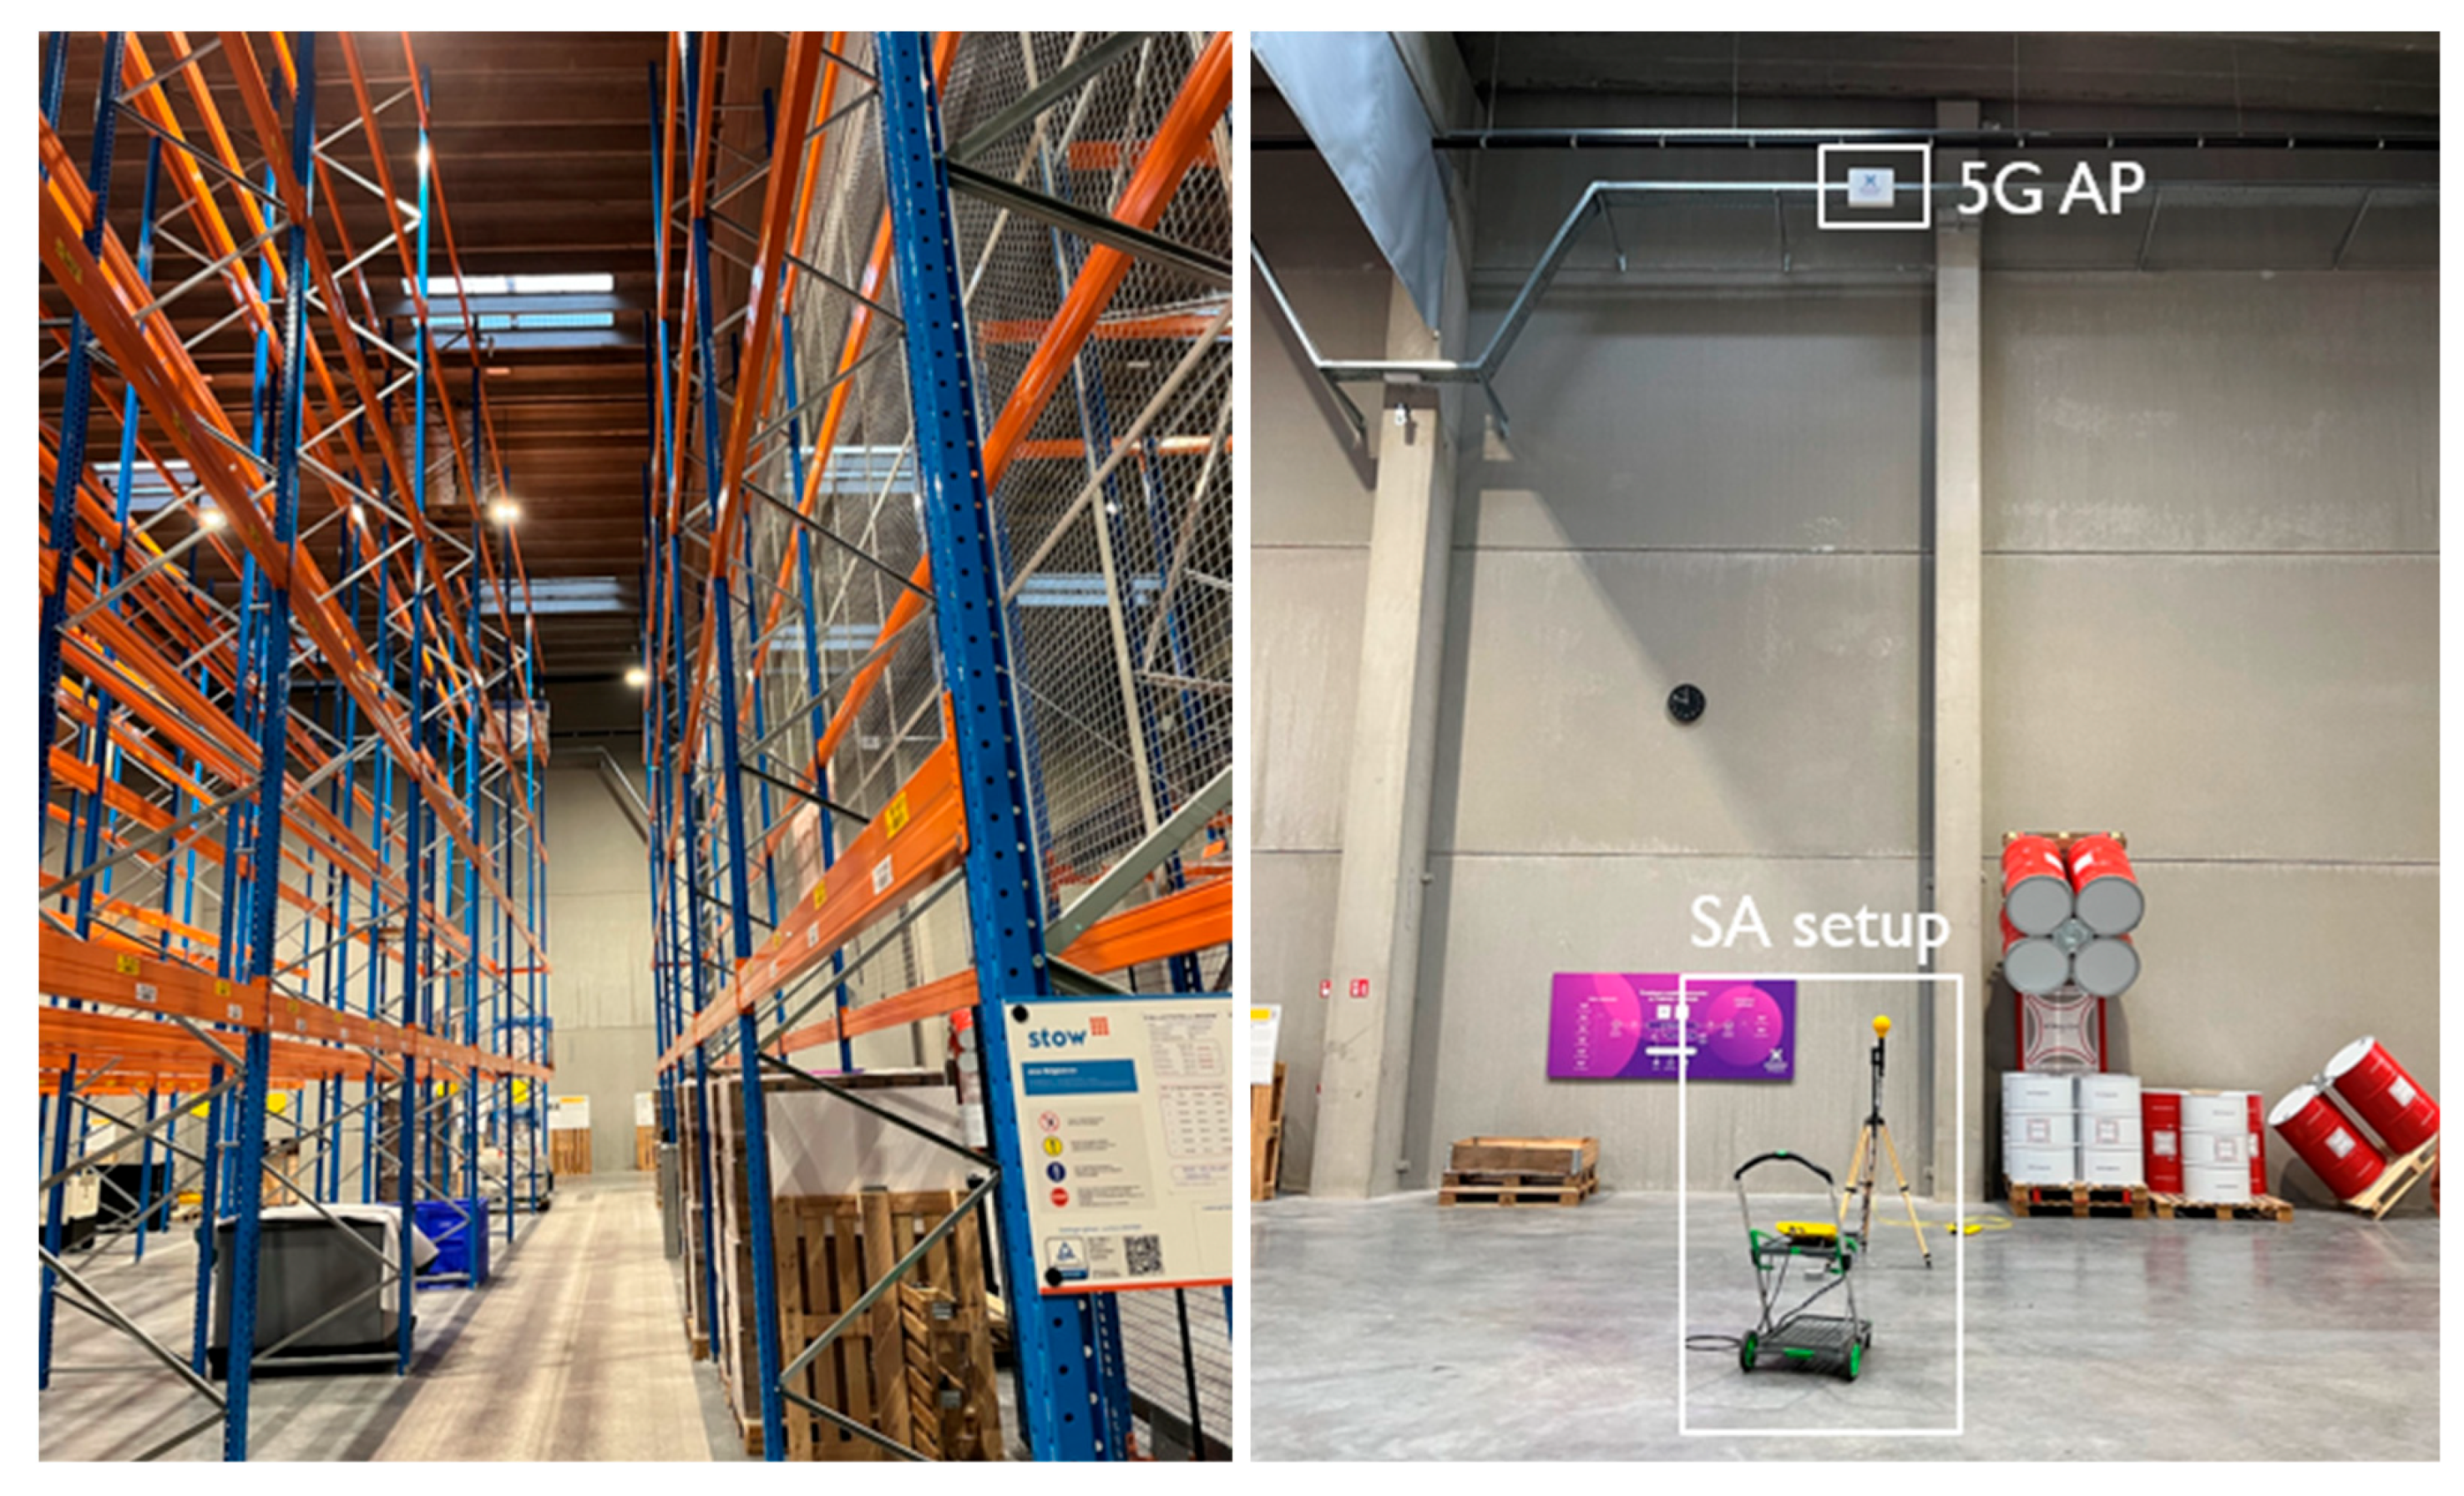
Fabriek Logistiek is a logistics test center in Ghent, Belgium, consisting of a pallet warehouse of 2400 m2 and an e-commerce warehouse of 2000 m2. In the entire test center, a 5G private network has been deployed by a mobile operator. The warehouse contains six 4G/5G directional 4 × 4 MIMO in-building antennas, providing coverage in each of the corridors between the metal racks of the pallet warehouse (see Figure 10, left). It operates at the frequency of 3.7 GHz.
Measurements were carried out at a height of 1.7 m. A smartphone Xiaomi 12 Pro (Xiaomi, Bejing, China), equipped with the QualiPoc (version 23.0.52) test tool (Rohde & Schwarz, Munich, Germany), was located at 2 m from the probe. Two scenarios were considered: an idle scenario, during which no active downlink connection was established during the measurement, and an “FTP 10 GB download” scenario initiated by running FTP download on the mobile phone during the measurement (see Figure 10, right).
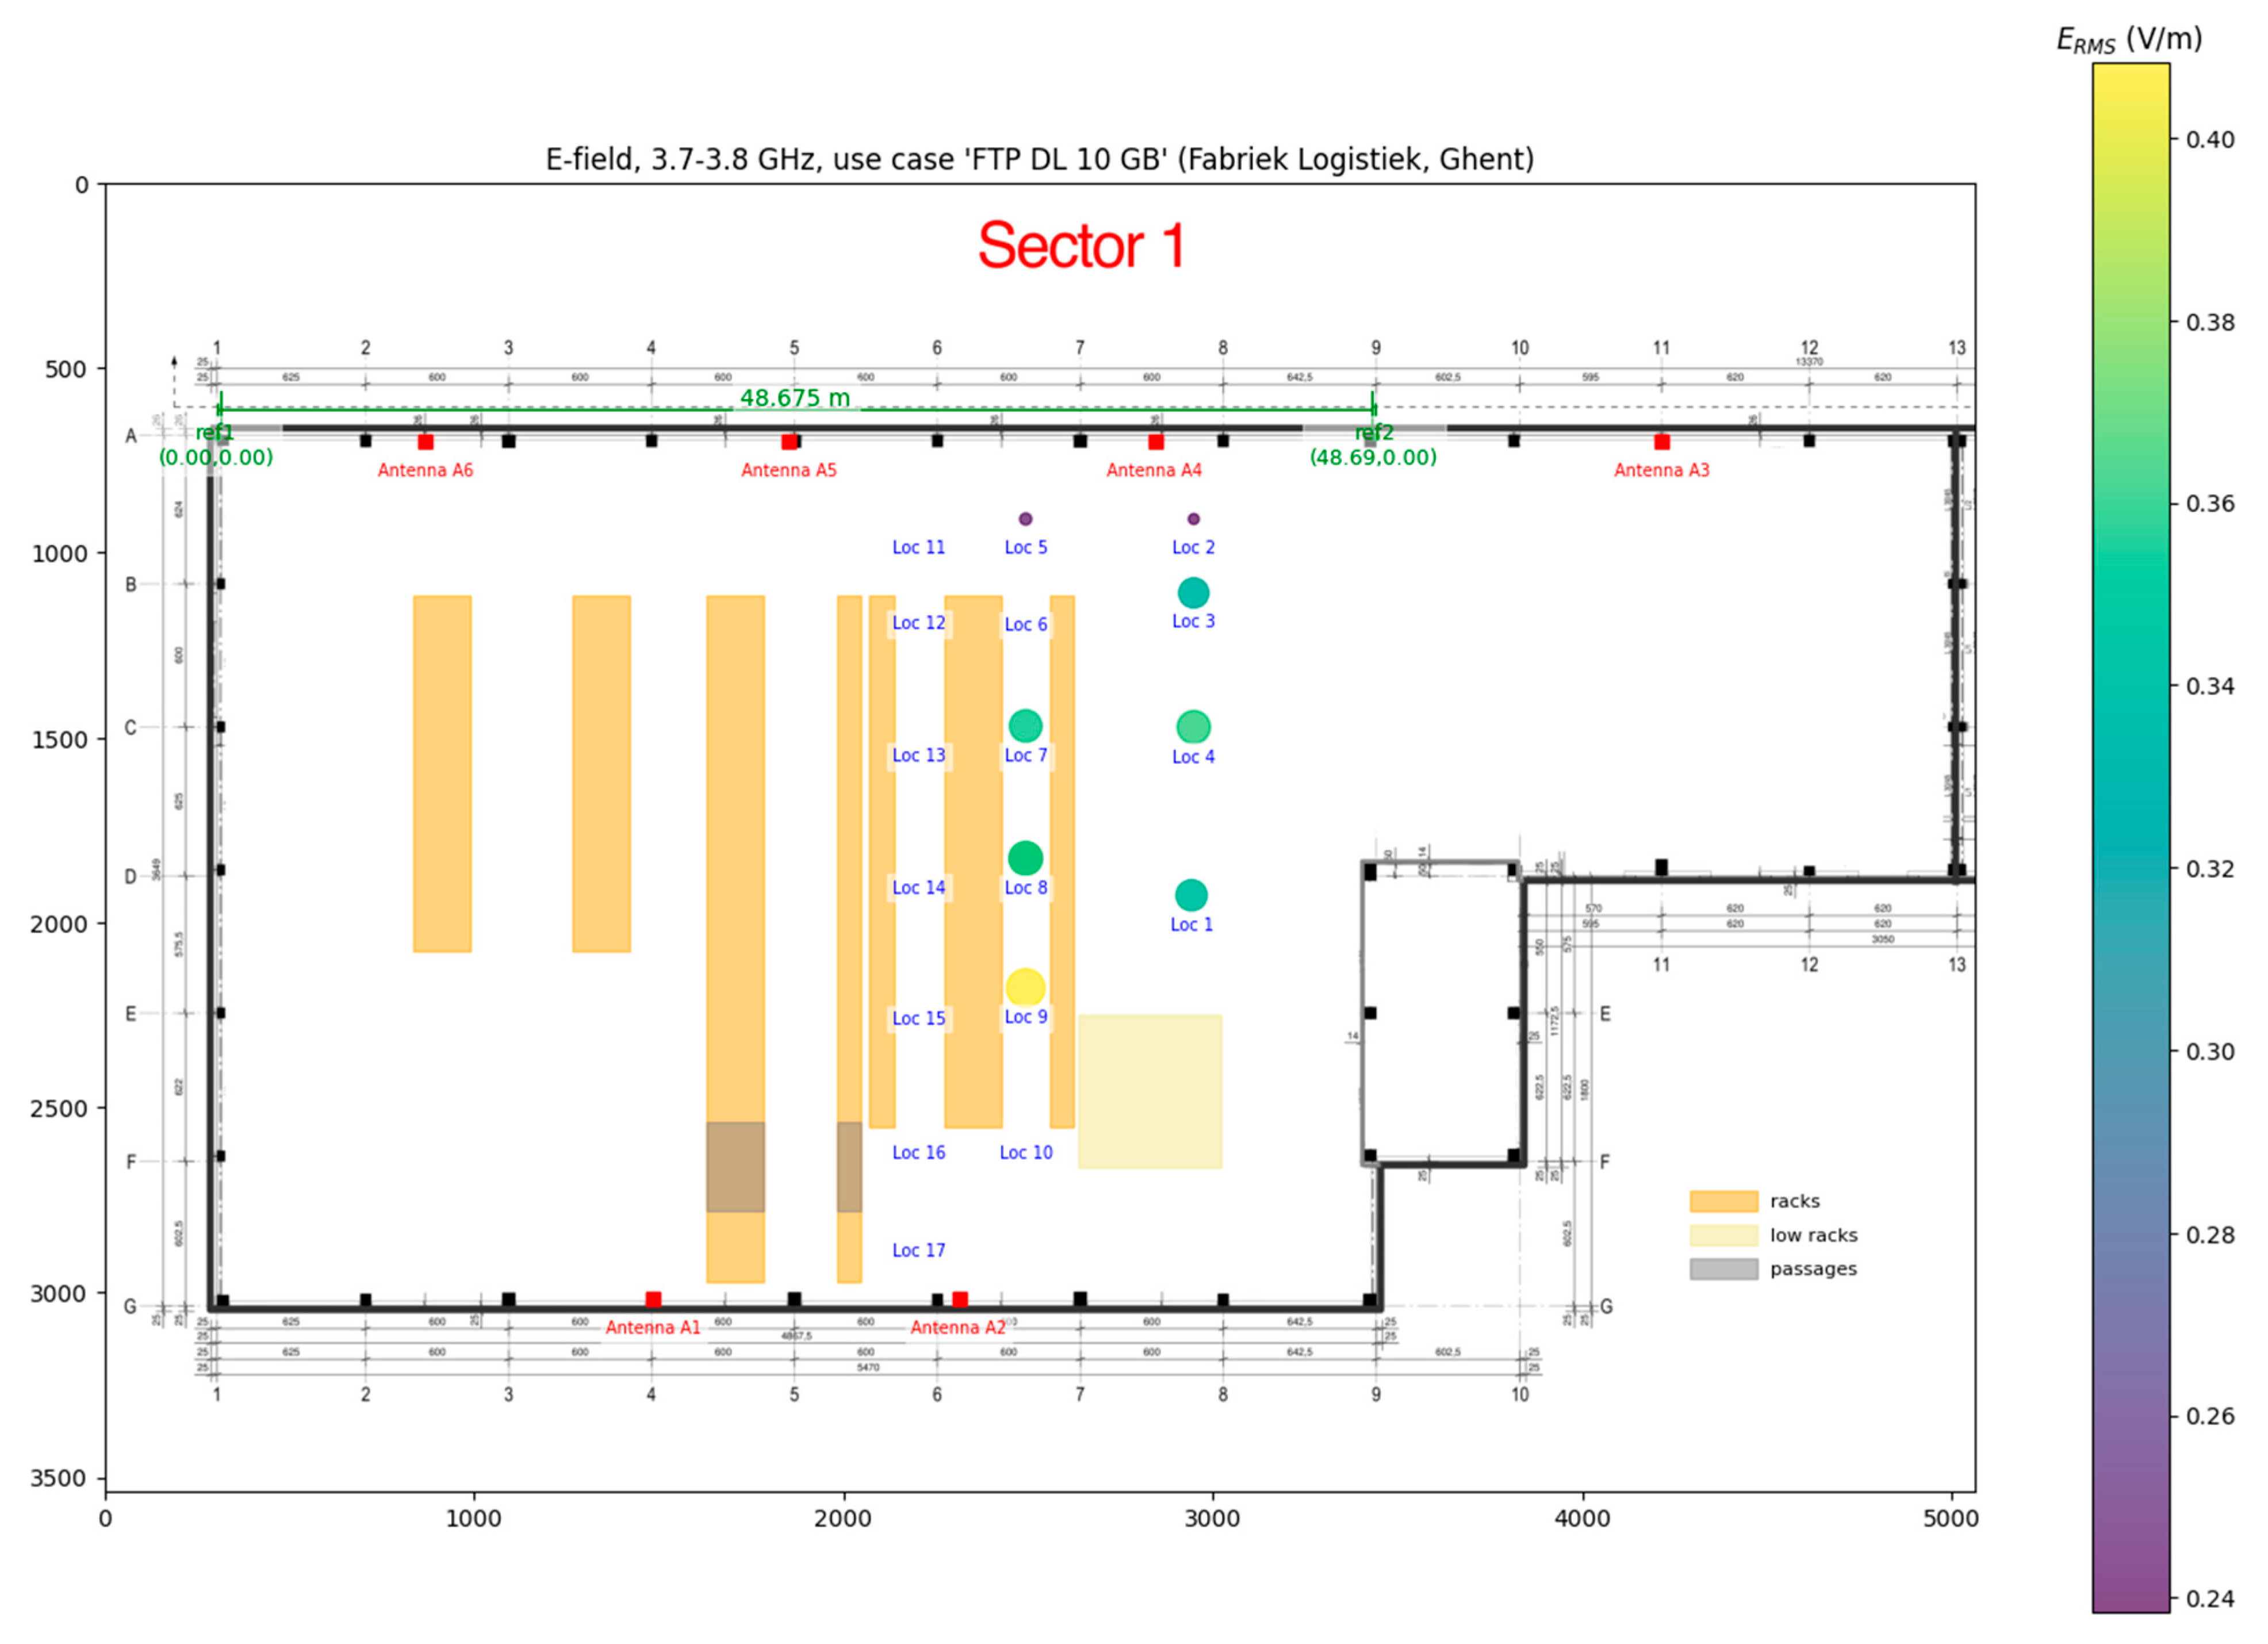
Figure 11 shows the mean RMS E-field in the 3.7–3.8 GHz frequency band on a ground plane of the pallet warehouse for the “FTP 10 GB DL” scenario. The 3.7–3.8 GHz frequency band is used by the 5G private network.
Table 12 lists the mean and maximum RMS E-field values at nine locations in the pallet warehouse. The mean RMS E-field for the “Idle” scenario ranged between 0.13 V/m and 0.14 V/m. During the “FTP 10 GB DL” scenario, the mean RMS E-field ranged from 0.24 V/m at locations Loc 2 and Loc 5 to 0.41 V/m at location Loc 9. The maximum measured RMS E-field values observed during the “FTP 10 GB DL” scenario were 3.5 to 3.8 times higher than the mean values, ranging from 0.77 V/m at location Loc 5 to 1.56 V/m at location Loc 9. For the “Idle” scenario, the maximum values ranged from 0.51 V/m at location Loc 5 to 1.00 V/m at location Loc 6.

3.3. Spatial Variability

Detailed measurements to evaluate spatial averaging were performed, which followed the IEC 62232:2022 [3] spatial averaging scheme using three heights (1.1, 1.5, and 1.7 m) across three lateral positions (center, 0.2 m to the left, and the same to the right). This plane yielded nine measurement points. It was expanded by two additional vertical planes offset 0.2 m in front and behind the central plane, which totaled 27 measurement points. The following average values were calculated: 3 point (central points at all heights), 9 point (all points in a central vertical plane), 27 point, and 9 point at 1.1 m, 1.5 m and 1.7 m.
For scenarios 2: Logistic sector: port, public slice 5G FR1 macro cell, 5: Office, test facility of wireless networks, private 5G FR1 micro cell, and 7: Research facility, private 5G FR2 micro cell, spatial variability was analyzed at a single location in the direction of the antenna’s main beam, at a distance of 50 m, 10 m, and 3 m from the antenna, respectively. Table 13 shows results of spatial variability measurements.
For scenarios 2: Logistic sector: port, public slice 5G FR1 macro cell and 5: Office, test facility of wireless networks, private 5G FR1 micro cell, the differences between the various averaging methods were not significant.
In scenario 7: Research facility, private 5G FR2 micro cell, the differences between averaging methods were significant, with height being a primary factor. This was expected given the short distance between the measurement location and the antenna and the antenna’s high directivity. A vertical displacement of just 0.2 m moved the antenna outside the main beam, resulting in substantially lower values.

3.4. Time Variability

To capture the time variability of the signals, measurements of the whole 5G band in use were performed over prolonged durations at several locations. As most of the networks under test were test networks, in most cases, no real traffic was present. To generate traffic, a speed test was usually run during the measurement period. From the results, the 6 min and, if possible, 30 min average values were calculated as an RMS value.
For scenario 1: Logistic sector: port, private 5G FR1 micro cell, measurements were taken at a distance of 5 m from the antenna. The base station was under normal operating conditions, transmitting at 4 W. As this was a test network, no real traffic was present; therefore, for a period of about 30 s, a speed test was run during the measurements. Due to low traffic, the values are low, with a mean value of 1.16 V/m. When traffic was present, the instantaneous value ranged between 2.5 and a maximum value of 4.78 V/m; therefore, the ratio between the maximum value and the mean value is 4.1.
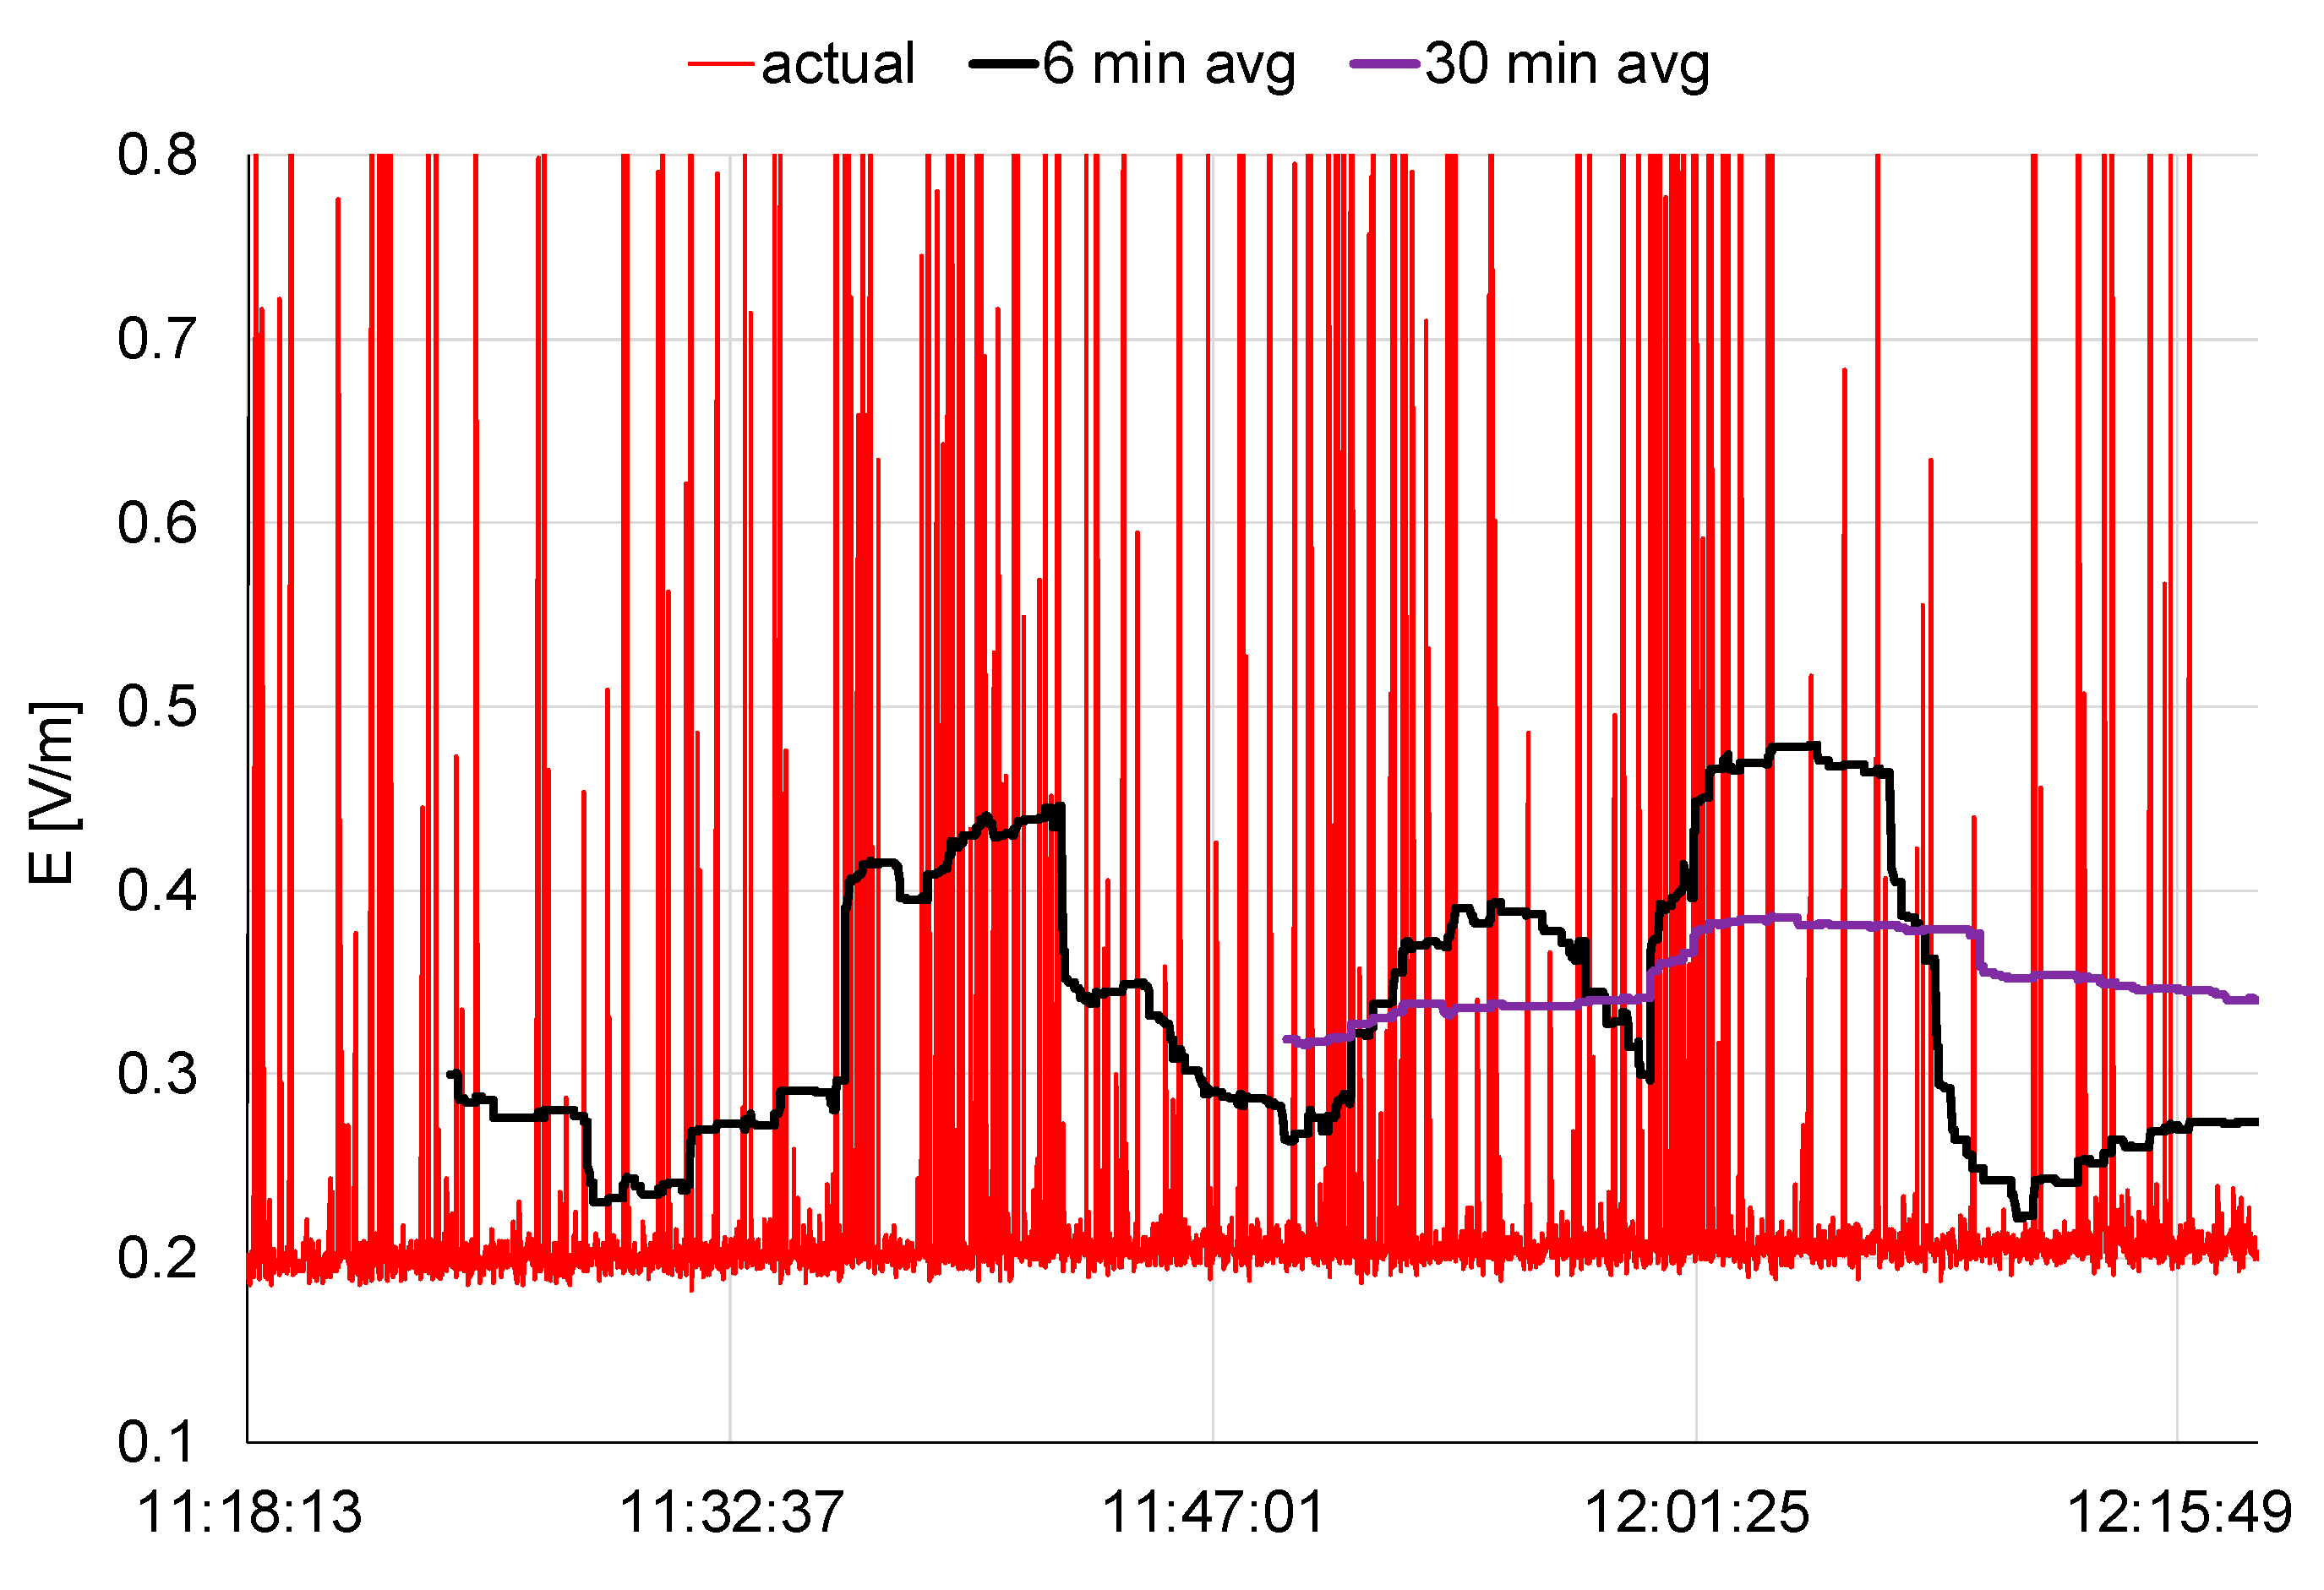
For scenario 2: Logistic sector: port, public slice 5G FR1 macro cell, measurements in the direction of the main beam at a distance of 50 m were performed over a duration of one hour. As the network under test was a public slice, normal traffic was present due to the public use of the network. Results are presented in Figure 12. The maximum measured value was 5.01 V/m (red line, not visible in Figure 12 due to the selected scale), whereas the highest 6 min average value was much lower at 0.48 V/m (maximum of black line), and the highest 30 min average value was 0.39 V/m (maximum of violet line). Therefore, the ratio between the maximum value and the 6 min average value is 10.4. These large differences are caused by the operating conditions of the network under testing. Although the base station was operational, it was active only for a fraction of the time; therefore, intermittent high values had a strong influence on the average value.
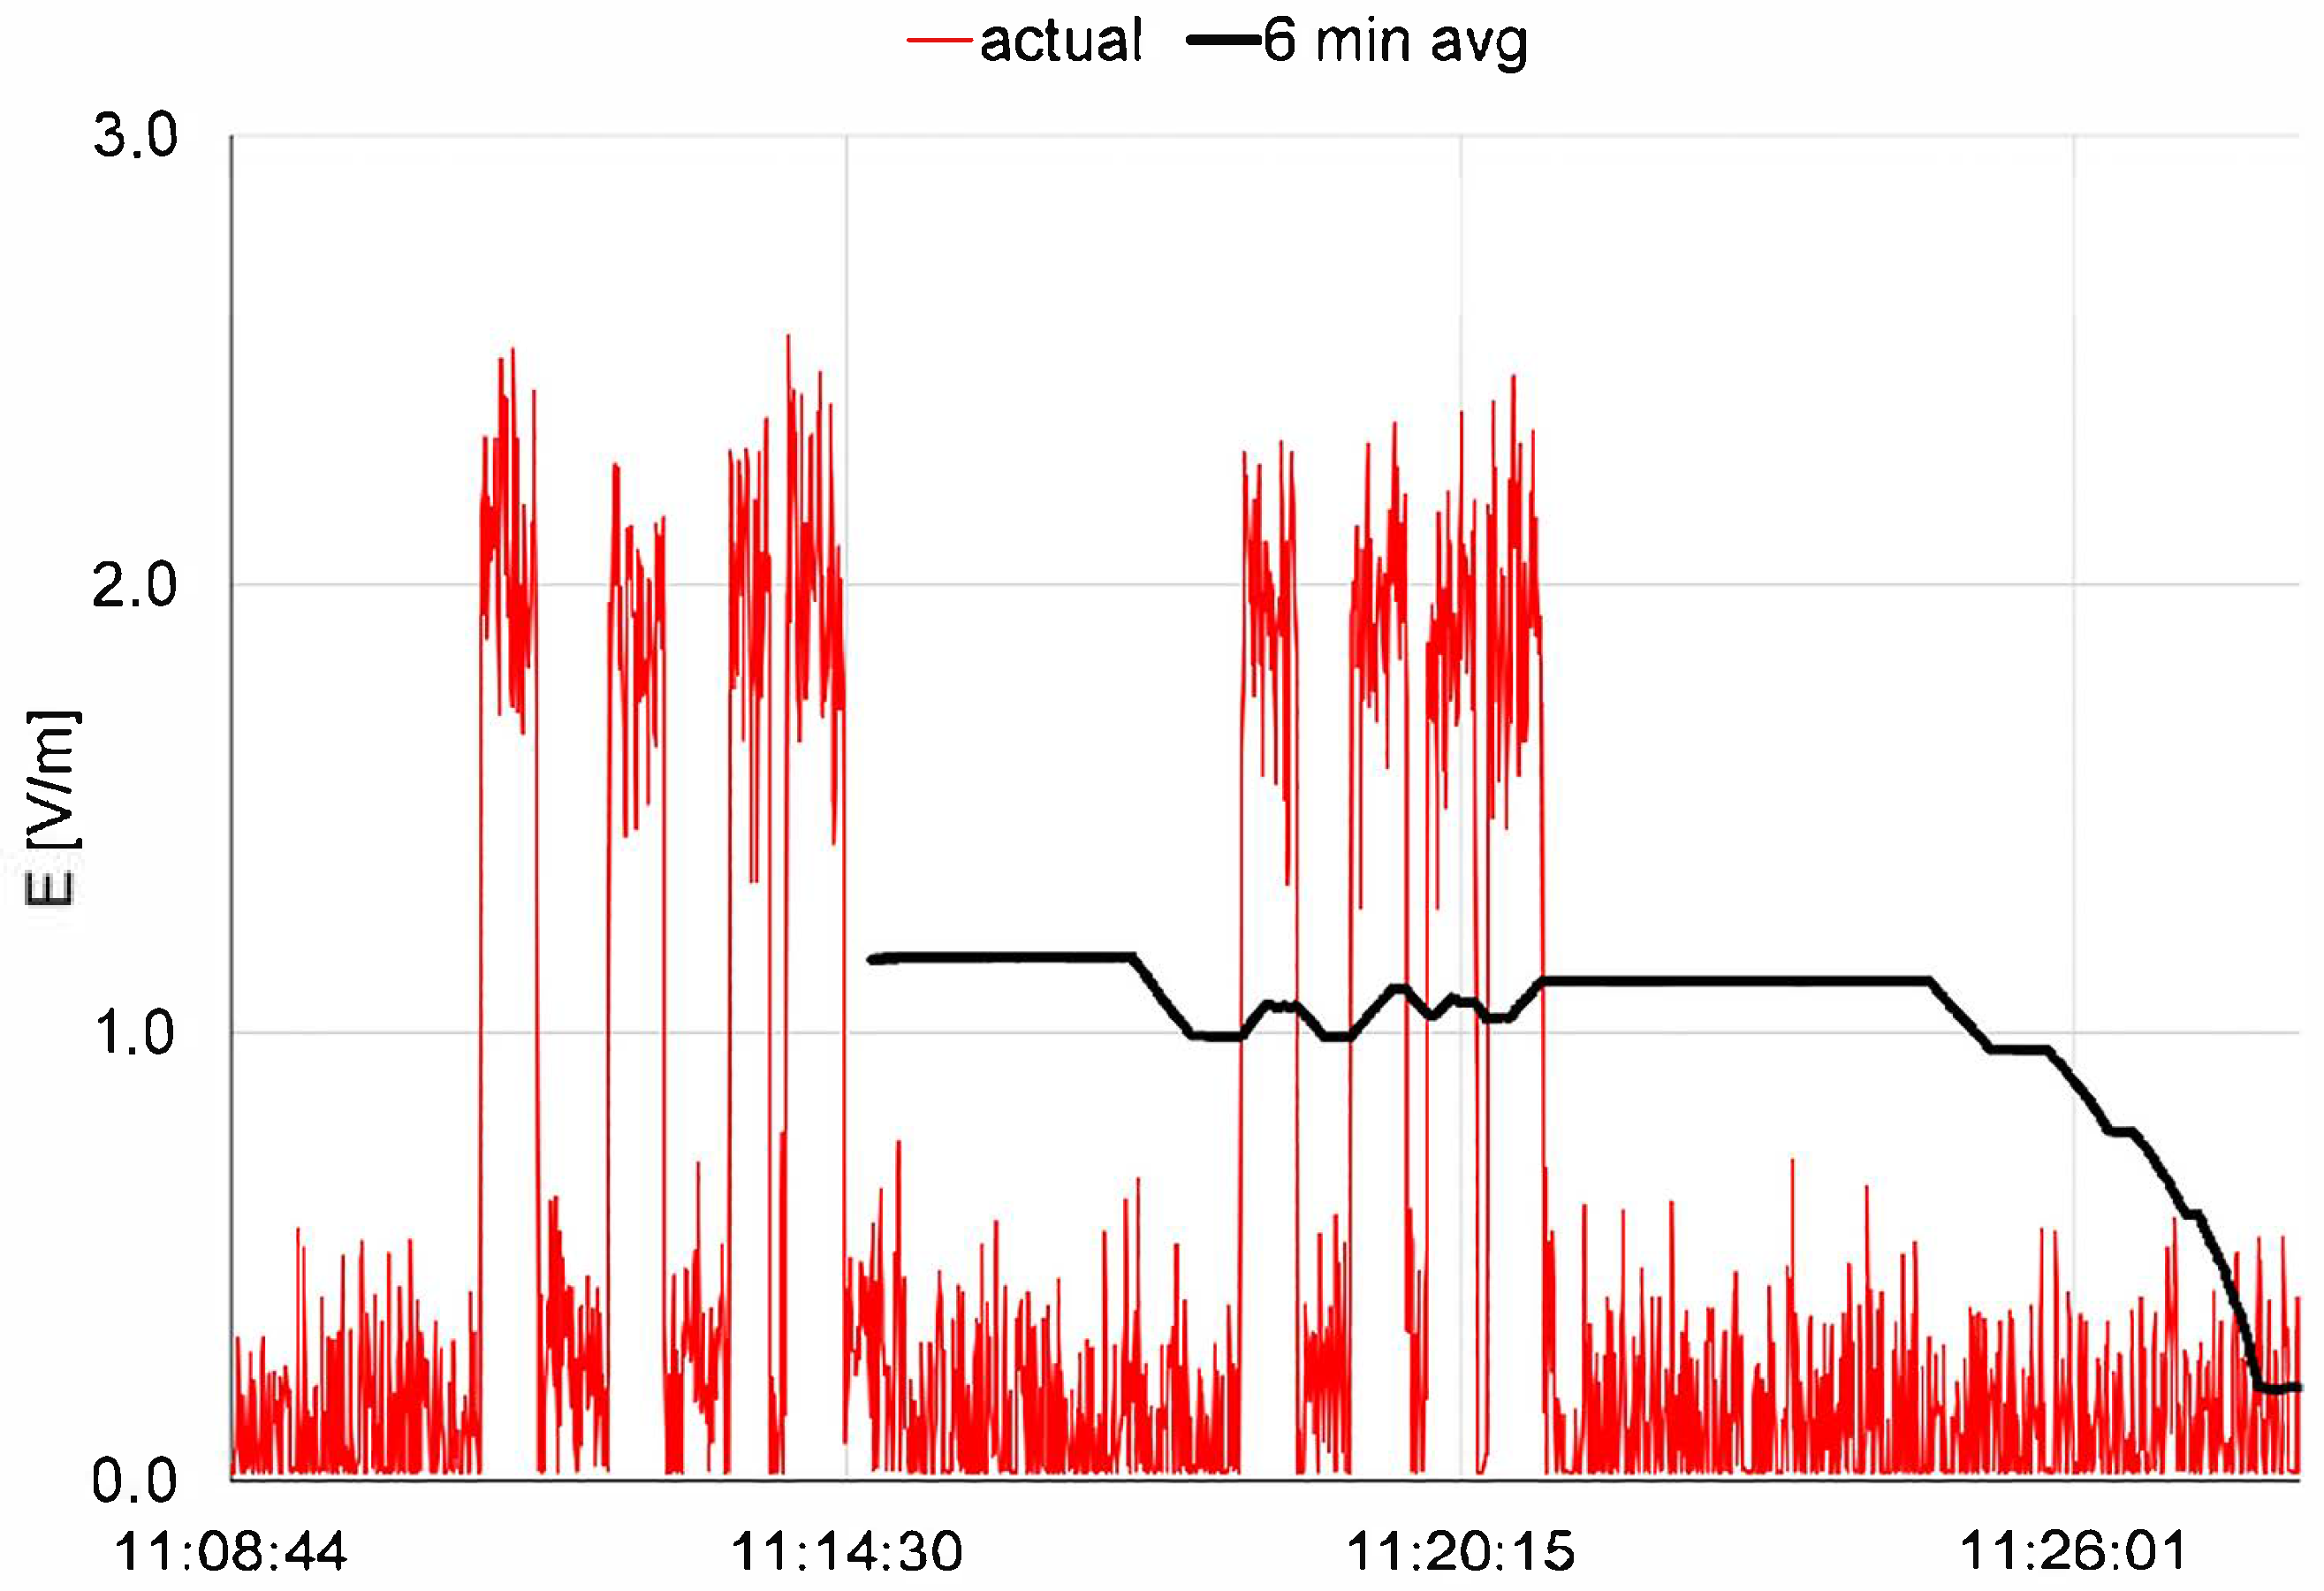
For scenario 6: Office, production site, private 5G FR1 pico cell, measurements were conducted for a duration of 20 min at a distance of 2 m and 2 m below the pRRH. As this was a test network, no real traffic was present; therefore, a speed test was run several times during the measurements, which is clearly visible from the results in Figure 13. The maximum value was 2.55 V/m, whereas the highest 6 min average value was lower at 1.17 V/m. Therefore, the ratio between the maximum value and the 6 min average value is 2.2.
For scenario 7: Research facility, private 5G FR2 micro cell, measurements were taken in the main beam at a distance of 3 m and a height of 1 m over a period of approximately 10 min. The maximum value was 20.95 V/m, whereas the highest 6 min average value was much lower at 1.10 V/m. Therefore, the ratio between the maximum value and the 6 min average value is 19.0. These large differences are caused by the operating conditions of the network under testing. The amount of traffic was very limited, and therefore, some intermittent high values had a strong influence on the average value.
Table 14 shows the measurement results for all 4 analyzed scenarios.

4. Discussion

RF EMF measurements were conducted across eight distinct scenarios, selected to represent a diverse range of sectors—including logistics, manufacturing, and office environments—and frequency bands (3.5 GHz, 26 GHz). The selected scenarios encompass a broad spectrum of private network settings, ranging from public 5G macro slices operating at 100 W per sector to indoor pico cells with power below 1 W.
However, the selection process was significantly constrained by several external challenges. First, the number of fully operational private 5G installations remains very limited. Second, the owners of the existing private 5G networks were generally reluctant to grant access to their facilities, which hindered the execution of more extensive measurement campaigns.
Another significant challenge was the current lack of network traffic. Most private 5G networks are currently idle or carry minimal traffic, particularly regarding the number of active connected devices. Although 5G for Industry 4.0 is envisioned to facilitate massive connectivity for IIoT devices and user interfaces, only a few devices were active during these measurements. The CD values presented in Table 2 and the typical exposure levels in Table 15 were determined for worst-case conditions; consequently, they remain independent of actual network traffic or device use. However, in environments with a high density of connected devices, the overall exposure to RF EMF may increase—particularly if there is substantial uplink traffic, which is a possible future scenario for private networks. Due to the limited number of such devices in this study, it was not possible to analyze these cumulative effects. Notably, the literature regarding general public exposure indicates that the simultaneous operation of a large number of devices in dense situations can lead to a marginal increase in total RF-EMF exposure [6,7].
Nevertheless, time-variability measurements were conducted across key scenarios, where the total value was measured across the frequency band in which the network was operating. Where traffic was present—or deliberately generated—information regarding time variability and average exposure was obtained. However, estimating expected average exposure values in private 5G networks remains challenging, constrained by their current limited operational state. To address this, worst-case conditions were determined in all scenarios, either by selective measurements with extrapolation to maximum values or by performing measurements under forced traffic conditions (e.g., speed tests or continuous data transfer).
During the measurement process in an operational factory environment, a location was identified where the pRRH was installed at a lower height of 3.1 m, representing the worst-case exposure scenario. At this location, the maximum electric field measured at a height of 1.5 m was 3.1 V/m, recorded right below the pRRH.
Table 15 summarizes the raster measurement results. Raster measurements were selected because they provide the best estimate of the RF EMF levels emitted by the equipment under test. By distributing measurement points throughout the entire area surrounding the source, they yield a reliable assessment of the average RF EMF exposure for personnel in the vicinity of the private wireless network.
The results presented in Table 15 demonstrate significant variability across the different exposure scenarios, with values spanning a factor of up to 20. Notable spatial variability is also evident within individual scenarios. For scenarios 2, 3, 4, 5, and 8, the ratio between the median and maximum values is below 4, indicating relatively uniform exposure levels across the measurement grid. In contrast, this ratio exceeds 10 in scenario 1. This marked discrepancy is attributed to the antenna’s low installation height (1.9 m), which placed the closest measurement point directly in the main beam and at a short distance from the antenna.
Determination of CD through both calculations and measurements indicates that, for typical private 5G installations, compliance zones are relatively compact: below 1.5 m for general public exposure and below 0.7 m for occupational exposure. An exception occurs when a network slice within a public 5G network is utilized as a private network; in these instances, compliance zones increase to below 15 m for general public exposure and below 6 m for occupational exposure. It should be noted that these calculated CDs represent conservative, worst-case situations, as the source was modeled as a single-point source. If the source were instead modeled as an array of emitters—more accurately reflecting the construction of a real antenna—the resulting compliance zones would be smaller. These findings are supported by the experimental data: in cases where measurements were conducted close to the source, the CDs derived from measurements were consistently smaller than those derived from numerical calculations.
Regarding time variability, the investigation demonstrated that the averaging duration has a limited impact on selective measurements. In the four scenarios analyzed, the maximum difference between the 1 min and 6 min averages was 33%, and below 10% when comparing the 3 min average.
In contrast, measurements across the entire 5G frequency band exhibited substantially greater variability, driven primarily by the network’s operational state. Although the base stations were active, they carried traffic only for a small fraction of the time; consequently, intermittent bursts of high traffic significantly influenced the calculated average. The maximum difference between 1 min and 6 min averages reached 100%. Furthermore, pronounced differences were observed when comparing periods of high-demand speed testing against baseline idle periods.
In scenario 5: Office, test facility of wireless networks, private 5G FR1 micro cell, the only active device was the modem used for speed testing, which encompassed both download and upload phases. Measurements during these active periods differed markedly from those obtained during idle times. A similar trend was observed in scenario 1: Logistic sector: port, private 5G FR1 micro cell: during periods of low traffic, the electric field remained slightly above 1 V/m, whereas it increased 2.5–5 V/m during active traffic conditions.
Spatial variability was assessed across several exposure scenarios using the methodology prescribed by IEC 62232:2022 [3]. The spatial averaging scheme utilized three vertical heights (1.1 m, 1.5 m, 1.7 m) and three lateral positions (center, 0.2 m left, 0.2 m right), yielding nine measurements. Two additional vertical planes (0.2 m in front and 0.2 m behind) increased the total to 27 measurement points.
In scenario 2: Logistic sector: port, public slice 5G FR1 macro cell, the source consisted of a 5G network slice utilizing a beamforming macro cell mounted on a pole. All pilot signal results were consistent across all averaging schemes: individual measurements ranged from 0.095 to 0.228 V/m, with calculated averages ranging from 0.136 to 0.151 V/m. However, the extrapolated maximum values exhibited greater variability due to beamforming effects. Despite the close spatial clustering of measurement points, the extrapolation factor varied between 215.28 and 270.56. Consequently, extrapolated values ranged from 20.80 to 48.99 V/m, whereas the averaged values were more stable, ranging from 32.27 to 36.42 V/m. Notably, the differences between the various averaging methods remained insignificant. Similar trends were obtained for scenario 5: Office, test facility of wireless networks, private 5G FR1 micro cell, where the values ranged from 9.35 V/m (single point) to 12.71 V/m (three-point average).
In contrast, scenario 7: Research facility, private 5G FR2 micro cell, demonstrated significant variation between averaging methods, heavily influenced by measurement height. This result was expected given the short distance between the measurement location and the highly directive base station antenna. Minor changes in antenna height caused substantial fluctuations in antenna gain and, consequently, in the measured electric field strength. The disparity in the data is notable: the maximum single-point value reached 48.55 V/m, while the nine-point average at 1.1 m yielded a minimum of 12.16 V/m. The sensitivity to height is further evidenced by comparing the nine-point averages: the value was 47.50 V/m at 1.5 m, but dropped sharply to 14.73 V/m at 1.7 m.
Spatial variability measurements indicate that when antennas possess low directivity and are measured at a sufficient distance, the precise micro-location of the measurement point usually has no significant influence. Conversely, for highly directional antennas, the micro-location of the antenna has an important effect on the measured value.
Time and spatial variability are also substantially affected by the beamforming technology. While the effects of beamforming were not explicitly analyzed in this study, the methodologies for determining CD were designed to be conservative: for calculations, the envelope of all traffic beams was utilized, whereas for measurements, maximum values were determined without applying power reduction factors.
Although the effects of beamforming have been extensively analyzed for public networks [8,9], the current lack of representative traffic and real-world usage in the analyzed private networks precluded an analysis of the beamforming’s influence on actual exposure levels.


5. Conclusions

In all analyzed scenarios, the RF EMF exposure from private 5G standalone networks was found to be well below occupational exposure limits, even under worst-case conditions. This is characteristic of indoor smart industry scenarios, where deployment of multiple low-power pRRHs ensures robust coverage in various indoor scenarios despite high clutter. Ceiling mounting of pRRHs is standard practice, mainly to obtain good coverage, which inherently limits exposure at worker-accessible heights. To further minimize average downlink exposure, it is advised to aim for a homogeneous distribution of (lower) electric field levels. This can be achieved by either increasing the installation height of pRRHs and increasing their power as needed, or by increasing the density of pRRHs and simultaneously reducing their output power to maintain coverage while reducing peak values.
While this study provides a comprehensive evaluation of worker RF EMF exposure within an operational smart industry environment, the results are based on a limited set of private networks within Smart Industry 4.0. Consequently, extrapolating these results to broader industrial sectors and settings requires caution. Exposure levels are subject to variability, influenced by transmitter power, deployment density, beamforming configurations, and environmental factors such as structural design, material composition, and spatial arrangement of reflective surfaces. Facilities utilizing higher-power transmitters, lower mounting heights of antennas, or dense metallic infrastructure could exhibit distinct exposure distributions. Nevertheless, the study’s dual-methodology approach—combining empirical measurements with numerical modeling—remains a robust approach for assessing worker exposure in diverse industrial settings.

Author Contributions

Methodology, P.G.; software, C.A. and D.P.; validation, C.A., D.P. and B.V.; investigation, B.V., C.A., D.P. and G.V.; writing—original draft preparation, B.V. and P.G.; writing—review and editing, D.P., C.A. and G.V.; supervision, P.G. All authors have read and agreed to the published version of the manuscript.

Funding

This research was funded by the European Union’s Horizon Europe Framework Programme under Grant Agreement number 101057622 (SEAWave Project).

Data Availability Statement

The original contributions presented in this study are included in the article. Further inquiries can be directed to the corresponding author.

Conflicts of Interest

The authors declare no conflicts of interest. The funders had no role in the design of the study; in the collection, analyses, or interpretation of data; in the writing of the manuscript; or in the decision to publish the results.

Abbreviations

The following abbreviations are used in this manuscript:
RF RMFRadiofrequency electromagnetic fields
5G5G is the fifth generation of cellular network technology
FR1Frequency Range 1, which is below 7.125 GHz, also called sub-6 GHz
FR2Frequency Range 2, typically in the range of 24–71 GHz, known as millimeter wave or high band
pRRHpico indoor remote radio head
CDCompliance distance (CD) is the minimum distance from the antenna at which the power density no longer exceeds the reference level limit

References

  1. 5G-ACIA. 5G for Industrial Internet of Things (IIoT): Capabilities, Features, and Potential. 5G Alliance for Connected Indus-tries and Automation 5G-ACIA White Paper 2021. Available online: https://5g-acia.org/whitepapers/5g-for-industrial-internet-of-things/ (accessed on 30 June 2025).
  2. ICNIRP. Guidelines for limiting exposure to electromagnetic fields (100 kHz to 300 GHz). Health Phys. 2020, 118, 483–524. [Google Scholar]
  3. IEC 62232; Determination of RF Field Strength, Power Density and SAR in the Vicinity of Radiocommunication Base Stations for the Purpose of Evaluating Human Exposure. International Electrotechnical Commission (IEC): Geneva, Switzerland, 2022.
  4. Directive 2013/35/EU on the Minimum Health and Safety Requirements Regarding the Exposure of Workers to the Risks Arising from Physical Agents (Electromagnetic Fields) Directive 2013/35/EU of 26 June 2013. OJ EU L 179. 2013. Available online: https://eur-lex.europa.eu/eli/dir/2013/35/oj/eng (accessed on 29 June 2025).
  5. Gajšek, P.; Apostolidis, C.; Plets, D.; Samaras, T.; Valič, B. EMF Exposure of Workers Due to 5G Private Networks in Smart Industries. Electronics 2025, 14, 2662. [Google Scholar] [CrossRef]
  6. Gontier, Q.; Wiame, C.; Wiart, J.; Horlin, F.; Tsigros, C.; Oestges, C. On the Uplink and Downlink EMF Exposure and Coverage in Dense Cellular Networks: A Stochastic Geometry Approach. IEEE Trans. Veh. Technol. 2025, 74, 12966–12980. [Google Scholar] [CrossRef]
  7. Celaya-Echarri, M.; Azpilicueta, L.; Ramos, V.; Lopez Iturri, P.; Falcone, F. Empirical and Modeling Approach for Environmental Indoor RF-EMF Assessment in Complex High-Node Density Scenarios: Public Shopping Malls Case Study. IEEE Access 2021, 9, 46755. [Google Scholar] [CrossRef]
  8. Rybakowski, M.; Bechta, K.; Grangeat, C.; Kabacik, P. Impact of Beamforming Algorithms on the Actual RF EMF Exposure from Massive MIMO Base Stations. IEEE Access 2023, 11, 141956–141964. [Google Scholar] [CrossRef]
  9. Xu, B.; Anguiano Sanjurjo, D.; Colombi, D.; Törnevik, C. A Monte Carlo Analysis of Actual Maximum Exposure from a 5G Millimeter-Wave Base Station Antenna for EMF Compliance Assessments. Front. Public Health 2022, 9, 777759. [Google Scholar] [CrossRef] [PubMed]
Figure 1. Process of site analysis. Yellow field is the beginning of the site analysis, and blue fields are results of the analysis. The symbol (…) denotes further parameters not detailed in the text.
Telecom 07 00063 g001
Figure 2. Example of compliance boundaries. (Top): 3D iso-surface CD. (Bottom left to right): The maximum CD for the vertical plane and for the horizontal plane. The blue line shows CD, whereas the red line represents a box-shaped CD.
Telecom 07 00063 g002
Figure 3. Results for raster measurements at a height of 1.5 m. Blue label RH indicates antenna position.
Telecom 07 00063 g003
Figure 4. Logistic sector (port)—5G base station under test.
Telecom 07 00063 g004
Figure 5. Locations of raster measurements. Blue label RH indicates antenna position. Dimensions are given in m.
Telecom 07 00063 g005
Figure 6. Locations of raster measurements. Black blocks represent the walls, dark gray the rows of pallet racks and light gray the offices. Blue label RH indicates locations of the pRRHs. Dimensions are given in m.
Telecom 07 00063 g006
Figure 7. Locations of raster measurements. Black blocks represent the walls, dark gray the production areas with different equipment, light gray the offices and the cross pattern the balcony. Blue text RH indicates locations of the pRRHs. Dimensions are given in m.
Telecom 07 00063 g007
Figure 8. Results for detailed measurements under the pRRH mounted at a height of 3.1 m. Measurements were done at 5 different heights below the pRRH.
Telecom 07 00063 g008
Figure 9. Locations of raster measurements. Blue label RH indicates location of the antenna. Dimensions are given in m.
Telecom 07 00063 g009
Figure 10. (Left): Picture of the metal racks in the pallet warehouse. (Right): The spectrum analyzer (SA) setup consisting of the NARDA SRM-3006 and tri-axial probe, the smartphone on the trolley, and the 5G access point installed close to the roof of the pallet warehouse.
Telecom 07 00063 g010
Figure 11. Measured averaged RMS E-field between 3.7 GHz and 3.8 GHz for the “FTP 10 GB download” scenario in the pallet warehouse, plotted on the ground plan of the pallet warehouse. The locations of the access points are indicated by the label “Loc” followed by a number. The RMS E-field values are represented as circles with color and radius scaled according to the field value.
Telecom 07 00063 g011
Figure 12. Temporal measurements of the whole 5G bandwidth in use under 50 m from the antenna in the direction of the main beam for scenario 2: Logistic sector: port, public slice 5G FR1 macro cell. Besides the actual value, 6 and 30 min average values are also presented.
Telecom 07 00063 g012
Figure 13. Temporal measurements of the whole 5G bandwidth for scenario 6: Office, production site, private 5G FR1 pico cell. Besides the actual value, 6 min average values are also presented.
Telecom 07 00063 g013
Table 1. Overview of 8 analyzed scenarios in Slovenia, Germany and Belgium.
ScenarioSectorBeamformingInstallation Typef
(GHz)
Antenna ModelInput Power (W)
1: Logistic sector: port, private 5G FR1 micro celllogistics, portNOprivate3.5Alpha Wireless AW3232 (Alpha Wireless, Portlaoise, Ireland)4
2: Logistic sector: port, public slice 5G FR1 macro celllogistics, portYESpublic slice3.5Ericsson AIR 3227 (Ericsson, Stockholm, Sweeden)100
3: Smart IOT solutions: warehouse, private 5G FR1 pico cellsmart Industry 4.0NOprivate3.6Nokia AirScale Pico (Nokia, Espoo, Finland)1
4: Smart IOT solutions: production site, private 5G FR1 pico cellsmart Industry 4.0NOprivate3.6Nokia AirScale Pico (Nokia, Espoo, Finland)1
5: Office, test facility of wireless networks, private 5G FR1 micro cellofficeNOprivate3.5Ericsson 6524 (Ericsson, Stockholm, Sweeden)16
6: Office, production site, private 5G FR1 pico cellofficeNOprivate3.45Huawei PRRU 5961 (Huawei, Shenzhen, China)0.63
7: Research facility, private 5G FR2 micro celllab scenarioYESprivate26Nokia AWEUC (Nokia, Espoo, Finland)1
8: Smart Industry 4.0: pallet warehouse, private 5G FR1 pico celllogistics, warehouseYESprivate285G NR 4 × 41
Table 2. Compliance distances across simulation scenarios for general public and occupational exposure.
ScenarioGeneral Public Exposure
Slim = 10 W/m2
Occupational Exposure
Slim = 50 W/m2
Vertical Compliance Distance (m)Horizontal Compliance Distance (m)Vertical Compliance Distance (m)Horizontal Compliance Distance (m)
1: Logistic sector: port, private 5G FR1 micro cell0.170.890.070.40
2: Logistic sector: port, public slice 5G FR1 macro cell2.4313.271.095.94
3: Smart IOT solutions: warehouse, private 5G FR1 pico cell0.090.090.040.04
4: Smart IOT solutions: production site, private 5G FR1 pico cell0.090.090.040.04
5: Office, test facility of wireless networks, private 5G FR1 micro cell and 6: Office, production site, private 5G FR1 pico cell0.391.270.170.57
7: Research facility, private 5G FR2 micro cell0.381.400.170.62
8: Smart Industry 4.0: pallet warehouse, private 5G FR1 pico cell0.120.600.050.27
Table 3. Results for line measurements for scenario 1: Logistic sector: port, private 5G FR1 micro cell. Measurements were done in the direction of the main beam of the antenna, in directions 45° from the main beam of the antenna and perpendicular (90°) to the main beam.
Distance (m)Emain beam (V/m)E45° from main beam (V/m)E90° from main beam (V/m)
0.275.6963.3037.62
0.550.6458.3026.09
134.2836.5519.78
213.9510.6111.15
Table 4. Results for line measurements for scenario 5: Office, test facility of wireless networks, private 5G FR1 micro cell. Measurements were done in the direction of the main beam of the antenna and in directions 45° from the main beam of the antenna.
Distance (m)Emain beam under load (V/m)Emain beam extrapolated (V/m)E45° from main beam under load (V/m)E45° from main beam extrapolated (V/m)
0.2242.56250.60121.5384.38
0.583.65107.7060.3676.04
145.7950.4732.9323.85
225.4732.0423.3816.13
Table 5. Results for line measurements for scenario 6: Office, production site, private 5G FR1 pico cell in three directions with the origin in the pRRH: at the height of the antenna (3 m), directed 45° downwards and in the vertical direction.
Distance (m)Emain beam (V/m)E45° from main beam (V/m)Evertical (V/m)
0.28.839.7818.11
0.54.804.866.99
12.252.904.24
21.041.562.13
Table 6. Results for line measurements for scenario 7: Research facility, private 5G FR2 micro cell in three lines, 10° downwards from the antenna, which is the antenna downtilt.
Distance (m)Height (m)Emain beam (V/m)E45° from main beam (V/m)E90° from main beam (V/m)
1.01.3223.619.331.45
2.01.1511.2710.260.98
Table 7. Results of raster measurements at a height of 1.5 m for private network in port.
Type of ResultE (V/m)
maximum value25.21
95th percentile21.97
median value2.28
standard deviation16.02
Table 8. Results of raster measurements at a height of 1.5 m for public slice in port.
Measurement LocationE (V/m)Measurement LocationE (V/m)
12.0671.40
23.5686.19
313.30917.55
424.221012.17
56.061110.01
613.621214.86
maximum value24.22
95th percentile20.82
median value11.14
standard deviation12.98
Table 9. Results of raster measurements in warehouse.
Measurement LocationE (V/m)Measurement LocationE (V/m)Measurement LocationE (V/m)
10.59150.40290.17
20.38161.41300.38
30.43170.75310.71
40.74180.42320.63
50.34190.25330.33
60.27201.25340.22
70.25210.87350.77
80.47220.56360.64
90.13230.23370.31
101.00240.28380.16
110.51250.52390.12
120.18260.42400.08
130.25270.49
140.18280.18
maximum value1.41
95th percentile1.01
median value0.39
standard deviation0.64
Table 10. Results of raster measurements in production site.
Measurement LocationE (V/m)Measurement LocationE (V/m)
10.49191.02
20.79200.62
30.73210.65
40.68220.58
50.83230.70
60.52241.28
71.14250.91
80.85260.61
91.17270.35
100.52280.38
110.51290.45
120.52301.20
131.11311.09
140.61322.11
150.95330.89
160.63340.42
170.51350.36
181.01360.50
maximum value2.11
95th percentile1.22
median value0.66
standard deviation0.88
Table 11. Results of raster measurements for selective and for measurements under load.
Measurement LocationEselective (V/m)Eload (V/m)
111.639.38
29.247.30
33.727.84
47.684.64
55.057.28
68.316.71
73.073.22
84.784.72
94.984.88
maximum value11.639.38
95th percentile10.748.79
median value5.056.71
standard deviation6.464.97
Table 12. Mean and maximum RMS E-field measured in the frequency band 3.7–3.8 GHz at nine locations in the pallet warehouse for “Idle” (background) and “FTP 10 GB download” scenarios.
Measurement LocationEidle AVG (V/m)Eidle MAX (V/m)EFTP DL 10GB AVG (V/m)EFTP DL 10GB MAX (V/m)
10.130.760.341.16
20.130.740.240.92
30.140.650.341.10
40.140.780.361.29
50.130.510.240.77
60.141.00//
70.140.850.361.24
80.140.820.361.28
90.140.950.411.56
maximum value0.141.000.411.56
95th percentile0.140.980.391.47
median value0.130.740.321.05
standard deviation0.030.480.190.75
Table 13. Results of spatial variability measurements.
MeasurementE (V/m)
Scenario 2: Logistic Sector: Port, Public Slice 5G FR1 Macro CellScenario 5: Office, Test Facility of Wireless Networks, Private 5G FR1 Micro CellScenario 7: Research Facility, Private 5G FR2 Micro Cell
one point33.109.3548.25
3-point average35.0612.7130.23
9-point average32.2712.0328.82
27-point average33.9811.1329.55
9-point average 1.1 m36.4211.5012.06
9-point average 1.5 m32.8110.3947.50
9-point average 1.7 m32.5711.4714.73
Table 14. Results of time variability measurements.
MeasurementE (V/m)
Scenario 1: Logistic Sector: Port, Private 5G FR1 Micro CellScenario 2: Logistic Sector: Port, Public Slice 5G FR1 Macro CellScenario 6: Office, Production Site, Private 5G FR1 Pico CellScenario 7: Research Facility, Private 5G FR2 Micro Cell
max value4.785.012.5520.95
6 min average1.160.481.171.10
30 min average 0.39
ratio max value/6 min average4.110.42.219.0
Table 15. Overview of results of all raster measurements.
Scenario\Type of ResultE (V/m)
Maximum
Value
95th
Percentile
Median
Value
Standard
Deviation
1: Logistic sector: port, private 5G FR1 micro cell25.2121.972.2816.02
2: Logistic sector: port, public slice 5G FR1 macro cell24.2220.8211.1412.98
3: Smart IOT solutions: warehouse, private 5G FR1 pico cell1.411.010.390.64
4: Smart IOT solutions: production site, private 5G FR1 pico cell2.111.220.660.88
5: Office, test facility of wireless networks, private 5G FR1 micro cell11.6310.745.056.46
6: Office, production site, private 5G FR1 pico cell4.644.071.052.90
7: Research facility, private 5G FR2 micro cell59.6548.4411.6933.73
8: Smart Industry 4.0: pallet warehouse, private 5G FR1 pico cell1.561.471.200.75
Disclaimer/Publisher’s Note: The statements, opinions and data contained in all publications are solely those of the individual author(s) and contributor(s) and not of MDPI and/or the editor(s). MDPI and/or the editor(s) disclaim responsibility for any injury to people or property resulting from any ideas, methods, instructions or products referred to in the content.