Article

Utilization-Driven Performance Enhancement in Storage Area Networks

1
Department of Electrical and Computer Engineering, University of Massachusetts, Dartmouth, MA 02747, USA
2
Chair of Risk and Resilience of Complex Systems, Laboratoire de Genie Industriel (LGI), CentraleSupélec, Paris-Saclay University, 91190 Gif-sur-Yvette, France
*
Author to whom correspondence should be addressed.
Telecom 2025, 6(4), 77; https://doi.org/10.3390/telecom6040077 (registering DOI)
Submission received: 24 August 2025 / Revised: 26 September 2025 / Accepted: 30 September 2025 / Published: 11 October 2025

Abstract

Efficient resource utilization and low response times are critical challenges in storage area network (SAN) systems, especially as data-intensive applications like those driven by the Internet of Things and Artificial Intelligence place increasing demands on reliable, high-performance data storage solutions. Addressing these challenges, this paper contributes by proposing a proactive, utilization-driven traffic redistribution strategy to achieve balanced load distribution across switches, thereby improving the overall SAN performance and alleviating the risk of overload-incurred cascading failures. The proposed approach incorporates a Jackson Queueing Network-based method to evaluate both utilization and response time of individual switches, as well as the overall system response time. Based on a comprehensive case study of a mesh SAN system, two key parameters—the transition probability adjustment step size and the node selection window size—are analyzed for their impact on the effectiveness of the proposed strategy, revealing several valuable insights into fine-tuning traffic redistribution parameters.

1. Introduction

Modern data-intensive applications such as those driven by the Internet of Things and Artificial Intelligence place growing demands on high-performance data storage solutions [1]. These applications abound in mission-critical domains such as autonomous driving, real-time financial trading, industrial automation, and healthcare monitoring, all of which require scalable and reliable storage backends capable of handling large volumes of data with low latency. To meet these demands, enterprises such as NetApp, Tintri, and IBM have adopted storage area networks (SANs) as a foundational component of their data center infrastructure [2]. SANs enable high-speed, any-to-any connectivity between servers and storage devices within a dedicated network, offering benefits such as high throughput and concurrent data access [3,4,5]. These characteristics make SANs particularly suitable for enterprise environments where performance and reliability are essential.
A significant threat to the reliable operation of SANs is node overloading, potentially triggering a chain reaction that crashes the entire system, referred to as cascading failures [6,7,8,9]. Specifically, when a SAN device is overloaded and operating at a high utilization rate while others remain underutilized, this imbalance in load and utilization across devices increases the risk of failure in the bottleneck node. If a node fails, its entire load is redistributed to other nodes, potentially causing overloads on those nodes in a domino effect, which ultimately leads to a system-wide outage. To effectively prevent cascading failures, it is pivotal to proactively redistribute the load of highly utilized nodes before they reach certain critical levels. By doing this early, the risk of overloading any single node could be mitigated, helping to maintain load balancing across nodes and prevent cascading failures that lead to widespread system malfunction.
Therefore, in this paper we make unique contributions by proposing a proactive, utilization-driven load/traffic redistribution strategy to enhance the performance of SAN systems. Through monitoring the utilization levels of nodes and redistributing traffic before a pre-specified critical threshold is reached, our strategy aims to prevent node overloading and ensure a more balanced load distribution across the SAN, thereby alleviating the risk of cascading failures.
Cascading failures have been studied using simulations, self-organized critical models, and complex network models mainly in the power system domain [10,11]. Their effects on system reliability have been examined via topological approaches, combinatorial approaches, state-based approaches, and simulations [9]. Various mitigation strategies were proposed [12], including but not limited to those based on source detection [13], vulnerable node identification [14], topological dependence [15], interdependencies [16], system operating characteristics [17], resource allocation [18], redundant capacity [19], resilience assessment [20], and dynamic healing mechanism [21]. Recently, there are several attempts to mitigate cascading failures for SAN systems from the perspective of reliability, including load redistribution triggered by SAN reliability [22] and by individual switch workload [23]. To the best of our knowledge, no systematic study has been conducted to address the mitigation of overload-incurred cascading failures from a performance enhancement perspective like this work.
To verify the effectiveness of the proposed strategy, we make further contributions by conducting performance modeling and analysis of SAN systems. A Jackson Queueing Network (JQN)-based method is adapted for assessing the utilization and response time of individual switches, and the overall system response time. A detailed case study of a mesh SAN system is conducted. The impact of two key parameters in the proposed strategy (the transition probability adjustment step size and the node selection window size) is also examined.
The rest of the paper is structured as follows: Section 2 introduces the JQN model used for performance analysis of SAN. Section 3 describes the proposed utilization-driven performance enhancement strategy. Section 4 presents an example of a mesh SAN. Using the example SAN system, Section 5 examines the effects of key parameters on the effectiveness of the proposed strategy. Section 6 gives the conclusion and highlights several future research directions.

2. Jackson Queuing Network-Based Performance Evaluation

Jackson queueing networks (JQNs) have been applied to the performance analysis of diverse systems. For example, the vehicle waiting time of a road network was modeled using a JQN model for implementing an autonomous and intelligent traffic management system [24]. An open JQN was applied to optimize the average latency of all service function chains in an edge-core network efficiently [25]. An iterative algorithm was investigated to analyze the age of information of a JQN with finite buffer size in various settings [26]. A general quantum JQN was proposed to analyze the optimal pumping rates and routing probabilities of repeater-assisted and repeater-less quantum networks [27]. However, to the best of our knowledge, JQN has not been applied to model the performance of a SAN system. In this work, we first apply the JQN to assess the utilization and response time of SAN systems subject to the utilization-driven dynamic load redistributions for performance enhancement. Below we describe the fundamentals of JQN; readers may refer to [28,29] for more details.
A JQN is a queueing network with K nodes satisfying the following three conditions [29]:
1.
Each node k (k = 1, 2, …, K) consists of ck identical servers with service time following the exponential distribution characterized by a constant service rate μk.
2.
Customers from outside the system arrive at node k following a Poisson process with arrival rate λk.
3.
Once served at node k, a customer goes to node j (j = 1, 2, …, K) with probability Pkj; or leaves the network with probability 1 j = 1 K P k j . Thus, the average arrival rate to each node k, denoted by Λk, can be evaluated as
Λ k = λ k + j = 1 K Λ j P j k
Equation (1) is known as a traffic equation, implying that the average arrival rate Λk of each node k includes both external customer arrivals λk and arrivals from other nodes within the network. Λk can be obtained by solving the traffic equations for all the nodes in the JQN.
The utilization of a node represents an average fraction of the time that each node is busy assuming that the traffic is evenly distributed to each node. For a node k with ck identical servers, service rate μk and average arrival rate Λk, its utilization (denoted by ρ k ) is formulated as [28].
ρ k = Λ k c k μ k
Let π (n1, n2, …, nK) denote the joint steady state probability that there are n k customers in node k for k = 1, 2, …, K. Let p k n k be the steady state probability that there are n k customers in node k, which can be derived by modeling each node as an independent M/M/ck queueing system with average arrival rate Λk. With π k n k derived, we can obtain π n 1 ,   n 2 ,   ,   n K as π 1 n 1 π 2 n 2 π K n K based on Jackson’s Theorem [28].
In the context of the SAN, each node can be modeled as an M/M/1 queue system (i.e., ck = 1) with π k n k =     ρ k n k 1 ρ k [28]. The average response time at node k with average service time being 1 μ k is
W k = 1 μ k 1 ρ k
According to Little’s Law, the average number of jobs in node k is
L k = Λ k W k
Further, based on Little’s Law, the overall mean response time of the entire JQN is the total average number of jobs in all nodes of the network divided by the total external arrival rates, formulated as
W = 1 k = 1 K λ k   i = 1 K L i

3. Utilization-Driven Performance Enhancement Strategy

We explore a utilization-driven traffic/load redistribution strategy to enhance the performance of SAN systems. Specifically, when a switch’s utilization reaches a pre-defined initial threshold ρ* (i.e., the switch gets too busy), we strategically reallocate the traffic by adjusting the transition probabilities for a set of vulnerable nodes selected based on rules detailed in the following subsections. As the utilization of 0.8 is commonly regarded as the limit of acceptable performance, in this study, we adopt this value as the threshold, i.e., ρ* = 0.8. The same threshold ρ* is used for triggering traffic redistribution during the entire mission.

3.1. Node Selection Rule

When the utilization of any node (e.g., switch in SAN) reaches ρ*, this node together with other nodes within the selection window w are chosen for traffic redistribution by adjusting their transition probabilities. Specifically, all nodes with utilization falling within the range [ρ* − w, ρ*] are selected. For example, if ρ* = 0.8 and the selection window size is w = 0.1, then all nodes with utilization between 0.7 and 0.8 are chosen for transition probability adjustment according to the ascending order of their utilization values, as detailed in Section 3.2. Note that only switches in the SAN participate in the transition probability adjustment or can be selected.

3.2. Transition Probability Adjustment Strategy

Assume node j’s utilization reaches the threshold ρ*. Equation (6) is applied to adjust the transition probabilities of nodes falling in the adjustment window, as discussed in Section 3.1. Let Aj represent the set of nodes selected for adjustment triggered by node j’s utilization. Specifically, for node k   A j , let N k denote the set of neighboring nodes for node k. For any node i  N k , their transition probabilities to node k, i.e., P i k are adjusted according to (6), where s represents the step value of the adjustment.
P i k = P i k s
To make sure r N i P i r = 1, we need to adjust the transition probabilities from node i to all other neighboring nodes other than node k. Particularly, for any r N i and r k , P i r is adjusted according to (7).
P i r = P i r + s N i 1

4. Illustrative Example

Figure 1 illustrates an example of a mesh SAN used for evaluating the proposed performance enhancement strategy. There are two servers (Sr1 and Sr2) providing data request services (initiating read/write operations), and two storage arrays (Sa1 and Sa2) fulfilling these data requests over a dedicated high-speed network composed of switches. The five switches (Sw1, Sw2, Sw3, Sw4, Sw5) in the example SAN facilitate any-to-any communications between the servers and the storage arrays. Each switch has an exponential service time distribution with constant rate μk, k ∈ {Sw1, Sw2, Sw3, Sw4, Sw5} with values given in Table 1. Those rates are given based on technical specifications of products in the industry [30,31,32].

4.1. JQN Modeling

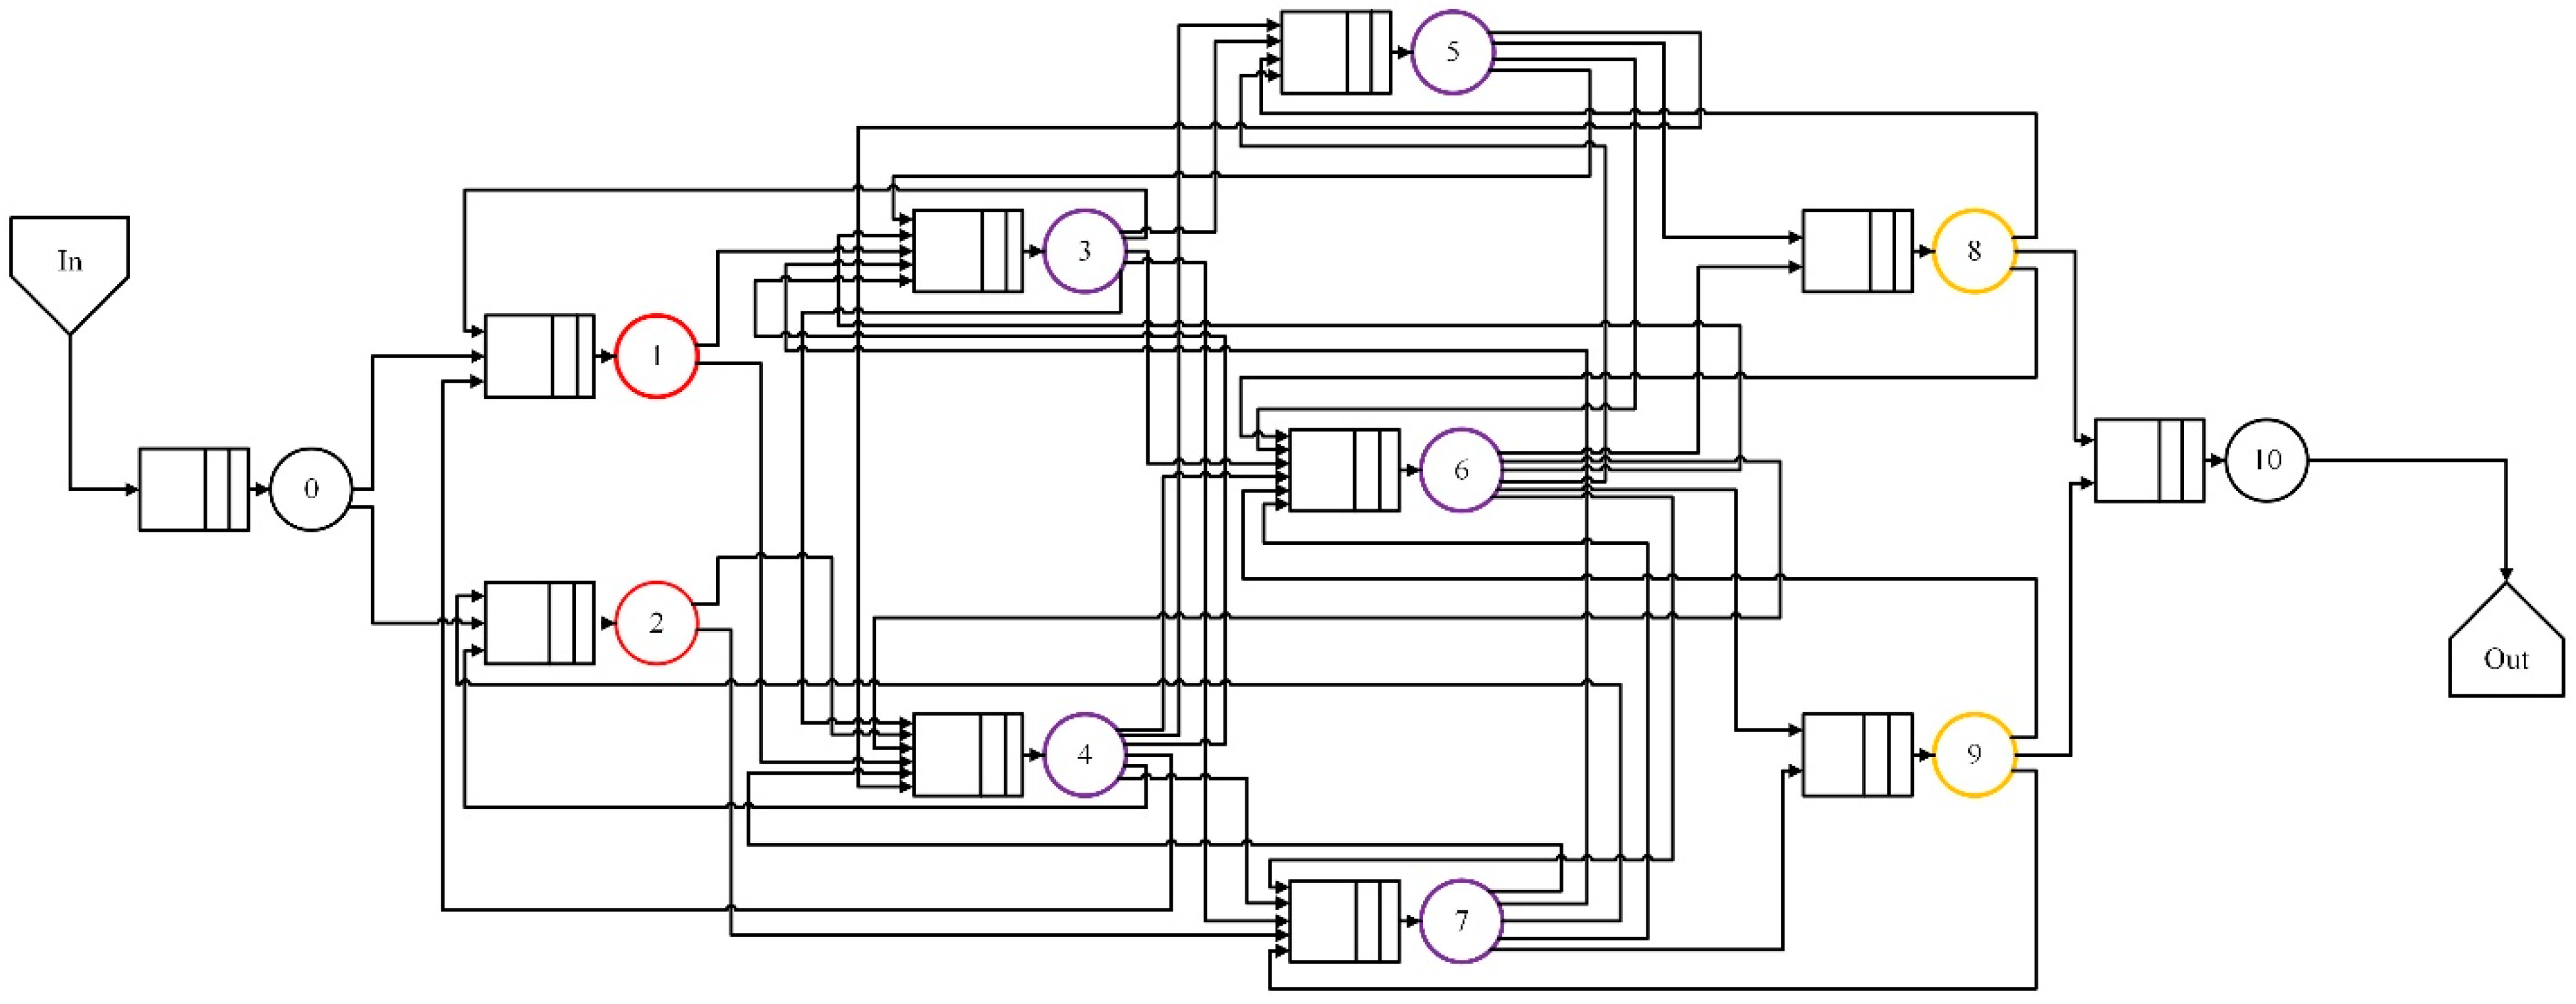
To evaluate the performance of the example SAN using the JQN, each SAN component is modeled using a node as shown in Figure 2, where Sr1 and Sr2 are modeled by nodes 1 and 2, respectively, Sa1 and Sa2 are modeled by nodes 8 and 9, respectively, the five switches are modeled by node 3 through node 7. The links that connect the SAN components (e.g., fiber optics) correspond to the edges that connect the nodes in the JQN. Moreover, for evaluating traffic equations, two dummy nodes are added. The dummy node 0 is connected to node 1 and node 2, while node 8 and node 9 are connected to the dummy node 10. In this work, only node 0 has a non-zero external arrival rate λ0, which is simplified as λ in the subsequent discussions.
The traffic equations for the eleven nodes of the JQN in Figure 2 are provided in (8).
Λ 0 = λ Λ 1 = Λ 0 P 0,1 + Λ 3 P 3,1 + Λ 4 P 4,1 Λ 2 = Λ 0 P 0,2 + Λ 4 P 4,2 + Λ 7 P 7,2 Λ 3 = Λ 1 P 1,3 + Λ 4 P 4,3 + Λ 5 P 5,3 + Λ 6 P 6,3 + Λ 7 P 7,3 Λ 4 = Λ 1 P 1,4 + Λ 2 P 2,4 + Λ 3 P 3,4 + Λ 5 P 5,4 + Λ 6 P 6,4 + Λ 7 P 7,4 Λ 5 = Λ 3 P 3,5 + Λ 4 P 4,5 + Λ 6 P 6,5 + Λ 8 P 8,5 Λ 6 = Λ 3 P 3,6 + Λ 4 P 4,6 + Λ 5 P 5,6 + Λ 7 P 7,6 + Λ 8 P 8,6 + Λ 9 P 9,6 Λ 7 = Λ 2 P 2,7 + Λ 3 P 3,7 + Λ 4 P 4,7 + Λ 6 P 6,7 + Λ 9 P 9,7 Λ 8 = Λ 5 P 5,8 + Λ 6 P 6,8 Λ 9 = Λ 6 P 6,9 + Λ 7 P 7,9 Λ 10 = Λ 8 P 8,10 + Λ 9 P 9,10
Solving those traffic equations, the average arrival rate to each node k, i.e., Λk for k = 0, 1, …, 10 can be obtained. In this work, we use MATLAB R2023b to solve the traffic equations.

4.2. Initialization of Transition Probabilities

Let M represent the total number of SAN servers. At the beginning, the transition probability from node 0 to each SAN server is calculated as 1 M . Later, each time the traffic redistribution condition is triggered, the transition probability from node 0 to server n, denoted as P 0 , n is updated using the following rule: Let ln denote the total number of paths through which server n is connected to the switch being adjusted, i.e., a node k   A j as discussed in Section 3.2. The transition probability P 0 , n is adjusted using (9).
P 0 , n = l n i = 1 M l i
In our case, since M = 2, the initial transition probabilities are P 0,1 = P 0,2 = 0.5 . When the first traffic redistribution takes place, according to the rules defined in Section 3.1, the switch being adjusted first is node 4 (i.e., Sw2). The total number of paths from servers 1 and 2 to the switch Sw2 are l1 = 11 and l2 = 12, respectively. Thus, according to (9), the two transition probabilities are updated as P 0,1 = 11 11 + 12 = 0.47526 and P 0,2 = 12 11 + 12 = 0.52174.
To determine the initial transition probabilities among other nodes (excluding node 0) in the SAN, the following rule is used. Let Nj denote the set of neighboring nodes for node j, N j denote the cardinality of Nj, and k represents a neighboring node of node j (i.e., k Nj). The initial value of P i k is determined using (10).
P i k = 1 N j

4.3. Problem Statement

The objective of this study is to evaluate the utilization and average response time of each node in the example SAN as well as the overall response time. Another objective is to show the impact of the proposed utilization-driven strategy in enhancing the SAN performance, particularly, in terms of load balancing degree among all the nodes and average response time. In addition, the influences of two important parameters (adjustment step value s and selection window size w) on the effectiveness of the proposed performance enhancement strategy are investigated.

5. Experiments and Results

To illustrate the performance of the proposed utilization-driven strategy and the sensitivity of parameters (i.e., s and w), we analyze the average (ρavg) and standard deviation (ρstd) of the utilization of all the switches in the example SAN provided in Section 4, the average (Wavg) and standard deviation (Wstd) of response time of all the switches, as well as the overall mean response time W of the SAN.
In Section 5.1, the impact of step value s is investigated using s = 0.01 (Case 1), s = 0.05 (Case 2), and s = 0.07 (Case 3) assuming w = 0.02. In Section 5.2, the impact of the selection window size w is examined using w = 0.02 (Case 3), w = 0.1 (Case 4), and w = 0.2 (Case 5) assuming s = 0.07.
As mentioned in Section 3, the threshold ρ* = 0.8 is used for triggering the traffic redistribution during the entire mission in all the analyses. Note that in the experiments, the traffic arrival rate λ increases in steps of 0.01. Redistribution is triggered when any switch’s utilization first exceeds the threshold ρ* = 0.8. Due to rounding, the value of λ is recorded as the last value before the threshold is crossed. For example, the utilization of a switch reaches 0.799946 at λ = 3.13 and exceeds the threshold (0.802) at λ = 3.14; thus, redistribution is triggered and implemented at λ = 3.13. All the metrics are evaluated using the JQN method described in Section 2 and switch service rate parameters in Table 1. The service rate of the servers (Sr1 and Sr2) and storage arrays (Sa1 and Sa2) used in the experiments is 16 Gb/s. Results are collected for three traffic redistributions applied to the example SAN system.

5.1. Effects of Adjustment Step Value s

Assuming w = 0.02, we conduct three experiments with different values of the transition probability adjustment step parameter s to study its impact on the effectiveness of the proposed utilization-driven performance enhancement strategy. Specifically, performance results under s = 0.01 (Case 1), s = 0.05 (Case 2), and s = 0.07 (Case 3) are collected and compared, as detailed below.

5.1.1. Case 1: w = 0.02 and s = 0.01

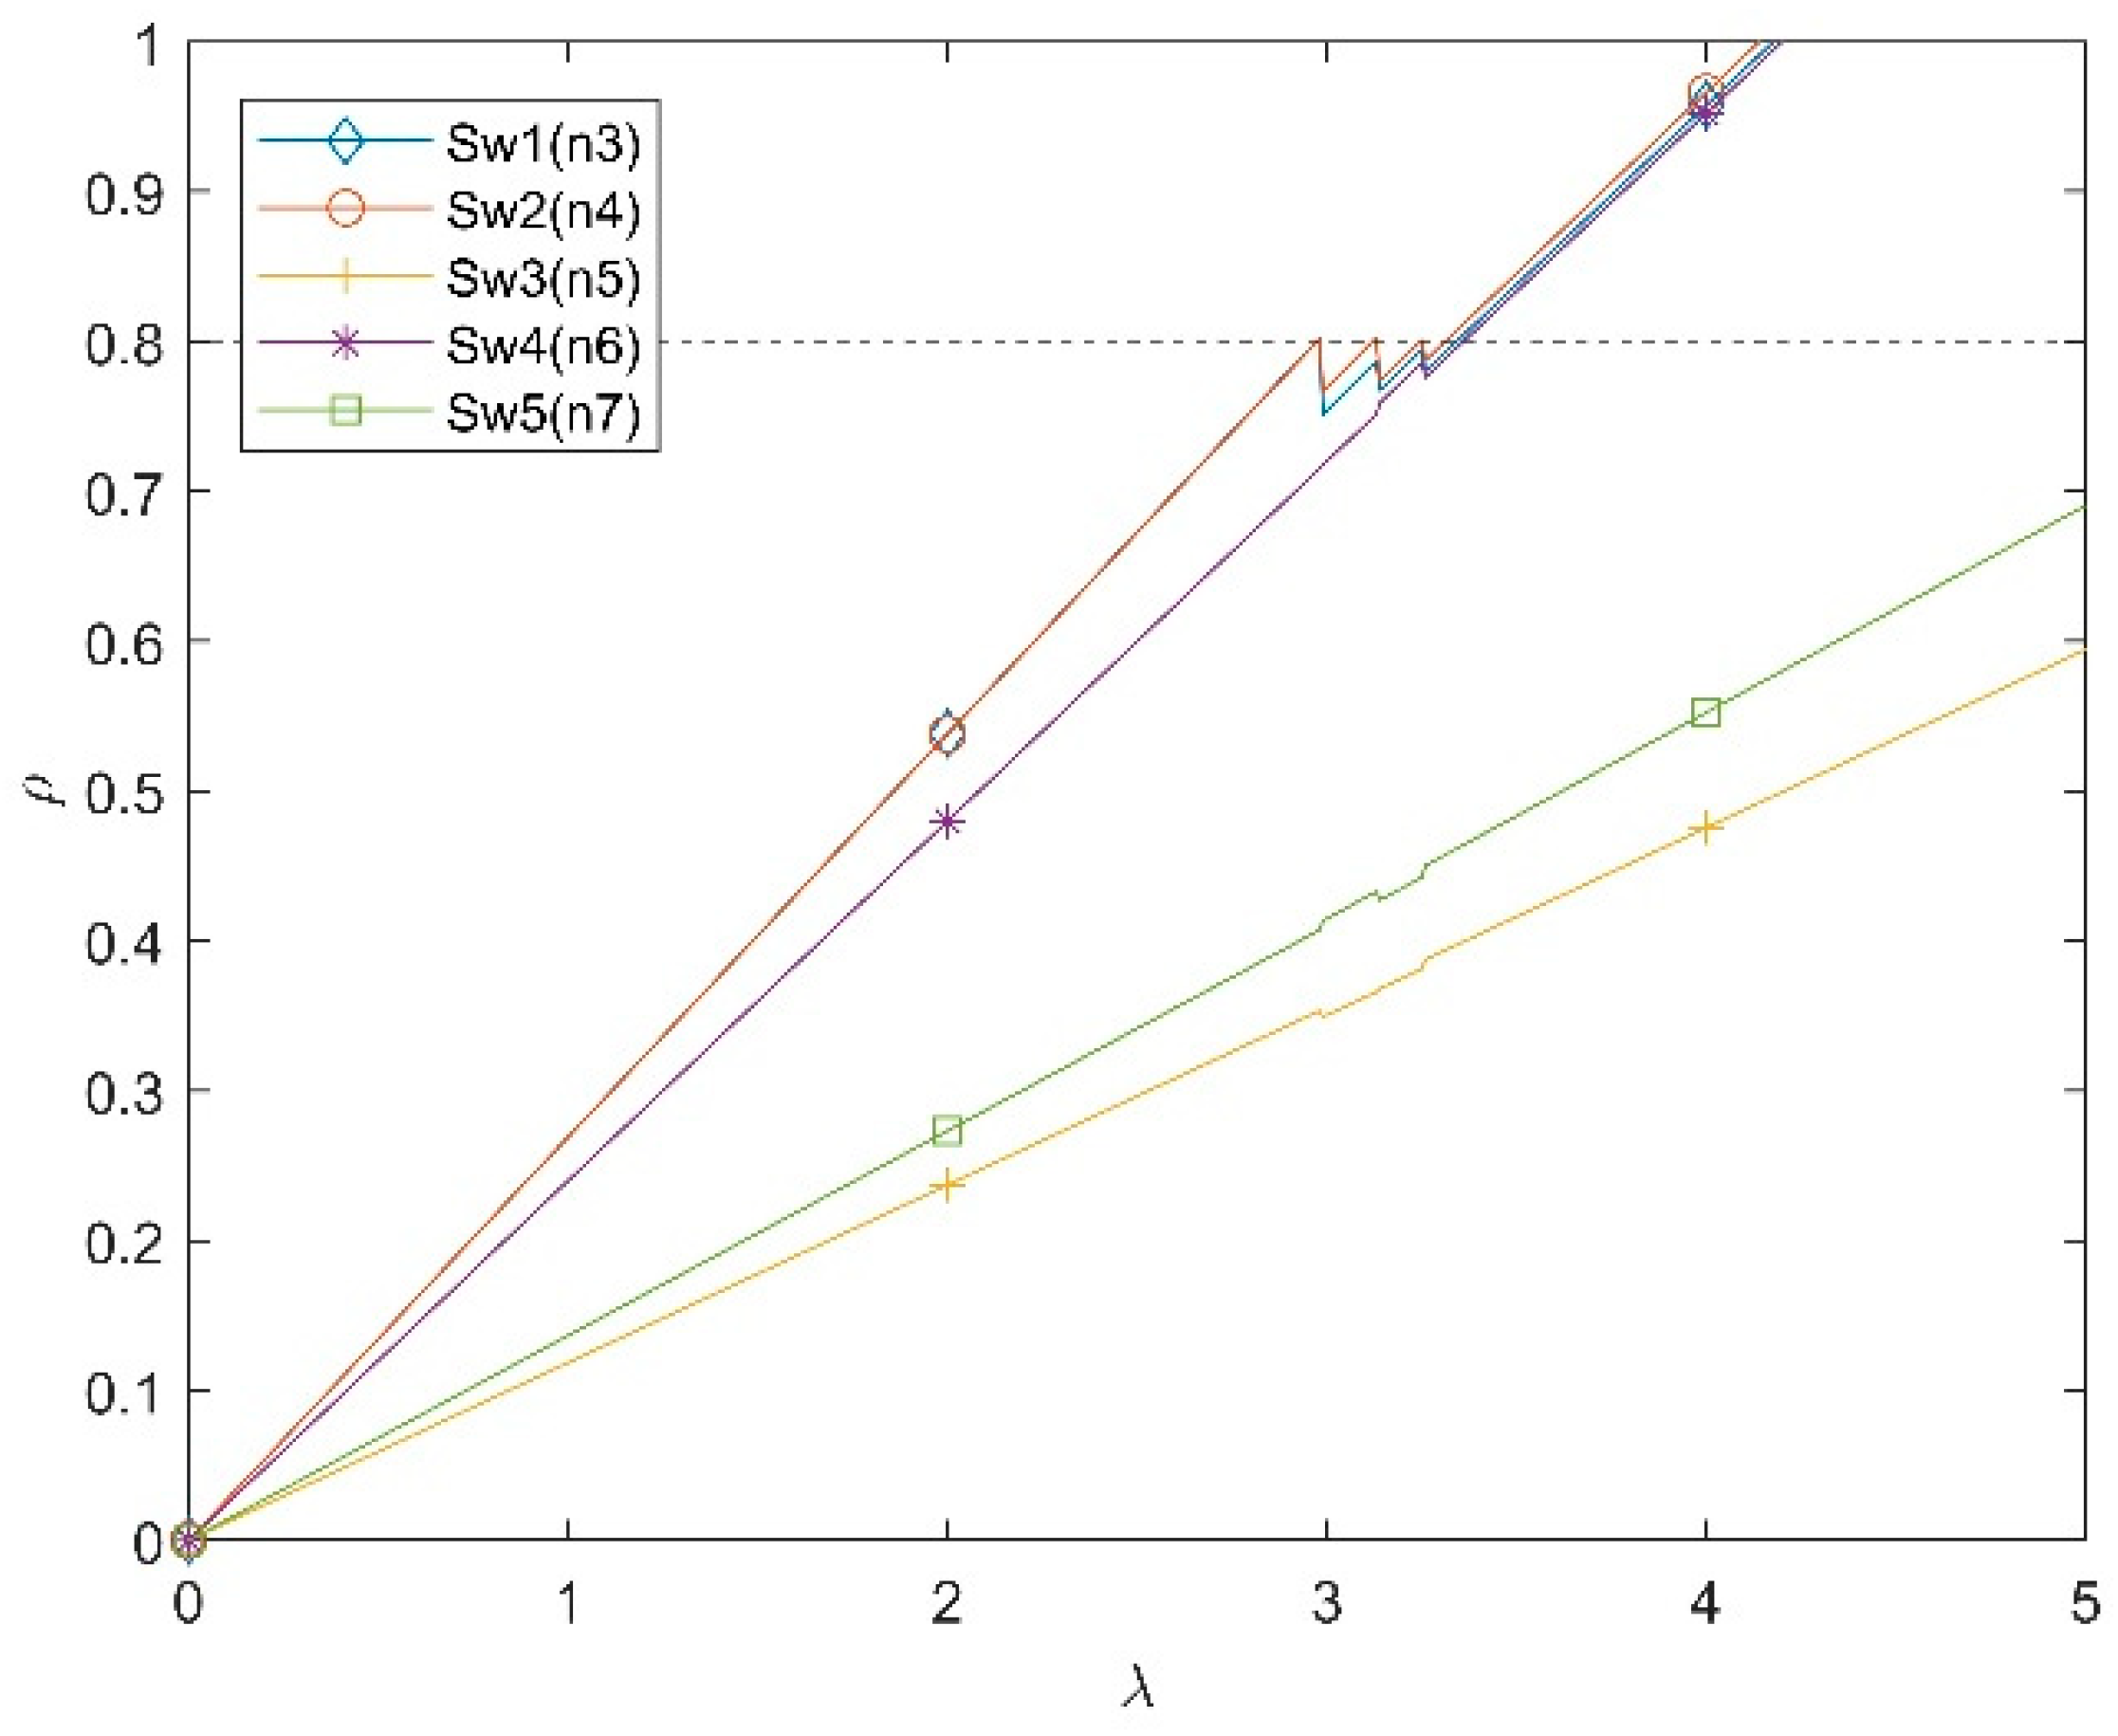
Figure 3 illustrates the utilization of each switch in the example SAN as the arrival rate to node 0 (i.e., λ) increases. Table 2 presents the utilization of each switch before and after each redistribution. During each redistribution, all nodes with utilization between 0.78 (ρ*-w) and 0.8 (ρ*) are chosen for transition probability adjustment. Specifically, in the first and second redistributions, Sw1 and Sw2 are selected; in the third redistribution, Sw1, Sw2, and Sw4 are selected (highlighted in Table 2 and Table 3). The first redistribution is triggered at λ = 2.98 when the utilization of Sw1 reaches the threshold ρ* = 0.8, the second redistribution is triggered at λ = 3.13 when the utilization of Sw2 reaches the threshold, and the third redistribution occurs at λ = 3.25 when the utilization of Sw2 reaches the threshold ρ* = 0.8. Table 2 also summarizes the values of ρavg and ρstd before and after each redistribution. Figure 4 illustrates the average response time W j of each switch Swj and the overall response time W as λ increases. Table 3 summarizes the average response time of each switch before and after each redistribution, as well as the values of Wavg and Wstd.
The decrease in ρstd and Wstd after each redistribution demonstrates that the proposed strategy can make the load of different switches more balanced. The decrease in Wavg (faster response times) and the overall response time W after each redistribution demonstrates the advantage of the proposed strategy in reducing the latency. By redistributing the load, the proposed strategy prevents certain switches from becoming overwhelmed while others are under-utilized. The adjustments help ensure a more uniform distribution of workload across the system, improving overall performance and utilization efficiency.

5.1.2. Case 2: w = 0.02 and s = 0.05

Similar to the analysis in Section 5.1.1, Figure 5 and Figure 6 illustrate the utilization and average response time of each switch in the example SAN as λ increases. Figure 6 also illustrates the overall response time W of the example SAN as λ increases. Table 4 presents the utilization of each switch as well as the values of ρavg and ρstd before and after each redistribution. Table 5 summarizes the average response time of each switch as well as the values of Wavg and Wstd before and after each redistribution.
During each redistribution, all nodes with utilization between ρ*-w = 0.78 and ρ* = 0.8 are chosen for transition probability adjustment. Specifically, in the first redistribution, Sw1 and Sw2 are selected; in the second and third redistributions, Sw4 is selected (highlighted in Table 4 and Table 5). The first redistribution is triggered at λ = 2.98 when the utilization of Sw1 reaches the threshold ρ*, the second redistribution is triggered at λ = 3.29 and the third redistribution occurs at λ = 3.50 when the utilization of Sw4 reaches the threshold ρ*.
Like Case 1, the decrease in ρstd following each redistribution indicates that the proposed strategy effectively balances the load across different switches. The decrease in Wavg and W following the first two redistributions demonstrates the strategy’s ability to reduce latency when the overall load remains low. However, the situation changes at the third redistribution when the external arrival rate λ reaches 3.5. At this point, ρavg, Wavg and W all increase due to the higher overall load, which causes each switch to become more heavily utilized. As the system becomes more saturated, each switch handles more traffic, causing increased contention for the resource and thus longer response times.

5.1.3. Case 3: w = 0.02 and s = 0.07

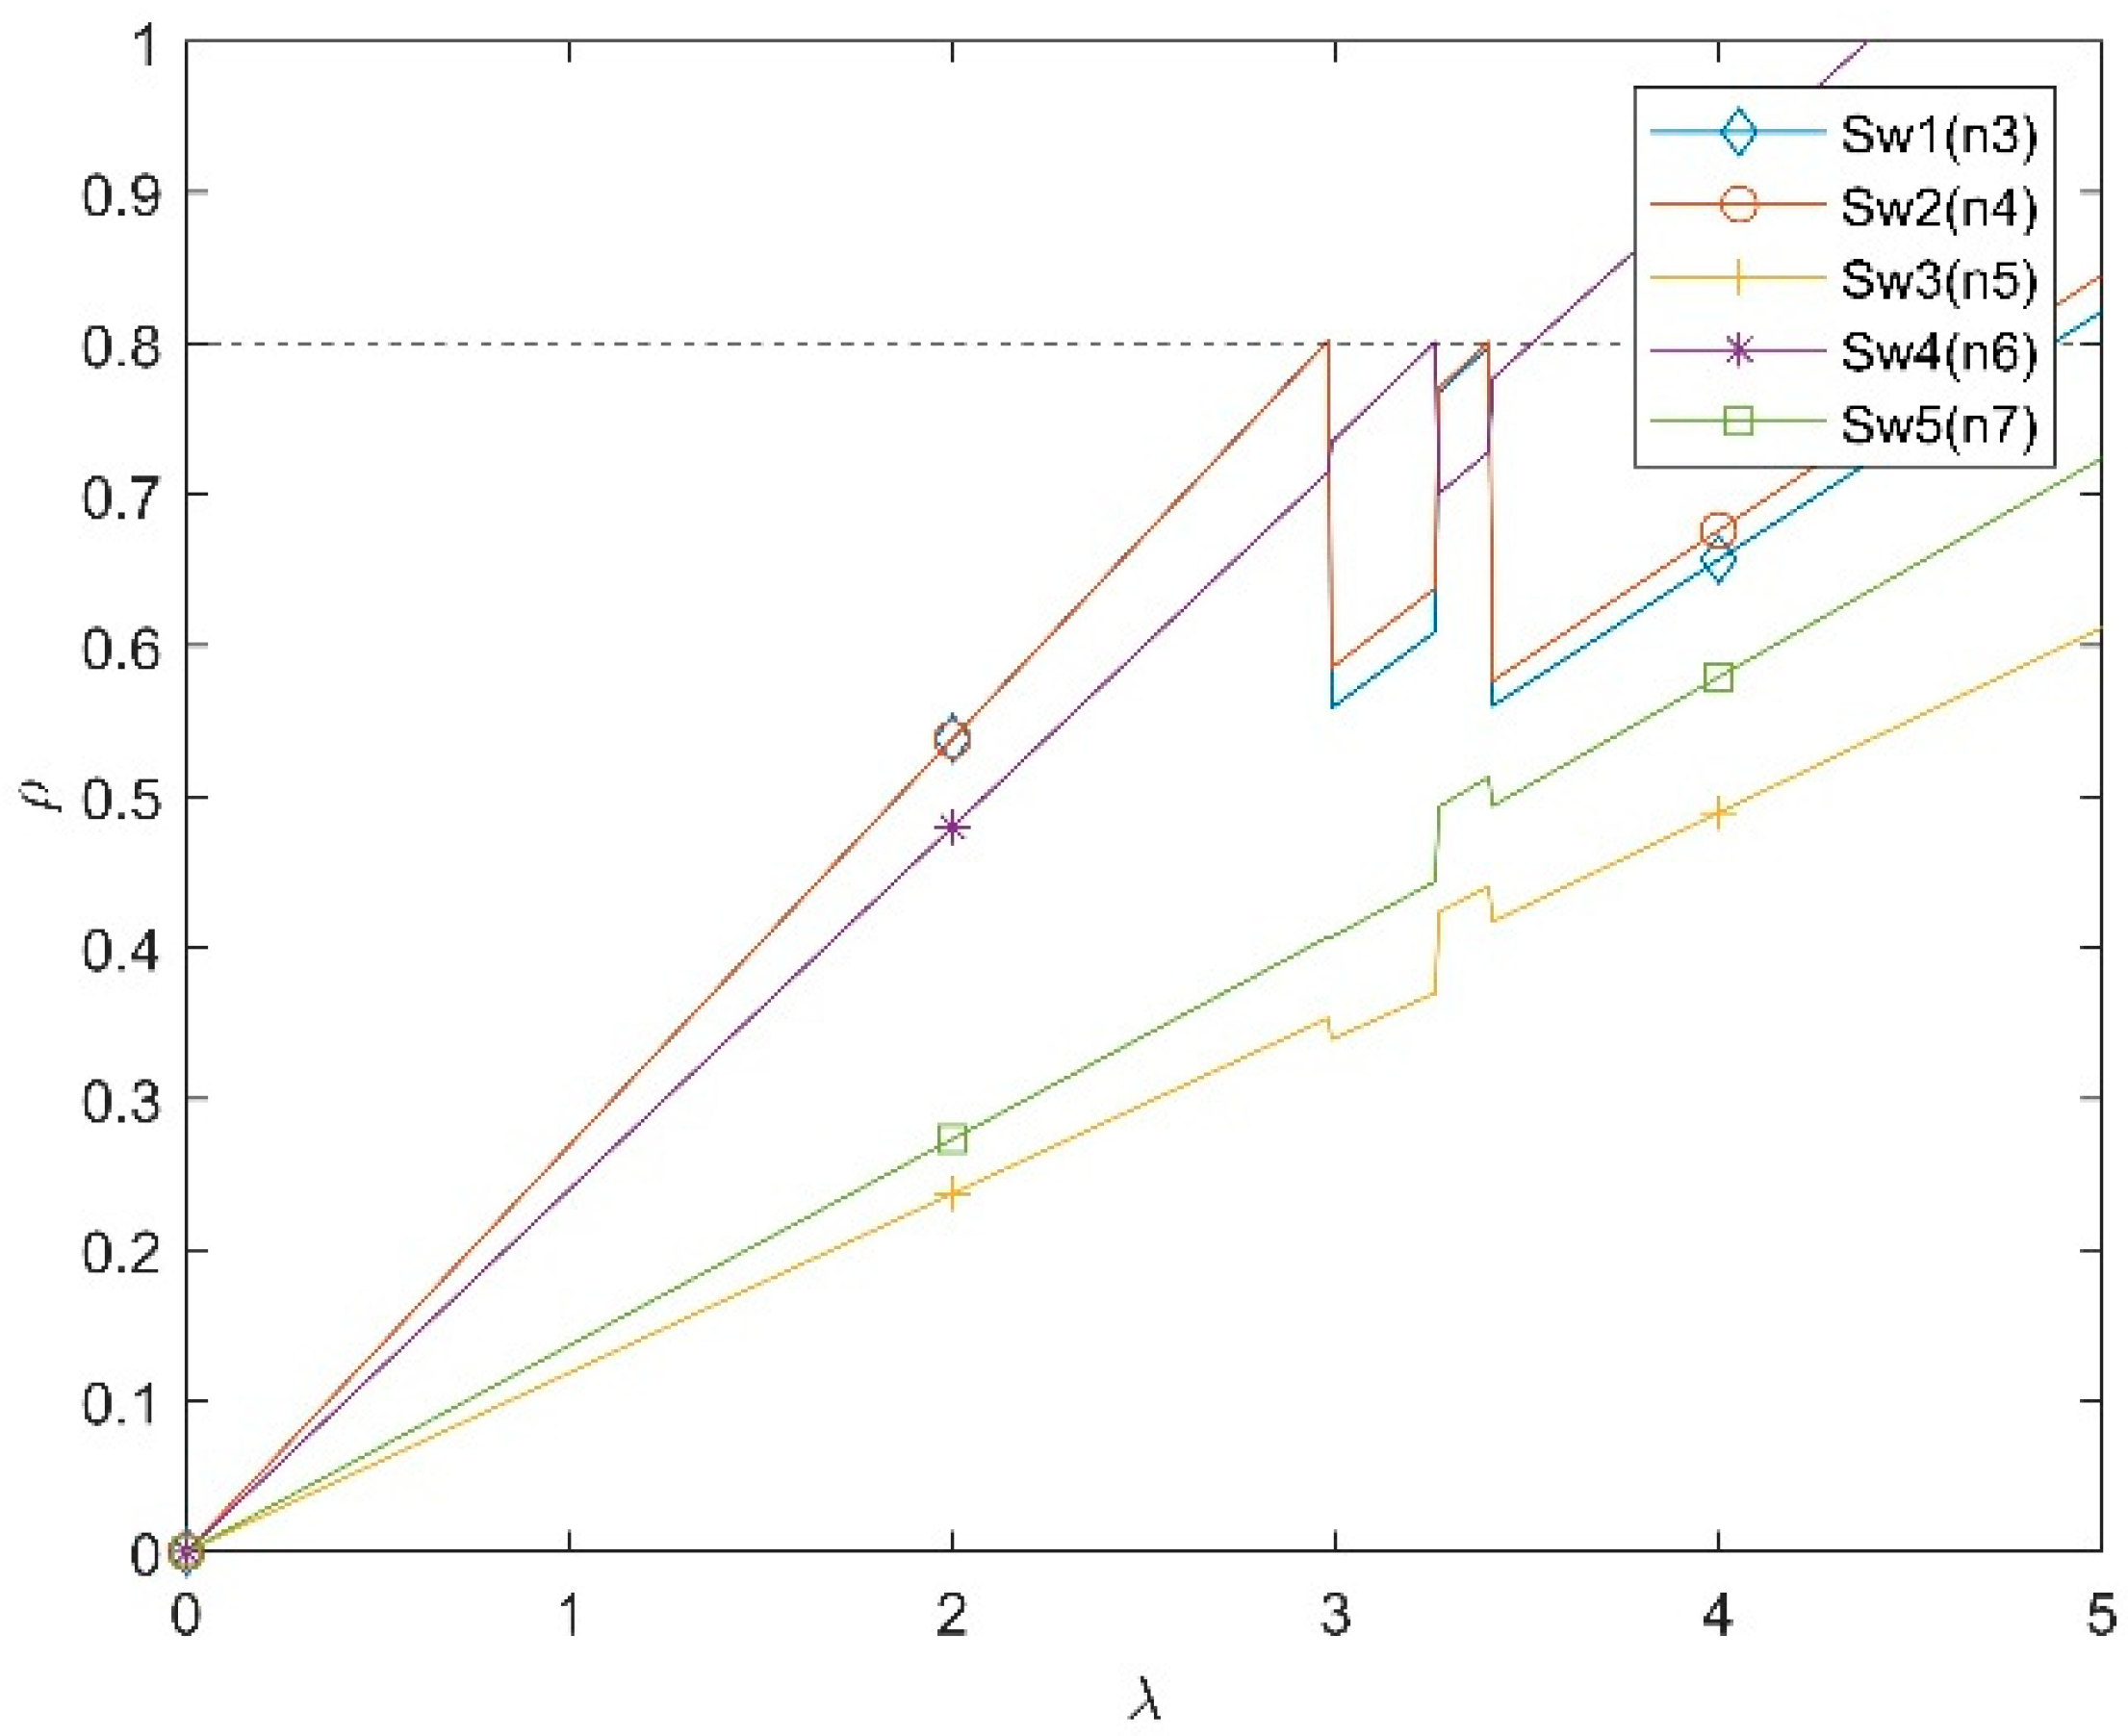
Similar to the previous analysis, Figure 7 and Figure 8 depict the utilization and average response time of each switch in the example SAN as the external arrival rate λ increases. Figure 8 also illustrates the overall response time W of the example SAN as λ increases. Table 6 presents the utilization of each switch as well as the values of ρavg and ρstd before and after each redistribution. Table 7 summarizes the average response time of each switch as well as the values of Wavg and Wstd before and after each redistribution.
In the first and third redistributions, Sw1 and Sw2 are selected; in the second redistribution, Sw4 is selected (highlighted in Table 6 and Table 7). The first redistribution is triggered at λ = 2.98 when the utilization of Sw1 reaches the threshold ρ* = 0.8, the second redistribution is triggered at λ = 3.26 when the utilization of Sw4 reaches the threshold ρ*, and the third redistribution occurs at λ = 3.40 when the utilization of Sw2 reaches the threshold ρ*.
Consistent with previous cases, the decrease in ρstd following each redistribution indicates that the proposed strategy effectively balances the load across different switches. The reduction in Wavg, Wstd and W following the first redistribution demonstrates the strategy’s effectiveness in reducing latency. However, at the second redistribution (λ = 3.26), an increase in ρavg correlates with rising values of Wavg, Wstd, and W implying that the switches become more heavily utilized since the first redistribution. As the external arrival rate λ increases further, the third redistribution becomes effective again in reducing Wavg, Wstd and W. This can be attributed to the fact that the redistribution process can effectively minimize bottlenecks, reducing traffic at heavily loaded switches. Moreover, as more redistributions are conducted, load is more evenly distributed, resulting in less fluctuation in utilization and response times.

5.1.4. Summary of Effects of Adjustment Step Value s

Table 8 summarizes the improvement ratio at each redistribution for ρstd, Wstd and W under different values of the transition probability adjustment step parameter s. The improvement ratio (IR) is defined in (11), where A and B denote the performance metric after and before the redistribution, respectively. The average IR (as shown in the last column of Table 8) is calculated based on the IR values in the three redistributions. For all the three performance metrics ρstd, Wstd and W, the smaller their values, the better the performance of the SAN system or the proposed strategy. Therefore, the improvements are indicated by negative values of IR.
I R = A B B
As the value of s increases, the absolute values of the average IR all increase for ρstd. Wstd and W, implying that the proposed utilization-driven strategies become more effective in achieving load balance and in reducing response times.

5.2. Effects of Selection Window Size w

Assuming s = 0.07, we conduct two more experiments with w = 0.1 (Case 4) and w = 0.2 (Case 5). Together with Case 3 studied in Section 5.1.2 where w = 0.02, we study the impact of the selection window size w on the effectiveness of the proposed utilization-driven performance enhancement strategy.

5.2.1. Case 4: s = 0.07 and w = 0.1

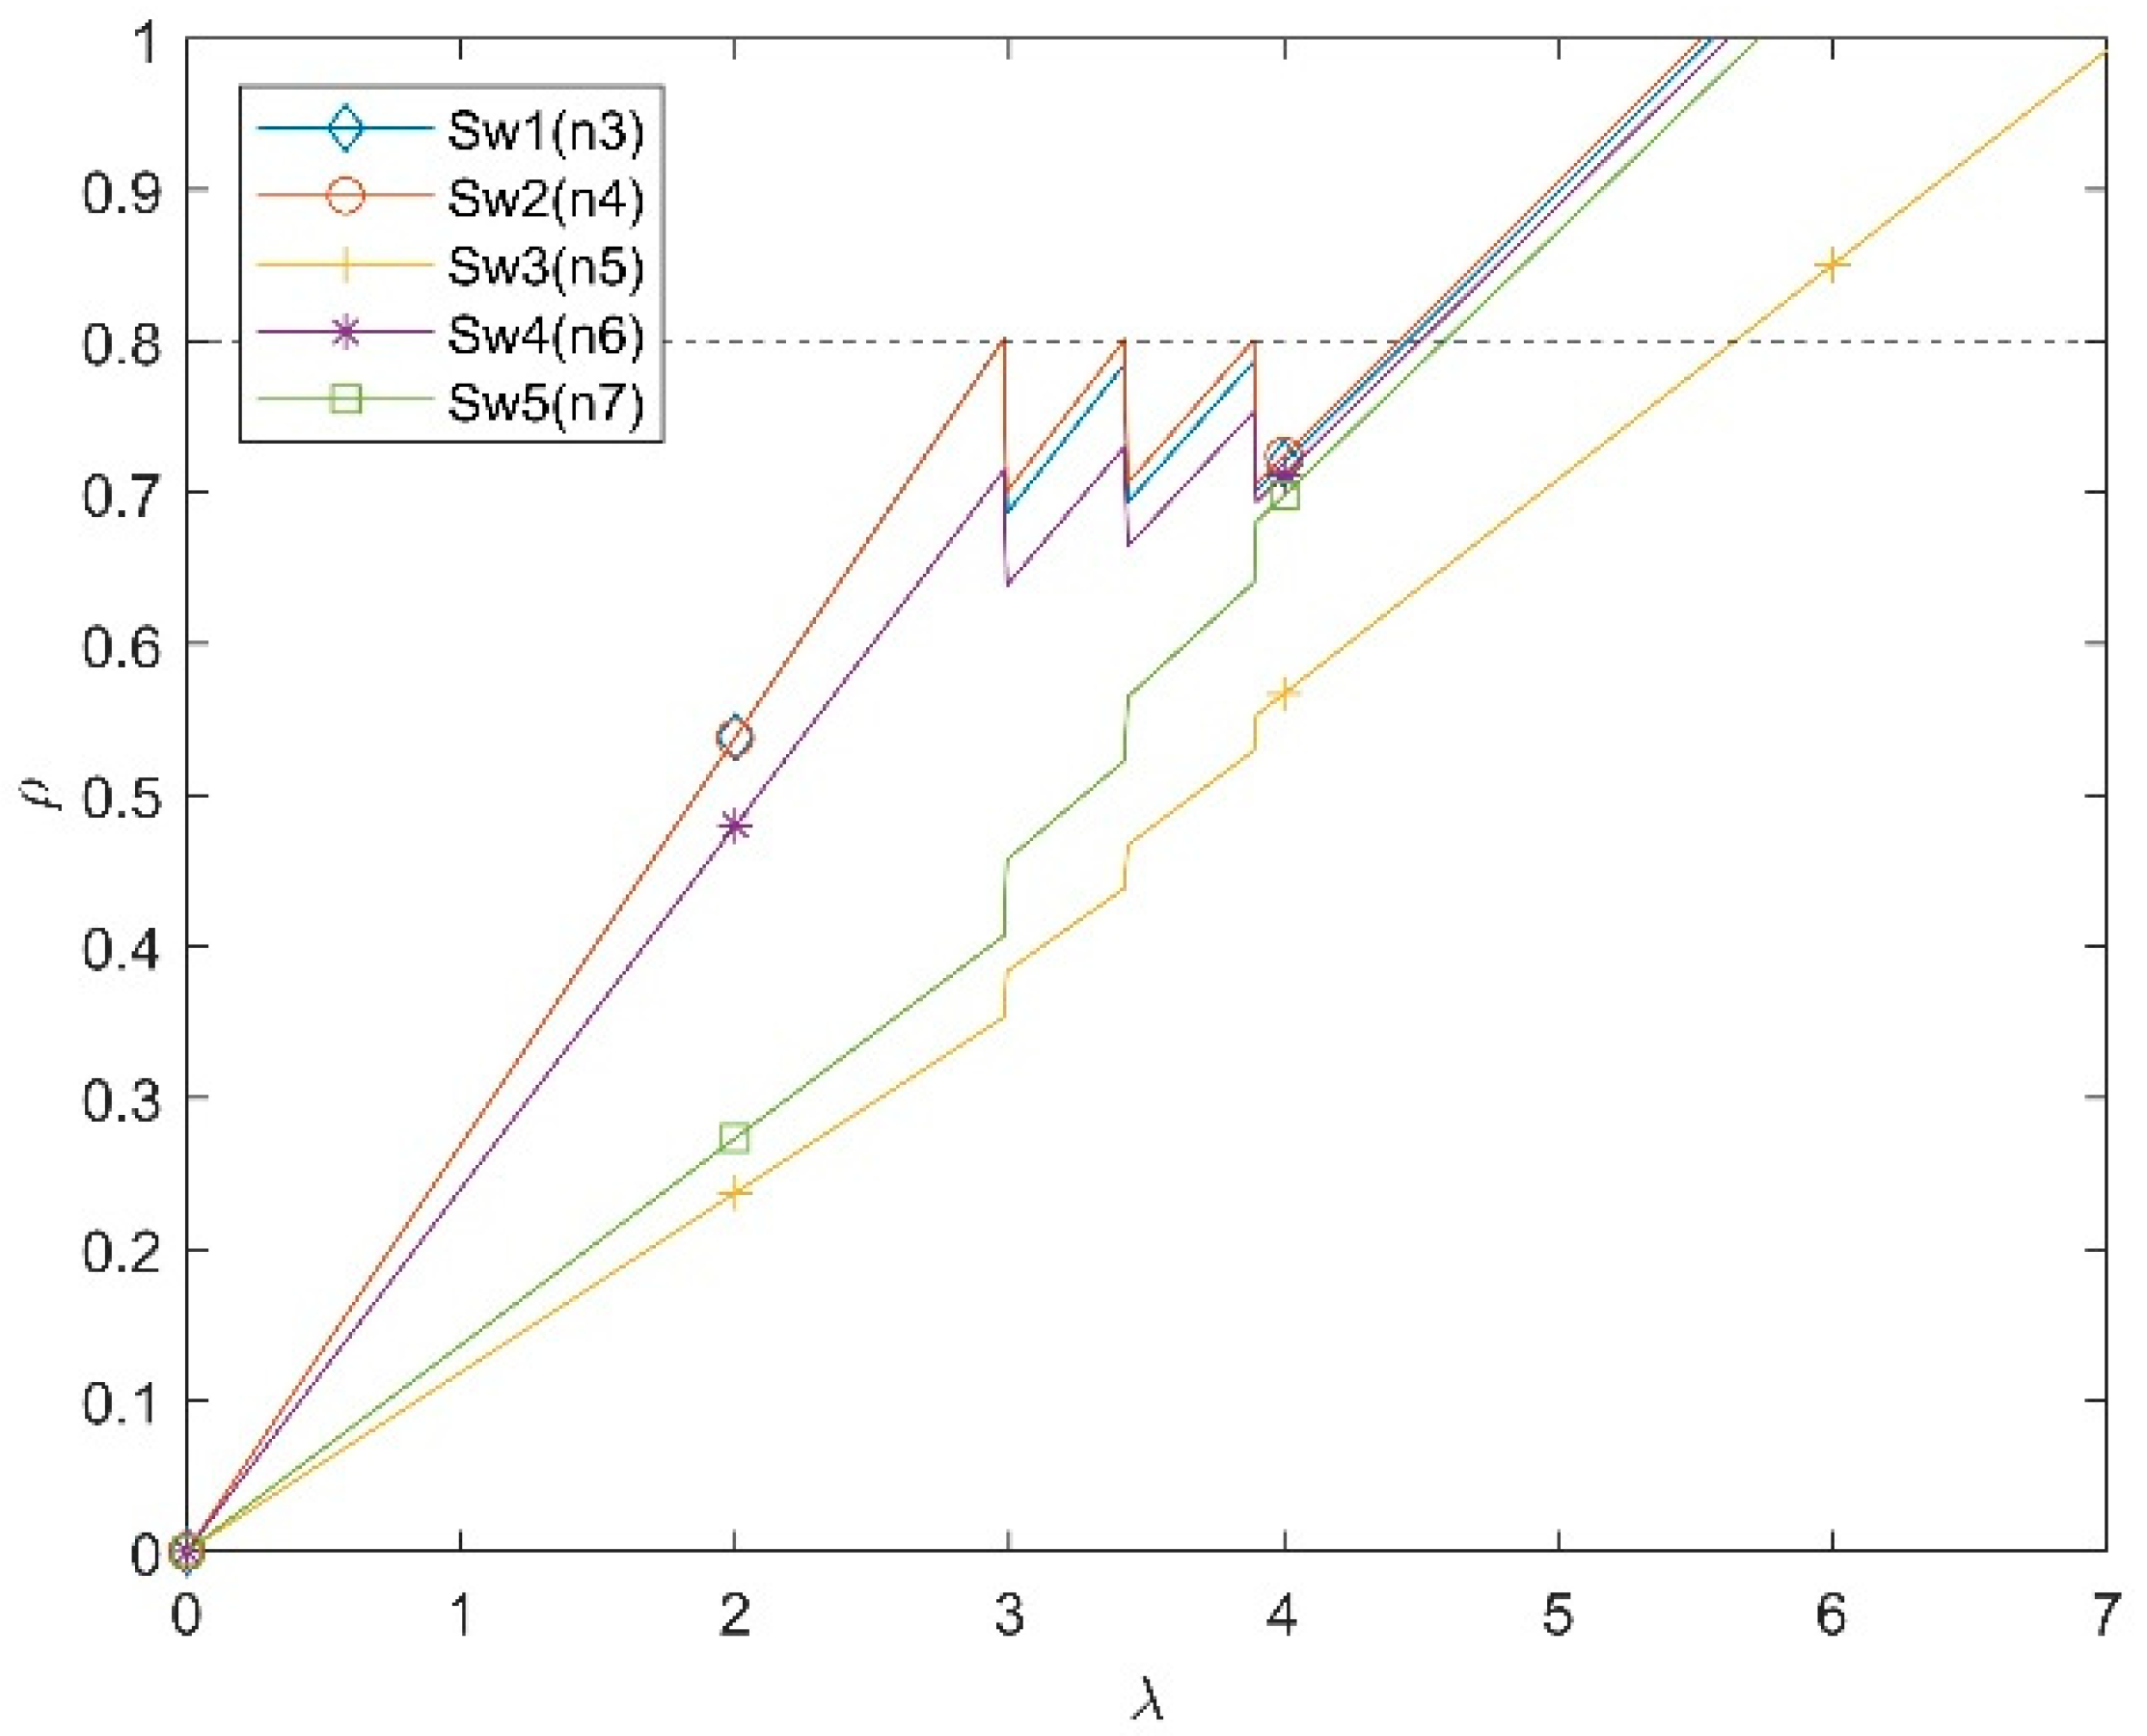
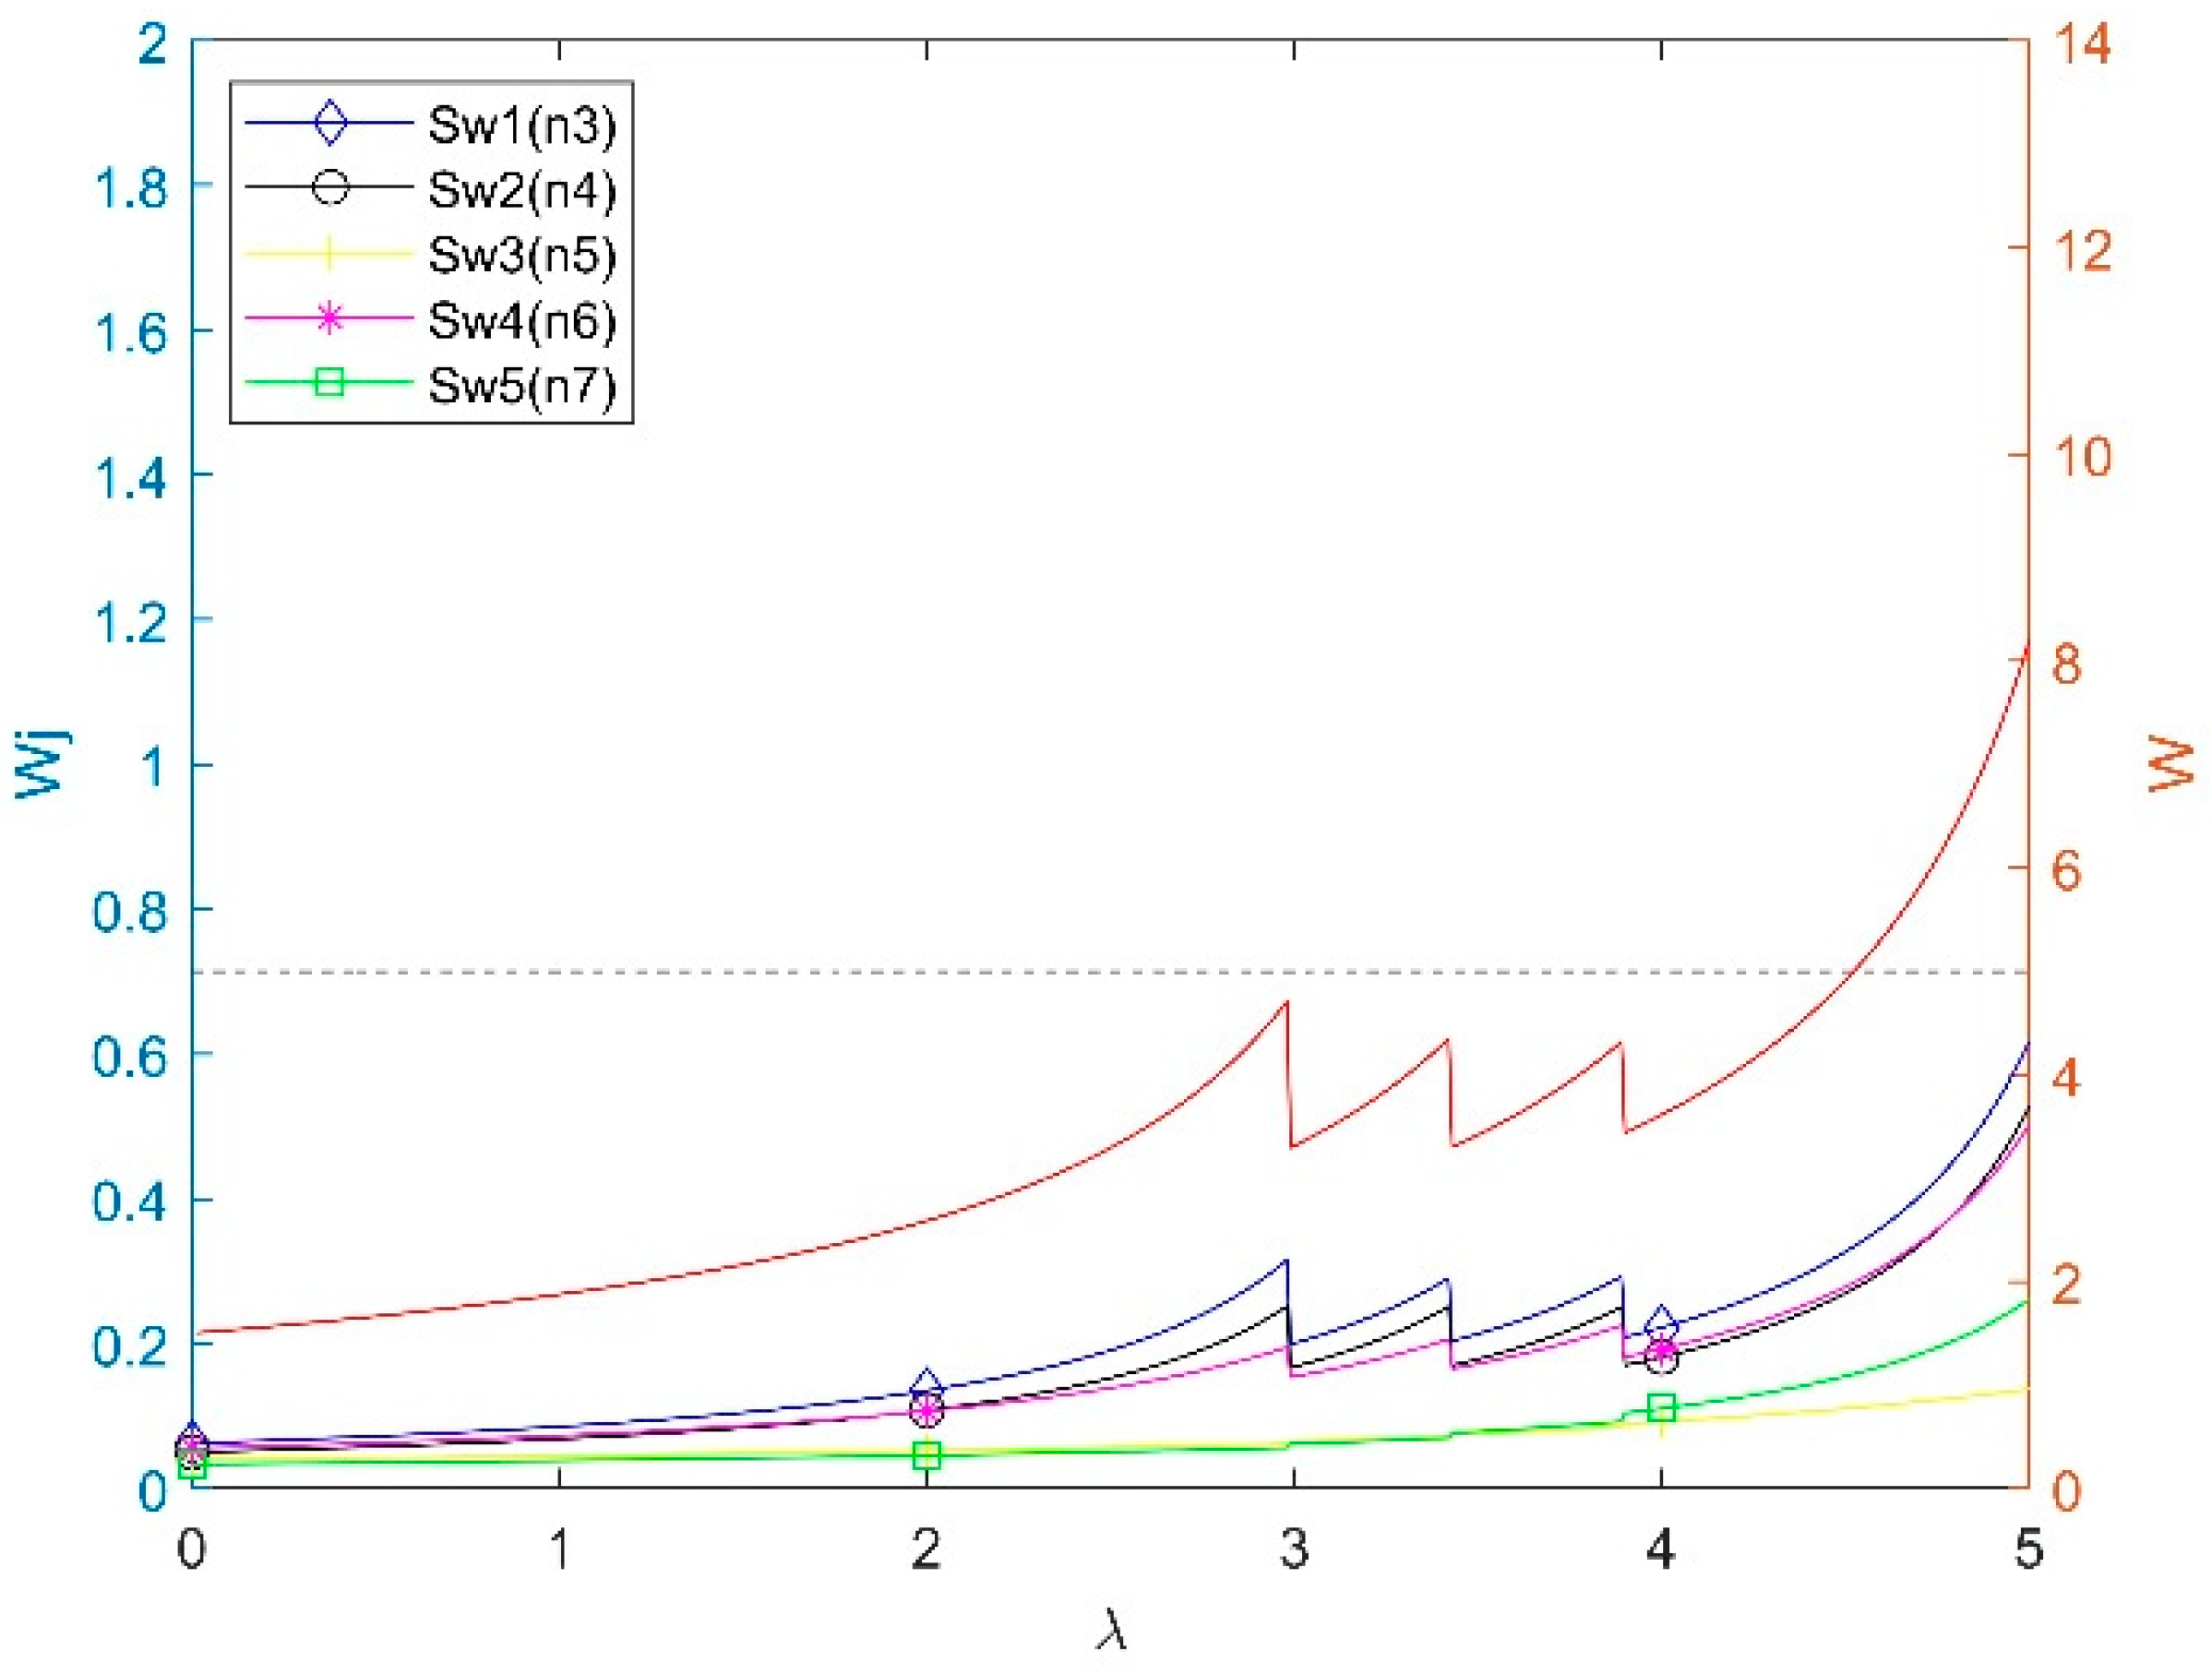
Figure 9 and Figure 10 illustrate the utilization and average response time of each switch in the example SAN as the external arrival rate λ increases. Figure 10 also illustrates the overall response time W of the example SAN as λ increases. Table 9 presents the utilization of each switch as well as the values of ρavg and ρstd before and after each redistribution. Table 10 summarizes the average response time of each switch as well as the values of Wavg, Wstd and W before and after each redistribution.
During each redistribution, all nodes with utilization between ρ* − w = 0.7 and ρ* = 0.8 are chosen for transition probability adjustment. In all the three redistributions, Sw1, Sw2 and Sw4 are selected (highlighted in Table 9 and Table 10). The first redistribution is triggered at λ = 2.98 when the utilization of Sw1 reaches the threshold ρ* = 0.8, the second redistribution is triggered at λ = 3.42 and the third redistribution occurs at λ = 3.89 when the utilization of Sw2 reaches the threshold ρ*.
Like Case 1, ρavg, ρstd, Wavg, Wstd and W all decrease after each redistribution, confirming that the proposed strategy effectively balances the load across different switches and improves overall response time and utilization efficiency.

5.2.2. Case 5: s = 0.07 and w = 0.2

Figure 11 and Figure 12 illustrate the utilization and average response time of each switch in the example SAN as the external arrival rate λ increases. Figure 12 also illustrates the overall response time W of the example SAN as λ increases. Table 11 presents the utilization of each switch as well as the values of ρavg and ρstd before and after each redistribution. Table 12 summarizes the average response time of each switch as well as the values of Wavg, Wstd, and W before and after each redistribution.
Nodes with utilization between ρ*-w = 0.6 and ρ* = 0.8 are selected for transition probability adjustment during each redistribution. In the first two redistributions, Sw1, Sw2, and Sw4 are selected for adjustment, while in the third redistribution, Sw5 is additionally included (highlighted in Table 11 and Table 12). The three redistributions are triggered at λ = 2.98, λ = 3.42, and λ = 3.89, respectively.
Consistent with Case 4, the decrease in ρavg, ρstd, Wavg, Wstd and W after each redistribution confirms the effectiveness of the proposed strategy in load balancing and improving the overall response time and utilization efficiency.

5.2.3. Summary of Effects of Selection Window Size

Table 13 summarizes the improvement ratio IR, evaluated using (11), at each redistribution for ρstd, Wstd and W under different values of selection window size parameter w. As w increases from 0.02 to 0.1, the absolute values of average IR of ρstd, Wstd and W increase. However, as w increases further, the absolute values of average IR of those three metrics decrease. This can be explained by the fact that in the case of a large selection window, more nodes (particularly, more than majority of nodes in the example SAN) are involved in the redistribution process, which potentially reduces the degree of adjustment for highly utilized nodes. This implies that the proposed utilization-driven strategies are more effective in achieving load balancing and reducing response times when the selection window size is not overly aggressive, i.e., not involving more than the majority of nodes. Note that the identical results in the first two redistributions for w = 0.1 and w = 0.2 are due to the involvement of the same set of switches for traffic redistribution.

6. Conclusions and Future Work

This paper contributes by proposing a utilization-driven traffic redistribution strategy to enhance the performance of SAN systems. A JQN-based method is adapted to assess the utilization and response time of switches as well as the overall response time of the SAN system. The effectiveness of the proposed strategy in balancing load across switches and in improving average response times is demonstrated using a detailed case study of a mesh SAN system. The impacts of adjustment step parameter s and selection window size w on the effectiveness of the proposed performance enhancement strategy are also investigated using case studies.
The following has been revealed: (1) The proposed dynamic traffic redistribution process ensures a more uniform workload distribution and reduces the likelihood of forming bottlenecks and causing cascading failures. As a result, overall response time and utilization efficiency can be improved. (2) A larger adjustment step tends to result in higher average improvements in both utilization and response times, as well as more balanced load across SAN switches. (3) The selection window size should be carefully designed to allow for more effective adjustments to heavily loaded nodes.
The proposed model assumes that the key parameters like adjustment step parameter s and node selection window size w remain constant during the mission. One future direction could focus on investigating adaptive methods to dynamically adjust these two parameters in response to changing traffic conditions and switch failures. Moreover, other factors like real network latency and jitter as well as hardware constraints will be considered. While this work has demonstrated the effectiveness of the proposed strategy in a mesh SAN system, further research could investigate the scalability of the proposed method in larger and more complex SAN systems. Another potential direction for future research is to integrate machine learning methods that could help predict future loads for proactive load planning and further enhancing SAN performance [33]. We are also interested in exploring online optimization algorithms [34] for reducing the service response time and overall energy consumption. Additionally, to further strengthen the practical significance of the proposed work, pursuing real-world implementation and validation would be another valuable direction for future work. The operational overhead and challenges associated with deploying the method in practice will be assessed.

Author Contributions

Conceptualization, L.X.; Data curation, G.L.; Formal analysis, G.L. and L.X.; Investigation, G.L.; Methodology, G.L. and L.X.; Software, G.L.; Supervision, L.X.; Validation, G.L., L.X. and Z.Z.; Visualization, G.L.; Writing—original draft, G.L. and L.X.; Writing—review & editing, L.X. and Z.Z. All authors have read and agreed to the published version of the manuscript.

Funding

The work of L. Xing was partially supported by the U.S. National Science Foundation under Grant No. 2302094. Z. Zeng is supported by chair of Risk and Resilience of Complex Systems (Chair EDF, Natran, Orange, RTE and SNCF) and ANR under contract number ANR-22-CE-10-0004.

Data Availability Statement

The original contributions presented in this study are included in the article. Further inquiries can be directed to the corresponding author.

Conflicts of Interest

The authors declare no conflicts of interest.

Notations

KNumber of nodes in a queueing network
ckNumber of identical servers at node k
μkService rate of a server at node k
λkArrival rate to a server at node k
PkjTransition probability from node k to node j
ΛkAverage arrival rate to node k
ρ k Utilization of node k
π (n1, n2, …, nK) Joint steady state probability
n k Number of customers in node k
W k Average response time at node k
L k Average number of jobs in node k
W Overall mean response time of the entire queueing network
ρ*Pre-defined initial utilization threshold
wAdjustment window size
AjSet of nodes selected for adjustment triggered by node j
N j Set of neighboring nodes for node j
MTotal number of SAN servers
lnTotal number of paths through server n
P 0 , n Transition probability from dummy node 0 to server n
N j Cardinality of set Nj
ρavgAverage utilization of all switches in the example SAN
ρstdStandard deviation of utilization of all switches in the example SAN
WavgAverage response time of all switches in the example SAN
WstdStandard deviation of response time of all switches in the example SAN
IRImprovement ratio

References

  1. Margara, A.; Cugola, G.; Felicioni, B.; Cilloni, S. A Model and Survey of Distributed Data-Intensive Systems. ACM Comput. Surv. 2023, 56, 1–69. [Google Scholar] [CrossRef]
  2. Garber, L. Converged infrastructure: Addressing the efficiency challenge. Computer 2012, 45, 17–20. [Google Scholar] [CrossRef]
  3. Honma, S.; Morishima, H.; Tsukiyama, T.; Matsushima, H.; Oeda, T.; Tomono, Y. Computer System Using a Storage Area Network and Method of Handling Data in the Computer System. U.S. Patent US20040073677A1, 15 April 2004. Available online: https://www.google.com/patents/US20040073677 (accessed on 1 August 2025).
  4. Sharma, M.; Luthra, S.; Joshi, S.; Kumar, A. Developing a framework for enhancing survivability of sustainable supply chains during and post-COVID-19 pandemic. Int. J. Logist. Res. Appl. 2020, 25, 433–453. [Google Scholar] [CrossRef]
  5. Xing, L.; Tannous, M.; Vokkarane, V.M.; Wang, H.; Guo, J. Reliability modeling of mesh storage area networks for Internet of things. IEEE Internet Things J. 2017, 4, 2047–2057. [Google Scholar] [CrossRef]
  6. Liu, D.; Zhang, X.; Chi, K.T. Effects of high level of penetration of renewable energy sources on cascading failure of modern power systems. IEEE J. Emerg. Sel. Top. Circuits Syst. 2022, 12, 98–106. [Google Scholar] [CrossRef]
  7. Mishra, S.; Anderson, K.; Miller, B.; Boyer, K.; Warren, A. Microgrid resilience: A holistic approach for assessing threats, identifying vulnerabilities, and designing corresponding mitigation strategies. Appl. Energy 2020, 264, 114726. [Google Scholar] [CrossRef]
  8. Nguyen, T.; Liu, B.; Nguyen, N.; Dumba, B.; Chou, J. Smart Grid Vulnerability and Defense Analysis Under Cascading Failure Attacks. IEEE Trans. Power Deliv. 2021, 36, 2264–2273. [Google Scholar] [CrossRef]
  9. Xing, L. Cascading failures in Internet of Things: Review and perspectives on reliability and resilience. IEEE Internet Things J. 2021, 8, 44–64. [Google Scholar] [CrossRef]
  10. Bialek, J.; Ciapessoni, E.; Cirio, D.; Sanchez, E.; Dent, C.; Dobson, I.; Henneaux, P.; Hines, P.; Jardim, J.; Miller, S.; et al. Benchmarking and Validation of Cascading Failure Analysis Tools. IEEE Trans. Power Syst. 2016, 31, 4887–4900. [Google Scholar] [CrossRef]
  11. Shi, L.; Shi, Z.; Yao, L.; Ni, Y.; Bazarga, M. A review of mechanism of large cascading failure blackouts of modern power system. Power Syst. Technol. 2010, 34, 48–54. [Google Scholar]
  12. Xing, L. Reliability and Resilience in the Internet of Things; Elsevier: Amsterdam, The Netherlands, 2024. [Google Scholar]
  13. Huang, Q.; Shao, L.; Li, N. Dynamic detection of transmission line outages using hidden Markov models. IEEE Trans. Power Syst. 2015, 31, 2026–2033. [Google Scholar] [CrossRef]
  14. Ed-daoui, I.; El Hami, A.; Itmi, M.; Hmina, N.; Mazri, T. Resilience assessment as a foundation for systems-of-systems safety evaluation: Application to an economic infrastructure. Saf. Sci. 2019, 115, 446–456. [Google Scholar] [CrossRef]
  15. Dey, P.; Mehra, R.; Kazi, F.; Wagh, S.; Singh, N.M. Impact of topology on the propagation of cascading failure in power grid. IEEE Trans. Smart Grid 2016, 7, 1970–1978. [Google Scholar] [CrossRef]
  16. Rahnamay-Naeini, M.; Hayat, M.M. Cascading failures in interdependent infrastructures: An interdependent Markov-chain approach. IEEE Trans. Smart Grid 2016, 7, 1997–2006. [Google Scholar] [CrossRef]
  17. Liu, C.; Li, D.; Zio, E.; Kang, R. A modeling framework for system restoration from cascading failures. PLoS ONE 2014, 9, e112363. [Google Scholar] [CrossRef] [PubMed]
  18. Ghorbani-Renani, N.; González, A.D.; Barker, K.; Morshedlou, N. Protection-interdiction-restoration: Tri-level optimization for enhancing interdependent network resilience. Reliab. Eng. Syst. Saf. 2020, 199, 106907. [Google Scholar] [CrossRef]
  19. Dang, Y.; Yang, L.; He, P.; Guo, G. Effects of collapse probability on cascading failure dynamics for duplex weighted networks. Phys. A Stat. Mech. Its Appl. 2023, 626, 129069. [Google Scholar] [CrossRef]
  20. Li, J.; Wang, Y.; Zhong, J.; Sun, Y.; Guo, Z.; Chen, Z.; Fu, C. Network resilience assessment and reinforcement strategy against cascading failure. Chaos Solitons Fractals 2022, 160, 112271. [Google Scholar] [CrossRef]
  21. Al-Aqqad, W.; Hayajneh, H.; Zhang, X. A Simulation Study of the Resiliency of Mobile Energy Storage Networks. Processes 2023, 11, 762. [Google Scholar] [CrossRef]
  22. Lv, G.; Xing, L.; Wang, H.; Liu, H. Load Redistribution-based Reliability Enhancement for Storage Area Networks. Int. J. Math. Eng. Manag. Sci. 2023, 8, 1–14. [Google Scholar] [CrossRef]
  23. Lyu, G.; Xing, L.; Zhao, G. Static and Dynamic Load-Triggered Cascading Failure Mitigation for Storage Area Networks. Int. J. Math. Eng. Manag. Sci. 2024, 9, 697–713. [Google Scholar] [CrossRef]
  24. Alam, M.G.R.; Suma, T.M.; Uddin, S.M.; Siam, M.B.A.K.; Mahbub, M.S.B.; Hassan, M.M.; Fortino, G. Queueing theory based vehicular traffic management system through Jackson network model and optimization. IEEE Access 2021, 9, 136018–136031. [Google Scholar] [CrossRef]
  25. Liang, W.; Cui, L.; Tso, F.P. Low-latency service function chain migration in edge-core networks based on open Jackson networks. J. Syst. Arch. 2022, 124, 102405. [Google Scholar] [CrossRef]
  26. Doncel, J.; Assaad, M. Age of information of Jackson networks with finite buffer size. IEEE Wirel. Commun. Lett. 2021, 10, 902–906. [Google Scholar] [CrossRef]
  27. Mandalapu, J.; Jagannathan, K. The classical capacity of quantum Jackson networks with waiting time-dependent erasures. In Proceedings of the 2022 IEEE Information Theory Workshop (ITW), Mumbai, India, 1–9 November 2022; pp. 552–557. [Google Scholar]
  28. Allen, A.O. Probability, Statistics, and Queueing Theory; Academic Press: San Diego, CA, USA, 1990. [Google Scholar]
  29. Kleinrock, L. Queueing Systems: Theory; Wiley: Hoboken, NJ, USA, 1975; Volume 2. [Google Scholar]
  30. Dell Technologies. Dell EMC PowerEdge T150 Technical Guide. 2022. Available online: https://i.dell.com/sites/csdocuments/product_docs/en/dell-emc-poweredge-t150-technical-guide.pdf (accessed on 1 August 2025).
  31. Dell Technologies. Dell Unity XT HFA and AFA Storage. 2023. Available online: https://www.delltechnologies.com/asset/da-dk/products/storage/technical-support/h17713_dell_emc_unity_xt_series_ss.pdf (accessed on 1 August 2025).
  32. Dell Technologies. Connectrix B-Series DS-6600B Switches. 2024. Available online: https://www.delltechnologies.com/asset/en-us/products/storage/technical-support/h16567-connectrix-ds-6600b-switches-ss.pdf (accessed on 1 August 2025).
  33. Masich, I.S.; Tynchenko, V.S.; Nelyub, V.A.; Bukhtoyarov, V.V.; Kurashkin, S.O.; Gantimurov, A.P.; Borodulin, A.S. Prediction of Critical Filling of a Storage Area Network by Machine Learning Methods. Electronics 2022, 11, 4150. [Google Scholar] [CrossRef]
  34. Yang, Y.; Shi, Y.; Yi, C.; Cai, J.; Kang, J.; Niyato, D.; Shen, X. Dynamic Human Digital Twin Deployment at the Edge for Task Execution: A Two-Timescale Accuracy-Aware Online Optimization. IEEE Trans. Mob. Comput. 2024, 23, 12262–12279. [Google Scholar] [CrossRef]
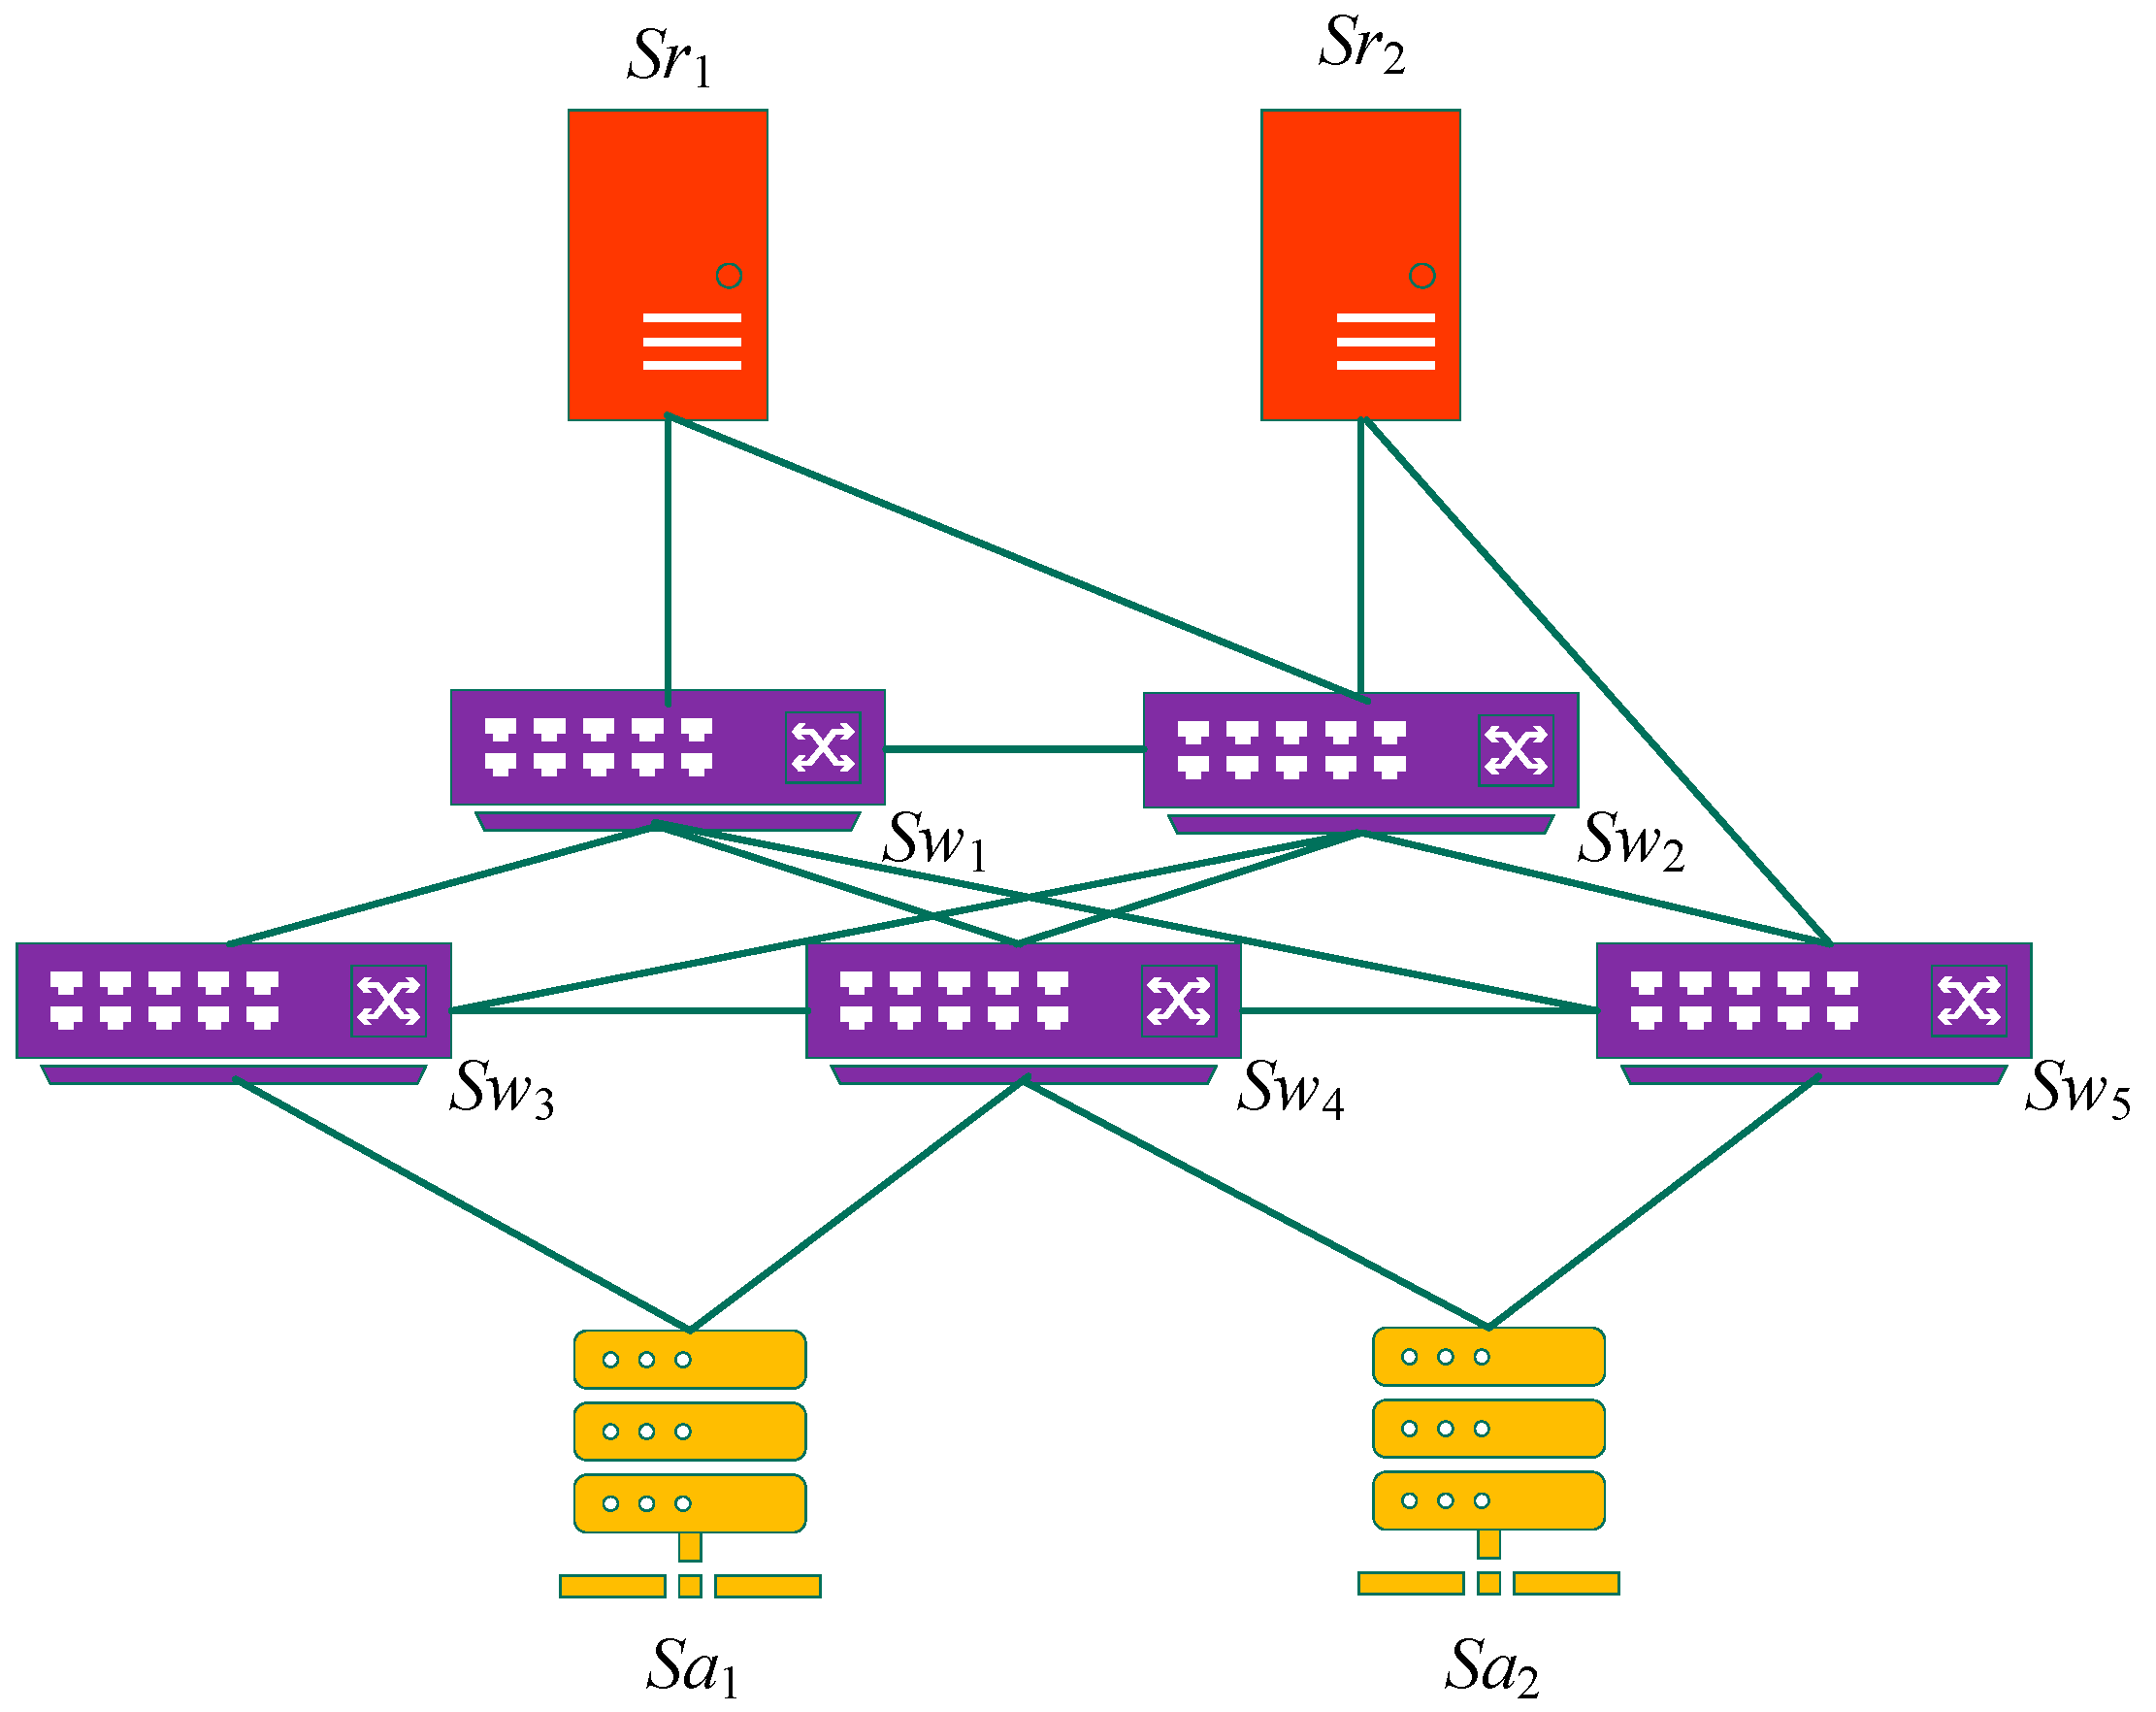
Figure 1. An example of a mesh SAN.
Telecom 06 00077 g001
Figure 2. JQN model of the example mesh SAN.
Telecom 06 00077 g002
Figure 3. The changes of utilization of all switches under s = 0.01 and w = 0.02.
Telecom 06 00077 g003
Figure 4. The changes of average response time of all switches under s = 0.01 and w = 0.02.
Telecom 06 00077 g004
Figure 5. The changes of utilization of all switches under s = 0.05 and w = 0.02.
Telecom 06 00077 g005
Figure 6. The changes of average response time of all switches under s = 0.05 and w = 0.02.
Telecom 06 00077 g006
Figure 7. The changes of utilization of all switches under s = 0.07 and w = 0.02.
Telecom 06 00077 g007
Figure 8. The changes of average response time of all switches under s = 0.07 and w = 0.02.
Telecom 06 00077 g008
Figure 9. The changes of utilization of all switches under s = 0.07 and w = 0.1.
Telecom 06 00077 g009
Figure 10. The changes of average response time of all switches under s = 0.07 and w = 0.1.
Telecom 06 00077 g010
Figure 11. The changes utilization of all switches under s = 0.07 and w = 0.2.
Telecom 06 00077 g011
Figure 12. The changes of average response time of all switches under s = 0.07 and w = 0.2.
Telecom 06 00077 g012
Table 1. Baseline average service rate for the five switches.
SwitchAverage Service Rate μ (Gb/s)
Sw116
Sw220
Sw325
Sw418
Sw530
Table 2. Utilization of all switches, ρavg and ρstd under s = 0.01 and w = 0.02.
RedistributionFirstSecondThird
λ2.983.133.25
beforeafterbeforeafterbeforeafter
Sw10.7991880.7462990.7839910.7624540.7917790.775559
Sw20.7986490.7614870.7999460.7687140.7982800.782550
Sw30.3521230.3470710.3646010.3658640.3799360.385192
Sw40.7124820.7127910.7487910.7543220.7833350.771306
Sw50.4057230.4106760.4314180.4245700.4408990.447452
ρavg0.6136330.5956650.6257490.6151850.6388460.632412
ρstd0.1949600.1788440.1878770.1806180.1875650.177568
Table 3. Response time of all switches, Wavg, Wstd and W under s = 0.01 and w = 0.02.
RedistributionFirstSecondThird
λ2.983.133.25
beforeafterbeforeafterbeforeafter
Sw10.3112360.2463530.289340.2631070.3001620.27847
Sw20.2483230.2096320.2499320.2161830.2478690.229938
Sw30.0617400.0612620.0629520.0630780.0645090.065061
Sw40.1932250.1934330.2211520.2261320.2564120.242926
Sw50.0560910.0565620.0586250.0579280.059620.060327
Wavg0.1741230.1534490.1764010.1652850.1857140.175344
Wstd0.1012250.0790850.0968570.0869870.1025180.093353
W4.66124.03294.56744.21724.67804.3893
Table 4. Utilization of all switches, ρavg and ρstd under s = 0.05 and w = 0.02.
RedistributionFirstSecondThird
λ2.983.293.50
beforeafterbeforeafterbeforeafter
Sw10.7991870.6142310.6783430.6080580.6469890.775742
Sw20.7986490.6372560.7037710.6329210.6734440.778516
Sw30.3521230.3402440.3757580.3961160.4214780.465316
Sw40.7124810.7242010.799790.7505340.7985860.715498
Sw50.4057230.4063780.4487950.4768450.5073740.544798
ρavg0.6136330.5444620.6012910.5728950.6095740.655974
ρstd0.1949590.1459840.1612210.1239930.1319320.127761
Table 5. Average response time of all switches, Wavg, Wstd and W under s = 0.05 and w = 0.02.
RedistributionFirstSecondThird
λ2.983.293.50
beforeafterbeforeafterbeforeafter
Sw10.3112350.1620140.1943060.1594620.1770480.278697
Sw20.2483230.1378380.1687880.1362110.1531130.22575
Sw30.0617400.0606280.0640780.0662380.0691420.074811
Sw40.1932240.2014350.2774870.2226980.2758280.195273
Sw50.0560910.0561530.0604740.0637160.0676650.073228
Wavg0.1012240.0570110.0823660.059930.0773060.082446
Wstd0.1741230.1236140.1530270.1296650.1485590.169552
W4.66123.06543.70343.05593.44404.0638
Table 6. Utilization of all switches, ρavg and ρstd under s = 0.07 and w = 0.02.
RedistributionFirstSecondThird
λ2.983.263.4
ρbeforeafterbeforeafterbeforeafter
Sw10.7991880.5549850.6073060.7627340.795590.556714
Sw20.7986490.5812390.6360360.7657720.7987590.573061
Sw30.3521230.3370120.3687840.420970.4391040.414703
Sw40.7124820.7296130.7983990.6962120.7262030.772203
Sw50.4057230.4043330.4424520.4902780.5113970.490815
ρavg0.6136330.5214360.5705950.6271930.6542110.561499
ρstd0.194960.1383950.1514420.1439540.1501550.119246
Table 7. Average response time of all switches, Wavg, Wstd and W under s = 0.07 and w = 0.02.
RedistributionFirstSecondThird
λ2.983.263.4
Wjbeforeafterbeforeafterbeforeafter
Sw10.3112360.1404450.1591570.2634170.3057580.140993
Sw20.2483230.1194020.1373760.2134680.2484590.117113
Sw30.0617400.0603330.0633700.0690810.0713140.068341
Sw40.1932250.2054670.2755710.1828760.2029080.243881
Sw50.0560910.0559600.0597860.0653950.0682220.065464
Wavg0.1741230.1163210.1390520.1588470.1793320.127158
Wstd0.1012250.0553470.0788110.0791040.0952170.065088
W4.66122.81683.30743.95414.39622.7690
Table 8. IR of ρstd. Wstd and W at each redistribution under different values of parameter s.
ρstd
sFirstSecondThirdAverage
0.01−0.0827−0.0386−0.0533−0.0582
0.05−0.2512−0.2309−0.0316−0.1712
0.07−0.2901−0.0495−0.2059−0.1818
Wstd
sFirstSecondThirdAverage
0.01−0.2187−0.1019−0.0894−0.1367
0.05−0.4368−0.27240.0665−0.2142
0.07−0.45320.0037−0.3164−0.2553
W
sFirstSecondThirdAverage
0.01−0.1348−0.0767−0.0617−0.0911
0.05−0.3424−0.17480.1800−0.1124
0.07−0.39570.1955−0.3701−0.1900
Table 9. Utilization of all switches, ρavg and ρstd under s = 0.07 and w = 0.1.
RedistributionFirstSecondThird
λ2.983.423.89
beforeafterbeforeafterbeforeafter
Sw10.7991880.6815350.7825040.6892410.7842390.697394
Sw20.7986490.6956820.7987460.7017630.7984870.70243
Sw30.3521230.3808470.4372690.4640340.5279920.549905
Sw40.7124820.6342360.7281970.6602320.7512310.690172
Sw50.4057230.4540480.5213150.5613990.6387770.677011
ρavg0.6136330.569270.6536060.6153340.7001450.663382
ρstd0.1949600.1277370.1466610.0902760.1027180.05738
Table 10. Average response time of all switches, Wavg, Wstd and W under s = 0.07 and w = 0.1.
RedistributionFirstSecondThird
λ2.984.295.85
beforeafterbeforeafterbeforeafter
Sw10.3112360.1962540.2873610.2011200.2896720.206539
Sw20.2483230.1643020.2484430.1676520.2481230.168028
Sw30.0617400.0646040.0746320.0600850.0847440.088870
Sw40.1932250.1518890.2043970.1635100.2233220.179311
Sw50.0560910.0610550.0696350.0759990.0922790.103203
Wavg0.1741230.1276210.1768930.1336730.1876280.149190
Wstd0.1012250.0548580.0894880.0553810.0836940.045397
W4.66123.26054.31593.26834.28743.4054
Table 11. Utilization of all switches, ρavg and ρstd under s = 0.07 and w = 0.2.
RedistributionFirstSecondThird
λ2.983.423.89
beforeafterbeforeafterbeforeafter
Sw10.7991880.6815350.7825040.6892410.7842390.734402
Sw20.7986490.6956820.7987460.7017630.7984870.723097
Sw30.3521230.3808470.4372690.4640340.5279920.611864
Sw40.7124820.6342360.7281970.6602320.7512310.717596
Sw50.4057230.4540480.5213150.5613990.6387770.585046
ρavg0.6136330.5692700.6536060.6153340.7001450.674401
ρstd0.1949600.1277370.1466610.0902760.1027180.062821
Table 12. Average response time of all switches, Wavg, Wstd and W under s = 0.07 and w = 0.2.
RedistributionFirstSecondThird
λ2.983.423.89
beforeafterbeforeafterbeforeafter
Sw10.3112360.1962540.2873610.2011200.2896720.235318
Sw20.2483230.1643020.2484430.1676520.2481230.180568
Sw30.0617400.0646040.0746320.0600850.0847440.103057
Sw40.1932250.1518890.2043970.1635100.2233220.196724
Sw50.0560910.0610550.0696350.0759990.0922790.080330
Wavg0.1741230.1276210.1768930.1336730.1876280.159199
Wstd0.1012250.0548580.0894880.0553810.0836940.058363
W4.66123.26054.31593.26834.28743.5538
Table 13. IR of ρstd. Wstd and W under different values of w.
ρstd
wFirstSecondThirdAverage
0.02−0.2901−0.0495−0.2059−0.1818
0.1−0.3448−0.3845−0.4414−0.3902
0.2−0.3448−0.3845−0.3884−0.3726
Wstd
wFirstSecondThirdAverage
0.02−0.45320.0037−0.3164−0.2553
0.1−0.4581−0.3811−0.4576−0.4323
0.2−0.4581−0.3811−0.3027−0.3806
W
wFirstSecondThirdAverage
0.02−0.39570.1955−0.3701−0.1900
0.1−0.3005−0.2427−0.2057−0.2497
0.2−0.3005−0.2427−0.1711−0.2381
Disclaimer/Publisher’s Note: The statements, opinions and data contained in all publications are solely those of the individual author(s) and contributor(s) and not of MDPI and/or the editor(s). MDPI and/or the editor(s) disclaim responsibility for any injury to people or property resulting from any ideas, methods, instructions or products referred to in the content.