Article

The Relationship Between EMF Exposure and MIMO Systems, and the Exposure Advantages of Lowband Massive MIMO System

1
Digital Development Center, Széchenyi István University, 9026 Győr, Hungary
2
Department of Electrical Engineering and Infocommunications, Széchenyi István University, 9026 Győr, Hungary
*
Author to whom correspondence should be addressed.
Telecom 2025, 6(3), 63; https://doi.org/10.3390/telecom6030063
Submission received: 30 July 2025 / Revised: 21 August 2025 / Accepted: 26 August 2025 / Published: 2 September 2025

Abstract

With the advancement of mobile communications, technologies based on high-element-count antenna systems—such as massive Multiple Input Multiple Output (massive MIMO)—are playing an increasingly important role in enhancing network capacity. However, they introduce new challenges in the measurement and evaluation of electromagnetic field (EMF) exposure. This study presents a detailed, laboratory-based methodology for assessing EMF exposure in cellular systems using Single Input Single Output (SISO) and MIMO technologies. To address the limitations of traditional exposure assessment techniques—particularly under the conditions introduced by 5G and active antenna systems—a shielded test environment with directional antennas was developed and applied across lowband and midband frequency ranges (700–2100 MHz). Downlink electromagnetic power density was measured under standardized modulation, coding, and bandwidth settings for both SISO and MIMO configurations. The results show that MIMO technology does not lead to a significant increase in EMF exposure compared to SISO, with average differences remaining below 1 dB. Moreover, in lower-frequency bands, massive MIMO systems can ensure the required user capacity at significantly lower transmission power, resulting in more than 15 dB reductions in EMF exposure. These findings confirm the potential of massive MIMO to enhance network performance while reducing the level of electromagnetic exposure.

1. Introduction

The reduced quality of mobile service channels observed toward the edges of cells stems from the degradation of radio parameters in cellular systems. In a traditional cellular architecture, one or more antennas of the base station are located at the center of the cell [1]. As the power of electromagnetic waves decreases quadratic with propagation distance due to free-space path loss, the signal received by user equipment (UE) located farther from the base station becomes significantly attenuated. Concurrently, the signal-to-interference-plus-noise ratio (SINR) declines, leading to a continuous reduction in the spectral efficiency. This problem becomes particularly significant near cell edges, especially when operating in higher frequency bands such as 2 GHz, where shorter wavelengths result in increased path loss [2,3].
In recent years, the emergence of new-generation antenna systems—referred to in the literature as active or massive antenna systems—has opened new possibilities for addressing this issue. The antenna elements of an active antenna system can be controlled with highly complex configuration options, allowing for various radio techniques to improve the radio conditions in a given area and thereby enhance connection quality. Notable techniques include beamsweeping, beamforming, interference suppression, and spatial multiplexing. While the first three methods improve spectral efficiency by enhancing radio parameters such as reference signal received power (RSRP) and SINR, spatial multiplexing achieves this through the use of different coding schemes under given radio quality conditions. As a result, cellular systems can enhance spectral efficiency in multiple ways through the application of MIMO (Multiple Input Multiple Output) technology [4,5].
However, MIMO technology also presents limitations, as the same frequency and time domain can be shared by multiple users, necessitating proper separation between users. This becomes especially problematic as distance from the base station increases, since lower SINR values make it more difficult to separate and decode parallel data streams in spatial multiplexing. If coverage continues to degrade, the system switches to a lower-frequency channel, which provides greater coverage but lower capacity. In such cases, communication continues in SISO mode, and the network makes no attempt to reactivate MIMO.
The emergence of high-element-count antenna systems introduces the so-called massive MIMO technology, which significantly increases MIMO capacity by serving more users with higher layer counts. In such systems, MIMO is interpreted separately for each formed radiation beam. The directional capabilities enabled by beamforming also have a positive effect on user separation and help mitigate the aforementioned SINR issues. This allows higher capacity and connection quality to be maintained over a broader area [6,7,8].
Currently, these high-element-count massive antenna systems are primarily available in the 3.5 GHz and 26 GHz frequency bands used by 5G technology [9,10]. However, as of 2025, midband active antenna systems have also appeared, designed to operate in the 1.8–2.6 GHz frequency range [11]. This frequency band is currently used mainly by LTE technology. According to recent research, lowband active antenna systems—designed for 700–900 MHz bands—will also soon become available for cell deployment [12]. In fact, 5G services are already being deployed in this lower-frequency range to ensure indoor coverage. The emergence of these antenna systems is especially important, as a decrease in frequency range is accompanied by a reduction in free-space attenuation. Consequently, the capacity of midband and lowband cells using the new systems increases significantly, allowing networks to provide higher quality and capacity over larger areas [13].
The goal of this research is to develop a measurement method capable of reliably and accurately assessing electromagnetic power density in the downlink direction for both MIMO and SISO systems. Using the developed examination procedure, it is confirmed that MIMO technology—including massive MIMO—does not inherently increase electromagnetic exposure due to the nature of the technology itself. Furthermore, the application of massive MIMO in the lowband enables the network to provide the same coverage and average user capacity at a lower electromagnetic power density compared to higher bands [14,15,16,17]. This in turn may reduce the level of electromagnetic exposure experienced by the human body. However, it is important to note that this work does not include an analysis of specific absorption rate (SAR) or the effects of distributed MIMO configurations. These aspects are beyond the scope of the present study and are therefore acknowledged as limitations.
The article is organized the following way. In Section 2, an overview of EMF exposure assessment in MIMO systems is given. In Section 3, we give the proposed measurement setup, including the equipment, configurations, and methods. Next, in Section 4, the measurement results are presented, while the last section draws the conclusion.

2. Challenges of EMF Exposure Assessment in MIMO Systems

The evolution of cellular networks toward MIMO and massive MIMO architectures, particularly since the introduction of 5G, has fundamentally transformed the methodologies used to assess electromagnetic field (EMF) exposure. Traditional measurement practices, which were based on static, sectorized transmissions, have proven inadequate for capturing the dynamic, beamformed, and user-specific transmission patterns of modern systems [18,19].
The 3rd Generation Partnership Project’s (3GPP) technical specifications, such as TS 36.104 [20], outline the radio transmission and reception requirements for LTE base stations, including specific considerations for MIMO operations. These documents emphasize the importance of continued compliance with established EMF exposure limits, even as network configurations evolve to incorporate advanced antenna technologies. Moreover, studies have shown that while MIMO may increase localized exposure, the overall exposure levels often remain within the guidelines set by international organizations such as the International Commission on Non-Ionizing Radiation Protection (ICNIRP) [21,22]. For instance, research indicates that the implementation of MIMO in LTE networks does not necessarily lead to a proportional increase in EMF exposure, as the technology allows for more efficient use of power and spectral resources. 3GPP also stresses that any such increases are typically transient and confined to narrow beams, thereby reducing the likelihood of widespread exposure. Additionally, the organization highlights the importance of time-averaged measurements—such as those taken over six-minute intervals—to provide a realistic representation of exposure, since instantaneous peaks may not reflect typical user experiences. By integrating these considerations, 3GPP aims to ensure that EMF assessments remain both accurate and relevant in the context of advanced MIMO deployments [20,23,24].
In [25], the authors complement this approach by emphasizing the practical challenges of some measurements of massive MIMO and emphasizing the need for environment and user-specific measurement arrangements. These works collectively point toward a growing recognition that exposure measurements must account for probabilistic user distribution, non-uniform energy localization and spatiotemporal variations.
The deployment of massive MIMO in midband (1–6 GHz) and lowband (<1 GHz) frequency ranges offers significant advantages in terms of EMF exposure and network efficiency. Studies have shown that massive MIMO systems operating in these bands can deliver coverage and capacity equal to or greater than those of higher-frequency solutions, but with lower transmit power [26]. This efficiency stems from the superior propagation characteristics of lower frequencies, which allow signals to travel further and penetrate obstacles more effectively. As a result, networks can maintain robust performance while reducing overall power consumption and EMF emissions [27,28].

3. Proposed Human Electromagnetic Exposure Measurement Method

3.1. Measurement Equipment

The measuring instruments and auxiliary equipment listed in Table 1 were used to perform the electromagnetic power density tests.

3.2. Measurement Setup

The power density measurements were carried out in a FAC-3-type shielded chamber to ensure that signals from commercial mobile networks would not interfere with the test and increase measurement uncertainty, and also to prevent the simulated network used during testing from interfering with live networks. The primary consideration in defining the measurement setup was to minimize potential sources of disturbance during the tests, thereby ensuring the lowest possible level of measurement uncertainty. Thanks to the properties of the shielded chamber, the absorbers, the directional nature of the horn antennas used, and the short distance between them and the UE, the effect of interference fading can be considered negligible. Signal path attenuation was determined by free-space attenuation and the additional loss introduced by cables [29].
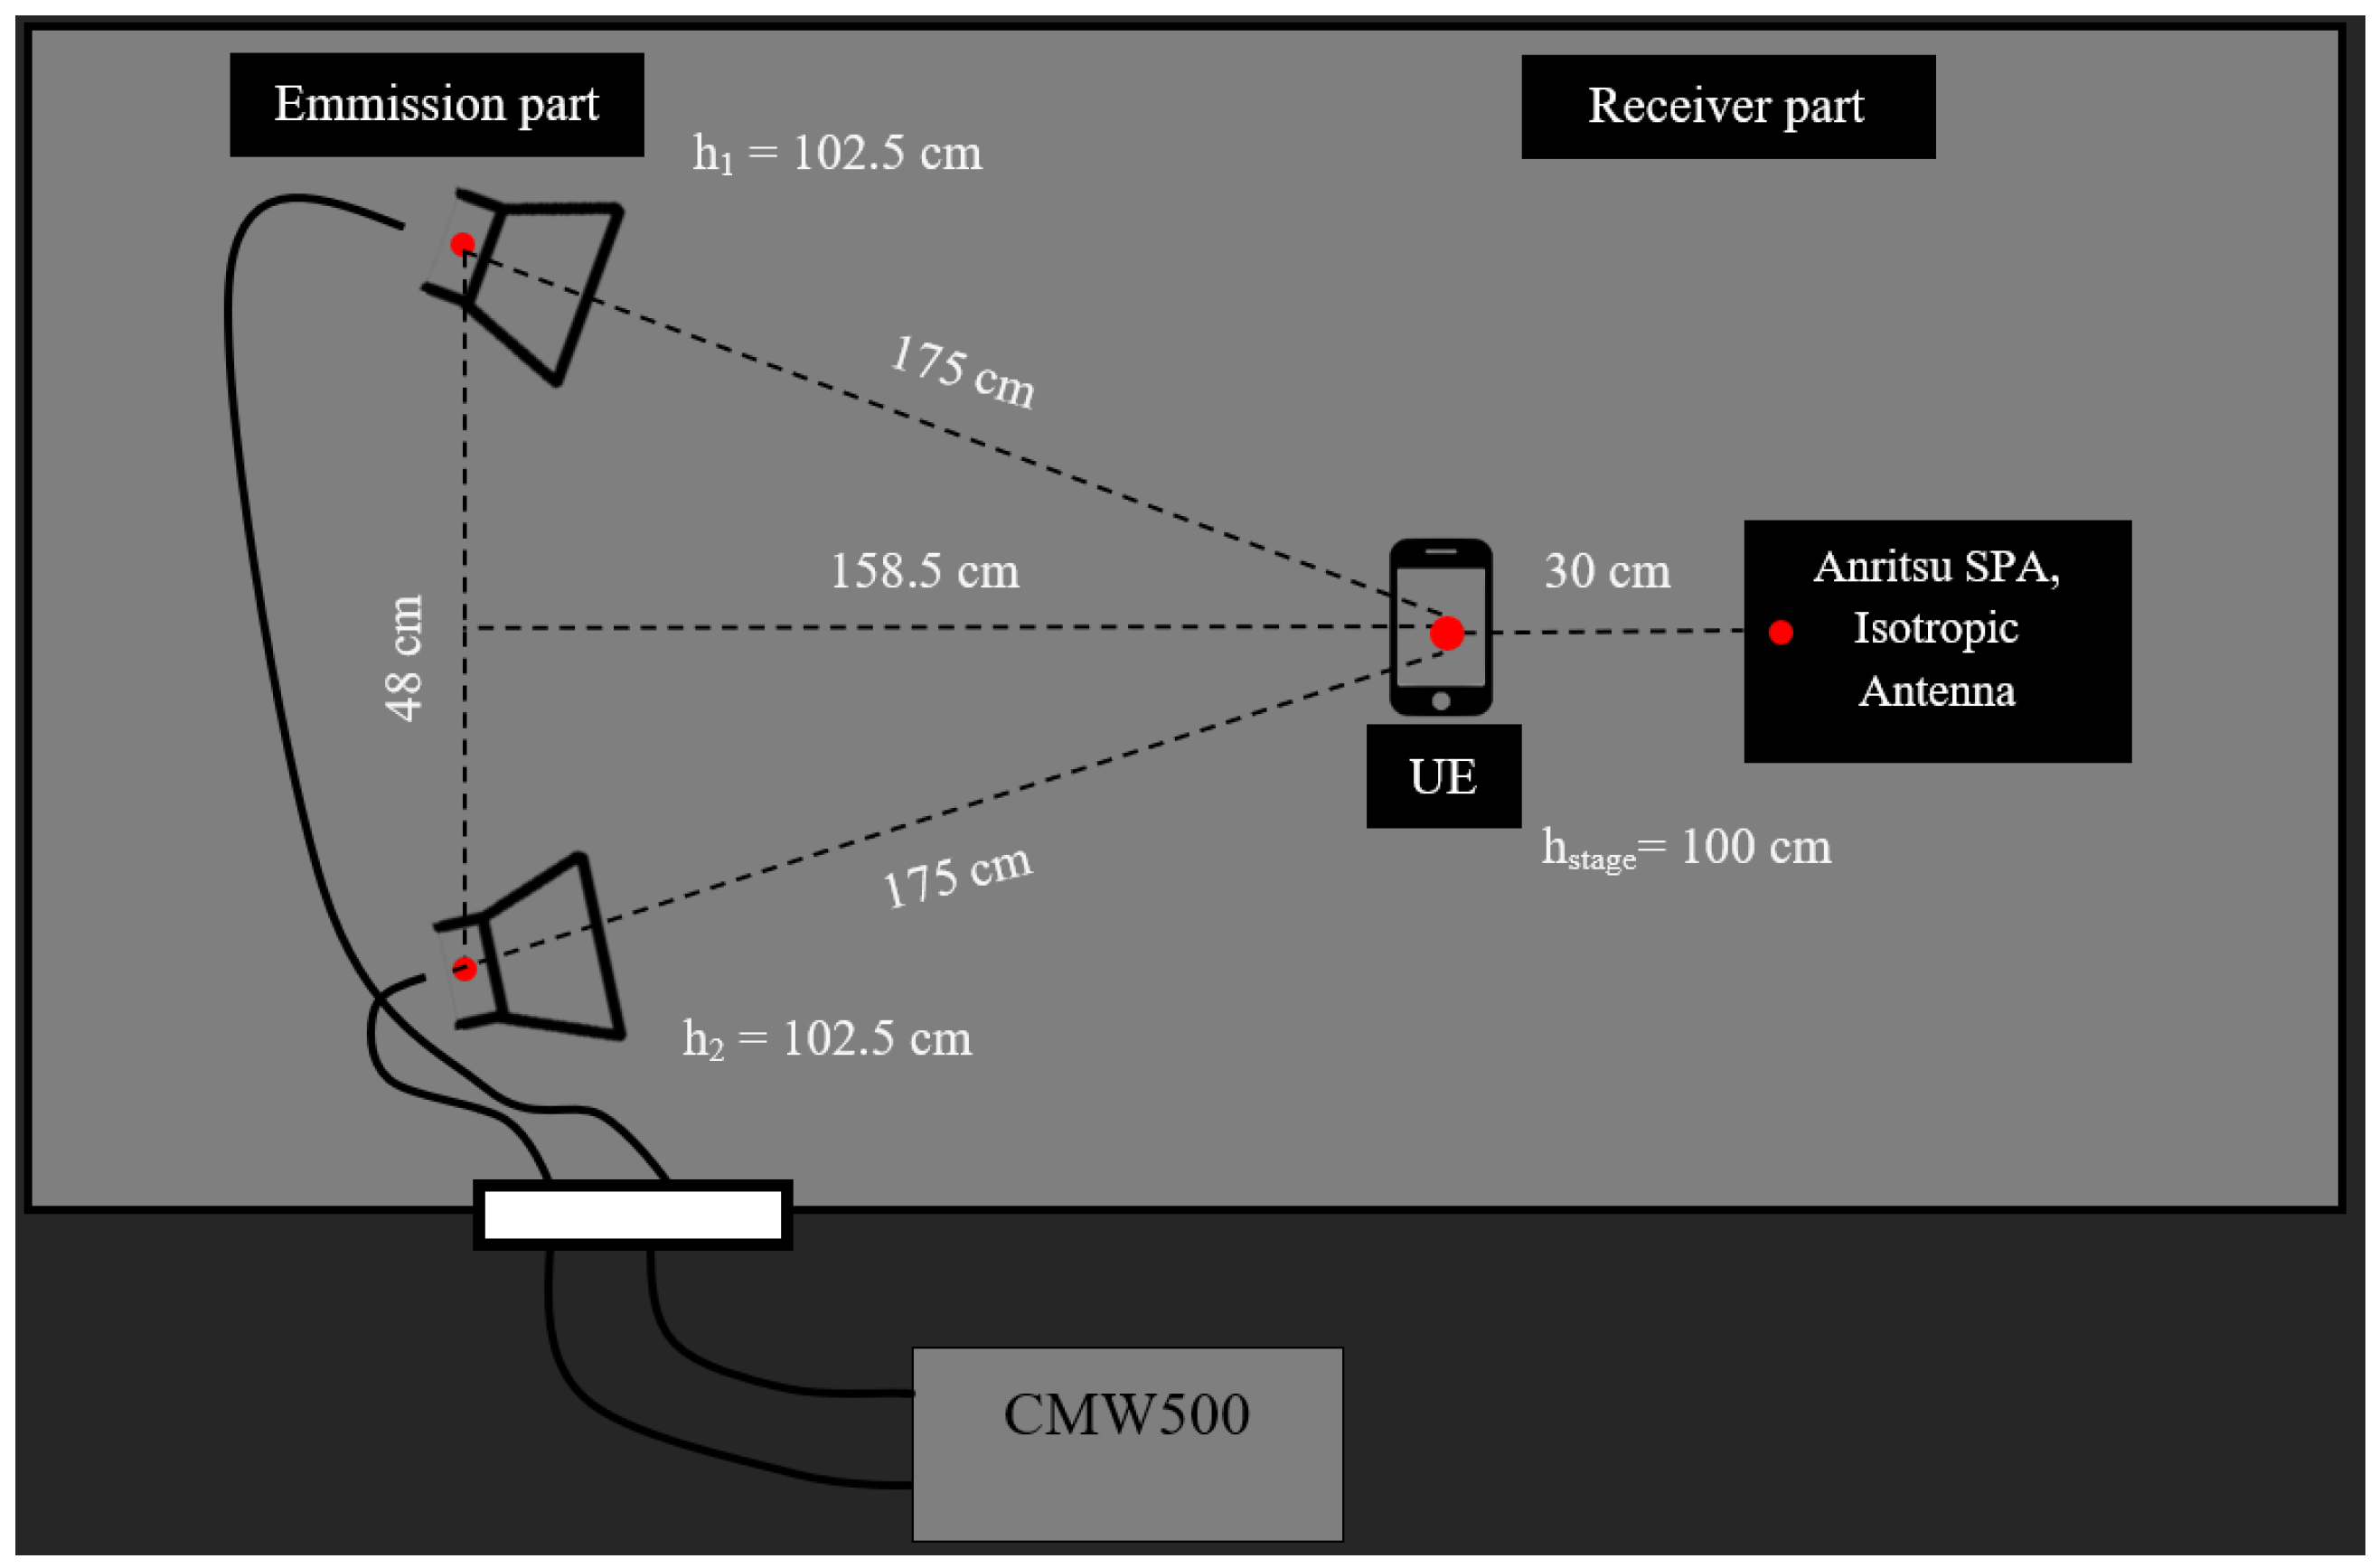
For MIMO technology, spatial separation between antennas is a fundamental requirement, with a recommended spacing of 0.5–1 λ [30]. During the measurements, the two horn antennas were placed 48 cm apart. Thus, for the highest-frequency band under investigation, Band 1 ( λ = 14.009 cm), and for the lowest, Band 20 ( λ = 36.966 cm), the required spacing was met. Considering the measurement setup—in a shielded environment, free from external noise sources, and using directional antennas—there was no need to change antenna spacing throughout the measurements across the 800–2100 MHz frequency range.
It is also important to note that the horn antennas used for the measurements as the transmitting antennas are specified to operate in the 750 MHz to 18,000 MHz frequency range. However, the 800 MHz band used during testing is very close to the antennas’ specified minimum operating frequency. Therefore, at 800 MHz, the antenna gain is about 3 dB lower compared to the performance at 2100 MHz [31].
When measuring electromagnetic power density in both MIMO and SISO modes, the spectrum analyzer and its isotropic antenna were positioned 30 cm from the user equipment (UE) to simulate, as closely as possible, the electromagnetic exposure experienced by a real user. During the measurements, electromagnetic power was recorded along the X, Y, and Z axes separately using a suitable three-axis isotropic antenna, as can be seen in Figure 1.
When determining measurement uncertainty, not only the directly measured values but also those factors that may affect the reliability of the measurement results should be taken into account. These include, among others, calibration certificates, manufacturer specifications, stability and possible drift of measuring instruments, environmental effects, and various correction factors. The total measurement uncertainty was determined for the given measurement setup according to the requirements of the relevant standards [32,33]. After evaluating these aspects and in accordance with the methodology accepted in the literature, the type B (non-statistical or evaluated by other means as statistical) contributors were determined. Table 2 summarizes the contributors of measurement uncertainty based on type B methods and the uncertainty values. It is important to note that the use of type A (statistical) methods would also be necessary for a completely accurate uncertainty estimate. This would involve multiple repetitions of the measurement results and their statistical analysis. However, this analysis is beyond the scope of this study, so we have limited ourselves here primarily to examining type B uncertainty.

3.3. Instrument Configuration

In order to build the connection between the UE (i.e., the measuring cell phone) and the base station simulator CMW500, the parameters required for power density measurements were configured on the base station simulator. First, Band 20, channel 6350, and SISO Signaling were set. For other cell parameters, the bandwidth values typically used by service providers under real-world conditions were applied—10 MHz for Band 20, and 20 MHz for Band 1 and Band 3. During the tests, QPSK modulation and a coding rate of class 9 were used throughout in the downlink direction.
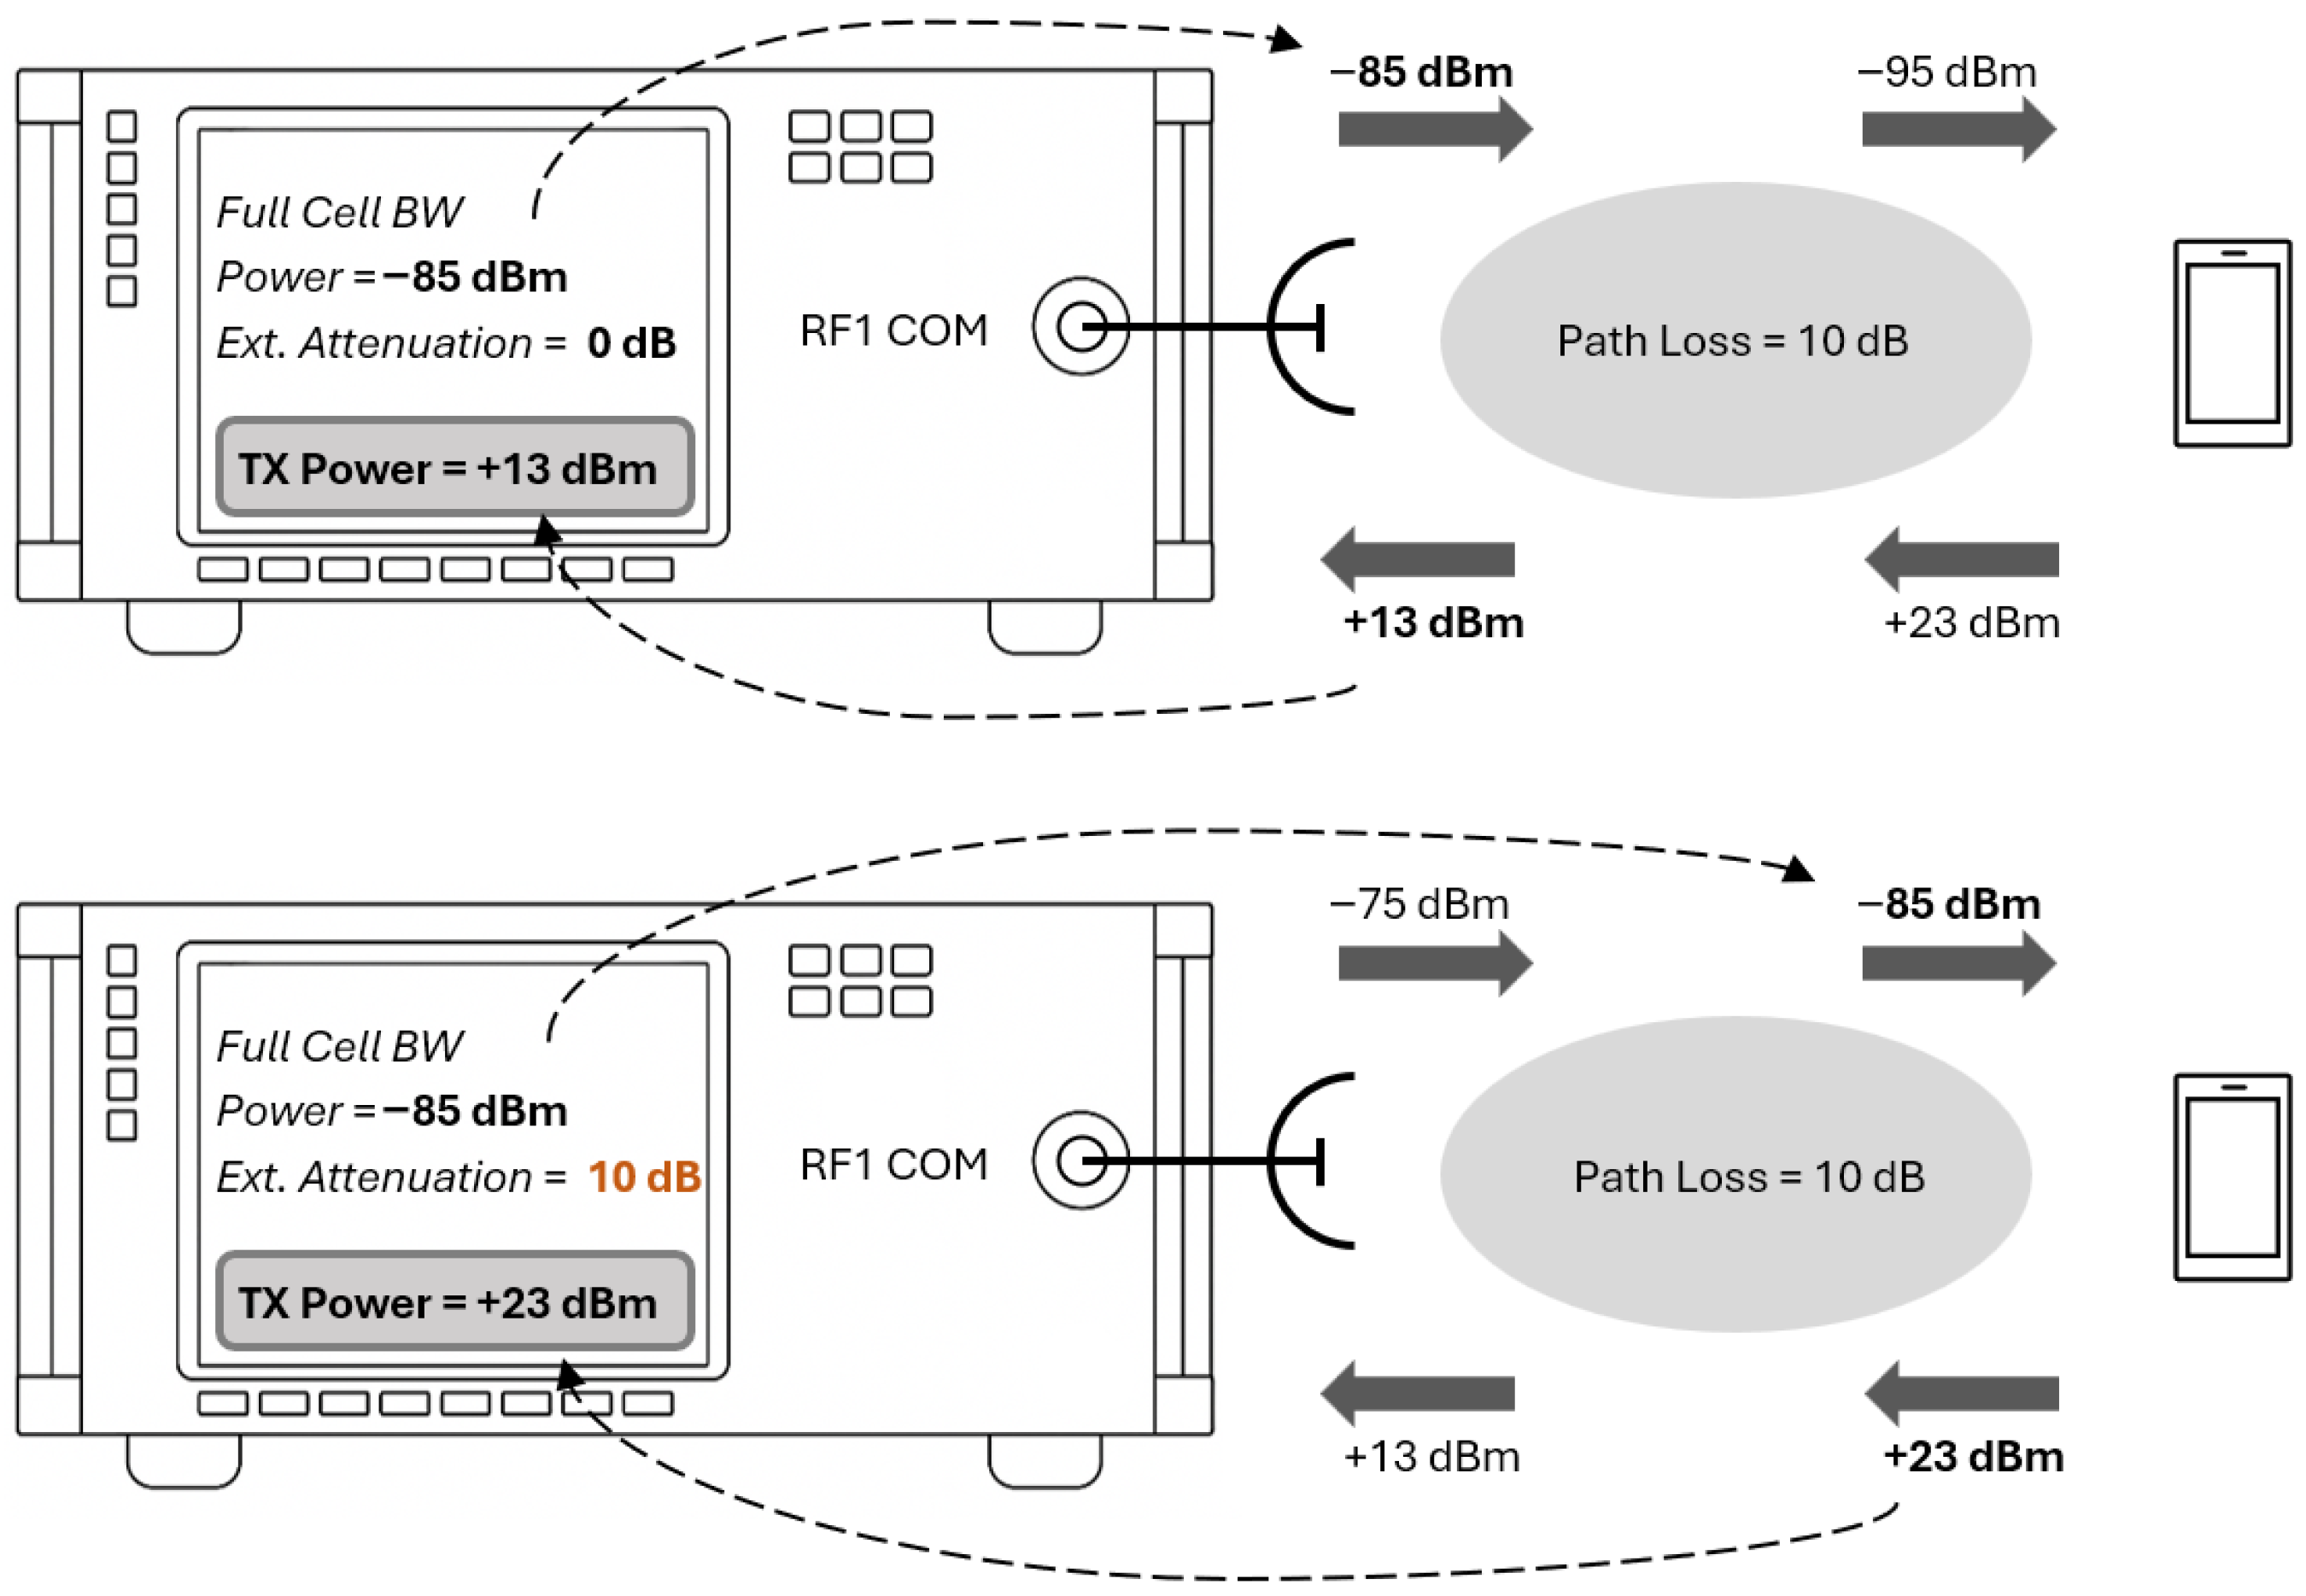
The power per resource element (reference signal energy per resource element—RS EPRE) was set to 105.8 dBm, and in a supplementary test, an RS ERPE of 116.0 dBm was configured before amplification, so that the measurements could be carried out under good and fair connection quality requirements, respectively. The base station simulator takes into account that in MIMO mode, the number of resource elements (REs) increases due to multiple layers, and more antenna ports are used. Therefore, depending on the selected MIMO configuration (2 × 2 or 4 × 4), the RS ERPE value is reduced (by 3 dB or 6 dB) while maintaining the Full Cell Bandwidth Power (FCBP). This adjusted value is then amplified according to the value specified in the External Attenuation field, as illustrated in the example in Figure 2, ensuring that the connection between the base station and the device remains stable [37,38].
To determine the required External Attenuation, we calculated the total path loss [39]; the exact values used for this are shown in Table 3. This is the sum of the cable attenuation the antenna gain and the free-space path loss a 0 , which can be expressed from the wavelength λ , and the distance D as
a 0 = 20 · log 10 λ 4 · π · D .
Based on CMW500 equipment data and calculations, a gain of 60 dB was applied in both downlink (base station → UE) and uplink (UE → base station) directions to ensure an adequate RSRP (reference signal received power) level for a stable connection across the tested bands [41], the exact values used for this are shown in Table 4.
The SISO tests were followed by the MIMO tests, for which the required configuration could be achieved by selecting the appropriate scenario. During the measurements, the scenarios listed in the table below were applied. Carrier aggregation was not used during the investigations; therefore, all measurements were conducted in 1CC (component carrier) mode, meaning only the primary component carrier (PCC) was transmitted, with varying numbers of layers. Table 5 summarizes the scenarios used during the measurements.
The desired MIMO technology—2 × 2 MIMO—was configured using appropriate values for the Transmission Mode and DCI Format (downlink control information format). For the tests, open-loop spatial multiplexing (OL Spatial Multiplexing) was used, meaning the eNodeB selected the precoding matrix without feedback from the UE. The values of the previously discussed parameters—such as band, bandwidth, modulation, code rate, FCBP, etc.—were identical to those set in SISO mode [38].

Configuration of the Anritsu MS2720T Spectrum Analyzer

During the electromagnetic power density measurements, the built-in frequency-selective EMF measurement method of the Anritsu spectrum analyzer was used, which was developed by the manufacturer based on ICNIRP regulations. In this mode, the frequency band to be measured is set—accordingly, the center frequency is set to match the measured bands [42]. Depending on the bandwidth used, the span value was set to 1.4 times the bandwidth in order to also capture information from the guard bands above and below the band. First, the center frequency of channel 6350 in Band 20 was set to 811 MHz, with a 14 MHz span. For the subsequent measurements, center frequencies of 1870 MHz and then 2140 MHz were used, both with a 28 MHz span. The instrument was configured as follows during the tests: the RBW (resolution bandwidth) was set to 100 kHz, providing sufficient spectral detail in the results. The VBW (video bandwidth) was set to 30 kHz, giving an optimal envelope curve. The input attenuation was 0.0 dB, and the reference level was 0.0 dBm/m2. After initiating the measurement, the device automatically adjusted the sweep time to 67 ms and used an RMS/Avg detector [43].
During the measurement, the Result Trace option was selected, which averaged the electromagnetic field strength signals received from three directions X, Y and Z, using the formula
Result = X 2 + Y 2 + Z 2 ,
and displayed the resulting electromagnetic power density values. A 6 min measurement window was used to ensure compliance with the required averaging time and to provide sufficient time for the instrument, as the isotropic antenna measures signals in three directions at 1 s intervals [22].
In addition to Live Trace, the TMax option was applied on Trace C to plot the maximum value recorded over the entire measurement duration. This allowed us to determine the highest average values observable during the test, which can be used to assess the worst-case values in terms of human exposure [44].

3.4. Measurement Method

3.4.1. SISO and MIMO Electromagnetic Exposure Measurement Method

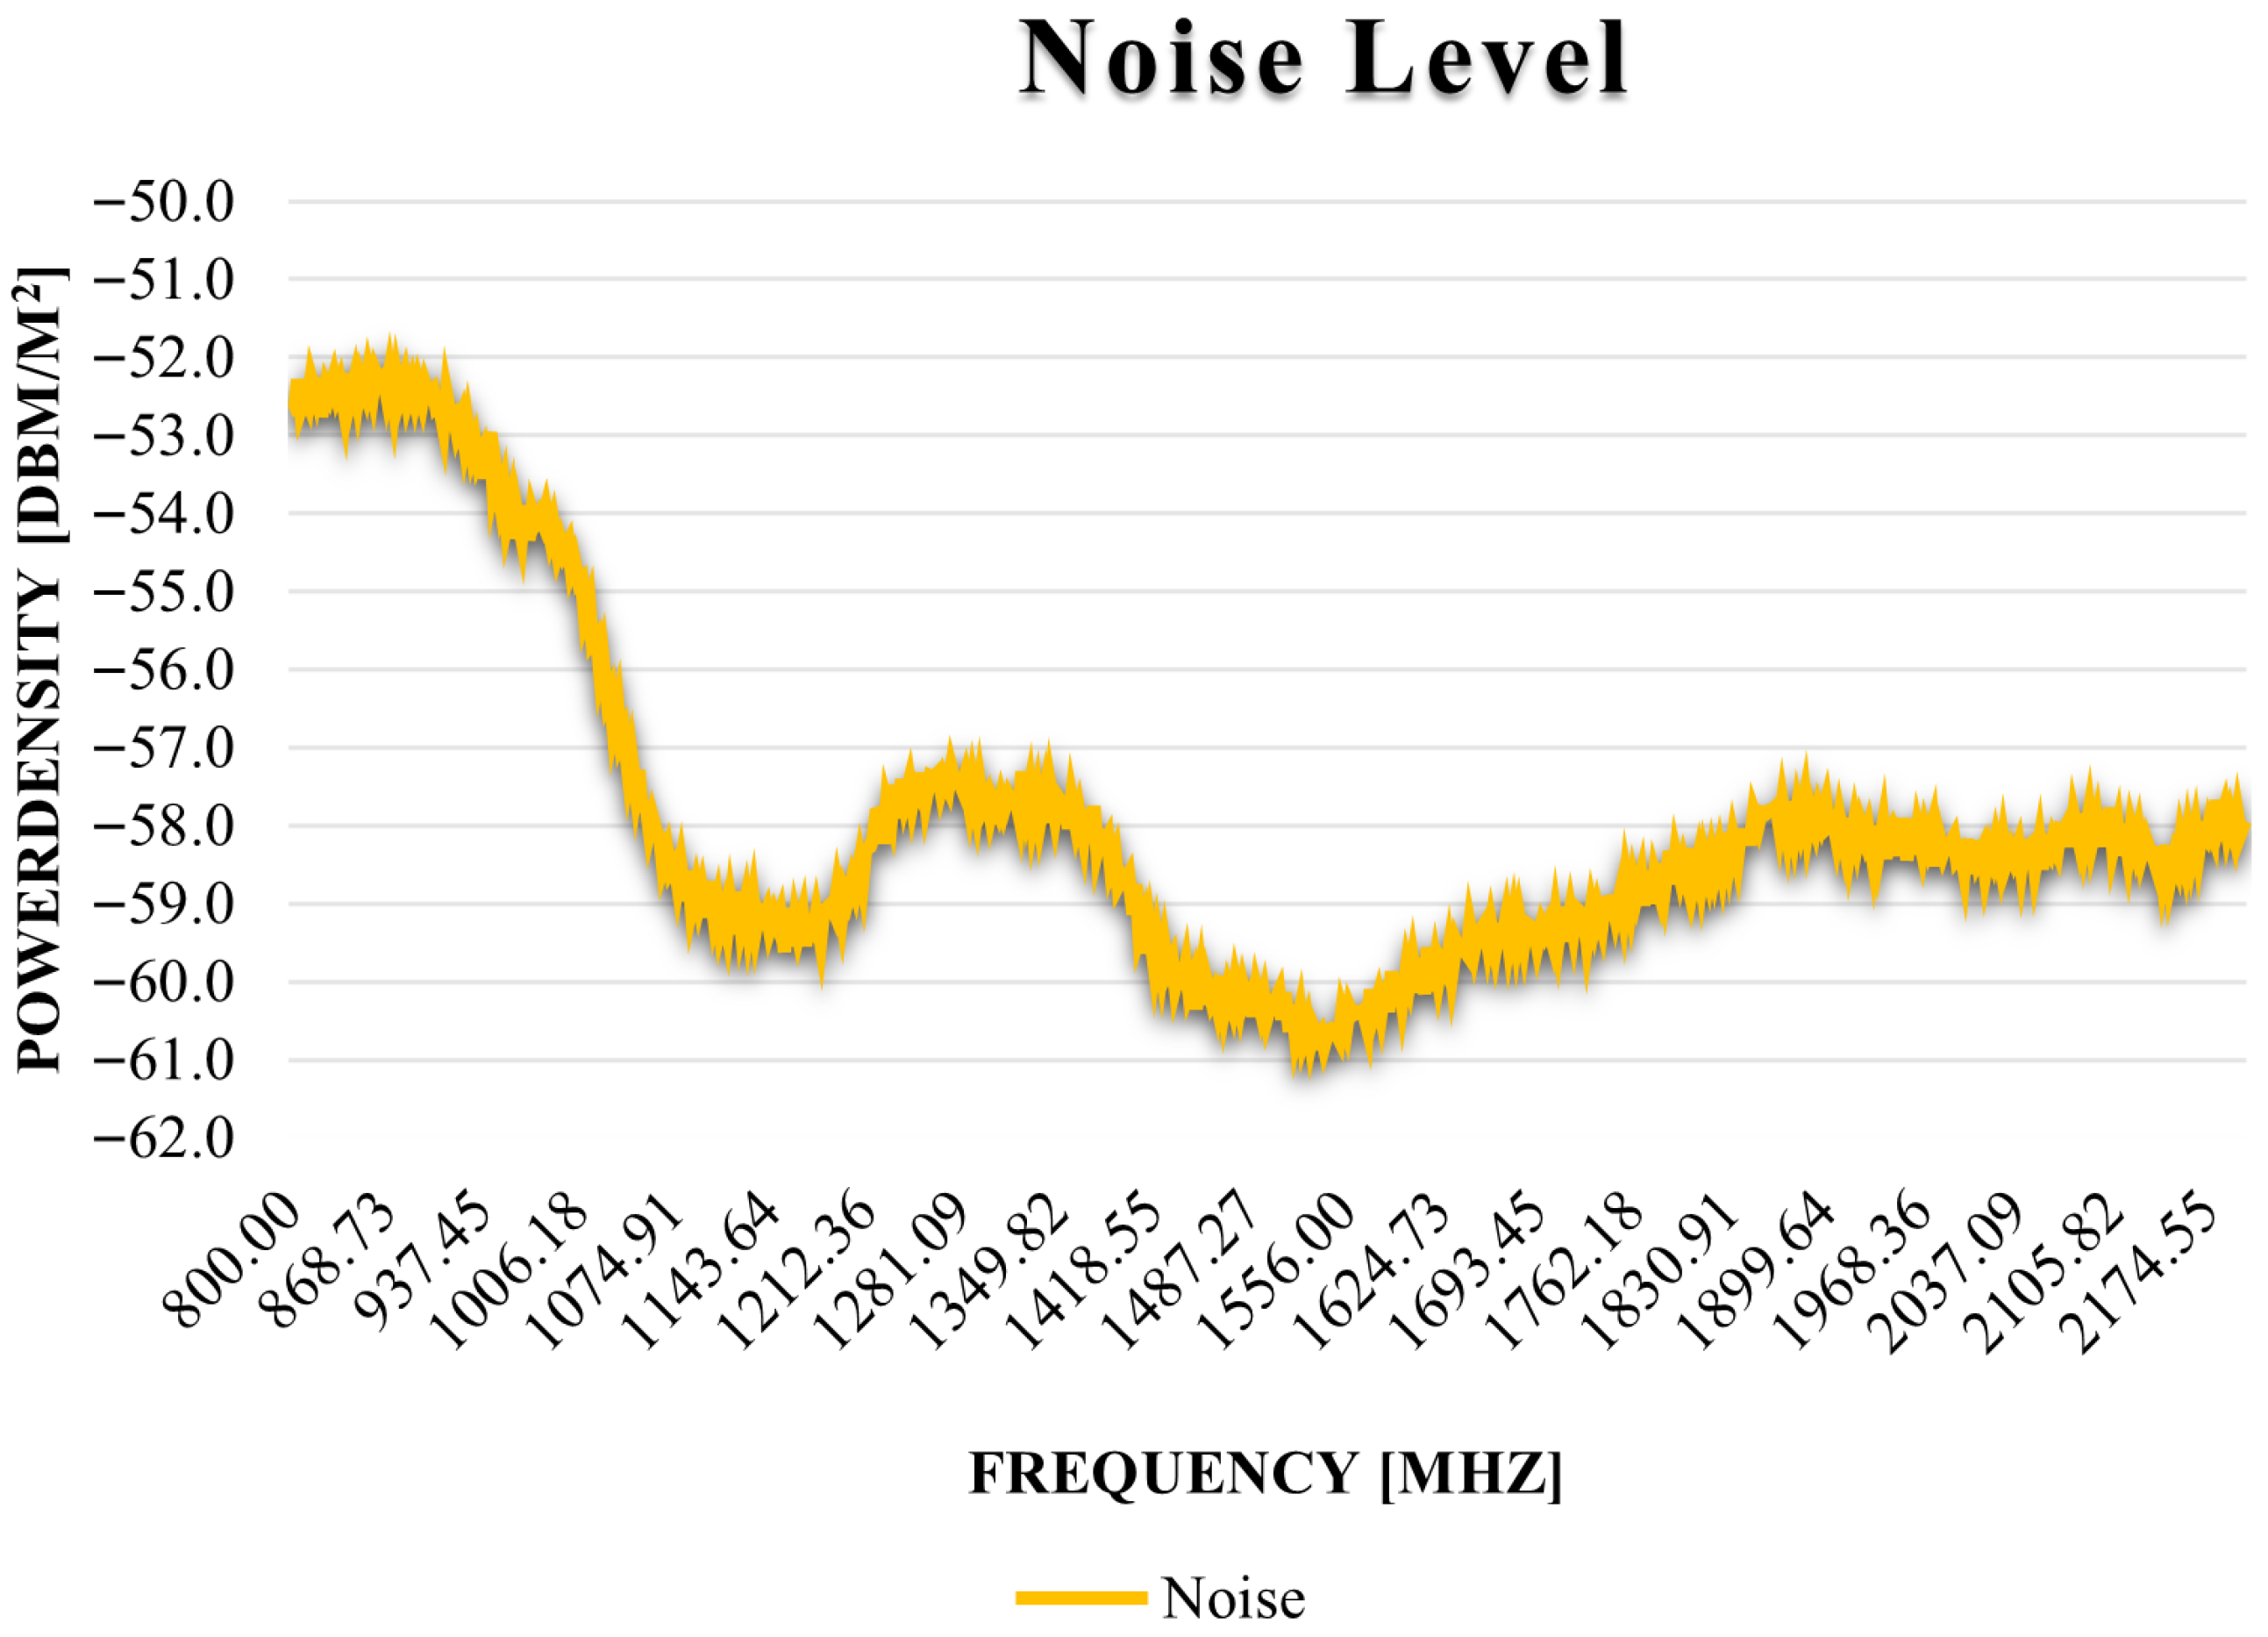
The investigation begins with a noise level measurement, performed using the Anritsu spectrum analyzer and the isotropic antenna over the frequency range closely related to the later measurements, i.e., 800 MHz to 2200 MHz, using the same analyzer configurations intended for the main tests. This allows for the immediate identification of spectral noise originating from external devices and characterization of the system’s own noise. Following this, test measurements are carried out in the highest (Band 1) and lowest (Band 20) of the selected mobile communication bands using the base station simulator, to ensure that the measurement setup is suitable for establishing a stable connection between the UE and the base station.
Next, test measurements are conducted using the base station simulator on the highest (Band 1) and lowest (Band 20) mobile communication bands under investigation to ensure that the measurement setup supports stable link establishment between the UE and the base station. After confirming this, the actual tests commence. Using the previously described instrument configuration, electromagnetic power density measurements are performed in the downlink direction on the predetermined frequency bands and channels, under both SISO and MIMO operating modes.Table 6 summarizes parameters used for SISO and MIMO power density measurements.
The power density measurements are carried out using the EMF measurement option of the spectrum analyzer. During the measurements, the stability of the connection is monitored via the BLER (Block Error Rate) values in the RX Measurement window of the base station simulator to ensure that the link remains active throughout the entire process.

3.4.2. Capacity-Based Electromagnetic Exposure Measurement Method

Following the power density measurements, capacity- and degradation-based electromagnetic exposure tests were conducted. In these tests, the base station cell parameters—such as RS ERPE and RSSI (Received Signal Strength Indicator)—were progressively degraded until the downlink data rate dropped below the 25 Mbps threshold required for 4K video streaming [45].
During the procedure, the BLER value was monitored in the RX Measurement window. As the BLER increased, the modulation and coding rate were reduced accordingly. The BLER is influenced not only by channel conditions but also by the signal-to-interference-plus-noise ratio and the modulation scheme: higher-order modulation transmits more data bits per resource element, but it requires a cleaner channel and higher SINR. Poor radio channel quality can lead to data corruption and necessitate retransmissions between the transmitter and receiver. These retransmissions reduce physical layer throughput and increase communication latency [46].
According to 3GPP standards, the UE monitors various reference signals (e.g., SSB—Synchronization Signal Block; CSI-RS—Channel State Information Reference Signal) and the BLER level to determine the decodability of the PDCCH, the physical downlink control channel. If the BLER exceeds 10%, the downlink connection is considered unreliable. At or above this level, the UE reports an “out of sync” state, which signals an increased risk of connection loss [41,47]. Therefore, a BLER value of 15% was used in these measurements as the threshold for cell edge conditions, indicating a significant drop from the maximum achievable data rate.
The RS EPRE parameter was gradually reduced to lower the power per resource block, and thus the total transmission power over the full bandwidth. This value depends on bandwidth, numerology, and channel combinations [41].
The measurements were conducted mainly on Band 1 (2100 MHz), channel 300, using various bandwidth settings. Tests were first performed in SISO mode and then repeated using a 2 × 2 MIMO configuration. This allowed for detailed evaluation of the minimum transmission power required to sustain a 4K video stream at various capacity configurations and frequency settings. From this, the potential reduction in electromagnetic exposure when serving average users on lower frequency bands could also be estimated.

4. Measurement Results

4.1. Noise Power Measurement Result

The measurements began with a noise power evaluation to verify that the measurement environment was free from external noise sources. The result of the wideband, frequency-selective noise level measurement is shown in Figure 3, from which it can be concluded that the noise is not spectral in nature. Therefore, the observed noise levels originate from the instruments used and not from external sources.

4.2. Results of SISO and MIMO Electromagnetic Exposure Measurements

The base station simulator and the spectrum analyzer were configured as previously described. Following the measurements, the data from the spectrum analyzer were processed using Anritsu Master Software (Version 1.18) and Python (Version 3.12). For analysis, the maximum value of Trace C recorded over the entire measurement period was used. The results most relevant to the study are highlighted below.

4.2.1. Band 20—Channel 6350

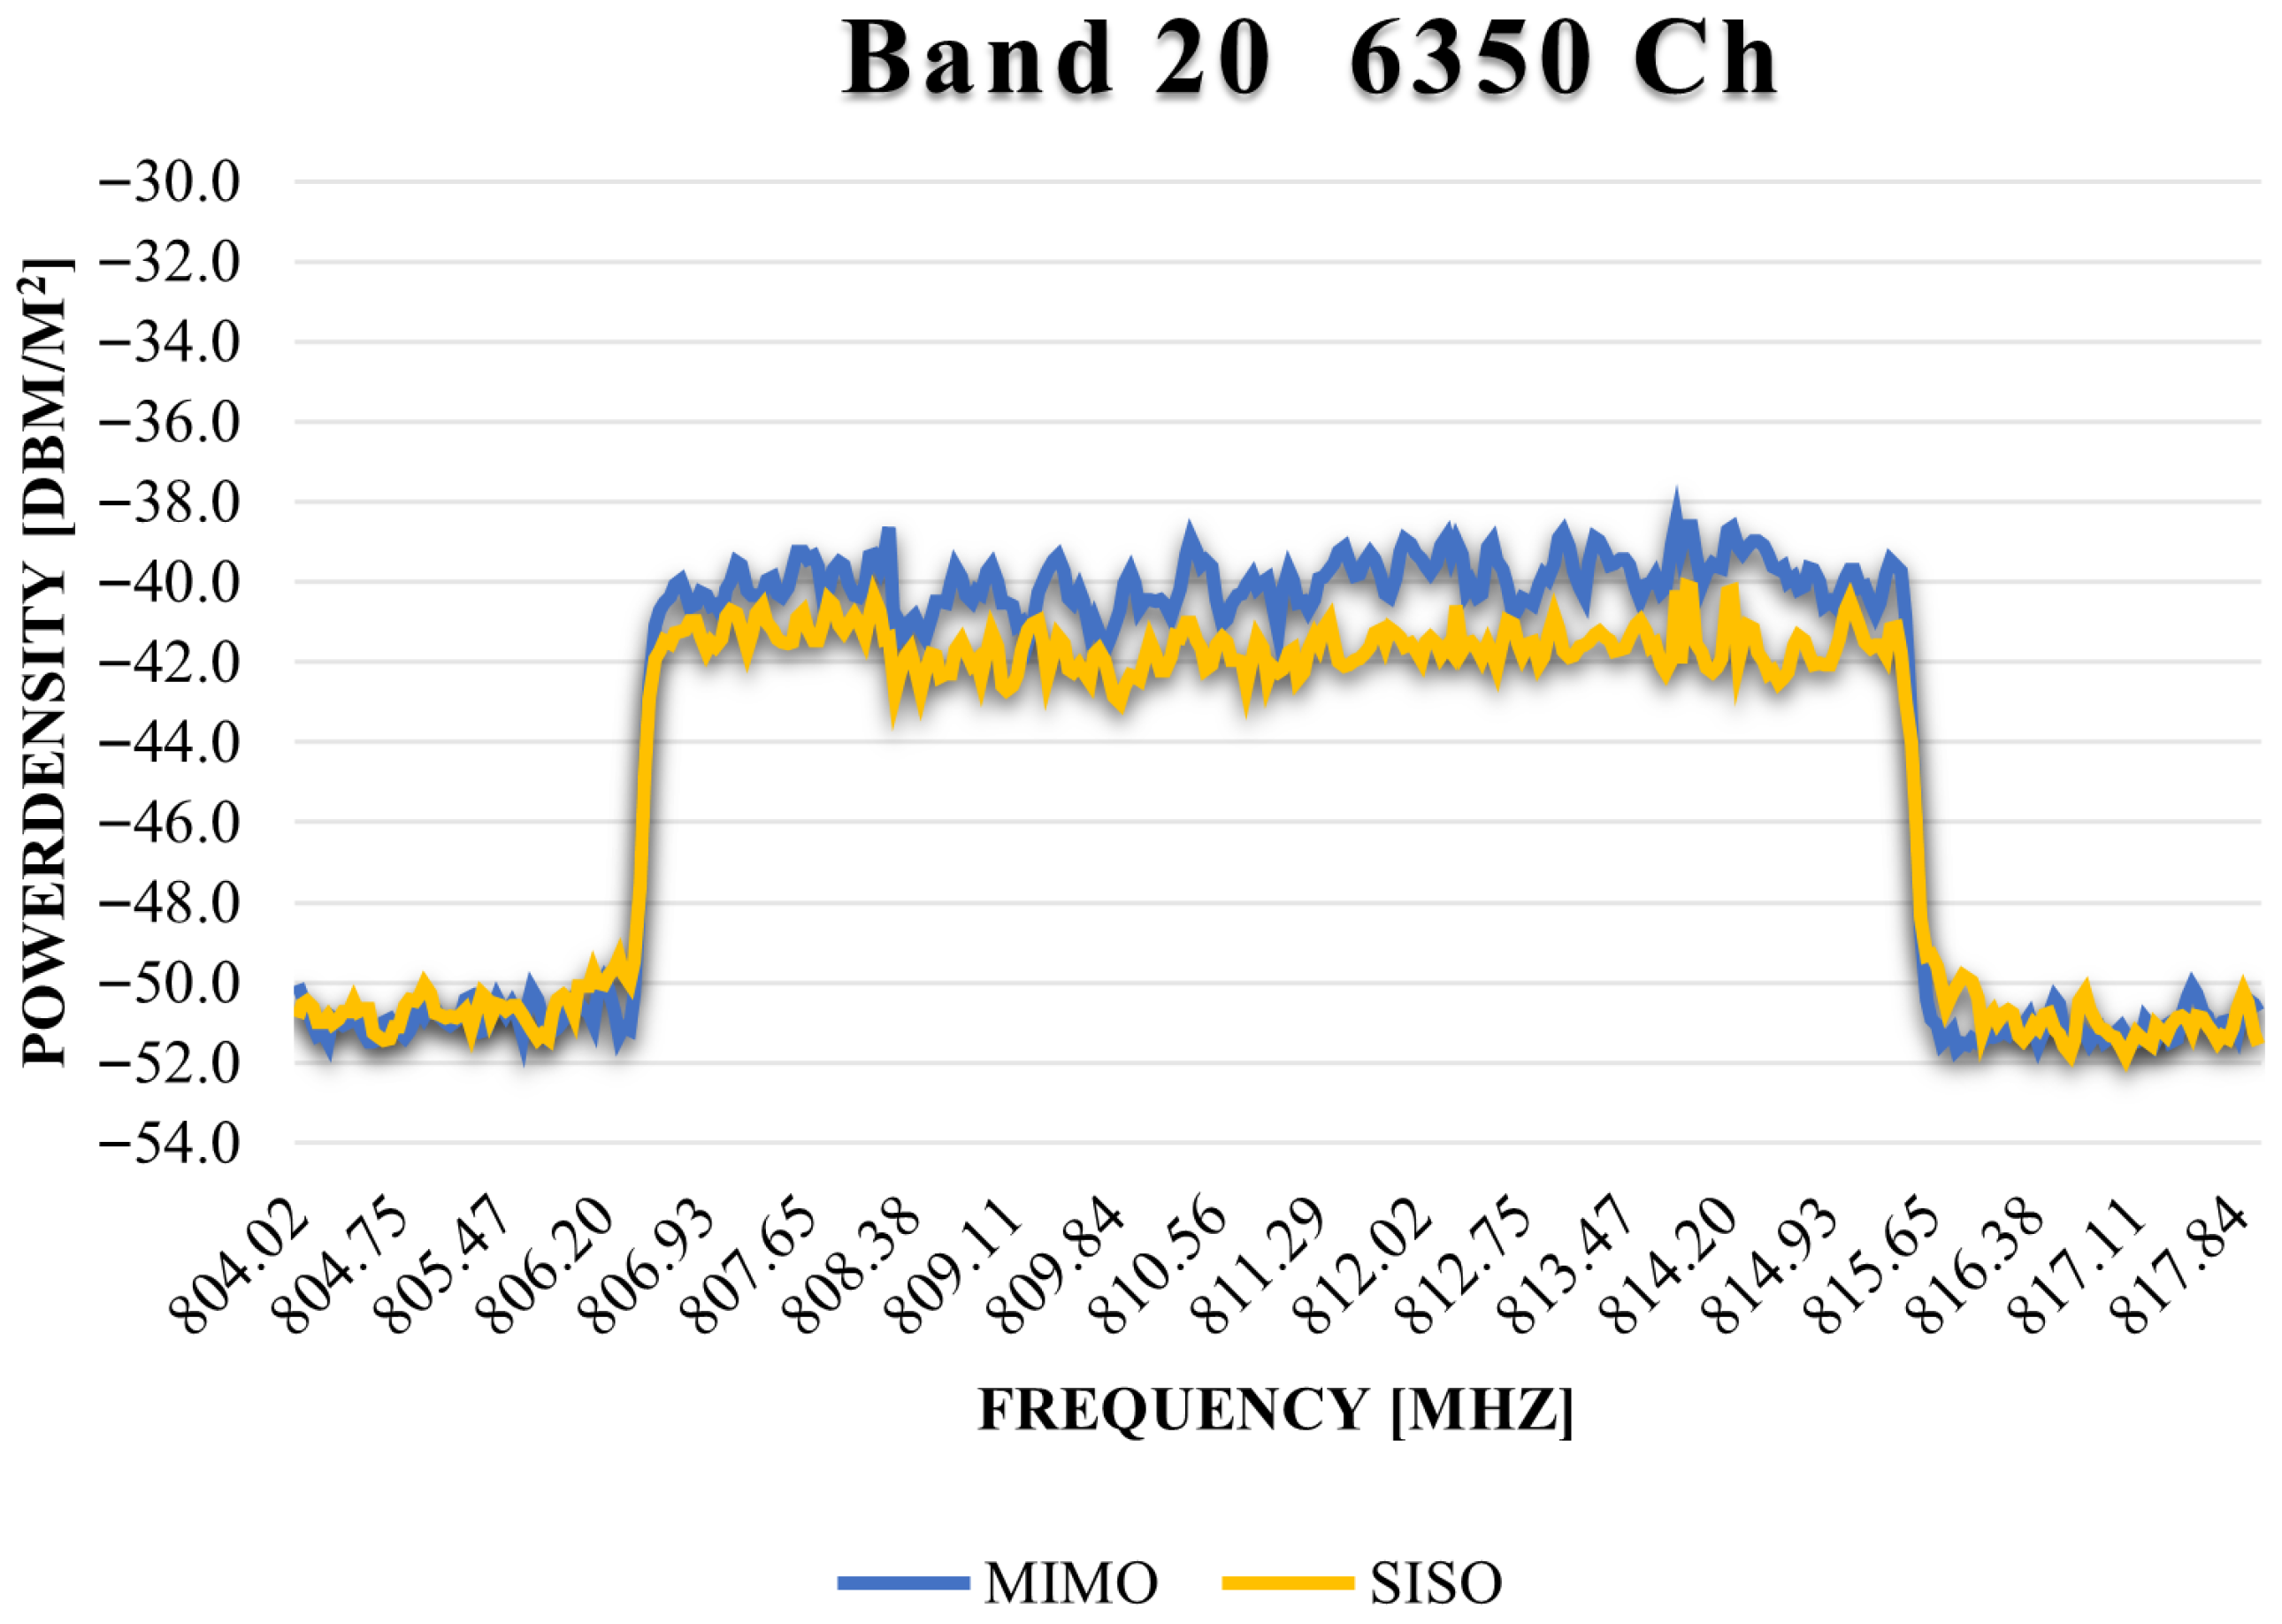
Electromagnetic power density measurements in MIMO and SISO modes on Band 20, channel 6350, resulted in the comparative graph shown in Figure 4.

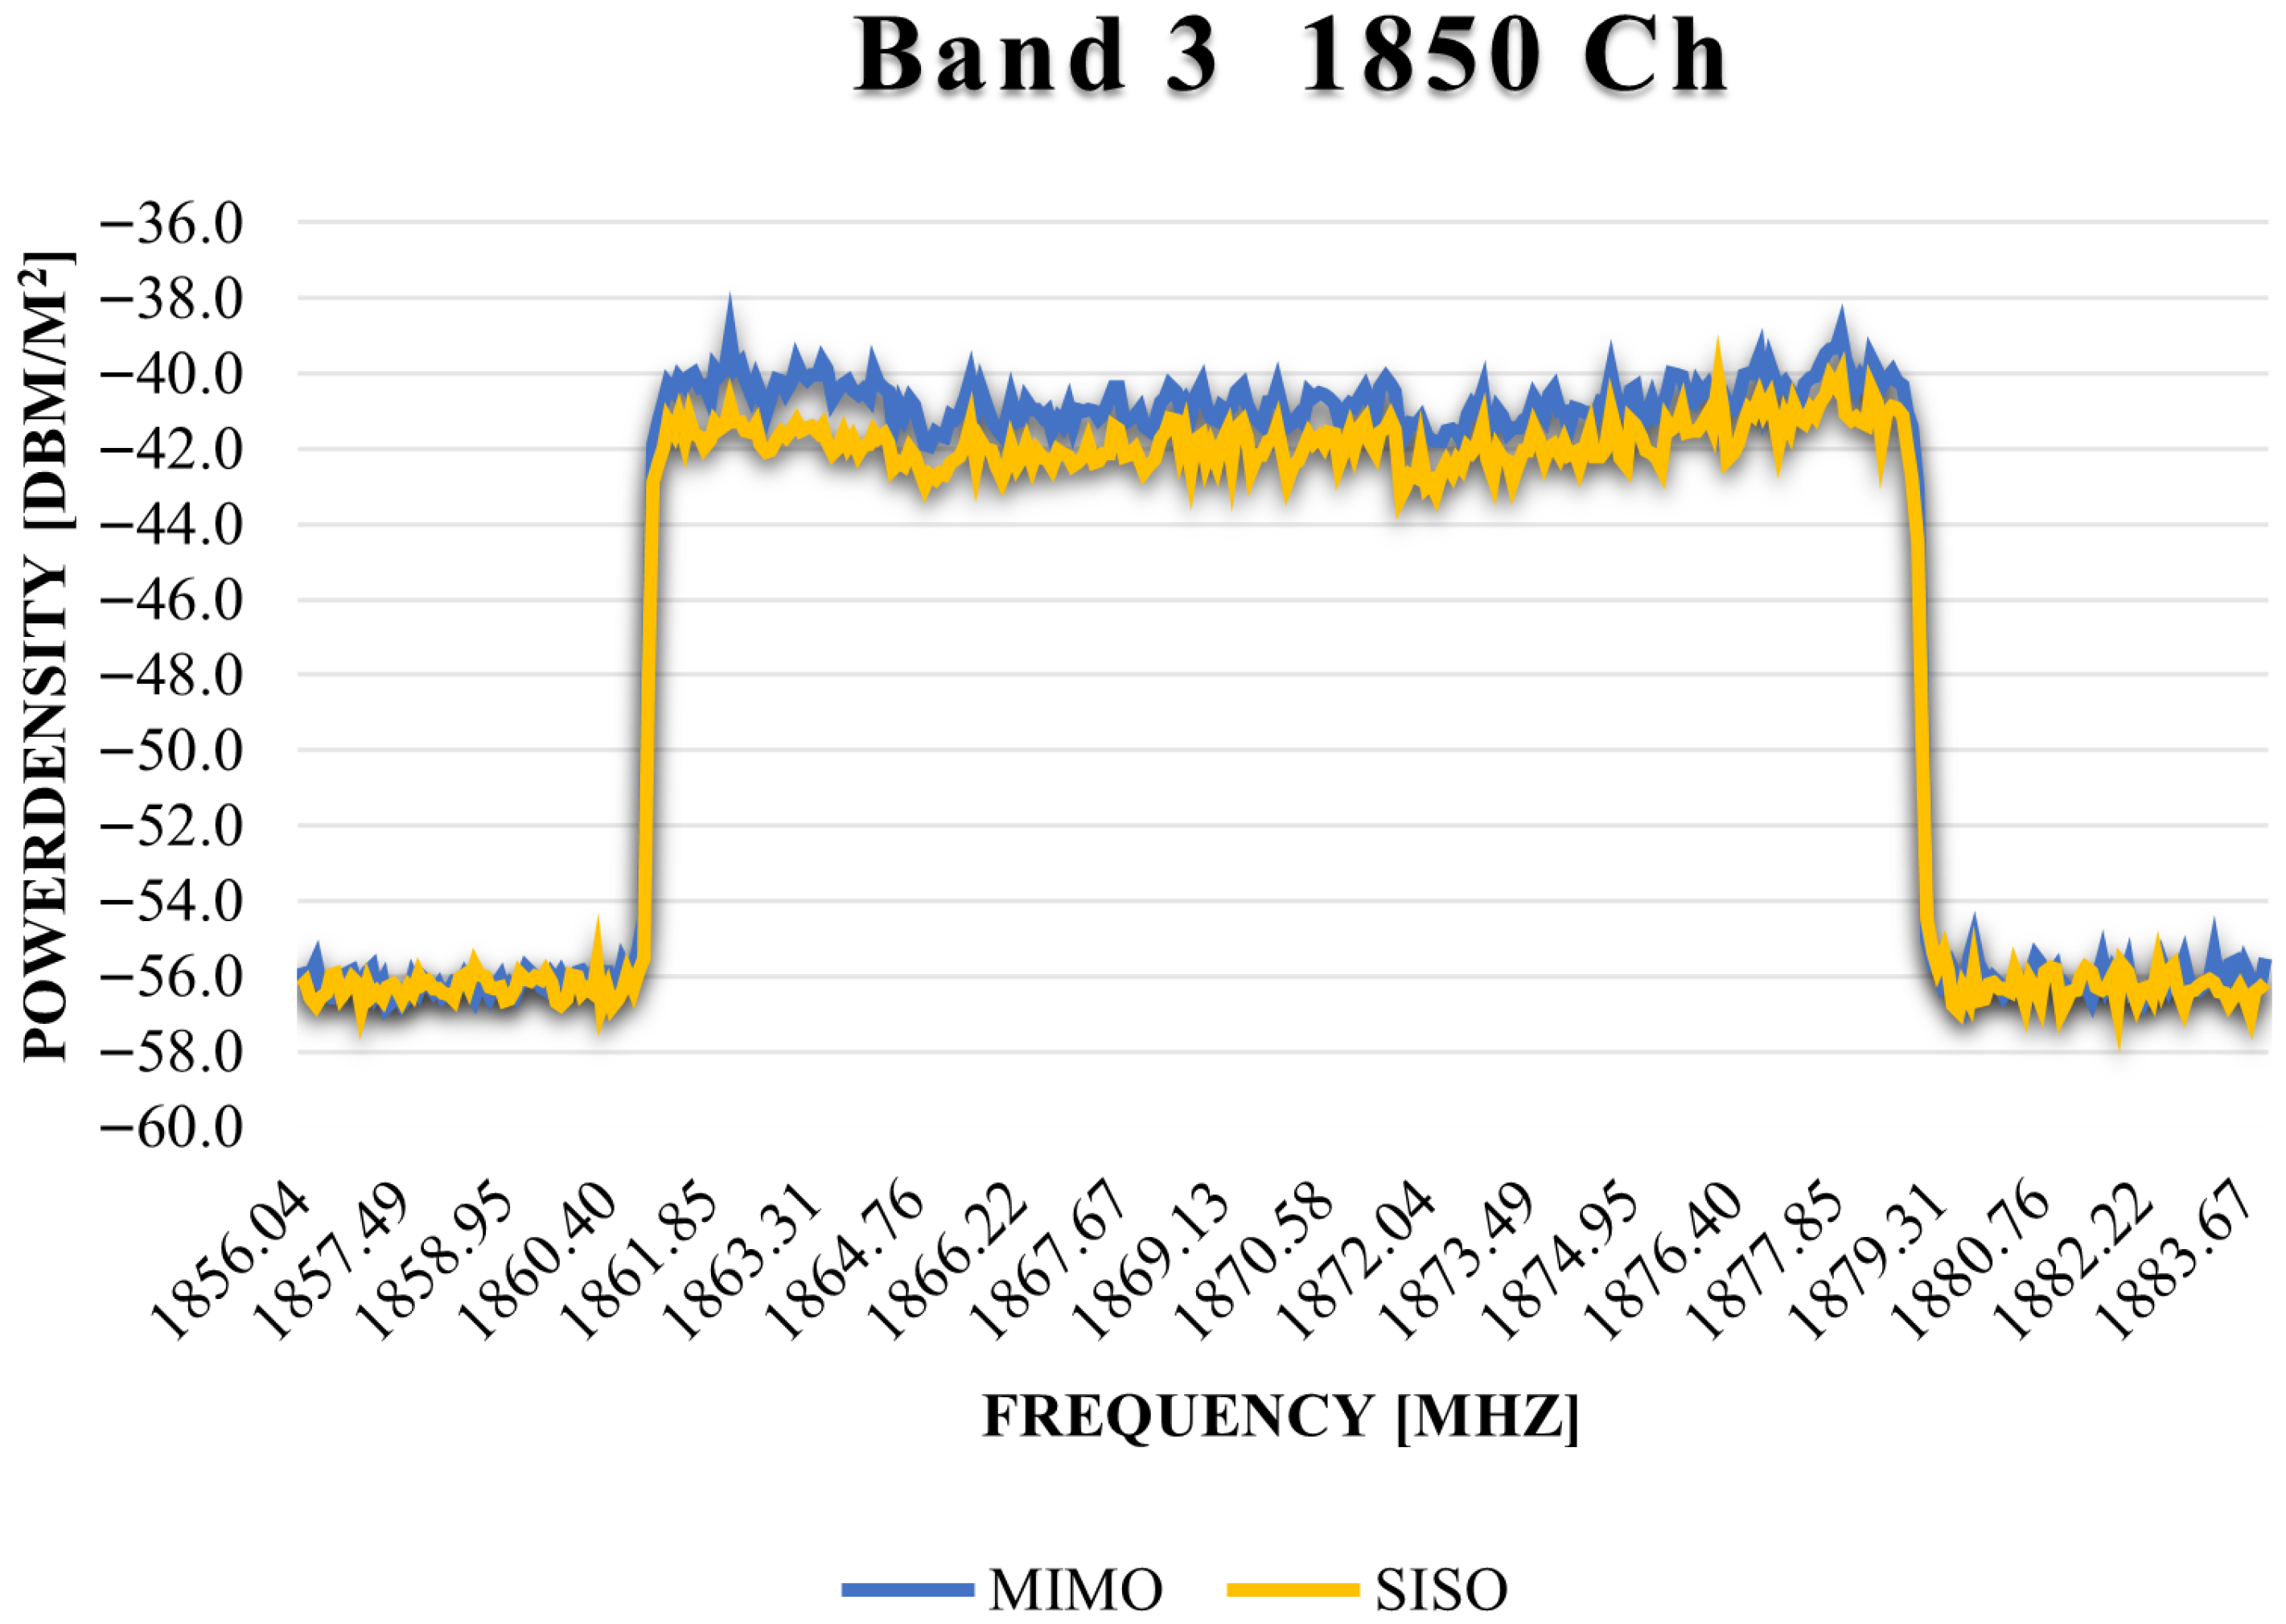
4.2.2. Band 3—Channel 1850

Figure 5 shows the comparison of power density values for MIMO and SISO modes on Band 3, channel 1850.

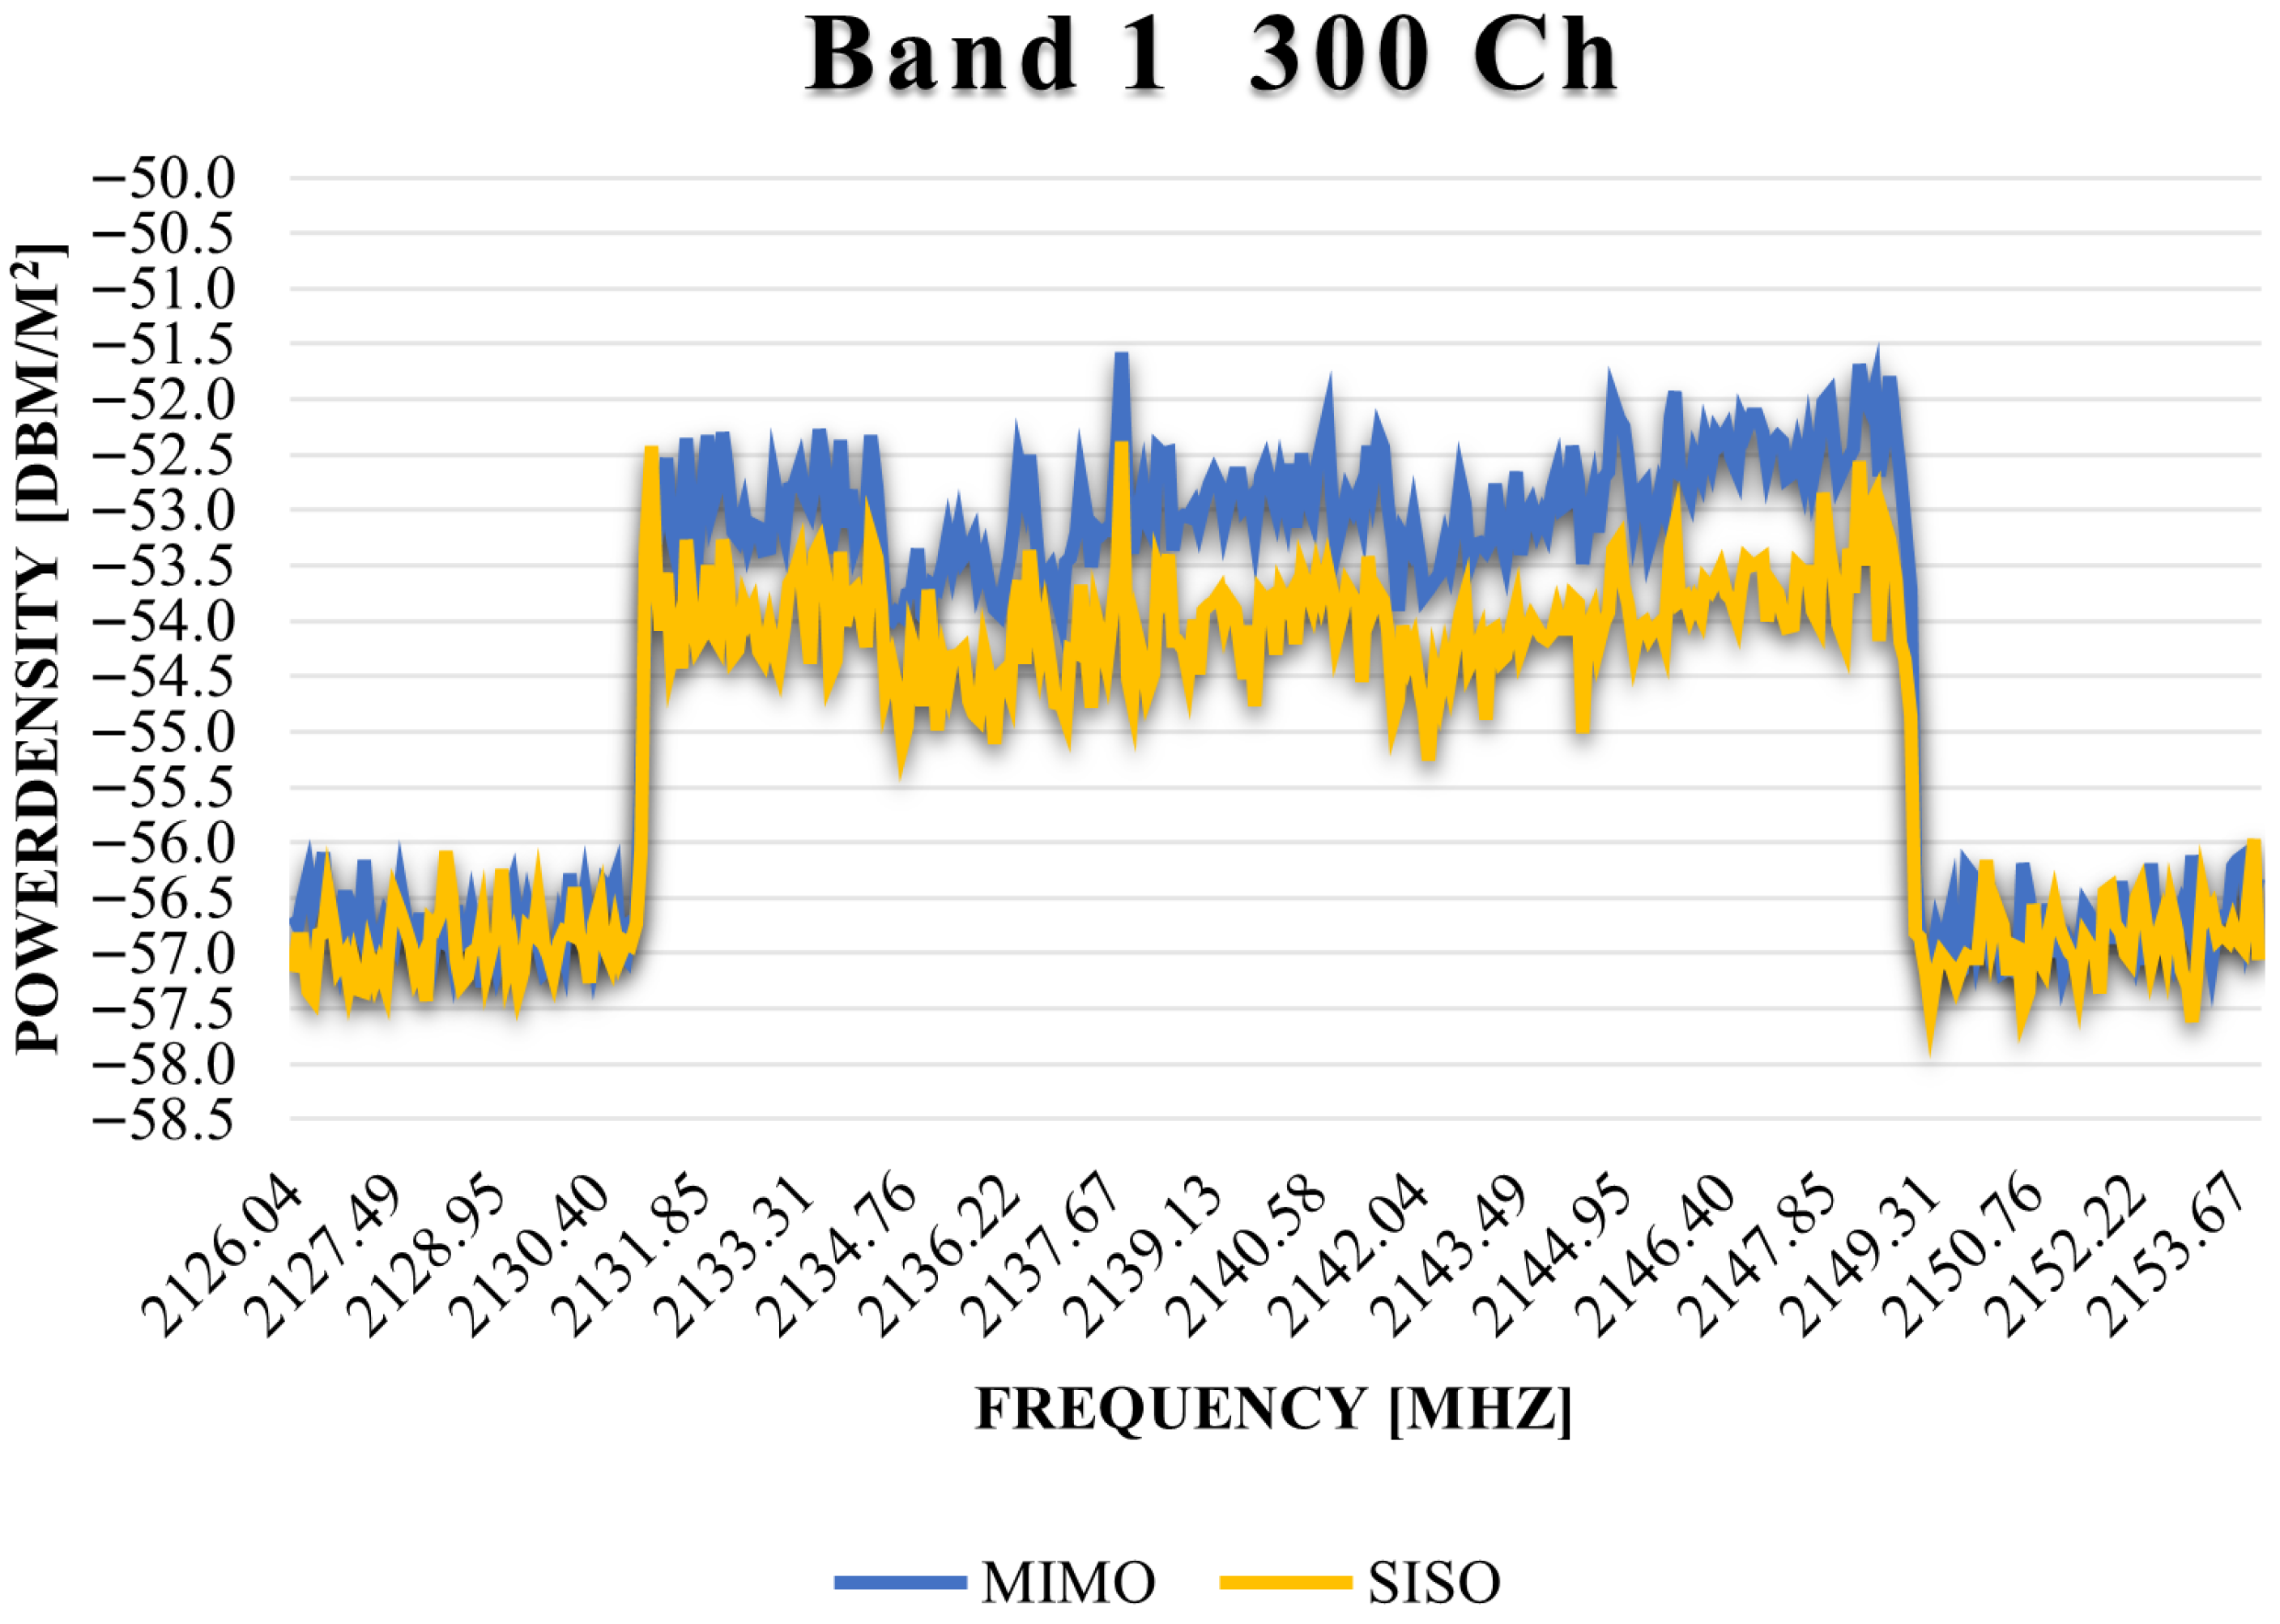
4.2.3. Band 1—Channel 300

Electromagnetic power density results for Band 1, channel 300, with a Full Cell Bandwidth Power (FCBP) of 75.0 dBm, are shown in Figure 6. An additional measurement at 85.2 dBm FCBP is shown in Figure 7.

4.2.4. Summary of Power Density Measurement Results

The results of the various configurations presented above show that the power density values measured in SISO and MIMO modes are nearly identical, as summarized in Table 7. Based on the average difference values, it can be stated that the use of MIMO technology does not cause a significant increase in power density. The differences between the absolute maximum deviation and the average deviation values highlight that the measurement setup is less efficient in the low mobile band; however, even in this case, the results remain within the expected measurement uncertainty under laboratory conditions.This deviation is partly due to the lower operational frequency limit of the transmitting and receiving antennas being close to the lower edge of the Band 20 spectrum and 10 MHz bandwidth.

4.3. Capacity-Based Coverage Measurement Results

Initially, measurements were performed using high RS ERPE, modulation, and coding rate values appropriate for close-to-base-station conditions. These values ensured stable connectivity and sufficient capacity in both SISO and 2 × 2 MIMO configurations. As transmission power was reduced and parameters were varied, the results summarized in Table 8 and Table 9 were recorded.
In the initial phase of the study, we reached a point where SISO could no longer maintain the 25 Mbps throughput required for 4K streaming, and connection stability was low. In the next phase, we determined the minimum transmission power at which 2 × 2 MIMO also became insufficient in terms of capacity and stability.
Comparing the minimum RS EPRE values of the SISO and MIMO tests, it can be concluded that if maximizing coverage is not the primary objective, the necessary user experience can be ensured using 9.9 dB lower transmission power in Band 1 at 20 MHz bandwidth. When operating in a lower frequency band, this requirement further decreases. For instance, a 4 × 4 MIMO connection on Band 20 at 10 MHz bandwidth can still ensure sufficient throughput while requiring 8.428 dB less power—compared to the previous case—due to lower free-space path loss at the same distance.
While the 20 MHz bandwidth was primarily used, additional tests at 10 and 5 MHz were also performed. In each case, the emitted power—and hence user exposure—decreased. However, maintaining the required throughput at these lower bandwidths necessitates the use of 4 × 4 MIMO, which in turn demands stricter radio channel conditions. Therefore, a higher transmit power is needed to ensure connection stability [47].
Finally, it should be noted that the observed 18.328 dB reduction in electromagnetic exposure is valid under laboratory conditions. In real-world scenarios, this benefit may be smaller due to interference and noise effects.

5. Conclusions and Future Work

The measurements performed under laboratory conditions confirmed the objectives previously formulated. The developed examination procedure is capable of characterizing the electromagnetic power density in systems using both SISO and MIMO technologies with adequate detail and quality. However, the nearly 3 dB difference observed between the absolute maximum deviation and the average deviation values in Band 20 highlights that the measurement setup is less efficient in the lowband, yet it still provides values within the bounds of measurement uncertainty.
Based on the results of the SISO and MIMO tests, it can be concluded that MIMO technology does not cause a significant increase in exposure. Compared to the exposure levels of SISO systems, the average human exposure attributable to MIMO systems was only 0.794 dB higher. Therefore, even massive MIMO technology—which serves multiple users across higher layer counts—does not inherently lead to increased electromagnetic power density at the individual level. When a specific beam is directed to a given device, the resulting exposure is equivalent.
The developed methodology has demonstrated that cellular networks employing MIMO technology can provide the same coverage and user capacity at lower electromagnetic power density levels. This power reduction can be further enhanced by deploying low-frequency cells. The results indicate that the emergence and use of lowband massive antenna systems can significantly reduce human EMF exposure. For example, by applying Band 20 and 4 × 4 MIMO technology, user exposure may be reduced by more than 15 dB. Thanks to per-beam MIMO operation in high-element-count antenna systems, such performance can be maintained across multiple sub-beams at high layer counts—without degradation in quality, even in high-user-density cells.
In the next phase of this research, uplink EMF power density measurements will be conducted to assess the effect of MIMO technology on uplink exposure. This will require a reconfiguration of the current measurement setup. Future investigations will also address beamforming in active antenna systems. Beamforming can produce radiation beams with 8–10 dB higher gain, thereby increasing the received power density. However, a detailed evaluation is essential, as its negative effect is momentary, while over time, it may lead to a reduction in average exposure by improving radio conditions at the receiver side. This, in turn, enhances capacity and reduces the required transmission duration. Subsequently, the methodology will be adapted to assess human exposure impacts resulting from carrier aggregation.

Author Contributions

Conceptualization, methodology, investigation, resources, K.M. and P.P.; software, validation, K.M.; writing—original draft preparation, K.M., P.P. and S.N.; writing—review and editing, K.M., S.N.; visualization, K.M. and S.N.; supervision, P.P. and S.N.; project administration, P.P. All authors have read and agreed to the published version of the manuscript.

Funding

This research received no external funding.

Informed Consent Statement

Not applicable.

Data Availability Statement

The original contributions presented in this study are included in the article. Further inquiries can be directed to the corresponding author.

Acknowledgments

Supported by the EKÖP-24-3-I University Research Fellowship Program of the Ministry for Culture and Innovation from the source of the National Research, Development and Innovation Fund.

Conflicts of Interest

The authors declare no conflicts of interest.

Abbreviations

The following abbreviations are used in this manuscript:
3GPPThird-Generation Partnership Project
5GFifth Generation of Wireless Cellular Technology
BLERBlock Error Rate
CCComponent Carrier
CSI-RSChannel State Information Reference Signal
DCIDownlink Control Information
DLDownlink
EMFElectromagnetic Field
eNodeBevolved Node B
FCBPFull Cell Bandwidth Power
ICNIRPInternational Commission on Non-Ionizing Radiation Protection
LTELong Term Evolution
Massive MIMOMassive Multiple Input Multiple Output
MIMOMultiple Input Multiple Output
OLOpen-loop
PCCPrimary Component Carrier
PDCCHPhysical Downlink Control Channel
QAMQuadrature Amplitude Modulation
QPSKQuadrature Phase Shift Keying
REResource Element
RS EPRE            Reference Signals Energy Per Resource Element
RSRPReference Signal Received Power
RSSIReceived Signal Strength Indicator
RXReceive
SINRSignal-to-Interference-plus-Noise Ratio
SISOSingle Input Single Output
SSBSynchronization Signal Block
TSTechnical Specification
UEUser Equipment
ULUplink

References

  1. You, X.; Wang, D.; Zhu, P.; Sheng, B. Cell edge performance of cellular mobile systems. IEEE J. Sel. Areas Commun. 2011, 29, 1139–1150. [Google Scholar] [CrossRef]
  2. Li, X.; He, C.; Zhang, J. Spectral efficiency and energy efficiency of bidirectional distributed antenna systems with user centric virtual cells. IEEE Access 2018, 6, 49886–49895. [Google Scholar] [CrossRef]
  3. Molisch, A.F. Wireless Communications: Second Edition; Wiley-IEEE Press: Chichester, UK, 2011. [Google Scholar]
  4. Andrews, J.G.; Buzzi, S.; Choi, W.; Hanly, S.V.; Lozano, A.; Soong, A.C.; Zhang, J.C. What will 5G be? IEEE J. Sel. Areas Commun. 2014, 32, 1065–1082. [Google Scholar] [CrossRef]
  5. Chih-Lin, I.; Rowell, C.; Han, S.; Xu, Z.; Li, G.; Pan, Z. Toward green and soft: A 5G perspective. IEEE Commun. Mag. 2014, 52, 66–73. [Google Scholar] [CrossRef]
  6. Björnson, E.; Hoydis, J.; Sanguinetti, L. Massive MIMO networks: Spectral, energy, and hardware efficiency. Found. Trends® Signal Process. 2017, 11, 154–655. [Google Scholar] [CrossRef]
  7. Hassan, N.; Fernando, X. Massive MIMO wireless networks: An overview. Electronics 2017, 6, 63. [Google Scholar] [CrossRef]
  8. Larsson, E.G. Fundamentals of Massive MIMO; Cambridge University Press: Cambridge, UK, 2015. [Google Scholar] [CrossRef]
  9. Zeng, S.; Di, B.; Zhang, H.; Gao, J.; Yue, S.; Hu, X.; Fu, R.; Zhou, J.; Liu, X.; Zhang, H.; et al. RIS-Based IMT-2030 Testbed for MmWave Multi-Stream Ultra-Massive MIMO Communications. IEEE Wirel. Commun. 2024, 31, 375–382. [Google Scholar] [CrossRef]
  10. el Mrini, M.; Mchbal, A.; Touhami, N. Design of a 240 elements antenna system for 5G massive MIMO applications with an inclined beam and two operating modes. J. Electromagn. Waves Appl. 2024, 38, 1796–1810. [Google Scholar] [CrossRef]
  11. Huawei Technologies Co., Ltd. Huawei Launches Industry’s First FDD Tri-Band Massive MIMO; Huawei Technologies Co., Ltd.: Shenzhen, China, 2025. [Google Scholar]
  12. Abdalmalak, K.A.; Yousfi, A.E.; Vargas, D.S. Massive MIMO Antenna Arrays for Low-Frequency Bands. In Innovation in MIMO Systems [Working Title]; IntechOpen: London, UK, 2024. [Google Scholar] [CrossRef]
  13. Bogale, T.E.; Le, L.B. Massive MIMO and mmWave for 5G Wireless HetNet: Potential Benefits and Challenges. IEEE Veh. Technol. Mag. 2016, 11, 64–75. [Google Scholar] [CrossRef]
  14. Wang, H.; Xu, L.; Yan, Z.; Gulliver, T.A. Low-Complexity MIMO-FBMC Sparse Channel Parameter Estimation for Industrial Big Data Communications. IEEE Trans. Ind. Inform. 2021, 17, 3422–3430. [Google Scholar] [CrossRef]
  15. Pu, X.; Sun, Z.; Chen, Q.; Jin, S. Low-Complex Channel Estimation in Extra-Large Scale MIMO with the Spherical Wave Properties. Phys. Commun. 2023, 61, 102208. [Google Scholar] [CrossRef]
  16. Chen, A.; Xu, W.; Lu, L.; Wang, Y.; Wang, X.; Chau, Y.; He, M. Sparsity-Based Channel Estimation Exploiting Deep Unrolling for Downlink Massive MIMO. In Proceedings of the IEEE Global Communications Conference (GLOBECOM), Kuala Lumpur, Malaysia, 4–8 December 2023; pp. 1507–1512. [Google Scholar] [CrossRef]
  17. Li, W.; Lin, Z.; Guo, Q.; Vucetic, B. Exploiting Structured Sparsity with Low Complexity Sparse Bayesian Learning for RIS-assisted MIMO mmWave Channel Estimation. IEEE Trans. Veh. Technol. 2023, 73, 6752–6764. [Google Scholar] [CrossRef]
  18. Expósito, I.; Hakizimali, C.; Sánchez, M.G.; Cuiñas, I.; Verhaevert, J. Human exposure to EMF from 5G base stations: Analysis, evaluation and comparison of different assessment methods. Measurement 2024, 229, 114434. [Google Scholar] [CrossRef]
  19. Korkmaz, E.; Aerts, S.; Coesoij, R.; Bhatt, C.R.; Velghe, M.; Colussi, L.; Land, D.; Petroulakis, N.; Spirito, M.; Bolte, J. A comprehensive review of 5G NR RF-EMF exposure assessment technologies: Fundamentals, advancements, challenges, niches, and implications. Environ. Res. 2024, 260, 119524. [Google Scholar] [CrossRef]
  20. ETSI TS 136 104 V14.3.0; Evolved Universal Terrestrial Radio Access (E-UTRA), Base Station (BS) Radio Transmission and Reception. European Telecommunications Standards Institute: Sophia Antipolis, France, 2017.
  21. Ziegelberger, G. ICNIRP statement on the “guidelines for limiting exposure to time-varying electric, magnetic, and electromagnetic fields (UP to 300 GHz)”. Health Phys. 2009, 97, 257–258. [Google Scholar] [CrossRef]
  22. Ziegelberger, G.; Croft, R.; Feychting, M.; Green, A.C.; Hirata, A.; d’Inzeo, G.; Jokela, K.; Loughran, S.; Marino, C.; Miller, S.; et al. Guidelines for Limiting Exposure to Electromagnetic Fields (100 kHz to 300 GHz). Health Phys. 2020, 118, 483–524. [Google Scholar] [CrossRef]
  23. ETSI TS 138 306 V16.3.0; User Equipment (UE) Radio Access Capabilities (Release 16). European Telecommunications Standards Institute: Sophia Antipolis, France, 2021.
  24. Velghe, M.; Aerts, S.; Martens, L.; Joseph, W.; Thielens, A. Protocol for personal RF-EMF exposure measurement studies in 5th generation telecommunication networks. Environ. Health 2021, 20, 36. [Google Scholar] [CrossRef]
  25. Borges, D.; Montezuma, P.; Dinis, R.; Beko, M. Massive MIMO techniques for 5G and beyond—Opportunities and challenges. Electronics 2021, 10, 1667. [Google Scholar] [CrossRef]
  26. Ibrahim, S.K.; Singh, M.J.; Al-Bawri, S.S.; Ibrahim, H.H.; Islam, M.T.; Islam, M.S.; Alzamil, A.; Abdulkawi, W.M. Design, Challenges and Developments for 5G Massive MIMO Antenna Systems at Sub 6-GHz Band: A Review. Nanomaterials 2023, 13, 520. [Google Scholar] [CrossRef]
  27. Giordani, M.; Polese, M.; Roy, A.; Castor, D.; Zorzi, M. A tutorial on beam management for 3GPP NR at mmWave frequencies. IEEE Commun. Surv. Tutor. 2019, 21, 173–196. [Google Scholar] [CrossRef]
  28. Rappaport, T.S.; Xing, Y.; MacCartney, G.R.; Molisch, A.F.; Mellios, E.; Zhang, J. Overview of Millimeter Wave Communications for Fifth-Generation (5G) Wireless Networks-With a Focus on Propagation Models. IEEE Trans. Antennas Propag. 2017, 65, 6213–6230. [Google Scholar] [CrossRef]
  29. Petzold, J.; Magdowski, M.; Vick, R. Investigation of the Impact of Height Scans in Fully Anechoic Rooms on Detection of Maximal Radiated Field Strength Using Monte Carlo Simulation. In Proceedings of the IEEE International Symposium on Electromagnetic Compatibility, Gothenburg, Sweden, 5–8 September 2022. [Google Scholar] [CrossRef]
  30. 3GPP TR 36.873 V12.7.0; Technical Specification Group; Radio Access Network; Study on 3D Channel Model for LTE (Release 12). 3rd ed. Generation Partnership Project: Sophia Antipolis, France, 2017.
  31. ETS-Lindgren. 3115 Double-Ridged Guide Antenna: Datasheet; ETS-Lindgren: Cedar Park, TX, USA, 2012. [Google Scholar]
  32. ETSI TR 100 028-1 V1.4.1; Electromagnetic Compatibility and Radio Spectrum Matters (ERM), Uncertainties in the Measurement of Mobile Radio Equipment Characteristics; Part 1. European Telecommunications Standards Institute: Sophia Antipolis, France, 2001.
  33. ETSI TR 100 028-2 V1.3.1; Electromagnetic Compatibility and Radio Spectrum Matters (ERM), Uncertainties in the Measurement of Mobile Radio Equipment Characteristics; Part 2. European Telecommunications Standards Institute: Sophia Antipolis, France, 2001.
  34. Rohde and Schwarz. R&S®CMW Wideband Radio Communication Tester Specifications R&S®CMW500, R&S®CMW290, R&S®CMW270; Rohde & Schwarz GmbH & Co. KG: Munich, Germany, 2018. [Google Scholar]
  35. Anritsu. 2000–1791–R Isotropic Antennas Technical Data Sheet; Anritsu Corporation: Kanagawa, Japan, 2024. [Google Scholar]
  36. Anritsu. MS2720T Spectrum Master™ High Performance Handheld Spectrum Analyzer Spectrum Master Technical Data Sheet; Anritsu Corporation: Kanagawa, Japan, 2024; Technical Report. [Google Scholar]
  37. Rohde & Schwarz. R&S CMW500 Wideband Radio Communication Tester: User Manual (Version 3.0.14); Rohde & Schwarz GmbH & Co. KG: Munich, Germany, 2012. [Google Scholar]
  38. Rohde & Schwarz. LTE RF Measurements with the R&S CMW500 According to 3GPP TS 36.521-1 Application Note; Rohde & Schwarz GmbH & Co. KG: Munich, Germany, 2014. [Google Scholar]
  39. Rappaport, T. Wireless Communications, Principles and Practice; Prentice Hall: Upper Saddle River, NJ, USA, 2002. [Google Scholar]
  40. Federal Communications Commission. Samsung Galaxy S21 5G SAR Test Report Part 1 and Antenna Information, FCC ID, A3LSMG991U; HCT Co Ltd.: Icheon, Republic of Korea, 2021. [Google Scholar]
  41. ETSI TS 136 133 V16.7.0; Evolved Universal Terrestrial Radio Access (E-UTRA), Requirements for Support of Radio Resource Management. European Telecommunications Standards Institute: Sophia Antipolis, France, 2020.
  42. Anritsu. Programming Manual Spectrum Master MS2720T High Performance Handheld Spectrum Analyzer; Anritsu Corporation: Kanagawa, Japan, 2023. [Google Scholar]
  43. ETSI EN 301 908-13 V13.2.0; IMT Cellular Networks; Harmonised Standard for Access to Radio Spectrum; Part 13: Evolved Universal Terrestrial Radio Access (E-UTRA) User Equipment (UE). European Telecommunications Standards Institute: Sophia Antipolis, France, 2021.
  44. IEC 62232; Determination of RF Field Strength, Power Density and SAR in the Vicinity of Radiocommunication Base Stations for the Purpose of Evaluating Human Exposure. International Electrotechnical Commission: Geneva, Switzerland, 2022.
  45. Federal Communications Commission. Household Broadband Guide; Federal Communications Commission: Washington, DC, USA, 2022. [Google Scholar]
  46. ETSI TS 136 213 V16.2.0; Evolved Universal Terrestrial Radio Access (E-UTRA), Physical Layer Procedures (Release 16). European Telecommunications Standards Institute: Sophia Antipolis, France, 2020.
  47. ETSI TS 136 214 V14.2.0; Evolved Universal Terrestrial Radio Access (E-UTRA), Physical Layer, Measurements (Release 14). European Telecommunications Standards Institute: Sophia Antipolis, France, 2017.
Figure 1. The test setup top view. The left-hand side of the image contains the emission part of the measurement with the two horn antennas with height h 1 = h 2 = 102.5 cm and the CMW500 base station simulator (outside of the semi-anechoic chamber), while the right-hand side of the image contains the receiver part, with the user equipment (UE) and the Anritsu spectrum analyzer together with its isotropic antenna, on a stage of height h stage = 100 cm .
Telecom 06 00063 g001
Figure 2. Functionality of the External Attenuation setting [37].
Telecom 06 00063 g002
Figure 3. Wideband noise level.
Telecom 06 00063 g003
Figure 4. Power density comparison, Band 20, channel 6350 (MIMO vs. SISO).
Telecom 06 00063 g004
Figure 5. Power density comparison, Band 3, channel 1850 (MIMO vs. SISO).
Telecom 06 00063 g005
Figure 6. Power density comparison, Band 1, channel 300, FCBP = 75.0 dBm (MIMO vs. SISO).
Telecom 06 00063 g006
Figure 7. Power density comparison, Band 1, channel 300, FCBP = 85.2 dBm (MIMO vs. SISO).
Telecom 06 00063 g007
Table 1. The equipment used in the measurements.
NameTypeManufacturer
RF cable (4)NN-30Rosenberg Micro Coax (Rosenberger Hochfrequenztechnik GmbH&Co. KG, Fridolfing, Germany)
Measurement cell phoneGalaxy S21+ 5GSamsung Qualipoc (Rhode&Schwarz GmbH&Co. KG, München, Germany)
Horn antenna (2)Model 3115ETS-Lindgren (ETS-Lindgren, Cedar Park, TX, USA)
Base station simulatorCMW500Rohde&Schwarz (Rhode&Schwarz GmbH&Co. KG, München, Germany)
Spectrum analyzerMS2720TAnritsu (Anritsu Company, Atsugi, Japan)
Isotropic antenna2000-1791-RAnritsu (Anritsu Company, Atsugi, Japan)
Table 2. Measurement uncertainty budget with the contributors [31,34,35,36].
ContributorsAmount [dB]Probability Distribution Function u ( x i ) u ( x i ) 2
Output level uncertainty0.200 k = 1 0.2000.040
Mutual coupling: antenna to image in the ground plane, vertical0.060 k = 2 0.0300.001
Mutual coupling: antennas to images in the absorbing material0.500 k = 2 0.2500.063
Reflectivity of absorbing material: transmitting antenna to the receiving antenna0.740 k = 2 0.3700.137
Random measurement uncertainty0.500 k = 1 0.5000.250
Range length0.000 k = 2 0.0000.000
VSWR = 1.5, 2000-1791-R isotropic tri-axis E-Field sensor0.695Rectangular0.4010.161
Typical 3D isotropy of 2000-1791-R isotropic tri-axis E-Field sensor2.500 k = 2 1.2501.563
Position of the phase center: measuring antenna 10.050Rectangular0.0290.001
Position of the phase center: measuring antenna 20.050Rectangular0.0290.001
Position of the phase center: UE0.050Rectangular0.0290.001
Position of the phase center: measuring antenna of Anritsu0.050Rectangular0.0290.001
Mismatch between CMW500 generator and horn antennas0.237Rectangular0.1370.019
Mismatch between Anritsu spectrum analyzer and isotropic antenna0.738 k = 2 0.3690.136
u c ( y ) i u ( x i ) 2
Combined standard uncertainty k = 1 1.5412.374
Expanded measurement uncertainty k = 2 3.082
Table 3. The parameters that were used for calculating the path loss [31,40].
Band λ [m]D [m] a 0 [dB]Cable Loss [dB]Horn Antenna Gain [dBi]Phone Antenna Gain [dBi]
200.3691.7535.48121.81
30.1601.7542.7372.114.61
10.1401.7543.9092.244.81
Table 4. RSRP values required for stable connection.
BandPath Loss [dB]RS EPRE [dBm]Gain [dB]RSRP [dBm]
2034.681 105.8 60 80.481 (good)
339.247 105.8 60 85.047 (good)
140.349 105.8 60 86.149 (good)
140.349 116.0 60 96.349 (fair)
Table 5. MIMO scenario configuration options.
ScenarioDescription
1CC—1 × 1PCC 1 × 1 DL (SISO)
1CC—n × 2PCC 2 × 2 DL (2 × 2 MIMO)
1CC—n × 4PCC 4 × 4 DL (4 × 4 MIMO)
Table 6. SISO and MIMO power density measurement configurations.
MIMO/SISOBandChannelBandwidth [MHz]DL/ULFCBP [dBm]
SISOBand 20635010DL 78.0
SISOBand 3185020DL 75.0
SISOBand 130020DL 75.0
SISOBand 130020DL 85.2
MIMOBand 20635010DL 78.0
MIMOBand 3185020DL 75.0
MIMOBand 130020DL 75.0
MIMOBand 130020DL 85.2
Table 7. Summary of power density measurements.
BandChannelSISO Avg [dBm/m2]MIMO Avg [dBm/m2]Avg Diff [dB]Max Abs Diff [dB]
206350 44.8411 43.8744 0.96662.9761
31850 46.9367 46.1534 0.78331.9062
1300 49.6333 48.9525 0.68081.4665
1300 55.0432 54.2947 0.74861.5964
Table 8. Capacity test results—SISO.
BandBandwidth [MHz]RS EPRE [dBm]ModulationCode RateBLER [%]Throughput [Mbps]
120 105.80 16QAM130.0025.456
120 116.00 16QAM130.0025.456
120 127.50 16QAM1312.4622.284
Table 9. Capacity test results—2 × 2 MIMO.
BandBandwidth [MHz]RS EPRE [dBm]ModulationCode RateBLER [%]Throughput [Mbps]
120 105.80 64QAM230.00114.215
120 116.00 64QAM180.0078.195
120 130.10 16QAM159.0055.431
120 121.00 16QAM130.0050.720
120 137.40 QPSK714.5520.832
2010 124.00 QPSK90.0015.882
Disclaimer/Publisher’s Note: The statements, opinions and data contained in all publications are solely those of the individual author(s) and contributor(s) and not of MDPI and/or the editor(s). MDPI and/or the editor(s) disclaim responsibility for any injury to people or property resulting from any ideas, methods, instructions or products referred to in the content.